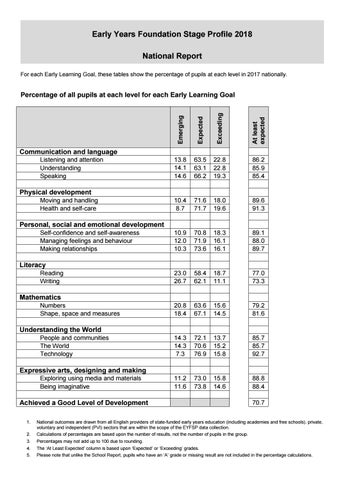
Early Years Foundation Stage Profile 2018 National Report For each Early Learning Goal, these tables show the percentage of pupils at each level in 2017 nationally.
Emerging
Expected
Exceeding
At least expected
Percentage of all pupils at each level for each Early Learning Goal
13.8 14.1 1 14.6
63.5 63.1 66.2
22.8 22.8 19.3
86.2 85.9 85.4
10.4 8.7
71.6 71.7
18.0 19.6
89.6 91.3
10.9 12.0 10.3
70.8 71.9 73.6
18.3 16.1 16.1
89.1 88.0 89.7
23.0 26.7
58.4 62.1
18.7 11.1
77.0 73.3
20.8 18.4
63.6 67.1
15.6 14.5
79.2 81.6
14.3 14.3 7.3
72.1 70.6 76.9
13.7 15.2 15.8
85.7 85.7 92.7
11.2 11.6
73.0 73.8
15.8 14.6
88.8 88.4
Communication and language Listening and attention Understanding Speaking
Physical development Moving and handling Health and self-care
Personal, social and emotional development Self-confidence and self-awareness Managing feelings and behaviour Making relationships
Literacy Reading Writing
Mathematics Numbers Shape, space and measures
Understanding the World People and communities The World Technology
Expressive arts, designing and making Exploring using media and materials Being imaginative
Achieved a Good Level of Development
70.7
1.
National outcomes are drawn from all English providers of state-funded early years education (including academies and free schools), private, voluntary and independent (PVI) sectors that are within the scope of the EYFSP data collection.
2.
Calculations of percentages are based upon the number of results, not the number of pupils in the group.
3.
Percentages may not add up to 100 due to rounding.
4.
The ‘At Least Expected’ column is based upon ‘Expected’ or ‘Exceeding’ grades.
5.
Please note that unlike the School Report, pupils who have an ‘A’ grade or missing result are not included in the percentage calculations.