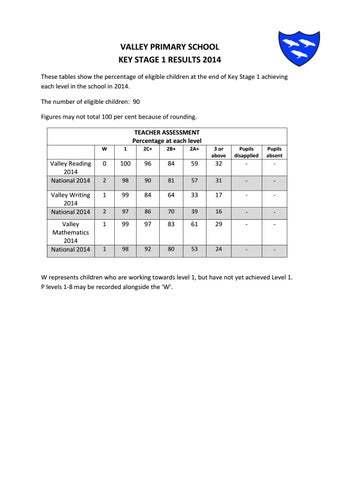
VALLEY PRIMARY SCHOOL KEY STAGE 1 RESULTS 2014 These tables show the percentage of eligible children at the end of Key Stage 1 achieving each level in the school in 2014. The number of eligible children: 90 Figures may not total 100 per cent because of rounding. TEACHER ASSESSMENT Percentage at each level W
1
2C+
2B+
2A+
3 or above
Pupils disapplied
Pupils absent
Valley Reading 2014 National 2014
0
100
96
84
59
32
-
-
2
98
90
81
57
31
-
-
Valley Writing 2014 National 2014
1
99
84
64
33
17
-
-
2
97
86
70
39
16
-
-
Valley Mathematics 2014 National 2014
1
99
97
83
61
29
-
-
1
98
92
80
53
24
-
-
W represents children who are working towards level 1, but have not yet achieved Level 1. P levels 1-8 may be recorded alongside the ‘W’.