DEMOGRAPHICS
Counties at a Glance
DEMOGRAPHICS
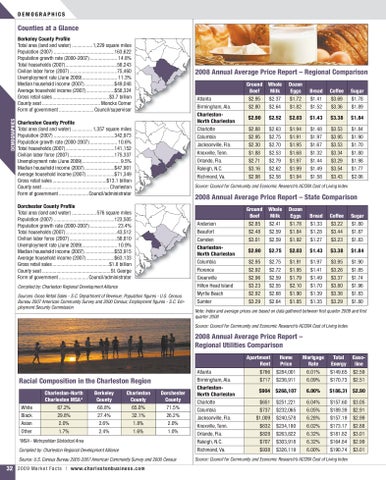
Berkeley County Profile Total area (land and water) ................1,229 square miles Population (2007) ...............................................163,622 Population growth rate (2000-2007) ..................... 14.8% Total households (2007) ........................................58,243 Civilian labor force (2007) .....................................75,460 Unemployment rate (June 2009) ........................... 11.3% Median household income (2007) .......................$49,048 Average household income (2007) ......................$58,324 Gross retail sales ............................................$3.7 billion County seat ............................................. Moncks Corner Form of government ........................... Council/supervisor
2008 Annual Average Price Report – Regional Comparison
Atlanta Birmingham, Ala. CharlestonNorth Charleston Charlotte Columbia Jacksonville, Fla. Knoxville, Tenn. Orlando, Fla. Raleigh, N.C. Richmond, Va.
Charleston County Profile Total area (land and water) ................1,357 square miles Population (2007) ...............................................342,973 Population growth rate (2000-2007) ..................... 10.6% Total households (2007) ......................................141,152 Civilian labor force (2007) ...................................175,337 Unemployment rate (June 2009) ............................. 9.5% Median household income (2007) .......................$47,901 Average household income (2007) ......................$71,349 Gross retail sales ..........................................$13.1 billion County seat .................................................... Charleston Form of government .......................Council/administrator
Ground Beef $2.95 $2.80
Whole Milk $2.37 $2.64
Dozen Eggs $1.72 $1.82
Bread $1.41 $1.52
Coffee $3.69 $3.36
Sugar $1.78 $1.89
$2.90
$2.52
$2.03
$1.43
$3.38
$1.84
$2.88 $2.95 $2.30 $1.88 $2.71 $3.16 $2.98
$2.63 $2.75 $2.70 $2.53 $2.79 $2.62 $2.58
$1.94 $1.91 $1.95 $1.68 $1.97 $1.99 $1.94
$1.48 $1.97 $1.67 $1.32 $1.44 $1.49 $1.58
$3.53 $3.95 $3.53 $3.34 $3.29 $3.54 $3.43
$1.84 $1.90 $1.70 $1.80 $1.98 $1.77 $2.06
Source: Council for Community and Economic Research’s ACCRA Cost of Living Index
2008 Annual Average Price Report – State Comparison
Dorchester County Profile Total area (land and water) ...................576 square miles Population (2007) ...............................................123,505 Population growth rate (2000-2007) ..................... 23.4% Total households (2007) ........................................43,512 Civilian labor force (2007) .....................................58,810 Unemployment rate (June 2009) ........................... 10.9% Median household income (2007) .......................$53,915 Average household income (2007) ......................$63,133 Gross retail sales ............................................$1.8 billion County seat .....................................................St. George Form of government .......................Council/administrator Compiled by: Charleston Regional Development Alliance Sources: Gross Retail Sales - S.C. Department of Revenue; Population figures - U.S. Census Bureau 2007 American Community Survey and 2000 Census; Employment figures - S.C. Employment Security Commission
Anderson Beaufort Camden CharlestonNorth Charleston Columbia Florence Greenville Hilton Head Island Myrtle Beach Sumter
Ground Beef $2.85 $2.48 $3.01
Whole Milk $2.41 $2.59 $2.59
Dozen Eggs $1.78 $1.84 $1.92
Bread $1.33 $1.28 $1.27
Coffee $3.22 $3.44 $3.23
Sugar $1.80 $1.87 $1.83
$2.90
$2.75
$2.03
$1.43
$3.38
$1.84
$2.95 $2.92 $2.96 $3.23 $2.92 $3.29
$2.75 $2.72 $2.59 $2.55 $2.68 $2.64
$1.91 $1.95 $1.79 $2.10 $1.90 $1.85
$1.97 $1.41 $1.49 $1.70 $1.39 $1.35
$3.95 $3.26 $3.37 $3.80 $3.36 $3.29
$1.90 $1.85 $1.74 $1.96 $1.83 $1.80
Note: Index and average prices are based on data gathered between first quarter 2009 and first quarter 2008 Source: Council for Community and Economic Research’s ACCRA Cost of Living Index
2008 Annual Average Price Report – Regional Utilities Comparison
Racial Composition in the Charleston Region
White Black Asian Other
Charleston-North Charleston MSA* 67.2% 29.8% 2.0% 1.7%
Berkeley County 68.8% 27.4% 2.6% 2.4%
Charleston County 65.0% 32.1% 1.8% 1.6%
Dorchester County 71.5% 26.2% 2.0% 1.0%
*MSA - Metropolitan Statistical Area Compiled by: Charleston Regional Development Alliance Source: U.S. Census Bureau 2005-2007 American Community Survey and 2000 Census
32 2009 Market Facts | www.charles tonbusiness.com
Atlanta Birmingham, Ala. CharlestonNorth Charleston Charlotte Columbia Jacksonville, Fla. Knoxville, Tenn. Orlando, Fla. Raleigh, N.C. Richmond, Va.
Apartment Rent $766 $717
Home Price $284,001 $236,911
$904 $268,107 $651 $737 $1,009 $632 $828 $707 $938
$251,221 $232,065 $240,578 $234,180 $263,822 $303,918 $326,119
Mortgage Rate 6.01% 6.09%
Total Energy $149.65 $170.73
Gasoline $2.59 $2.51
6.00%
$186.31 $2.90
6.04% 6.05% 6.28% 6.02% 6.32% 6.32% 6.00%
$157.60 $189.39 $157.19 $173.17 $181.82 $164.84 $190.74
Source: Council for Community and Economic Research’s ACCRA Cost of Living Index
$3.05 $2.91 $2.99 $2.88 $3.01 $2.99 $3.01
