UNIT 7003V1-FINANCIAL MANAGEMENT


Copyright © School of Business London Ltd, Registered in England & Wales
(Company Reg. No: 08967560), 44
Broadway, E15 1XH, London, United Kingdom.
First edition 2019
All rights reserved. No part of this publication may be reproduced, stored in a retrieval system, or transmitted in any form or by any means, electronic, mechanical, photocopying, recording or otherwise, without the written permission of the copyright holder except in accordance with the provisions of the Copyright.

The main purpose of this workbook is to support you as you study for the Chartered Management Institute Level 7 Qualification — Strategic Management and Leadership, so it specifically focuses on the content of the syllabus for the UNIT 7003V1-Financial Management.
ABOUT THIS WORKBOOK
This workbook provides underpinning knowledge and develops understanding to improve your skills as well as to prepare you for future assessment. If you are studying towards the Level 7 Qualification — Strategic Management and Leadership then, if you choose to do so, you will be assessed on your knowledge and understanding of the learning outcomes.
UNIT 7003V1-FINANCIAL MANAGEMENT
Learning Outcomes
1. Be able to analyse financial data

2. Be able to assess budgets based on financial data to support organisational objectives
3. Understand how to evaluate financial proposals for expenditure submitted by others
PART- 1

UNIT 7003V1: FINANCIAL MANAGEMENT
Part 1 Analysing financial data
Section 1: Financial data validity assessment
Assessment criteria
Determine how to obtain financial data and assess its validity
Apply different types of analytical tools and techniques to a range of financial documents formulating a conclusions about performance levels and needs of stakeholders
Conduct comparative analysis of financial data
Review and question financial data.
Covers Learning outcome
7003V1 1. Be able to analyse financial data
Topics covered
There are four topics in this section, as shown below. Check the subjects within each one and then continue with the areas you need to explore.

Topic 1- Assessment of financial data validity
This topic introduces financial data capture, processing and assuring validity. Financial data is derived from many sources, processed in many ways and used by many people. Unfortunately, this means that there are many chances for error!
Capturing the right data at the right time, processing it reliably and correctly and then sharing it in a timely fashion with the right people is fundamental to an organisation’s financial control.
Organisations often have to decide between timeliness and accuracy. Taking too long to capture and process accurate data may mean that it reaches the decision makers too late. A balance is always necessary in order to gain the maximum benefit in a timely manner.
The validity of financial data is whether the data measures what it’s supposed to measure, which is crucial to making well-informed decisions in any organisation.
Defining financial data
First, you need to consider the role of data in general, its transformation into information, and its combination into knowledge inside your organisation. This progressive flow can be represented as follows:

This flow shows that if you don’t get step one right, then at best steps two and three are limited — and at worst they are actually flawed. This can result in misinformation, incorrect knowledge and ill-informed decisions. This is also true of financial data — ‘Garbage in = Garbage out’ (the GIGO principle). For financial data you also need to distinguish between internal and external sources.
Internal sources
Accounting system
Other managers
Suppliers and customers
Personal spreadsheets
External sources
Companies house
Web
Libraries and other databases
Research documents
Task 1.1 Identifying sources of financial data
Make two lists below of the financial information produced within your organisation and the external financial information collected from other sources. Speak to your accountant or financial director if necessary in order to complete your lists.
Internal sources
External sources
Reliability of financial data
For the purpose of this subject you’re going to focus on the major sources of information. (You will find one of the terms in this box, GAAP, explained in greater detail later in the topic.)
Source Indicator of reliability
Accounting system Can be influenced by:
internal audit
financial systems design
internal checks and controls
authority levels
complexity of the accounting system
complexity of financial reports
the culture of the organisation regarding importance of finance
Case example
If an organisation has strict controls over purchase requisitions and purchase orders, yet gives the most junior member of the team the job of allocating account and costcentre codes then errors may still occur in the processing of the financial data.
Reliability of financial data
Source Indicator of reliability
Published accounts Can be influenced by:
accounting standards
auditing standards
interpretation of the generally accepted accounting principles (GAAP)
accounting statement formats
nationality of parent company
the auditing/accounting firm employed
Case example
A major variant in reporting in published accounts relates to the treatment of profit and depreciation. Some accounting statements refer to profit for operating activities which includes the cost of depreciation.
Other systems talk about EBITDA (Earnings Before Interest, Tax, Depreciation and Amortisation), which treats depreciation as an item worthy of independent reporting.
Published sources of comparative Financial Information
the approach of the publisher to
standardising the financial statements
the accuracy of the translation from published data into the preferred Format
The format of the balance sheet in the Keynote publication follows the IFAC standard.
Task 1.2
Get hold of the published accounts of one of your competitors (or another similar company to your own). Look at the format of your published accounts and compare the layout with the accounts of the other company. What similarities and differences are there?
Similarities Differences
Accounting standards
The Accounting Standards
Board
International Accounting Standards Board (IASB)
General Accepted Accounting Principles
‘The role of the Accounting Standards Board (ASB) is to issue accounting standards. It is recognised for that purpose under the Companies Act 1985. Accounting standards developed by the ASB are contained in 'Financial Reporting Standards' (FRSs) and 'Statements of Standard Accounting Practice' (SSAPs). There are currently in the region of 30 FRSs and 12 SSAPs that organisations are expected to comply with in law in their published accounts.
‘Our mission is to develop, in the public interest, a single set of high quality, understandable and international financial reporting standards (IFRSs) for general purpose financial statements.’ There are currently eight IFRSs and 41 international accounting standards (IASs) that organisations are expected to comply with in their published accounts.
If the IASB is responsible for developing brand-new accounting standards then Generally Accepted Accountancy Practice (GAAP) is the way in which a number of countries tend to adopt the standard, or at least interpret it, and fit it into their individual country's accounting standards. Each country has its own GAAP, but on the whole there aren't many differences between countries.
International Public Sector Accounting Standards (IPSAS)
‘Compliance with the IPSAS standards guarantees that the financial reporting of public bodies conveys what is termed a true and fair view of the financial situation. IPSAS take account of the characteristic features of the public sector.
Although the IPSAS are based on the IAS standards for private companies, they were adapted to the requirements of the public sector. The IPSAS are laid down by the International Federation of Accountants (IFAC), a private federation.
Standardisation of depreciation
There are at least two very different ways in which depreciation can be calculated and, within reason, organisations are able to choose their own method and their own interpretation of key factors within that method. So, if you want to buy a new file-server costing £100,000, the financial reporting standard (FRS) 15 covers the principles of accounting for tangible fixed assets. This 101-page guideline discusses as many variants as you can imagine on how an accountant can work out how much such an asset may have cost, yet doesn’t set clear guidelines on the length of the period over which it should be depreciated. And neither should it. The point is that finance and accountancy is not a science. It’s an art and the only answer you can guarantee you will get from an accountant is ‘It depends’!
Have you identified financial data or financial information? It’s actually a bit of both. Internally financial data is the raw data going into your accounting system. When using external ‘information’ it’s really ‘data’ until you do something with it.
Financial data validation
If the adage of ‘Garbage-in Garbage-out’ is true, you should be looking to quality assure at both ends of the analysis process.
The internal auditor
Although the following definition of an internal auditor gives them a wider brief than you’re looking at in this guide, internal auditors have traditionally been associated with the validation of internal financial information. Here’s a quote taken from HM Treasury.
In essence, internal auditors help their organisations to manage risks. They keep senior-level executives up to date on key questions such as whether risks have been identified and how well they are being managed. They deal with issues that are fundamentally important to modern organisations. They look beyond the narrow focus of financial statements and financial risks to consider wider issues such as the organisation’s reputation, its impact on the environment and the way it treats its employees.
*For information on the role of the internal audit in the public sector, see Jones and Pendlebury’s book Public Sector Accounting.
Financial data validation
If the adage of ‘Garbage-in Garbage-out’ is true, you should be looking to quality assure at both ends of the analysis process.
The internal auditor
Although the following definition of an internal auditor gives them a wider brief than you’re looking at in this guide, internal auditors have traditionally been associated with the validation of internal financial information. Here’s a quote taken from HM Treasury. In essence, internal auditors help their organisations to manage risks. They keep senior-level executives up to date on key questions such as whether risks have been identified and how well they are being managed. They deal with issues that are fundamentally important to modern organisations. They look beyond the narrow focus of financial statements and financial risks to consider wider issues such as the organisation’s reputation, its impact on the environment and the way it treats its employees.
The authority matrix
Most organisations have some sort of formal or informal ‘authority matrix’ relating to what decisions can be made and by whom inside the organisation. This matrix is often not given the thought it deserves. In difficult times authority often resides in too few individuals, thus creating bottlenecks and discontent. When times are more optimistic, these are relaxed and then spending may get out of control.
Task 1.3
Review the financial authority levels in your organisation. Note the impact of this on the validity of the financial data in your organisation.
Financial data authority level Impact on data validity
Note what these levels tell you about the approach to empowerment in your organisation.
Financial data validation
Financial process validation
A financial process is the same as any other process inside your organisation. Processmapping will identify where possible errors or problems could occur in the system. For example, the financial system may expect that invoices are signed off by a number of senior managers before being passed on to the finance department for processing. This may result in invoices taking a long time before they are entered into the financial ledger and the costs of a project may therefore be understated.
Financial output validation
When it comes to financial information sometimes reasonableness seems to go out of the window. Financial figures should rarely be unexpected as long as they are:
You’ll look at the use of ratios as indicators in Topic 2 of this section.
timely
indicative
relevant.
Role of external auditor
Published information has the benefit of an independent audit. Despite the headline news of the collapse of major companies, this process is still relevant and, mostly, reliable. However, it only ensures that certain rules have been followed and certain standards adhered to. It does not ensure that the information produced by the company is in a comparable format to others or check whether or not the rules have been followed in one of the many differing and allowable ways. You should also remember that the auditors know the standards and conventions discussed earlier but they still rely on the business knowledge of the senior management of the company to set these in context.
The Auditing Practices Board (APB) Firms auditing the auditor IFAC
This was established in 2002 and is part of the Financial Reporting Council. It is committed to leading the development of auditing practice in the UK and the Republic of Ireland in order to: establish high standards of auditing; meet the developing needs of users of financial information and ensure public confidence in the auditing process.
‘We have long recognized that a fundamental way to protect the public interest is to develop, promote, and enforce internationally recognized standards as a means of ensuring the credibility of information upon which investors and other stakeholders depend.’ IFAC’s boards set the following standards:
international standards on auditing, assurance engagements and related services
international standards on quality control
international code of ethics
international education standards
international public-sector accounting standards.
Roles and responsibilities
Roles Responsbilites
Book-keeper
Every business, no matter how large or small, is required by law to 'keep books'. This involves the recording of the financial transactions of a business, whether manually into ledgers or by entering everything on to a computer. The book-keeper then provides a business with accurate figures that enable it to know exactly how well it’s doing.
Management accountant
Financial accountants (see below) traditionally focus on audit, tax and reporting on past performance, whereas management accountants look forward. They work at the heart of the business, evaluating and interpreting financial information so that they can make the strategic decisions that will shape an organisation's future. CIMA chartered management accountants are qualified to engage in a wide variety of activities:
advising managers about the financial implications of project management
explaining the financial consequences of management decisions, and suggesting
actions
making strategic decisions and formulating business strategies to create wealth and shareholder value
monitoring spending and financial control
managing risk and business assurance
cost determination and financial control
evaluating existing financial information
Roles and responsibilities
Roles Responsbilites
Financial accountant
A financial accountant is responsible for the control of the financial management of a business, as well as advising and being involved in the strategic direction and administration of that business. Accountants extract and interpret information from the financial records for a wide range of interested parties throughout that organisation — shareholders, potential investors, bankers, employees, trade creditors and government departments. They’re responsible for controlling the working capital of a business, ensuring debtors, creditors and stocks are maintained at an acceptable level, taking day-to-day decisions, giving advice to the board of directors (very often the financial accountant is a director of the company) and advising on capital investment.
Treasurer Treasury in a company is key in determining the financial strategy and financial policy, advising on what businesses to invest in, organising the appropriate funding and controlling the risk in the organisation. Depending on the risk environment, treasury will create an appropriate capital structure of debt and equity in order to fund the business, getting the optimum balance between cost and risk. This translates into the need to ensure that at all times the company has the liquidity and cash to meet its obligations as they fall due, taking in funding from equity or debt capital markets activities, bank borrowings, through to day-to-day cash management and investment. Treasury is responsible for the identification of risks associated with this activity and for controlling risks that could erode financial strength, using mitigation and hedging techniques and encouraging a culture of sound financial practice. Treasury management is all about handling the banking requirements, the funding for the business and managing financial risk. It therefore incorporates raising and managing money, currency, commodity and interest-rate risk management and dealing, and in some organisations the related areas of insurance, pensions, property and taxation.
Roles and responsibilities
Roles Responsbilites
Public sector accountants
CIPFA’s members work, often at the most senior levels, in public service bodies, in the national audit agencies and major accountancy firms. Their areas of expertise are the following:
leadership and strategic management
strategic and operational financial management
financial and performance reporting
governance, ethics and values
audit and accountability
partnerships and stakeholder relationships
change, risk and project management
procurement and contract management.
You can see from the above, all the bodies are fighting for the same ground — to be perceived as the forward-looking business adviser rather than the traditional, grey-suited accountant. Again, you need to look at this as a process and see how you can ensure this process has the best chance of providing you with timely, indicative and relevant information.
Knowledge management and Financial information
Looking at the roles in the table above, many of them sound like they are taking on general leadership and management roles. So how do they differ from other functional managers inside your organisation? Perhaps the main difference lies in the accounting policies contained in FRS18 that govern the way an accountant thinks about an organisation. Before FRS18 (2000) one of the over-riding accounting concepts was ‘prudence’, which basically says that anything bad that can happen will happen so take it into account, and if there’s anything good that may happen ignore it or think prudently. But now FRS18 refers to: true and fair view going concern
realisation.
Realisation, the fourth point above, is a similar concept to prudence, but with a little less doom and gloom. Nevertheless, compared with other pieces of information in an organisation’s knowledge management system, it’s still safe to say that the accountant’s view is likely to be more prudent than information from other sources. As a strategic leader, it’s up to you to weigh up all the information on your organisation’s knowledge bank and make decisions within the risk framework acceptable inside your organisation.
accruals
Financial control and organisational culture
The role of culture and the approach to financial control is an interesting area and one that has become more interesting to academics since the Enron collapse. However, most of the articles and comment seem to focus on the negative aspect of reducing control and pushing the accountancy profession back to ‘prudence’.
Contrast that with the view of other functions within an organisation and they may state that the financial controls imposed on them are restrictive and inhibit the development of the organisation. There are often polarised views on financial control inside an organisation and it may simply be that different sub-cultures thrive within different functions and it’s a leader’s job to manage these. For example, accountants have to follow the accounting rules, whereas an operations department may be more used to dealing with things on an ad hoc basis. This could result in conflicting viewpoints on financial information as the accountant is more interested in whether they comply with standards whereas the Operations Manager is interested in how it can help solve a current problem.
Task 1.5
Look at the model ‘Handy’s four types of organisation culture’ and identify a stereotypical culture for three functional roles (one being finance).
Role Culture Area of conflict
UNIT 7003V1: FINANCIAL MANAGEMENT
Part 1 Analysing financial data
Sections 2, 3 and 4
Section 2: Analytical tools and techniques in Financial Management
Section overview
This topic turns to the processing and use of financial data and introduces the tools and techniques of financial analysis and interpretation. There are many tools and techniques used for financial analysis, and many of these are ratios of financial information. Using a ratio combines information and can relate parts of the business together — often giving a deeper insight into what’s going on.
This topic introduces the stakeholders who will be interested in your financial information, considers the different ratios used to analyse an organisation, and looks at which ratios are more appropriate to which stakeholders. Finally, an interpretation of financial ratios is explained in order to better understand the position of an organisation.
The value of financial analysis
In the introduction to this guide we said that there was no such thing as finance — and this is where our meaning will become apparent. A financial analysis will not answer all your questions. But what it will do is raise intelligent questions and point you in the direction of others in your organisation who should know the answers. And if they don’t, you need to know why they’re not aware of the financial impact of their decisions.
Poor managers are often ‘anti-accountants’ because they hear accountants asking difficult questions. But it’s important not to shoot the messenger as he or she is only trying to resolve issues raised through financial analysis. The better organisation and the better manager would actually have informed the accountants beforehand that there may be issues in the business that will reveal themselves in the financial figures from analysis.
Stakeholders of financial analysis
In this guide you’ll consider all the primary stakeholders as well as your competitors and government (especially with regard to taxation). If you work in the public sector you should also include consumer groups, or more simply ‘the public’. You should also include external and internal auditors. The difficulty for organisations and their senior management is that these stakeholders are all interested in different aspects of your financial performance and, in some cases, their requirements are actually contradictory. This is shown in the table below.
Primary stakeholders
Secondary stakeholders customers competitors
suppliers consumer groups
employees — managers with financial government — central or local government responsibility and accountants bodies
shareholders or investors
the media your bank.
pressure groups
trade unions
community groups.
Stakeholders conflicts
Stakeholder Interests Could conflict with
Shareholders
Share value
Market capitalisation
Rapid growth
High gearing
High retained profit
Dividends
Banks
Employees Customers
Public
Bank
Employees
Cashflow
Liquidity
Interest cover
Low gearing
Steady growth
Forced sale value
Fixed assets for secured loans
Job security
Higher pay levels
Shareholders
Managers
Shareholders
The public
Stakeholders conflicts
Stakeholder Interests
Could conflict with Customers
Value for money
Extended credit terms
Business continuation
Suppliers
Cashflow
Minimum credit terms
Best price
Competitors
Comparative gross margins
Comparative net profit
Comparative sales
The public
Value for money
Lower pay level
Lower taxes
Shareholders
Bank Accountants
Employees
Shareholders
Bank Accountants
Employees
Government
Stakeholders conflicts
Stakeholder Interests
Could conflict with Government
Taxable profit
Accuracy
Audit
Window dressing
Fraud
Your accountants
Prudence (or realisation)
Accuracy
Accounting standards
Accounting principles
Accountants
Everybody
You and your managers
In smaller companies the emphasis is on cashflow In medium-sized businesses and in departments of larger business the emphasis is on sales, cost and profit. In larger companies the emphasis is on the balance sheet and shareholder value. In the public sector the emphasis is on costs and best value.
Any of the above
Financial management tools and techniques
There are a number of tools and techniques used in financial management and the table below indicates which stakeholders may use them and where this guide will help you understand what they are used for.
Tool/ technique
Profitability ratios
Primary stakeholder
Shareholders
Customers
Managers
Liquidity ratios
Bank
Suppliers
Asset utilisation
Bank
Shareholders
Shareholder ratios
Shareholders
Accountants
Variance analysis
Key financial indicators
Investment Appraisal
Managers
Managers
Accountants
Managers
Profitability ratios
Ratio Possible interpretations
Return on Capital Employed (ROCE)
This gives an indication of how well an organisation has used the money that has been invested in it. In theory this should be different to the ROI and ROE described below. The ‘capital employed’ should include all investments — both from shareholders and banks. (Many books don’t make this distinction and use ROCE, ROI and ROE interchangeably.) In summary, ROCE looks at how much profit has been made compared with how much capital has been put into the organisation. For the capital employed figure you should then use all the money you’ve been given for investment — shareholders’ funds plus bank loans. Ideally, this figure should at least exceed maximum gross interest rates. If not, as managers, you should move all the capital into high interest accounts and make more money that way. Organisations with high fixed assets (manufacturing companies) would expect to see lower ROCE than service organisations. This ratio needs to be monitored quarterly in most organisations and also when major changes in fixed assets or investment have happened.
Return on Sales (ROS)
Interest burden or Interest Cover
This is the potential profit you have to either reinvest in the business or pay out in dividends. It’s also the ‘bottom line’ profitability that can be compared with the performance of your competitors.
If you have loans or overdrafts in the business they are going to cost you. The banks look at this as a key measure of your ability to continue to service the loan. If they see your profits falling significantly in relation to interest they are likely to want to renegotiate their loan terms with you. You need to understand your relationship with the bank to understand how close they will allow those figures to become. The economic climate will also impact on this figure because this changes the bank’s attitude to risk.
Profitability ratios
Ratio Possible interpretations
Return on Investment (ROI)
For all intents and purposes this is the same measure as the Return on equity that shareholders refer to. It lets the long-term investors — shareholders and venture capitalists — look at the return they’re making on their investment and decide whether they would make a better return if they invested elsewhere. For this ratio you should use profit after interest as the indicator of profit as this is the profit you’ve made after paying the bank but before paying dividends to the shareholders. For the capital employed figure you would then use just the shareholders’ funds. Low ROI doesn’t mean that you won’t get investment from shareholders. But it may mean that you’ll only attract risk-averse shareholders or investment shareholders, which will mean you have to compensate them by paying higher dividends.
Gross margin Gross margin is said to give an indication of price and direct costs relative to your competitors. Many customers look at your accounts in this way. But use this figure with caution as an external benchmark because different companies treat direct and indirect costs in different ways. Internally, this is an excellent measure and changes in it suggest either that you should make:
a change in price — talk to your sales team
a change in costs — talk to your production team
a change in product mix — talk to your marketing team. This ratio can be appropriate to the public sector if you’re providing direct services such as building and works. For the purpose of assessing efficiency you should consider the total budget allowance as income and look at the direct costs as a percentage of this.
Profitability ratios
Ratio Possible interpretations
Expense Ratios
This is another good internal measure in relation to sales. How much are you spending on the overheads or indirect costs? Most organisations will have a manager responsible for different aspects of the overheads and it’s their responsibility to provide you with information that may effect the balance between their costs and the activity of the organisation.
A growing organisation would initially expect to see economies of scale and therefore see expenses reducing as a percentage of income. However, rapid long-term growth will usually lead to the company having to invest in additional overheads (or fixed costs) and this will have a negative impact on this ratio in the short term.
An organisation that restructures its costs between direct (variable) and indirect (fixed) will also see changes in this ratio. Good managers will have predicted these in their forecasts and they should not come as a surprise to the accountants for the organisation. This ratio is appropriate to the public sector. For the purpose of assessing the controls, you should consider the total budget allowance as income and look at the expenses as a percentage of this.
Liquidity ratios
Ratio Possible interpretations
Current ratio
This ratio is said to give banks and suppliers an indication of your ability to repay short-term borrowings and pay your suppliers. It’s said to give the ‘best case scenario’ and shows how much cash or potential cash you have in your current assets and how much you might have to pay out in the near future.
Although this ratio is used extensively by people who only have access to the published accounts, it should be used with caution and in combination with the stock, debtor and creditor ratios below. Banks often quote a 2:1 ratio as a minimum requirement and yet some service industries would automatically fail this test. The financial world is a different place now compared with what it was in the days of heavy manufacturing industries.
Quick ratio or acid test
This ratio is also said to give banks and suppliers an indication of your ability to repay short-term borrowings and pay your suppliers. However, it’s said to give the ‘worst case scenario’ and shows how much cash or potential cash you have in your near liquid current assets (debtors and in the bank) and how much you might have to pay out in the near future.
Again, this ratio is used extensively by people who only have access to the published accounts and should be used with caution and in combination with the debtor and creditor ratios below. Banks often quote a 1:1 ratio as a minimum requirement. But some retail industries would automatically fail this test as they don’t have debtors and yet their cashflow is likely to be healthy in the short term.
Asset-utilisation ratios
Ratio Possible interpretations
Fixed asset utilisation
This ratio attempts to look at how hard you are working the fixed assets in your organisation. It probably really only has a significant meaning in heavily automated manufacturing organisations. Major changes in this could suggest new capital expenditure. Minor changes could suggest your machines are experiencing some idle time. However, this needs to be looked at alongside the stock calculation below as busy machines could result in stock piling rather than increased sales.
Stock turnover/ days
Stock turnover or stock days gives an indication of how efficiently you are using your stock. However, you need to treat this with caution. In organisations with lots of stock the valuation of that stock — raw materials, work in progress and finished goods — can be complex. This complexity makes it an area of focus for the external auditors at the year end. The year-end accounts may be a reliable figure but can you say the same on a month-by-month basis? If not, and stock is an important aspect of your business, this may indicate that you need to invest in better stock control software.
Creditor days
This ratio is relevant in all sectors. In the public sector government has made the timely payment of suppliers one of its key performance indicators (KPIs), and has even introduced legislation to encourage companies to pay each other on time. In the private sector some accountants think it’s a good technique to delay payment to creditors for as long as possible. But suppliers are increasingly wise to this and will stop supplies if this happens. In the published accounts extended creditor days can be seen by potential investors — especially the banks — as a sign of poor management. This is because they see this as asking the creditors to take the strain for your inability to manage the cash. Banks are less likely to lend to organisations that have borrowed too much from their creditors.
Asset-utilisation ratios
Ratio Possible interpretations
Debtor days
This is a measure most organisations pay attention to in both the private or public sector. In the public sector it may be more difficult to measure on a daily basis as many of the requests for payment, such as taxes, are on an annual, biannual or quarterly basis. As such, they need special systems to ensure monies are collected on a timely basis but in a manner that doesn’t cause public resentment.
In the private sector this figure is critical as non-collection of money owed is responsible for many company failures. Most good financial systems will have a sales ledger that can produce this figure by individual account so that actions can be taken as needed.
Suppliers and customers alike will look at your statutory accounts to calculate the credit you allow your customers. Suppliers, like banks, will see a high figure as poor management that will impact on your ability to pay them. Customers will use this figure as a negotiation tool when trying to maximise their credit terms with you. In the annual accounts the ‘dash for cash’ often means that the debtors’ figure is at its lowest for the whole year as a disproportionate amount of time is spent collecting money due to ‘window dressing’ of the published accounts.
Shareholder ratios
Ratio Possible interpretations
Return on equity (ROE)
This is virtually the same measure as the Return on investment referred to in the profitability ratios. It lets the long-term investors (shareholders and venture capitalists) look at the return they are making on their investment and at whether they would make a better return if they invested elsewhere. Sometimes for this ratio people use profit after interest and tax as the indicator of profit as this is the profit left for potential reinvestment or dividends.
Growth
The return for shareholders comes from the growth in share price. This comes in part from the growth in the business. Shareholders are especially interested in the balance sheet growth of the shareholders’ funds but will also be interested in the growth in sales and whether this has been reflected in a similar growth in profit.
Earnings per share
(EPS)
Dividend cover
This is a measure based on how much profit could be shared out between the shareholders. It would then be up to the shareholders at the annual general meeting to decide how much of this should actually be paid out in dividend and how much to reinvest in the business.
This is similar to the interest burden or cover looked at by the banks. It simply looks at how much profit has been made in relation to the dividend paid and how easy it is for the organisation to ‘cover’ the payment of that dividend.
Dividend yield
Like the PE ratio, this is of more interest to the investor on the Stock Exchange and simply looks at how much dividend has been earned in relation to the price they have to pay for the shares. This is balanced with the possible growth in the market price of the share and the investors’ attitude to risk.
Shareholder ratios
Ratio Possible interpretations
Price earnings ratio (PE ratio)
This is a ratio relevant to the investor in relation to other investments in quoted companies and is really beyond the remit of this guide. However, if you read the Financial Times you’ll see this figure quoted along with the share price. It’s the market value of the share in relation to the earnings per share (EPS) and shows, at current profit levels, how long it would take to get all your money back. Ironically, a high PE ratio suggests a rapidly growing company as the Stock Exchange has priced it highly in relation to its current profit
Gearing This indicates the balance between funding from shareholders (equity) and funding from lending institutions (loans). Highly geared organisations have a relatively high amount of loans in relation to equity. These organisations are considered to be much more risky especially by the lending institutions. Unfortunately this is in direct contrast with how it’s viewed by shareholders who have invested in a company with high growth potential.
There’s more consideration of this in Development Guide 7007V1 Financial planning, but as a rough guide here, banks will never lend if the gearing is higher than 1:1 (for every pound put in by shareholders they would put in a pound) and they rarely get anywhere near this because of the way they view the ‘worth of the business’.
Task 2.2
Find out what ratios are produced in your organisation. How do they compare with the lists above? Are there any that are missing that you think would be valuable and should be introduced? Make notes below.
Section 3: Conducting comparative analysis of financial data
Section overview
This topic introduces comparative financial analysis. You can compare data using many criteria, such as across time, departments, products, customers, markets and companies.
However, a key point to note is that comparing apples and pears will only confuse and certainly not gain you insight, knowledge or commercial advantage. You therefore need to be cautious in how, what and when you compare. You’ll look in particular at the value of comparing past and present performance and comparing performance against that of competitors. Comparing past and present performance can be meaningful, but the longer the timespan the less effective or accurate this may be.
Comparing across years depends upon the stability of the organisation — whether its strategy, operations, pricing, cost structure, products and customers have remained reasonably constant. Comparing your performance against competitors’ performance can be even more fraught, as you may not know the relevant changes made in these organisations over the time period of analysis. Nevertheless, comparisons are very useful, and if used with caution they can bring new insight and knowledge about your own performance as well as that of your competitors. In this topic you’ll look at a case study of a medium-sized business in the service sector.
Case scenario-New Fire Ltd
New Fire Ltd designs and project-manages furnace and large boiler refurbishments. The company employs 71 people full time and was founded in 1967 by John Gilford. It has sold itself on two main claims: Its ‘cradle to grave’ service and its skill base. Design is seen by the current directors as the real value-added service. All employees are currently employed on a full-time basis. All wages are paid on a basic plus overtime basis. The direct wages of the business include designers, refurbishment engineers and project managers. The indirect wages include the rest of the management team and the administrative staff. There are currently 71 employees.
Commercial issues
The last financial year has been a challenge. The clients have less money to spend but the work still needs to be done. Because many clients have been with the business for years the directors have allowed them considerable discounts to help them through this difficult period. It’s hoped that the clients will respond in kind when the economy improves. The business experiences extreme seasonal fluctuations. The major refurbishments take place in the summer months when factories have traditionally had their holidays. Credit control has also been an issue. It’s not common practice to receive payment until the job is finished and the industry is not known for prompt payment. Payment terms are 30 days from the approval date of the project. This creates an unknown factor, as projects are often completed weeks before they’ve been given formal approval.
Case scenario-New Fire Ltd
Completed projects have traditionally been treated as work In progress and invoices are raised once approval has been received. Once invoices have been raised, the average time it takes the customers to pay is between 30 and 60 days. The valuation of work in progress is the most difficult part of the accounting process and its accuracy (other than at the year end date) is subject to question.
The type of work undertaken is shown below: The furnace refurbishment and factory work take place mostly in the summer and Christmas breaks. Eighty per cent of the refurbishment work relies on a few major clients. These clients have furnaces throughout the EU that need at least one major refurbishment every year. These equate to ten major projects every year with six starting in the summer and four in the winter. Other clients account for five projects spread over the year.
Furnace refurbishment (in steel works) 40% Ships 25% Factory work 15% Hospitals 10% Other 10%
Case scenario-New Fire Ltd
The hospital and factory work is very much based on traditional plumbing work but on a large scale. The company adds value by looking after the whole project. The ship work requires the project team to work away from home. The work has to be done at the quickest speed possible in order to reduce the time the ship will be in dock. In order to keep the gangs busy during off-peak times they have taken on less specialised work, such as general cleaning an repainting of large installations. This work is obtained through general advertising in the trade press and is not closely monitored.
Project management issues
The project managers each seek to have the best designers and engineers on their jobs. This can make training an issue as less experienced staff need to shadow more experienced staff. This is seen as a drain on the project managers’ overworked resources. The ship work is the most complex to manage due to the time factor. Design work can’t start until the designer has been aboard ship and the most experienced engineers have to be used to meet the tight deadlines. As such, the company tries to limit this type of work to off-peak times when there are more people to chose from.
Design issues
Design basically covers everything that’s not related to standard project management. The designers do the following:
plan the projects
identify the materials to be used
produce the tender
hand over to the project manager.
There are only a few competitors in this industry, so the success rate with tenders has been relatively high. New Fire usually wins 50 per cent of the tenders it submits, which means that designers can spend up to 50 per cent of their time on tenders that are not accepted.
Case scenario-New Fire Ltd
Financial analysis
Below is a financial ratio analysis prepared by the company’s accountant.
This year Last year Previous year Return on investment 23.60% 55.39% 65.53% Return on sales 4.64% 10.89% 13.13% Gross margin 28.13% 35.40% 36.83% Interest burden 3.78% 1.39% 1.22% Current ratio 1.57 1.35 1.29 Quick ratio 1.24 1.07 0.94 Stock days 33.36 35.45 40.68 Debtor days 89 89 69 Creditor days 45 58 52 Growth in net worth 15.20% 9.24% Growth in sales 12.36% 11.11% Growth in profit (52%) (14%)
Task 3.1
Look closely at the ratios listed above, and bearing in mind the background of the company, comment on what the ratios confirm or reveal about New Fire’s situation.
Task 3.2
Now reflect on the ratios used in your own organisation. Note where you can match the changing activities of your organisation over this period to the information reflected in the ratios.
Case scenario-Competitor analysis
You’ll now look at a competitor of New Fire Ltd.
Burnace and Flast is a much bigger company than New Fire and operates just in the furnace sector of the market. It designs and builds furnaces as well as refurbishing and maintaining them. Design and build doesn’t have to cope with the seasonal issues faced by the refurbishment market. This accounts for 80 per cent of the company’s work, while refurbishment and maintenance accounts for just 20 per cent. Due to the large-scale capital nature of its core market it can demand pre-payment on large projects. Burnace and Flast employs world-class project managers and has a technically competent sales team. However, 80 per cent of the direct work is sub-contracted. New Fire is one of its subcontractors. Although based in the UK Burnace and Flast has an international reputation, which has protected it from some of the commercial and seasonal issues in the UK. The current-year comparative financial analysis is shown below.
New Fire Burnace & Flast Return on investment 23.60% 25.48% Return on sales 4.64% 5.48% Gross margin 28.13% 25.28% Interest burden 3.78% 3.95% Current ratio 1.57 4.01 Quick ratio 1.24 3.03 Stock days 33.36 26.34 Debtor days 89 61 Creditor days 45 50 Growth in net worth 15.20% 8% Growth in sales 12.36% 5% Growth in profit (52%) 10%
Task 3.3
Compare the ratios of the two companies and comment on what this tells you about their relative performance.
Task 3.4
Try to get hold of a set of the most recent published accounts of one of your competitors. If it’s a limited company these should be available from Companies House. What insight does the information and figures give you into what may be happening in the marketplace?
What recommendations could you make to your organisation based on this financial benchmarking exercise?
Section 4: The perils of financial analysis
Section overview
This final topic introduces some of the major points to consider when analysing financial statements and ratios. You shouldn’t be discouraged by its complexity from using such financial information, but do use it with caution. You’ll look at the limitations in financial systems and how to remove them by redesigning your financial system to be more of an information provider than simply a control provider. You’ll look at the weaknesses in comparative ratio analysis and see how you can build strengths into any ratio analysis by using industry norms.
Financial system redesigning
When looking at reviewing financial data you need to consider the financial processes. In the diagram below (produced as part of a conference paper in May 2007), Gabriel F. Sékaly from the Institute of Public Administration of Canada looked at the key competences of the new chief finance officer (CFO). Traditionally, the way to ensure reliability in financial data had been to emphasise the controls and concentrate on centralised transaction processing. Sékaly, however, suggests that the better way to achieve this end is by inverting the triangle. The processing can be reduced by allowing data entry at point of responsibility and the control function can be reduced by process redesign. Inverting the triangle will have a two-fold benefit for organisations:
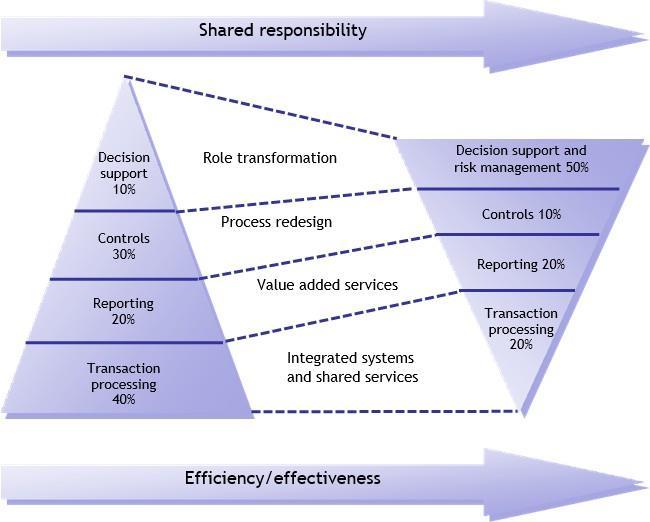
a reduction in data-entry errors
increased time for management accountants to work on decision support and risk management in order to benefit managers and the organisation.
Management accountants will effectively become internal consultants providing the financial information to support management decisions, adding the appropriate voice of caution and doing ‘what-if’ analyses to look at how risky the decisions may be.
Limitations of ratio analysis
In this section you’ve already seen how many internal and external bodies there are that are responsible for setting standards and auditing financial inputs and outputs. This has a major impact in the following areas of comparison.
Different accounting policies Ratios effected
Profit and loss Differing depreciation policies result in differing cost of depreciation in either the direct or indirect costs
Return on capital employed
Return on sales
Balance sheet Differing depreciation policies Return on capital employed result in differing net book
Fixed asset utilisation values of fixed assets
Stock valuation
Debtor provisions
Revaluations
Stock turnover Debtor days
Depreciation
A simplistic example of this relating to depreciation would be as follows. Two companies invest in a new computer system costing £100,000. One company may have a policy to depreciate this over five years, while the other may depreciate it over four years. In the third year this could mean the following.
The costs in company A in the third year would be 20,000 compared with 25,000 in company B and the balance sheet value of the fixed asset would be 40,000 in company A and 25,000 in company B. This would make company A appear more profitable and worth more. Both these options would be acceptable under the guidelines of the financial reporting standards. Although the information on depreciation policy has to be disclosed in the published accounts, the complexity of this information on all fixed assets can make true competitor comparisons difficult. The recommended website gives information on the impact of depreciation and the different methods of calculation.
Company A Company B Cost 100,000 100,000 Depreciation year one 20,000 25,000 Depreciation year two 20,000 25,000 Depreciation year three 20,000 25,000 Book value at end of year three 40,000 25,000
Creative accounting
Some organisations also apply creative accounting to show better financial performance. These can be small adjustments such as bad debt provisions and changing collection and payment values at the year end. These simply massage the year end figures. Or they can be major manipulations or complications:
revaluations of fixed assets such as buildings
sale and leaseback of fixed assets such as cars
goodwill
intangible assets.
These can have a dramatic effect on the ratios calculated. They all have strict and complex guidelines in the financial reporting standards and, for the non-financial specialist, there can seem to be a fine line between window dressing and fraud. If this interests you, there are some tips on spotting fraud in the checklist ‘Spotting fraud’.
Business Intelligence and interpretation of ratios
Ratios are simply that — ratios: they relate one figure to another. In your own organisation they should help you and other managers to recognise the results of your management decisions on the financial performance. When doing a comparative analysis you may not have the same insight. In the case study used earlier, the analysis raised more questions than it answered. The background to New Fire Ltd allowed you to make some educated guesses about the business and why the ratios showed the trends they had. But the competitor’s background was less detailed and the comparative analysis was more difficult, with a lot of guesswork needed.
Timeliness of information
In a traditional ratio analysis timeliness is one of the biggest limitations. If you’re looking at a set of published accounts in November 2008 they probably relate to a year end dated December 2007 and contain data relating to the two periods starting January 2005 and ending December 2007. Some of the data is therefore up to four years old. Several things could have happened over this time, including the following.
Inflation
The stated value of such things as sales may seem smaller than they are if they relate to a period four years ago. For example, £1 million pounds four years ago could be the equivalent of £1.2 million today if there had been 5 per cent inflation each year.
Technology In a high technology business the balance of the fixed (non- current) assets on the balance sheet could vary quite a lot over a four-year period.
Accounting policies and practices
Again using the high technology business, it’s not unprecedented for the accounting treatment of these fast- moving fixed assets to have changed. If you take computers, they used to last up to four years and be depreciated over that period. Now many companies depreciate them over just two or three years.
Changes in interest rates
A company four years ago may have had a high interest burden and may be considered as risky. But if this was not due to a large loan but to high interest rates, and interest rates go down, the risk also looks much less.
Industry standards
To overcome some of the limitations discussed, it’s possible to compare against ‘industry norms’. These are average figures for similar companies within an industry sector. These companies should be a good comparison as they operate within the same bounds and typically access the same type of suppliers and customers. Industry data can also smooth out differences due to industry trends, which all organisations operating in that sector will have been exposed to, to some extent. This smoothing out makes comparisons more relevant. Furthermore, standard interpretation of many ratios can be incorrect when applied within certain sectors. For example, a web-based company may have few real assets and so asset ratios could be seen as weak against normal standards, but strong against an industry norm.
You can find the industry norms for some ratios from organisations who provide databases of financial information (see the website in Supporting resources for one of them).
Task 4.1
If you’re interested in looking further into this, use the suggested website and search for your own industry norms (or use a different database if you have access to one).