About the Santa Barbara Foundation
The mission of the Santa Barbara Foundation (SBF) is to mobilize collective wisdom and philanthropic capital to build empathetic, inclusive, and resilient communities.
Since 1928, your community foundation has championed the philanthropic efforts of the people of Santa Barbara County, identifying the areas of greatest need and bringing together generous donors with those who do standout work in the nonprofit community.
The Foundation is working to improve areas that affect quality of life in Santa Barbara County, including support for basic needs, as well as addressing community concerns, such as child care, workforce development, and housing affordability. To learn more, please visit SBFoundation.org.
Project Team
Stacie Furia, PhD, Director of Evaluation and Learning
Gary Clark, Director of the Collaboration for Social Impact
About the Center for Evaluation & Assessment
The Center for Evaluation and Assessment (CEA) at the University of California, Santa Barbara (UCSB) is a center that specializes in enhancing social programs through evaluation and research. The CEA's work spans across various fields, such as education, health, and social services. The CEA aims to provide practical and effective insights that support the continuous development of programs and policies.
Project Team
Natalie D. Jones, MA, Associate Director CEA
Piper T. Grandjean Targos, MA, Consultant
Caitlin Ng, Doctoral Research Assistant
Tarek Azzam, PhD, Director CEA
Center Team
Tarek Azzam, PhD, Director
Natalie D. Jones, MA, Associate Director
About The Nonprofit Institute
About DataLake, LLC
Nonprofits and philanthropies depend on research to make big decisions. DataLake Nonprofit Research helps organizations understand and serve their communities
Project Team
Jon Durnford, MBA, Principal
The Nonprofit Institute is housed in the School of Leadership and Education Sciences at the University of San Diego. The Nonprofit Institute provides education, training, and research to strengthen organizations that help meet critical community needs.

Project Team
Laura Deitrick, PhD, Associate Director
Tessa Tinkler, PhD, Director of Research
Thomas Abruzzo, MA, Doctoral Research Assistant
Table of Contents Demand for Services 53 Introduction 01 Financial Health of the Sector 59 The State of Nonprofits Leader Survey Participating Organizations 04 Santa Barbara Nonprofit Sector Profile 07 Organizational Capacity 71 Nonprofit Sector Employment 13 Adaptation and Innovation 79 Diversity, Equity, Inclusion, and Access (DEIA) 43 Appendix 87 Nonprofit Boards & Volunteers 35 Santa Barbara Foundation Recommendations 84
Acknowledgements
The Center for Evaluation & Assessment at UCSB and the Santa Barbara Foundation would like to acknowledge all the Santa Barbara County nonprofits who took the time to participate in the survey and provide valuable information on the state of their organizations.
We would also like to acknowledge the nonprofit workforce members who donated their time to participate in focus groups, sharing their experience and perspectives on various topics that emerged from the leader survey findings.

Reef Project
Fish
Introduction
This report offers a comprehensive and current overview of the nonprofit industry in Santa Barbara County. Despite facing various disruptions such as recovery from the global pandemic and economic inflation, the report's findings offer valuable guidance for stakeholders such as funders, practitioners, and government agencies to work together towards bolstering the sector. Furthermore, the data presented in this report can serve as a crucial resource for future and longitudinal studies on the nonprofit industry in Santa Barbara County.
Report flow
This report was developed by The Center for Evaluation & Assessment (CEA) at UCSB. The report brings together multiple sources of information spanning years and data sources, to provide a more holistic understanding of Santa Barbara County’s nonprofit sector. Focus group data, conducted with members of the Santa Barbara nonprofit workforce, are integrated throughout the report.
The report primarily follows the order of the nonprofit leader survey but deviates from it at times to better fit the information needs of Santa Barbara County. Specifically, data from the IRS is incorporated into the financial section, while data from the California Economic Development Department is included in the employment section. The report begins by giving an overview of the size and composition of the nonprofit sector and continues to provide detailed information about each sector topic.
How to use this report
• Foster greater awareness and understanding among donors, funders, public officials, nonprofit professionals, and communities about the strengths and challenges of the nonprofit sector.
• Incorporate the findings into strategies that can help organizations improve their leadership and management abilities.
• Promote increased investment in the nonprofit sector through targeted advocacy efforts.
• Analyze the data to pinpoint key areas that require further investigation.
SBF Recommendations

At the end of this report readers can find recommendations and commentary from the Santa Barbara Foundation.
The Foundation looks forward to further conversations on the topic areas covered here and others, which stakeholders would want to see in the future as part of a regular assessment of the State of the Nonprofit Sector.
1
Methodology
The report uses various sources of data, including:
1) financial data on tax-exempt nonprofits from the IRS Tax Form 990, as well as employment data from the California Employment Development Department that has been compiled and analyzed by DataLake LLC;
2) a survey for nonprofit leaders that was originally created by The Nonprofit Institute (NPI) at the University of San Diego and modified, analyzed, and administered by the Center for Evaluation & Assessment (CEA) at the University of California Santa Barbara (UCSB) in partnership with the Santa Barbara Foundation; and
3) focus groups for nonprofit workforce professionals that were designed, facilitated, and analyzed by the Center for Evaluation & Assessment (CEA).
Data sources
IRS Business Master File (BMF) of exempt organizations, circa 2022.
This data source was used to analyze data on the number of public charities and private foundations, classified by subsector based on groupings of National Taxonomy of Exempt Entities (NTEE).
Labor Market Information Division, California
Economic Development Department (2021)
This data source was used to summarize nonprofit employment and wages.
IRS Form 990 and 990-EZ public charity returns, circa 2012-2020 (IRS e-File and GuideStar digitized datasets)
This data source was used to analyze trends in nonprofit financials, including the sector’s revenues, assets, and expenses.
2022 Annual nonprofit leader survey of Santa Barbara County
This survey of 160 nonprofit leaders collected information on nonprofits’ demand for services, financial outlook, organizational capacity, and sector trends. The survey was administered online between July and September 2022 and is a convenience sample of Santa Barbara County’s nonprofit sector. Demographic on participating nonprofits is provided on pages 4-5.
2023 Santa Barbara County nonprofit workforce focus groups
In order to capture diverse perspectives from across the county, focus groups were formed consisting of frontline workers in the nonprofit industry. An open call to participate was distributed, similar to the nonprofit leader survey, and those who expressed interest were invited to attend a focus group. Additionally, a "make-up" session was offered for those who were unable to attend. These sessions took place throughout January and February 2023, paying specific attention to nonprofit location and size.
Data notes
Percentages in this report may not always total 100% due to rounding.
Data in tables may not equal totals due to individual information withheld in 990/EDD data due to privacy concerns.
As majority of nonprofits are relatively small, unless otherwise noted, data presented from IRS 990 does not include higher education, hospitals, and Direct Relief, as these organizations represent more than half of total revenue and expenses in Santa Barbra County’s nonprofit sector.
2
Analysis
The data analysis involved both quantitative and qualitative methods. The analysis also included cross-referencing the quantitative and qualitative data to look for patterns across responses.

The quantitative analysis involved both descriptive (e.g., frequencies, percentages, means, etc.) and comparative statistics (e.g., crosstabs, chi-square, t-tests, etc.). The data were cleaned to eliminate missing data or questions answered outside the realm of possible responses. The results were arranged into tables and visualizations to facilitate a clear representation of the data.
The qualitative analysis comprised four main steps: data cleaning, emergent coding review, secondary coding, and exemplar quotation identification. An open coding process was used to analyze qualitative data and identify patterns and themes from the raw data. Once the codes emerged, the data were re-analyzed utilizing these codes and cross-referenced between emerged codes. The code categories were then individually assessed, and exemplar quotations were selected to provide rich insights into the code categories. Quotations were edited and amended for grammar and clarity. As qualitative data are fluid in nature, themes were not mutually exclusive, and many of the same coded segments of open-ended responses were represented in multiple categories.
3 Transition House
Leader Survey Participating Organizations
160 Santa Barbara County nonprofit leaders provided information on their organizations' workforce, demand for services, financial outlook, organizational capacity, and sector trends.
An online survey was conducted from July to September 2022 to gather data from the nonprofit sector in Santa Barbara County. The survey used a convenience sample of nonprofit organizations in the county. Although the survey sample represents the geographic headquarters of nonprofits throughout the county, it overrepresents Human Services nonprofits and underrepresents Religion nonprofits compared to the registered nonprofits in the county. Additionally, smaller organizations (budgets less than $250,000) are underrepresented, while larger organizations (budgets over $10 million) are overrepresented.
The State of Nonprofits in SB County |
Leader Survey Participating Organizations Outside of SBC South Mid North 0% 71% 15% 14% 6% 71% 11% 12% Surveyed sample (n=99) SBCountynonprofits (n=855) Participating organization’s headquarters
Based on IRS Form 990 and 990-EZ public charity returns, 2020 1 1 4 7% $50,000 or less 21% $50,001 - $250,000 27% $250,001 - $1 million 28% $1,000,001 - $5 million 11% $5,000,001 - $10 million 8% Greater than $10 million 26% 33% 19% 14% 3% 4% Participating organizations by budget size Surveyed sample (n=160) SB County nonprofits (n=855)1
Participating organizations by sector (n=160)
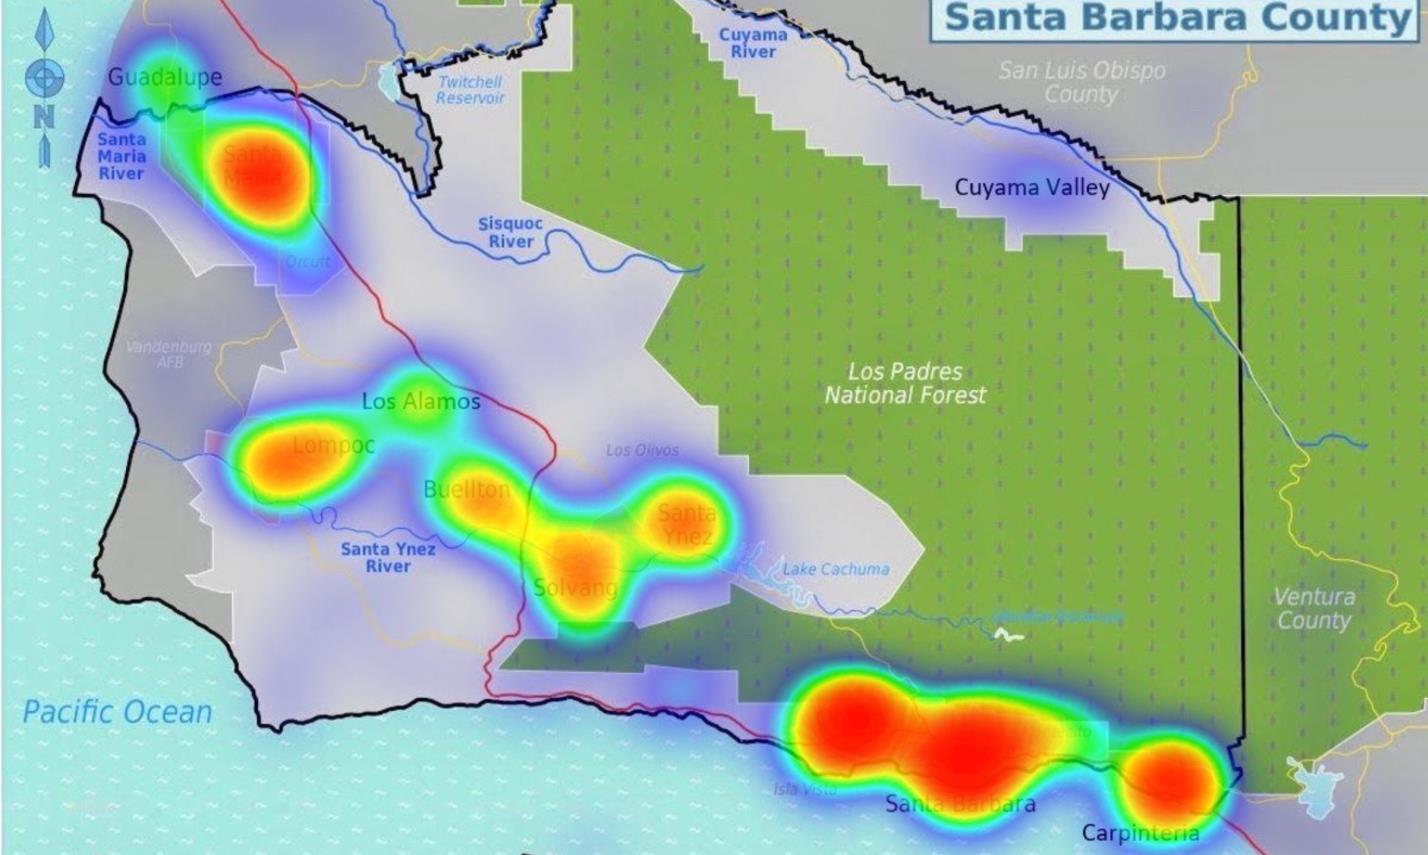
To gain insights into the distribution of nonprofit services across Santa Barbara County, surveyed leaders were asked about the physical locations where their organizations offer services.
The resulting heat map provides a visual representation of the regions served by the participating nonprofit organizations, with the color red indicating the highest percentage of organizations providing services in a particular location.
Percent of surveyed organizations that provide services by location (n=153)

As shown in the heat map and histogram, Santa Barbara (72%) and Goleta (58%) are the physical locations where the organizations in our sample provide services most frequently, while Isla Vista (7%) is the least serviced location.
| The State of Nonprofits in SB County High Low Concentration
of participating organizations
7% 10% 16% 20% 25% 33% 33% 43% 51% 52% 58% 72% Isla Vista
Valley Montecito
Ynez
Carpinteria
Cuyama
Guadalupe Solvang Buellton Santa
Lompoc
Santa Maria Goleta
Santa Barbara
Leader Survey Participating Organizations 5
CommUnify 211 Call Center 6
Santa Barbara Nonprofit Sector Profile
The nonprofit sector plays a vital role in the Santa Barbara County community, providing a range of services and support to residents. As of 2022, there were 2,078 registered nonprofit organizations operating throughout Santa Barbara County, serving a population of approximately 448,000 people.
The nonprofit sector in Santa Barbara County is diverse, with organizations dedicated to a range of causes, including health and wellness, education, social services, the environment, and the arts. Many of these organizations are small and grassroots, while others are larger and more established.
This section of the report provides an overview of the registered nonprofits in the sector, including a breakdown of its subsectors. It also compares Santa Barbara County's nonprofit sector to similar counties and examines the sector's growth.
7
Based on the data from the IRS in 2022, the nonprofit sector in Santa Barbara County is comprised of 2,078 registered nonprofits and 285 private foundations, along with 455 501(c) tax-exempt organizations in the county that do not fall under the classification of nonprofit or private foundation.
Santa Barbara County domestic 501(c) tax exempt organizations, June 2022
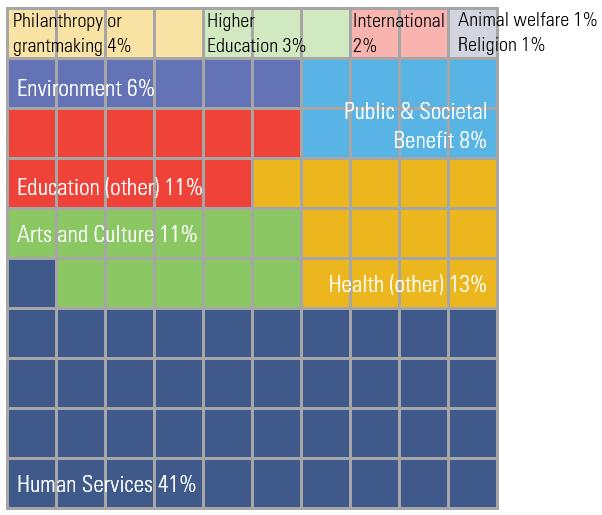
This report focuses on 501(c)(3)nonprofits operating in Santa Barbara County. Of the 2,078 501 (c)(3)nonprofits in Santa Barbara County, the majority fall under the categories of Human Services (26%) and Religion (20%). Other significant categories include Education (14%), Public and Societal Benefit (12%), and Arts, Culture, and Humanities (13%). The remaining categories each account for less than 10% of the total number of nonprofits.
Santa Barbara County registered 501(c)(3) nonprofits by subsector, June 2022
The State of Nonprofits in SB County | Nonprofit Sector Profile
Tax Exempt Organizations Count % Change from 2021 to 2022 501(c)(3) Organizations 2,363 2.38% 501(c)(3) Nonprofits 2,078 2.41% 501(c)(3) Private Foundations 285 2.15% Other 501(c) Organizations 455 -5.60% Total 501(c) Organizations 2,818 1.00%
Subsector Count % Human services 533 26.0% Religion 406 20.0% Education 287 14.0% Arts, culture, and humanities 266 13.0% Public and societal benefit 251 12.0% Health (other than hospitals) 138 7.0% Environment 137 7.0% International 35 2.0% Higher education 7 0.3% Hospitals 6 0.3% Mutual benefit 5 0.2% Unknown 7 0.3% Santa Barbara County 2,078
501(c)(3) Nonprofits Table of Subsector Breakdown 501(c)(3) Private Foundations Other 501(c) Organizations Total 501(c) Organizations
Note: Throughout the rest of the report, Mutual Benefit and Unknown subsectors are excluded from tables in which there is a subsector breakdown. 2 2 8
When compared to select California counties for the period of 2021 to 2022, Santa Barbara County's growth rate is higher than two comparable counties (although lower than Monterey County) and slightly lower than that of California and the United States. Despite the decrease in nonprofits from 2020 to 2021, the sector has seen an overall increase of 5.6% from 2018 to 2022.
| The State of Nonprofits in SB County Nonprofit Sector Profile
Region 2018 2019 2020 2021 2022 PCT Change 2021 → 2022 Marin County 1,797 1,839 1,854 1,853 1,874 1.13% Sonoma County 2,112 2,155 2,197 2,231 2,266 1.57% Santa Barbara County 1,968 2,017 2,056 2,029 2,078 2.41% Monterey County 1,300 1,343 1,376 1,378 1,424 3.34% California 133,521 137,037 141,042 142,105 147,460 3.77% United States 1,202,420 1,240,571 1,281,986 1,298,214 1,345,450 3.64%
Registered 501(c)(3) nonprofits in select counties, June 2022
9
In terms of number of organizations, Santa Barbara County saw a slight decrease of 1.31% in the number of registered 501(c)(3) nonprofits from 2020 to 2021. Despite this decline, as of June 2022, Santa Barbara County has increased its number of nonprofits to exceed pre-pandemic levels.
Overall, the data suggests that the number of tax-exempt organizations, specifically 501(c)(3) nonprofits, is growing in Santa Barbara County, albeit at a slightly slower rate compared to some areas in California and the United States.
change) in the number of nonprofits
The State of Nonprofits in SB County | Nonprofit Sector Profile 2.6% 2.5% 1.9% -1.3% 2.4% 3.4% 2.6% 2.9% 0.8% 3.8% 3.7% 3.2% 3.3% 1.3% 3.6% -2.0% -1.0% 0.0% 1.0% 2.0% 3.0% 4.0% 5.0% 2018 2019 2020 2021 2022 United States California Santa Barbara County
(%
Growth
10
Exploring variations in nonprofit levels by subsector, from 2021 to 2022, most subsectors saw an increase in the number of registered nonprofits, with Higher Education and Education (other) being the only exceptions, albeit these decreases represent a slight decrease in terms of organizations.
Registered 501(c)(3) nonprofits in Santa Barbara County by subsector, June 2022
As previously mentioned, this is in sharp contrast to the previous year (2020 to 2021) which saw a decrease in Santa Barbara County nonprofits throughout subsectors.
Overall, these data show that the nonprofit sector in Santa Barbara County is diverse and dynamic, with different subsectors experiencing different rates of growth.
| The State of Nonprofits in SB County Nonprofit Sector Profile
Subsector 2018 2019 2020 2021 2022 % Change 2020 → 2021 2021 → 2022 Arts, culture, and humanities 254 260 268 260 266 -2.99% 2.31% Higher education 8 8 9 9 7 0.00% -22.22% Education 291 294 296 288 287 -2.70% -0.35% Environment 117 120 127 130 137 2.36% 5.38% Hospitals 4 4 5 5 6 0.00% 20.00% Health 131 134 139 135 138 -2.88% 2.22% Human services 491 521 521 519 533 -0.38% 2.70% International 40 39 39 34 35 -12.82% 2.94% Public and societal benefit 250 247 251 242 251 -3.59% 3.72% Religion 371 380 389 396 406 1.80% 2.53% Santa Barbara County 1,968 2,017 2,056 2,029 2,078 -1.31% 2.41%
11
Shoppe Grocery 12
Unity
Nonprofit Sector Employment
The nonprofit sector in Santa Barbara County is a significant employer, with over 15,000 individuals working in various roles for nonprofit organizations as of 2021. This accounts for approximately 7.5% of the county's workforce, and the number of nonprofit jobs has been growing incrementally in recent years.
The employment opportunities in the nonprofit sector in Santa Barbara County are diverse, with jobs ranging from direct service providers in health care, education, and social services to administrative and support positions. This section of the report provides insight into the employment, wages, challenges in hiring and retention, and experiences of nonprofit workers in the county.
13 Unity Shoppe Grocery
Nonprofits accounted for 7.5% of total employment in Santa Barbara County in 2021, with 15,304 people employed in the nonprofit sector.
The nonprofit sector in Santa Barbara County also saw growth in the number of nonprofits with paid employees, with an average of 616 organizations, a 2.7% increase from the previous year. Additionally, there was an increase in the total employment rate by 2.9%, employing more people than the previous year, and a 6.4% increase in total wages, indicating higher salaries for nonprofit employees in 2021.
Nonprofit employment in Santa Barbara County, 2021 CA Employment Development Department (EDD)
The State of Nonprofits in SB County | Nonprofit Sector Employment
Annual 2021 Count % Change 2020 → 2021 Average Number of Nonprofits with employees 616 Average Total Employment 15,304 Total Annual Wages $904,160,393 14 2.7% 2.9% 6.4%
While overall employment in Santa Barbara County has decreased, nonprofit employment in the county has steadily increased from 14,850 in 2019 to 14,870 in 2020 to 15,304 in 2021.
While total employment decreased 4.2% from 2019 to 2021, Total 501(c)(3) employment increased 3.1%.
The county's unemployment rate has been volatile, with a significant increase in unemployment rates from 2019 to 2020 (rising from 3.7% to 8.2%), to a slight decrease in 2021 (dropping from 8.2% to 5.8%). Although the unemployment rate has fluctuated and not yet fully recovered from the effects of the pandemic, the percentage of employment in Santa Barbara County accounted for by nonprofits has seen a steady moderate increase from 6.9% in 2019 to 7.5% in 2021.
Even though total unemployment rates increased from 2019 to 2021, SBC 501(c)(3) employment increased during this same time period.
| The State of Nonprofits in SB County Nonprofit Sector Employment
214,500 200,200 205,400 2019 2020 2021 Total SB County employment 14,850 14,870 15,304 2019 2020 2021 Total SB County 501(c)(3) employment
6.9% 7.4% 7.5% 2019 2020 2021 SB County 501(c)(3) employment 3.7% 8.2% 5.8% 2019 2020 2021 SB County unemployment rate
15
Source. 2021 CA Employment Development Department (EDD)
Looking at nonprofit employment by organizational size shows that most nonprofits (63%) had less than 10 paid employees, while only a small percentage (4%) had 100 employees or more. This is aligned with the overall rates for California (60% of nonprofit organizations have less than 10 employees).
Looking at employment by subsector, the Human Services subsector emerged as the largest in terms of the number of nonprofits, percentage of nonprofits, total employment, and wages. The Health (other than hospitals) subsector also accounted for a larger number of the nonprofits, total employment, and wages in Santa Barbara County, suggesting that there is also a high demand for organizations that focus on healthcare.
The State of Nonprofits in SB County | Nonprofit Sector Employment
Subsector Average # of nonprofits % of nonprofits Total annual wages Average Total employment % of total employment Human services 245 40% $211,568,040 5,152 34% Health 97 16% $194,658,969 2,704 18% Education 52 8% $64,850,836 1,150 8% Arts, culture, and humanities 56 9% $25,764,838 563 4% Environment 30 5% $20,313,999 478 3% Public and societal benefit 37 6% $16,423,925 374 2% International 10 2% $14,125,974 181 1% Religion 22 4% $7,184,559 189 1% Santa Barbara County 616 $940,160,393 15,304
Nonprofit employment in Santa Barbara County, 2021 CA EDD
44% 0-4 19% 5 to 9 16% 10 to 19 12% 20-49 5% 50-99 4% 100 or more # of paid employees 16
Nonprofit employment by organization size, 2021 CA EDD (n=616)
Responses from the current sample of nonprofit leaders provided additional insights and predictions for the nonprofit sector employment in Santa Barbara County.
The survey results indicate that 90% (n=144) of nonprofit leaders had paid employees (excluding independent contractors), with most nonprofits reportedly having less than 10 paid employees (46%), consistent with the data reported by the California (CA) Employment Development Department (EDD).
Number of paid employees at participating nonprofits (n=158)
The survey findings also revealed that Santa Barbara County nonprofit leaders are anticipating growth in the sector, with 58% (n=81) of respondents predicting an increase in staff size within the next 12 months.
| The State of Nonprofits in SB County
10% 0 26% 1 to 4 20% 5 to 9 11% 10 to 19 16% 20-49 5% 50-99 12% 100 or more # of paid employees
58% 40%
2% Smaller Larger Same
Prediction of staff size in the next 12 months (n=140)
17 Nonprofit Sector Employment
What are the most pressing needs in terms of workforce hiring?
Nonprofit leaders, who participated in the leader survey, and frontline workforce members, who took part in focus groups, were asked to identify the most critical issues concerning workforce hiring. While both groups agreed on the importance of remote work flexibility and the ability to secure housing, frontline workers specifically highlighted the need for competitive salaries and finding qualified and experienced applicants. Nonprofit leaders, on the other hand, emphasized the challenge of competing with other nonprofits due to limited applicant pools and the impact of nonprofit location.
Nonprofit Frontline Employees
• Qualified and experienced applicants
• Competitive salary
BOTH Leaders and Frontline Employees
• Ability to secure housing
• Remote work flexibility
Nonprofit Leaders
• Competing with other nonprofits due to application pool size
• Nonprofit location
“The problem is that just trying to find people who are dedicated enough so that they could be able to carry out what our mission is and carry out whatever services that we have, because it is a lot of work for nonprofits. I know that nonprofits, they exhibit a lot of turnaround.”
The State of Nonprofits in SB County |
18 Nonprofit Sector Employment
What are the most pressing needs in terms of workforce retention?
Similarly, nonprofit leaders and frontline workforce members were asked to identify the most pressing workforce retention issues, and both groups highlighted several common concerns. These concerns encompassed the high cost of living, employee burnout, policies regarding remote or hybrid work, and the disparity between expectations and reality in nonprofit work. Nonprofit leaders also emphasized the challenge of applicants burdened by student debt, anxiety surrounding contracting COVID-19, and policies related to the pandemic. On the other hand, nonprofit employees specifically underscored the importance of professional development opportunities within the organization.
Nonprofit Frontline Employees
• Professional development within the organization
BOTH Leaders and Frontline Employees
• Cost of living
• Employee burnout
• Policies related to remote/hybrid
• Expectations vs reality
Nonprofit Leaders
• Applicants need to pay off student debt
• Anxiety about contracting COVID-19
• Policies related to COVID-19
“There's, lots of people, from the community that want to help out, they want to do the direct work, people that apply and get here and then they realize, "Oh, actually 20% of my time is meetings and then another percent of my time is grant writing." And then they get frustrated. When it boils down to it, they only get to spend a third of their time interacting with the work they want to do.”
| The State of Nonprofits in SB County
19 Nonprofit Sector Employment
Of the Santa Barbara County nonprofit leaders surveyed, 81% (n=114) reported hiring new staff in the last 12 months, while 73% (n=102) reported staff turnover and 56% (n=81) currently have job vacancies.

81% hired new staff in the last 12 months
73% have had staff leave their organization

56% of organizations currently have a vacancy

The State of Nonprofits in SB County |
Nonprofit Sector Employment 20
Considering that a large proportion (46%) of the nonprofits in our sample have fewer than 10 employees, it is consistent that the majority (60%) of these organizations hired between 1 to 5 staff members.
Approximate staff that have been hired or left in the past 12 months
| The State of Nonprofits in SB County 25% 35% 18% 13% 3% 7% 32% 28% 15% 16% 3% 6% 1 2 to 5 6 to 10 11 to 30 31 to 50 51 or more Hired (n=114) Left (n=102) # of staff
Nonprofit Sector Employment 21
Of the leaders who reported having a job vacancy, 100% reported that it negatively affected their ability to deliver services to varying degrees. Survey findings suggest that the current job vacancies are more closely linked to hiring challenges than to retention issues.
Extent to which vacancies are negatively impacting quality of services (n=81)
77% (n=88) of leaders reported difficulty hiring qualified employees while only 40% (n=57) said that their organization had difficulty retaining staff. For organizations that reported job vacancies (n=81), 80 percent said it was difficult to hire qualified employees, while only 31 percent said it was difficult to retain qualified employees. These findings suggest that hiring qualified employees presents more challenges than retaining them.
Difficulty in hiring & retaining employees
Extremely easy
Somewhat easy
Neither easy nor difficult
Somewhat difficult
Extremely difficult
The State of Nonprofits in SB County |
0% 17% 38% 31% 14% Not at all Very great extent Great extent Some extent Little extent
Nonprofit Sector Employment 22
39% 38% 18% 3% 2% 5% 35% 30% 19% 11%
Hire (n=114) Retain (n=142)
When analyzed by subsector and budget size, nonprofit leaders in the Environmental, Arts, and Human Services sectors more frequently reported difficulties in hiring qualified employees. Additionally, larger organizations -with budgets exceeding $5 million- were more likely to report facing hiring challenges.
Difficulty in hiring employees by subsector
Somewhat difficult
Environment (n=6)
Arts, culture, and humanities (n=12)
Human Services (n= 52)
Public & Human Benefit (n= 9)
Education (n=12)
Health (n=12)
Extremely difficult
Difficulty in hiring employees by budget size
Somewhat difficult
Greater than $10 million (n=10)
$5,000,001 - $10 million (n=15)
$1,000,001 - $5 million (n=40)
$250,001 - $1 million (n=29)
$250,000 or less (n=20)
Extremely difficult
| The State of Nonprofits in SB County
33% 50% 22% 35% 50% 50% 25% 25% 56% 48% 33% 50%
40% 31% 38% 53% 30% 35% 24% 48% 40% 60%
23 Nonprofit Sector Employment
Hiring Challenges
Among the surveyed leaders who reported challenges in hiring qualified employees (those who said hiring was extremely or somewhat difficult), the greatest difficulties were encountered in filling entry- and mid-level positions, particularly those that provide direct program services, require licensing or special certification, and administrative operations roles. Among senior-level positions, recruiting for fundraising and development positions presented the most difficulties.
Difficulty in hiring by position and career level (n=84)
Difficulty in hiring by career level
“The sources of competition have changed in recent years, with a broader range of jobs and industries now competing for the same employees. This is a result of larger organizations (Target, In-n-Out, Trader Joe's, Amazon, etc.) increasing their entrylevel wages at a much faster pace than most nonprofits are able to themselves.”
The State of Nonprofits in SB County |
Technology Data/Evaluation Human resources Finance accounting Marketing/communications Fundraising/development Admin operations Licensed or specially certified staff Program/direct services 6% 6% 6% 5% 13% 18% 35% 29% 46% 7% 7% 8% 14% 16% 18% 23% 26% 44% 2% 4% 7% 10% 6% 21% 5% 10% 7%
Entry Mid-level Senior 42% 38% 19% Entry level Mid-level Senior
24 Nonprofit Sector Employment
Retention Challenges
Similarly, nonprofit leaders who faced challenges in retaining qualified employees (those who said hiring was extremely or somewhat difficult), reported the greatest difficulties in retaining mid- and entry-level positions, particularly those involving direct program services, licensing or special certification, or administrative operations. In contrast, retention challenges at the senior level were more evenly distributed across positions.
Difficulty in retention by position and career level (n=53)
Difficulty in retention by career level
“Folks are NOT paid enough or compensated enough. Many employees are unable to stay with the organization, and those that make it work are constantly stressed financially. In general, it manifests in different ways from anxiety, stress, poor performance, low morale, frustration and resentment, inability to stay in the job, having to move, and more.”
| The State of Nonprofits in SB County
Human resources Marketing/communications Technology Data/Evaluation Finance accounting Fundraising/development Admin operations Licensed or specially certified staff Program/direct services 8% 2% 11% 13% 9% 13% 25% 28% 51% 9% 19% 15% 17% 23% 30% 23% 32% 43% 6% 6% 4% 6% 8% 9% 9% 9%
Entry Mid-level Senior
41% 46% 13% Entry level Mid-level Senior
25 Nonprofit Sector Employment
Leaders were also asked about the factors that impacted their organization's ability to recruit staff. The most cited challenges were providing competitive salaries, the ability of potential employees to secure local housing, and offering competitive benefits.
Ability to secure local housing
Competitive benefits package
Policies related to remote/hybrid work
Factors affecting an organizations ability to recruit staff (n = 137) Nonprofit Sector Employment
Anxiety about contracting COVID-19 while at work
Policies related to COVID-19
Applicant needs to pay off student debt
Other
“Funding for operating expenses continue to be a challenge. We need to invest in the staff to invest in our programs. We also utilize independent contractors. Trying to find ways to incentivizes these independent contractors to work with us can also be challenging.”
The State of Nonprofits in SB County |
18% 7% 7% 10% 14% 49% 53% 78%
Competitive salary 26
In addition to discussing their hiring challenges, leaders who reported difficulties in staff retention were also asked about the factors impacting their organization's ability to retain employees. Most often leaders cited challenges such as the high cost of living, ability to offer competitive salaries, and preventing employee burnout as significant factors affecting retention.
Factors affecting an organizations ability to retain staff (n = 54)
Cost of living
Inability to pay competitive salaries
Employee burnout
Inability to offer competitive benefits
Employees' inability to secure adequate childcare
Policies related to remote/hybrid work
Other
“As a nonprofit that provides services on a sliding scale, we are unable to sufficiently compensate employees because it would require an increase in cost of services to the community. Therefore, we can't retain folks as we would like.”
| The State of Nonprofits in SB County
7% 17% 20% 44% 52% 72% 83%
27 Nonprofit Sector Employment
What are the impacts of workforce vacancies on your organization?

Nonprofit workforce members who participated in focus groups described how workforce vacancies have impacted both themselves and their organizations. The most frequently mentioned impacts mentioned were lack of capacity, employees leaving the organization or the sector, employees overextending themselves, and delays in completing work or providing certain services. Generally, respondents acknowledged the need to prioritize essential tasks despite the possibility of some tasks or services being overlooked due to workforce vacancies. Although respondents mentioned experiencing burnout, they emphasized the importance of pushing through because they knew their team relied on them and because they were passionate about their work.
Delays/inability to work

“It just takes longer to get everything done, because there just aren't enough people, it’s kind of... centralized where it's like events and graphic design and things like that, where the turn around should be quicker. They are the ones that are really feeling the burnout and being overwhelmed.” “Emails get missed. Meetings get missed. Things that you requested fall through the cracks.”
Lack of capacity
“People are totally maxed out way beyond 100%. … Programs just aren't as good as you would like them to be. You can't deliver as much as you're hoping to, because you're just trying to get it done.”
“We can't do everything… with our finite resources and time available, we need to stay focused.


Over-extended employees
“The work has to get done… some things fall through the cracks, but in the end of the day, everyone's going to be working harder to pick up people that are missing.”
“We all wear a lot of hats... we are going to need to grow and add stuff, but it won't come until after... each of us has maxed out on our capacity and are struggling."
Leaving the org. or sector
“People are just even leaving the sector… they're looking to go to the for-profit sector because they get off of [work] more, a little more flexibility.”
“It doesn't seem like people are interested in the 20 years of good work anymore. It's like you've got to get a lot out of somebody and they're moving on.”

The State of Nonprofits in SB County |
28 Nonprofit Sector Employment
To address issues in employee retention, nonprofit leaders responded by increasing wages and benefits, and providing more flexibility in remote work, or plan to do so within the next 12 months. Additionally, leaders also provided other examples of actions they’ve taken to retain employees including provision of bonuses, increasing the nonprofit’s focus on building a positive organizational culture, and providing more training opportunities to support their employees.
Actions to retain employees (ns=119→134)
“Even if we are offering a competitive range in the marketplace, [it] cannot compare with the astronomical cost of housing. Younger staff tend to leave the area when they start their own families. We have two people who have just given notice for that reason: one is moving out of state and the other is moving south of Los Angeles. Several of our staff, including the executive director, have relocated to Ventura, but the commute is hugely impactful these days.”
| The State of Nonprofits in SB County
11% 55% 68% 83% 0% 9% 3% 10% Other Increased benefits Increased flexibility in remote work Increased wages
Yes Not yet, but expected in next 12 months
29 Nonprofit Sector Employment
Many leaders identified burnout as a significant challenge to retaining qualified staff and reported various ways in which it manifests in their organizations. While a minority of leaders (n=20, 15%) indicated that employee burnout was not applicable for their organization, most reported that burnout was evident in staffing shortages that left employees stretched too thin, as well as mental health challenges and dissatisfaction with work-life balance among staff.
Manifestation of burnout in organizations (n=130)
Staffing shortages leaving employees stretched too thin
Mental health challenges
Dissatisfaction with work-life balance
Employees feeling underappreciated
Physical health challenges
Not applicable for our organization
Lack of motivation
Other
The State of Nonprofits in SB County |
3% 15% 15% 17% 19% 35% 45% 68%
30 Nonprofit Sector Employment
How is burnout manifesting in your organization?
Nonprofit workforce members provided additional insights into the impact of burnout on themselves and their organizations. Participants emphasized feeling overwhelmed and stretched too thin, expressing dissatisfaction with work-life balance, and experiencing a lack of motivation and purpose. Despite these challenges, many workforce members also expressed their determination to push through and continue their work.
Feeling stretched too thin
“We work seven days a week. We don't take holidays. We don't take Christmas off and stuff like that, that makes it a lot more difficult…I'm taking a vacation... for the first time in three years. But even then, I can't actually take it all the way off because everything comes through me…It's kind of hard to unplug.”
Dissatisfaction with work-life balance

“There's not enough breaks…when you're in a position like mine where I am handling a lot of different things at once… if I'm not there then things don't happen… especially, if there is not enough staffing or coverage to be able to accommodate you as you try to take time off.”
Waning motivation and sense of purpose
“It manifests as like what's the point of a nonprofit? Does it make more sense to have a business? Do the same good work?”


Pushing through because of the mission
“When you're passionate about something, you're going to want to make sure that even if you're kind of down, you're going to get up the next day, you're going to [say] ‘Okay, it's a new day, I have to get this done, this person is depending on me.”
| The State of Nonprofits in SB County
31 Nonprofit Sector Employment
Additionally, a substantial number of leaders (68%, n=86) reported that they have increased remote work flexibility the past year to retain staff. Out of 131 leaders who provided information on remote work arrangements, the majority (31%) reported that their entire workforce works at least partially remote. While 27% reported that only 1-20% of their workforce works partially remote, and 11% reported that none of their staff works remotely.
Percentage of workforce working at least partially remote (n=131)
% working remote
The State of Nonprofits in SB County |
11% 27% 12% 5% 7% 6% 31% 0% 1-20% 21-40% 41-60% 61-80% 81-99% 100%
32 Nonprofit Sector Employment
“There are not enough human beings who are qualified … to fill all the positions needed in our county. The pay is not adequate to live in this town. Housing is unaffordable. The work is challenging and cannot be done remotely, and the timing is not flexible, so it is impossible to create the work conditions that employees would like.”
Employment issues nonprofit leaders are encountering as described in the leader survey
58%
Of leaders' responses highlighted nonprofit employment issues centered around funding for employees’ salary & cost of living.
14%
Of leaders’ responses discussed nonprofit employment issues centered around lack of staffing & staff capacity.
12% Of leaders’ responses described nonprofit employment issues highlighted staff recruitment.
“I think we need to have an honest conversation about the nonprofit sector's inability to be flexible in meeting the needs of working families and others. An old guard exists that is the gatekeeper for harmful and exploitative practices. The sector is underpaid, and staff requests flexibility in their work schedule that will offset the low pay and long hours. There is a lack of advocacy for the nonprofit sector workers; I would like to see unions formed; we are altruistic, yet nobody advocates for us.”
| The State of Nonprofits in SB County Nonprofit Sector Employment
33
34
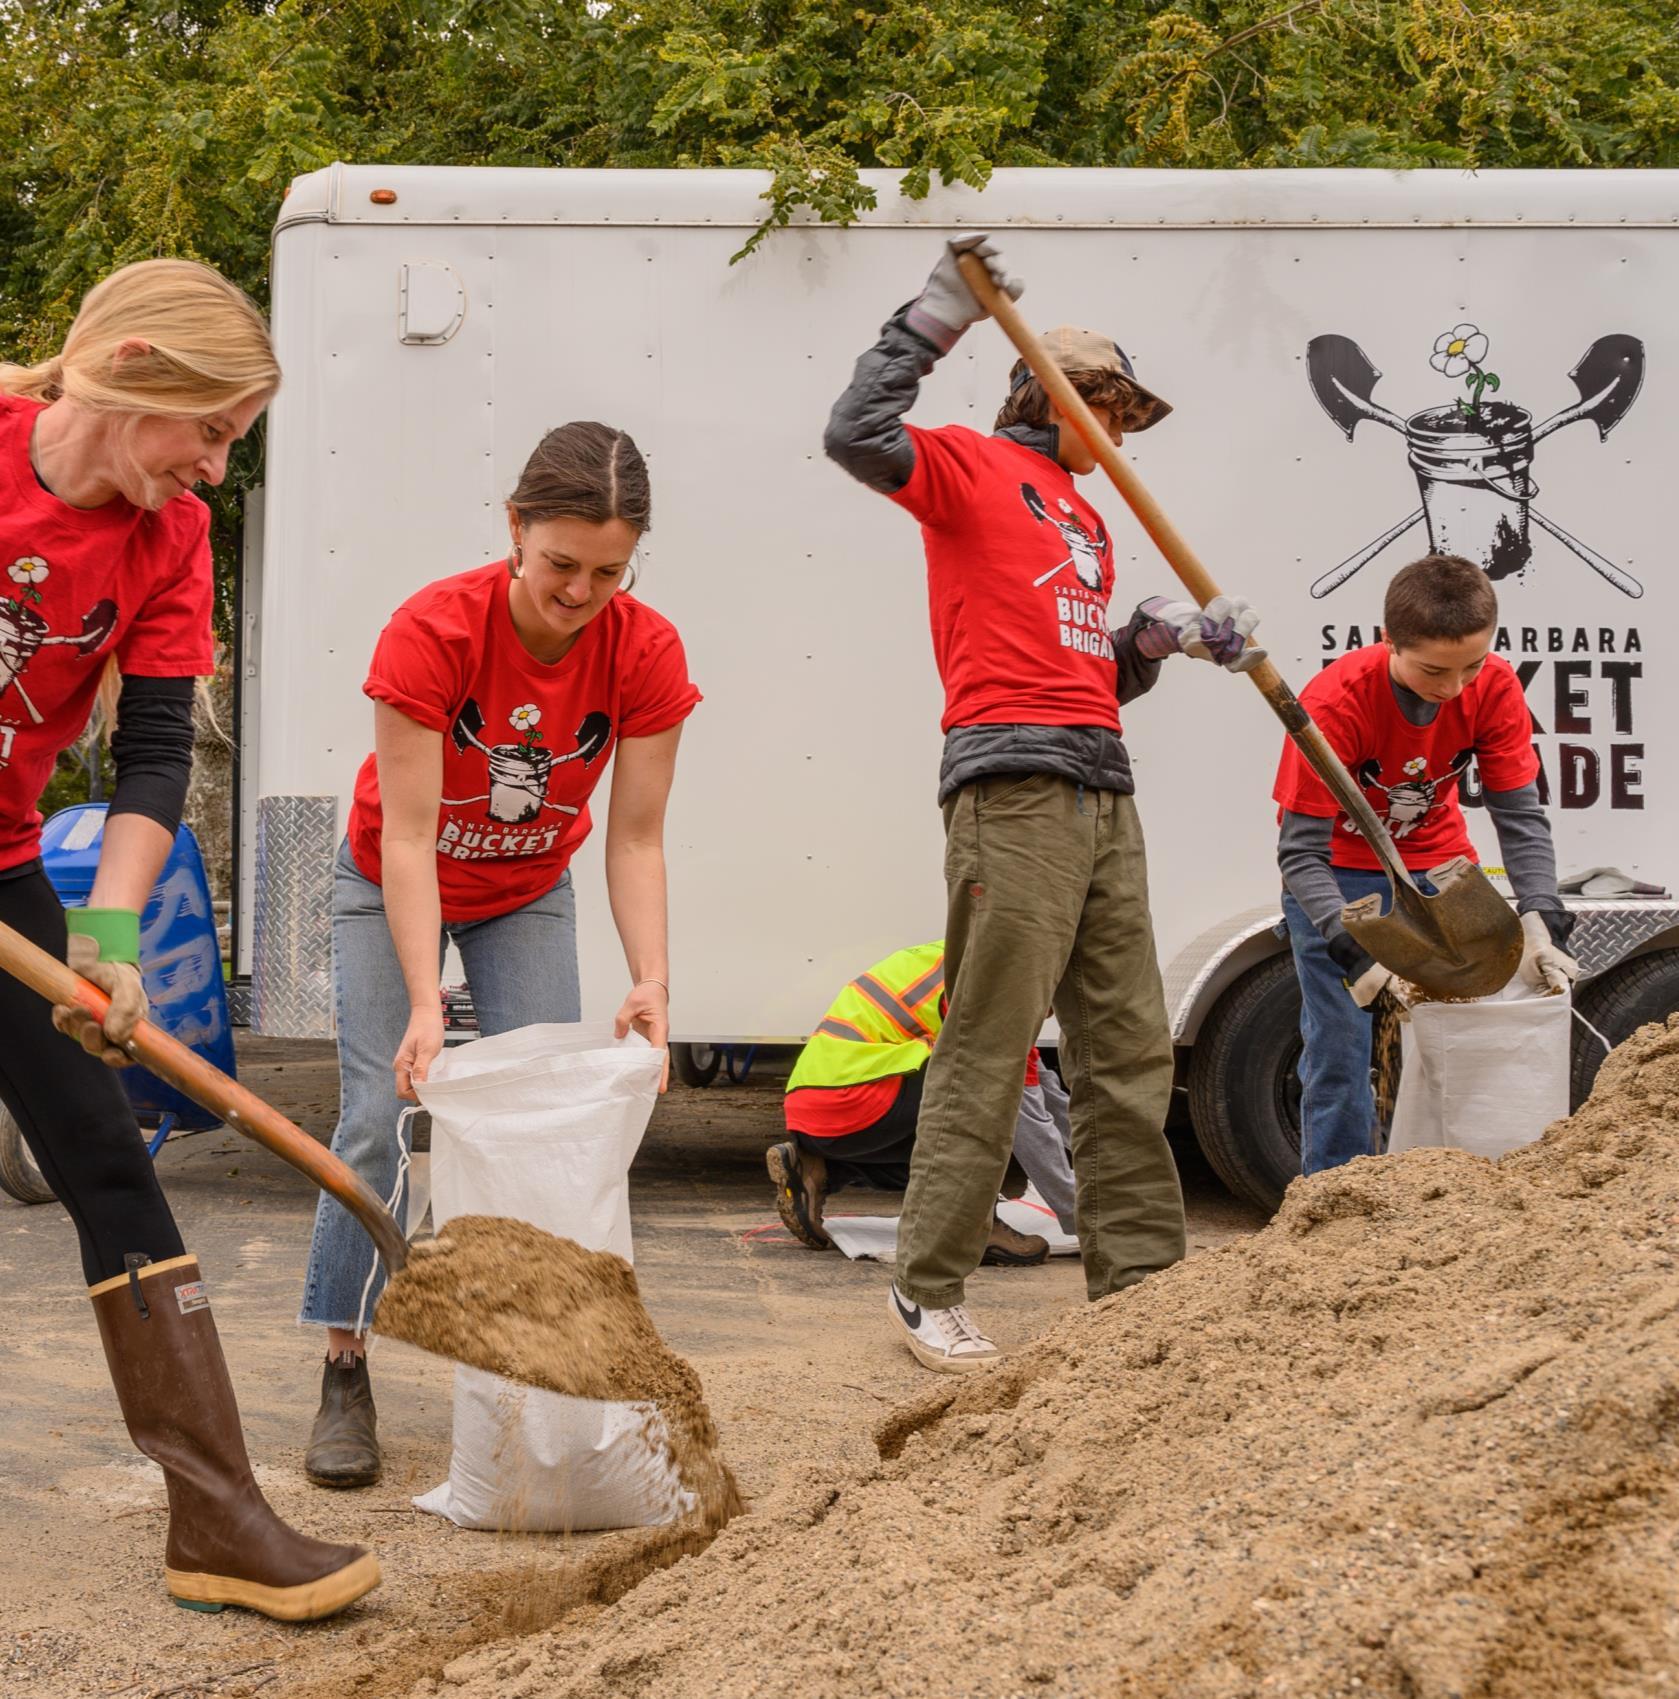
Bucket Brigade
Nonprofit Boards & Volunteers
Santa Barbara County’s nonprofit sector relies heavily on the contributions of dedicated volunteers and board members who are passionate about making a positive impact in their community. These individuals bring a wide range of skills and expertise to their respective roles, which are vital to the success of these organizations.
Board members typically provide strategic guidance and oversight to nonprofits, while volunteers play a critical role in supporting these organizations by contributing their time and skills to further the nonprofit's mission.
This subsection provides an overview of the nonprofit board and volunteer information in Santa Barbara, including information on sub-sectors and the crucial role of volunteers in supporting the county's nonprofits.
35
The nonprofit leader survey results indicated that a substantial percentage of respondents, 84%, reported actively engaging volunteers (excluding board members). While the survey's sample primarily consisted of nonprofits with paid employees (90%, n=144), it's worth noting that in California most nonprofits approximately 70% operate without paid employees and depend solely on volunteers.
Among the nonprofit leaders who participated in the survey, a substantial portion (26%, n=33) reported engaging 10 or fewer volunteers in the past 12 months. Additionally, findings suggest that smaller organizations tended to rely more heavily on volunteers compared to larger nonprofits.
Notably, leaders of organizations without paid employees (n=15) generally reported a smaller average number of volunteers compared to leaders of organizations with paid staff (n=112).
The State of Nonprofits in SB County |
26% 10 or fewer 20% 11 to 20 17% 21 to 40 13% 41 to 60 24% 61 or more
84% of participating leaders said that they engage nonprofit volunteers
Nonprofit Boards & Volunteers 36
Number of volunteers engaged by surveyed organizations (n=127) # of volunteers
3 California Association of Nonprofits & The Nonprofit Institute. (2019). 3
Between 2019 and 2020, there was a significant decline in both the total number of volunteers and board members for nonprofit organizations, which is most likely attributed to the impact of the COVID-19 pandemic. The number of volunteers dropped by 25,356, representing a staggering 47% decrease. Similarly, the total number of board members also decreased by 1,442, or 28%. Despite these declines, the number of nonprofits remained relatively constant during this time.
Nonprofits, board members, and volunteers reported in form 990 data FY2020
While the total number of nonprofits remained the same between 2019 and 2020, the number of board members decreased by 28%, and volunteers decreased by 47%.
| The State of Nonprofits in SB County
54,364 29,008 2019 2020 Total volunteers 5,156 3,714 2019 2020 Total board members 501 501 2019 2020 Total nonprofits
Nonprofit Boards & Volunteers 37
The impact of the decline in the number of board members and volunteers was not consistent across all subsectors, with some subsectors experiencing more significant decreases than others. Religion and Environment nonprofits had the most significant drop in volunteers, with a 94% and 74% decrease, respectively. Similarly, Environment and International subsectors experienced the largest decrease in total board members, with a 57% and 50% decline, respectively.
Board members & volunteers by subsector, form 990 in FY2020
The State of Nonprofits in SB County | Nonprofit Boards & Volunteers
Subsector # of nonprofits Board members Volunteers Total % change Total % change 2019 2020 2019 2020 2019→2020 2019 2020 2019→2020 Arts, culture, and humanities 65 65 785 570 -27% 4,827 2,473 -49% Education 79 80 1,004 921 -8% 6,334 5,598 -12% Environment 40 40 313 135 -57% 6,935 1,834 -74% Health 52 54 624 369 -41% 3,163 1,530 -52% Human services 172 168 1,608 1,172 -27% 23,519 10,788 -54% International 16 15 165 83 -50% 2,850 2,069 -27% Public and societal benefit 57 57 571 415 -27% 5,794 4,664 -20% Religion 20 22 86 49 -43% 942 52 -94% Santa Barbara County 501 501 5,156 3,714 -28% 54,364 29,008 -47%
38
The decrease in the number of board members and volunteers was not consistent across all organizational budget sizes. Organizations with budgets between $10-20 million experienced greater decreases in both board members and volunteers.
Board members & volunteers by budget size, form 990 in FY2020
| The State of Nonprofits in SB County Nonprofit Boards & Volunteers
Budget Size # of nonprofits Board members Volunteers Total % change 2019→2020 Total % change 2019→2020 Above $20M 13 190 -33% 2,732 -11% $10M to $20M 13 158 -39% 1,572 -66% $5M to $10M 28 373 -18% 2,819 -31% $1M to $5M 122 1,107 -18% 10,163 -51% $250,000 to $1M 159 1,032 -34% 8,083 -54% $50,000 to $250,000 123 720 -31% 3,470 -12% $50,000 and below 43 134 -32% 169 -30% Santa Barbara County 501 3,714 -28% 29,008 -47%
39
Highlighting the essentialness of volunteers in Santa Barbara County’s nonprofit sector, the majority of nonprofit leaders surveyed said that volunteers were important to delivering their organization’s mission, with 41% indicating that volunteers are absolutely essential.
Organizational leaders who operated with an all-volunteer model (no paid employees) more frequently emphasized the significant importance or absolute essentialness of volunteers in fulfilling their organization's mission, as compared to counterparts who managed organizations with paid staff.
Importance of volunteers in delivering mission (n=126)
On average, leaders estimated that 53% of their organization’s volunteers engage in long term volunteering (volunteering regularly) while 47% engage in short term volunteering (once or for special events).
The State of Nonprofits in SB County |
2% 6% 24% 28% 41% Absolutely
Very
Moderately
Of
40 Nonprofit Boards & Volunteers
essential
important
important
little
importance
Not at all
Although nonprofit leaders highlighted the importance of volunteers, 40% of them reported difficulties in recruiting the necessary volunteers to fulfill their organization's mission.
Out of the 50 leaders who expressed difficulty in recruiting volunteers, most stated that it adversely affected the quality of services provided by their organization to some extent.
Nonprofit leaders who rely solely on volunteer support more often reported difficulty in recruiting the necessary volunteers to fulfill their organization's mission compared to leaders with paid employees. Consequently, this directly affected the quality of services provided by their respective organizations.
| The State of Nonprofits in SB County
6% 27% 27% 30% 10% Somewhat difficult Neither easy nor difficult Moderately easy Extremely difficult Very easy Difficulties in recruiting volunteers (n=125) 10% 6% 58% 20% 6% Great extent Some extent Little extent Very great extent Not at all Impact on the quality of services delivered (n=50)
41 Nonprofit Boards & Volunteers
Santa Barbara Rescue Mission 42
Diversity, Equity, Inclusion, and Access (DEIA)
Diversity, equity, inclusion, and access (DEIA) are important concerns for nonprofits operating in Santa Barbara County, as they strive to serve all members of the community in an inclusive and accessible manner.
This section of the report features insights from leaders and members of the nonprofit workforce, who discuss pressing needs related to DEIA and the challenges they have encountered. They also highlight strategies that their organizations have implemented to promote DEIA, such as diversifying leadership and staff, incorporating equity approaches into program delivery, and seeking community input to better understand community needs.
Furthermore, this section presents demographic information that is relevant to DEIA in Santa Barbara County nonprofits. This includes an examination of the representation of diverse populations in leadership and board members.
Santa Barbara Rescue Mission 43
Nonprofit leaders reported on the actions their organizations have taken to advance DEIA. The most common practices implemented by responding organizations were related to diversifying their board members (72%) and job candidates (69%)
While only 25% of the leaders stated that their organizations have provided specialized DEIA training to board members, 36% indicated that they plan to implement such training within the coming year. Additionally, a small number of leaders mentioned other practices that their organizations have implemented, including creating systems change and conducting DEI organizational assessments.
Actions nonprofits have taken to promote DEIA (ns=138→142)
Implemented practices to increase the diversity of board members
Implemented practices to increase the diversity of job candidates
Integrated an equity-oriented approach into program delivery
Sought community input to better understand needs
Provided specialized training for staff on DEIA
Provided specialized training for board members on DEIA
The State of Nonprofits in SB County |
25% 50% 53% 63% 69% 72% 36% 23% 22% 18% 18% 18% Yes Not yet, plan to next year
Diversity, Equity, Inclusion, & Access 44
What are the most pressing needs in terms of DEIA issues?

Nonprofit workforce members described several pressing needs related to DEIA, including the need for more training, expanding inclusivity, and securing additional funding and time. Respondents expressed the need for training, as they felt uncertain about using the appropriate language and approaches to effectively address current DEIA issues within their organizations. Inclusivity concerns were also raised, as respondents noted that certain communities were not involved in discussions about DEIA matters. Additionally, lack of funding and time emerged as recurring themes, with respondents expressing limited capacity to address DEIA issues. However, workforce members suggested that increased funding could be a step forward, enabling staff to dedicate time and resources to address DEIA matters more effectively.
Specialized training
“This is where we need help… we live in a very high Hispanic population but no one on our board is Hispanic, so I feel very awkward trying to recruit… I am genuine but I'm also not looking at it through someone else's lens, and what I think is genuine and sincere may not come across that way… how do we actively recruit without it looking like it's a check mark off of the box? Like, "Check, yep, we contacted them."
”In my opinion, they [larger more established organizations] should be setting a better example for smaller organizations that this can be done.”

Expanding inclusivity
Finding the funding & time

“Including a lot of people who are on the less recognized end of the spectrum, specifically trans folks and then just those intersectionalities from that as well…For example, there is a high Latino population here and it's not only Spanish that just needs to be spoken, its also Mixteco and Nahuatl and all of these different languages that come from Mexico. Other concerns..., accessibility towards the deaf community and making sure that everybody has accessibility to our resources… I feel that it could be better reached.”
“We need the funding to do that work, it's the staff time to do that thinking and planning and looking for resources, it's also the classes or the professional development.”
“Being so busy to bring up one more thing to my boss that, ‘Oh, hey we really need to get into this.’ She'd probably strangle me… it would be another thing, but it is very important. And the belief that we're already doing that [diversity] would make it difficult.”

| The State of Nonprofits in SB County
45 Diversity, Equity, Inclusion, & Access
Leaders provided additional insight into barriers they are experiencing with increasing diversity within their organizations. The most frequently mentioned challenges included the size and diversity of the applicant pool, staff capacity, and finding qualified and experienced candidates.
Barriers to increasing diversity within paid staff and/or board described in the leader survey
45% of leader responses stated that application pool size and lack of diversity in the applicant pool were barriers in increasing diversity within their paid staff and/or board.
15% of leader responses conveyed that staff capacity and size were barriers in increasing diversity within their paid staff and/or board.
14% of leader responses described that finding qualified and experienced staff were barriers in increasing diversity within their paid staff and/or board.
“Prior to my arrival … this [increasing diversity within your paid staff and/or board] was not a priority or even a minor area of focus for the organization. Without term limits, I have many board members who have served for over a decade, some for over two decades and 100% are white and live in south county. The staff was majority white and turnover was among the few staff of color. I am working with my board on term limits, we have included funding for robust and ongoing trailing in our budget but that has not begun and I do not know how it will be received. Our recruiting practices were not inclusive and our connections to diverse candidate pools were few.”
“Current board members are not connected with these communities. Our board needs more experienced board members (only one has served on a board) and are finding it difficult to recruit a diverse board that also has board experience.”
“Former ED was resistant to change. New ED is in year 1 of position and board is supportive of change. Only barrier is lack of staff capacity which is currently being reviewed. Increasing staff and board capacity will help with our board recruitment and uphold DEIJ in hiring new staff as well.”
The State of Nonprofits in SB County |
Diversity, Equity, Inclusion, & Access 46
Barriers in increasing diversity
Nonprofit workforce members reported that their organizations have encountered several barriers in their efforts to enhance diversity within their paid staff and/or board. The primary challenges cited included language and the accessibility of a diverse applicant pool, time constraints, and obtaining buy-in from boards. Many respondents expressed uncertainty regarding the use of appropriate language, including inclusive terminology, when working towards increasing diversity within their organizations.
Workforce members also highlighted the lack of diversity within the applicant pool itself, which posed a barrier to achieving representation. Additionally, finding the necessary time to implement diversity initiatives was identified as a common challenge, along with the difficulty of recruiting board members with relevant experience. Lastly, organizations reported that they also faced obstacles in engaging their boards and securing their support when striving to enhance diversity.
Inclusive Language & Representation
“We live in a very high Hispanic population… How do we actively recruit or actively find constituents of the different demographics without it looking like it's a check mark off of the box?... Especially when we don't have anyone on our board that actually represents that specific culture?”
“Our community is not very diverse so our pool of candidates tends to be similar... We are striving to put policies and actions into play that increase feelings of safety and acceptance at our organization.”
Time to Implement
“It's hard to get someone who feels truly representative of who we're serving on board leadership, because that's a luxury to have that time, to have that experience and to have that confidence.”
Board buy-in
“Engaging your board and making those kinds of decisions is usually the biggest obstacle that I have seen or found.”


“I think we recognize that it's difficult to actually implement some of these practices, especially again, just 'cause shortage of time and money.”
“It's boards. Boards are the obstacle. It is a little bit difficult to get a board to sit for content and to take actionable steps toward equity that staff would.”

| The State of Nonprofits in SB County
Diversity, Equity, Inclusion, & Access
47
Leaders were also surveyed about the different aspects of DEIA within their organizations. They were specifically asked about their level of satisfaction with their nonprofit's willingness to discuss DEIA issues and their ability to implement practices that promote DEIA.
Overall, leaders were more frequently satisfied with their organization's willingness to discuss DEIA issues than their ability to implement DEIA practices. However, there was a significant positive relationship between the two factors, meaning that leaders who were more satisfied with their organization’s willingness to discuss DEIA were also more likely to be satisfied with their organization’s ability to implement DEIA practices.
Willingness to discuss Ability to implement practices
The State of Nonprofits in SB County |
2% 8% 16% 36% 38% 8% 13% 27% 27% 25%
Not at all satisfied Slightly satisfied Somewhat satisfied Very satisfied
Completely satisfied
Satisfaction with nonprofit’s willingness to discuss and ability to implement practices that increase DEIA (n=146)
48 Diversity, Equity, Inclusion, & Access
How satisfied are you with your nonprofit’s willingness to discuss and implement DEIA?
Nonprofit workforce members engaged in discussions about their satisfaction with their organization's willingness to discuss and implement DEIA initiatives. Several respondents expressed being 100% satisfied with their organization's willingness to discuss DEIA matters. While most participants reported overall satisfaction with their organization's efforts to engage in these discussions, some emphasized the need for greater prioritization of their actual implementation.
However, a few participants expressed dissatisfaction with their organization's willingness to address DEIA issues, as they felt that staff input was overlooked. Those who were dissatisfied emphasized the significance of listening to voices beyond the leadership level when addressing DEIA issues within their nonprofit organization.
Satisfied
“100%. All of us have an open door policy. And because... I guess it's one of those things where we have to be careful because we do know each other very well. But in the same sense, because we do know each other very well, we can also be very open. And we don't have to hide behind anything.”
Work to do
“I'm satisfied with what we were able to achieve at the staff level and then with the [nonprofit] members that we manage, but not completely satisfied. I wish it was taken more as a priority at the C level.”

Dissatisfied


“There was a statement made towards DEI and nothing… has been done since then… the problem I'm seeing is only leadership is working on [DEIA], they're not taking the input of staff that… have another lens and be able to add to that…They need to go to even below directors, start going to front line staff even and get their opinion.”


| The State of Nonprofits in SB County
49 Diversity, Equity, Inclusion, & Access
The figure below displays a comparison between leader responses and the demographics of Santa Barbara County residents obtained from the 2020 Census. The data presented in the figure shows that white individuals hold a higher percentage of leadership positions than their representation in the Santa Barbara County(SBC) population, while Hispanic/Latino/a/e/x individuals are most notably underrepresented in comparison. Two
The State of Nonprofits in SB County |
races
Hawaiian/Pacific Islander Native American African American/Black Asian Hispanic/Latino/a/e/x White Two or more races Native Hawaiian/Pacific Islander Native American African American/Black Asian Hispanic/Latino/a/e/x White Two or more races Native Hawaiian/Pacific Islander Native American African American/Black Asian Hispanic/Latino/a/e/x White Two or more races Native Hawaiian/Pacific Islander Native American African American/Black Asian Hispanic/Latino/a/e/x White SBC Residents (grey)
organizations (colorful) CEO/ ED (n=143) Board chair (n=141) Board members (n=128) Leadership (n=122) 76.2% 14.7% 1.4% 2.1% 0.7% 0.0% 2.1% 43.0% 47.0% 6.0% 2.4% 2.2% 0.3% 4.0% 43.0% 47.0% 6.0% 2.4% 2.2% 0.3% 4.0% 43.0% 47.0% 6.0% 2.4% 2.2% 0.3% 4.0% 43.0% 47.0% 6.0% 2.4% 2.2% 0.3% 4.0% 74.5% 9.2% 3.5% 2.1% 0.7% 0.0% 3.5% 68.4% 18.7% 4.1% 3.9% 1.3% 0.1% 2.3% 62.0% 27.0% 3.4% 3.6% 0.1% 0.3% 2.0% 0% 40% 80% 50 Diversity, Equity, Inclusion, & Access 4
or more
Native
vs Surveyed
In the survey, leaders were asked to provide further demographic information about their CEO/Executive Director and Board Chair.
The results showed that a higher percentage of individuals identifying as a woman held CEO/Executive Director positions (67%), while Board Chair positions were more commonly held by individuals identifying as a man (51%).
They identify as a woman
They identify as a man
They identify as gender non-binary
They have another gender identity
I prefer not to disclose or I do not know
The survey also showed that several CEO/Executive Directors identified as LGBTQIA+ (35%), persons with disabilities and/or differently abled (22%) or had experienced housing instability (22%).
According to the responses of 24 leaders, Board chairs were most frequently identified as immigrants (38%), having a primary language other than English (25%), or being part of the LGBTQIA+ community (25%).
CEO/ED & board chair identity
38%
Primary language other than English
Person with disabilities / differently-abled
History of housing instability
Previously incarcerated
Immigrant 2%
Another identity group
8%
4%
14% 13%
25%
25%
20%
35%
13%
22%
22%
Board chair (n=24) CEO/ED (n=49)
51 Diversity, Equity, Inclusion, & Access 4 https://www.census.gov/quickfacts/santabarbaracountycalifornia
| The State of Nonprofits in SB County
3% 0% 1% 29% 67% 6% 0% 0% 51% 43% Board chair (n=142) CEO/ED (n=143)
LGBTQIA+ 10%
CEO/ED & board chair gender identity
52
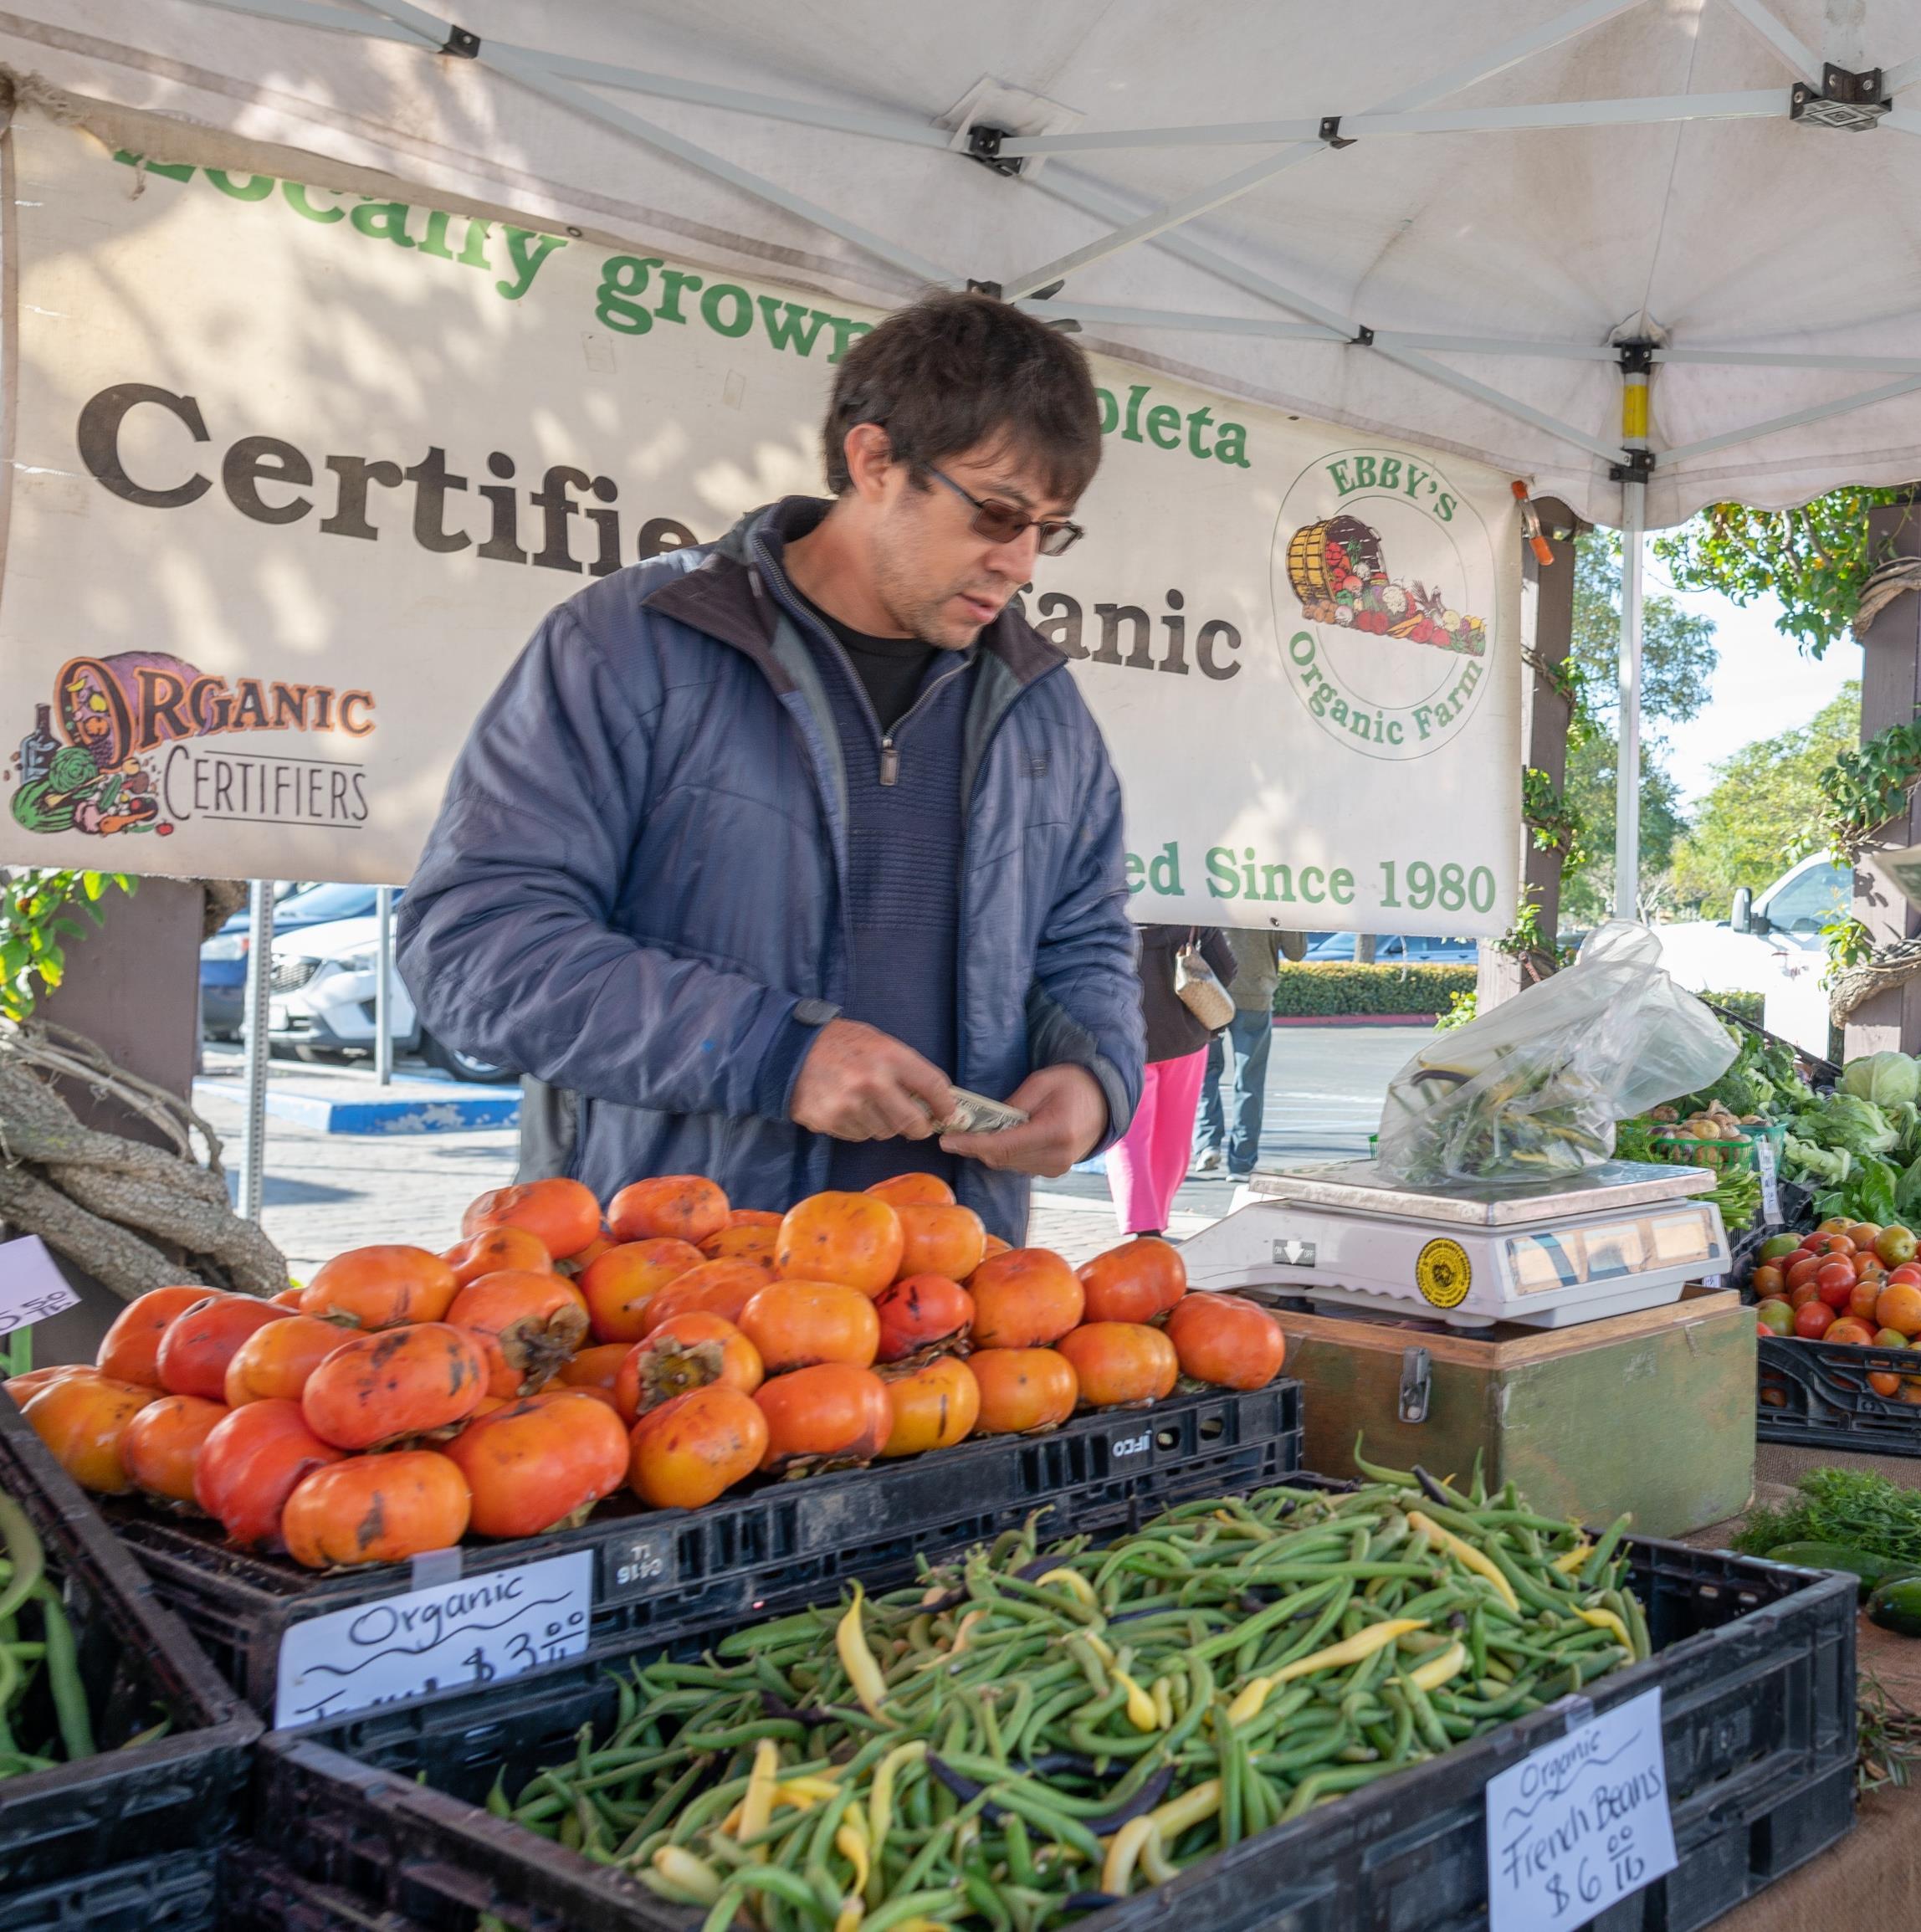
Santa Barbara Farmers Market
Demand for Services
Nonprofits in Santa Barbara County are experiencing an increased demand for their services due to various factors, including the COVID-19 pandemic, inflation, and housing concerns.
This section of the report will explore the drivers behind the changing demand for nonprofit services in Santa Barbara County, as well as the capacity of organizations to effectively deliver these services. Additionally, it will examine the reported ability of nonprofits to meet the increased demand for their services.
53
Leaders have reported a surge in demand for their services, with 82% of surveyed leaders indicating an increase in demand for their organization's services. Among these leaders, 41% reported a substantial increase, and 42% reported a moderate increase. This demand was more commonly reported in nonprofits in the Education and Environment subsectors. Notably, only 58% of organizations reported an increase in demand for services in the 2021 report.
Demand for services by
The State of Nonprofits in SB County | (n=142)
Demand for Services Human services Public & societal benefit Arts, culture, and humanities Health Environment Education 5% 20% 6% 5% 17% 13% 11% 11% 7% 78% 80% 81% 84% 89% 93%
Decreased Increased No change Overall average 5% 13% 82% 54
subsector
When asked about the factors that have led to a change in demand, leaders overwhelmingly cited the COVID19 pandemic as a major driver for the increased demand for their organization's services. The transition and impacts of the pandemic, including a heightened need for mental health services, were frequently mentioned as reasons for the surge in demand, along with the rising cost of living. Similarly, the few leaders who reported a decrease in demand for their services also attributed it to COVID-19.
Demand for organization services (n=142)
Factors that have led to the change
“Children lacked many services during COVID…. more children delayed in their communication skills from COVID. We have seen an increase in calls to our center and have been the first point of contact for many parents with concerns about their child..”
“Demand has shifted from programs that we used to provide in-person to participating in virtual programs. Not everyone has made the transition.”
“Due to the nature of our programming Covid had a huge impact on the types of programming and activities we could facilitate in a safe way”
| The State of Nonprofits in SB County Demand for Services
5% 13% 82%
55 Remained the same Increased Decreased
Of the nonprofit leaders that reported an increase in demand for their organization’s services, many nonprofit leaders reported that their organizations are facing limitations in meeting the needs of the community. Only 12% of those respondents reported being able to fully meet the increased demand, while the majority (52%) have only been able to address some of the heightened demand for services.
“We also had a couple staff members who were train[ed] and certified to provide programs leave the program due to the pandemic... We have not been able to replace those staff members. So, although demand for our services is up, we are unable to meet those demands.”
Organizations’ ability to meet demand for services (n=116)
When asked about the current status of their nonprofit's program operations, the majority of leaders reported either providing services to a greater extent than usual (37%) or to the same extent as usual (35%). However, a notable proportion of respondents (23%) reported delivering services in a moderately reduced capacity. Only a small percentage of respondents (4%) reported delivering services in a severely reduced capacity, or not delivering any services at all (1%). This marks a shift from the 2021 report, in which 22% of leaders indicated that they were delivering services in a severely reduced capacity or not at all.
The State of Nonprofits in SB County |
3% 52% 33% 12%
Unable to met any Able to meet some Able to meet most Able to meet all 1% 4% 23% 35% 37% Not at all Severely reduced Moderately reduced Same extent Greater extent Delivery capacity of organization services (n=142) Demand for Services 56
Across subsectors , most nonprofits have been able to continue providing services to a greater or same extent as usual. However, noteworthy proportions of respondents in each sector reported reduced capacities to varying degrees. The Public & Human Benefit subsector was the most severely affected, with 40% of respondents reportedly providing services in a reduced capacity.
Delivering services by subsector (n=130)
Not at all
Greater extent Severely reduced Moderately reduced
Same extent
| The State of Nonprofits in SB County
Arts, culture, and humanities Environment Education Health Public & Human Benefit Human Services 0% 0% 7% 0% 10% 0% 6% 0% 0% 0% 10% 5% 13% 22% 14% 21% 20% 29% 50% 44% 36% 42% 20% 25% 31% 33% 43% 37% 40% 41%
57 Demand for Services

The Land Trust for Santa Barbara County 58
Financial Health of the Sector
Santa Barbara County nonprofits rely on contributions, grants, and other forms of funding to operate. However, the nonprofit sector has faced significant challenges in recent years, including those stemming from the COVID-19 pandemic and inflation.
This section will review financial health indicators, leaders' predictions of financial health over the next year, operating cash reserves, and fundraising efforts.

59
The nonprofit sector in Santa Barbara County has demonstrated continuous expansion in terms of revenue, expenses, and assets, as indicated by the most recent six years of IRS tax data. The total assets held by the nonprofit sector in the county reached $8.7 billion in 2020.
Santa Barbara County 6-year trend in revenue, expenses, and assets (in billions)
The State of Nonprofits in SB County | Financial Health of the Sector $5.6 $5.7 $6.8 $7.0 $7.6 $8.7 $3.4 $3.5 $4.3 $4.4 $4.7 $5.4 $3.1 $3.5 $3.8 $4.2 $4.2 $4.8 2015 2016 2017 2018 2019 2020 Assets Revenue Expenses Includes hospitals, higher education, and Direct Relief
5 5 60
Distribution of nonprofits and assets by region
However, there is an imbalanced allocation of nonprofit resources and financial assets throughout Santa Barbara County. South County has a greater number of nonprofits and more substantial assets per capita compared to North and Mid-County. For instance, there is one nonprofit for every 353 people in the South County, while the North County only has one nonprofit for every 1,300 individuals.
Number and assets of nonprofits, form 990/990EZ in FY2020

While there is a higher concentration of nonprofits headquartered in the South County, the findings from the leader survey revealed that these organizations also provide services in regions beyond their headquarter area. This is visualized in the heatmap, which provides a representation of the regions served by the participating nonprofit organizations. For more details, please refer to page 5.
Excludes Direct Relief, hospitals, and higher education, though it may include organizations directly related to the higher education systems, such as UC foundations and alumni associations. Refer to Appendix on page 87 for information on regional classification.
| The State of Nonprofits in SB County Financial Health of the Sector
Region # of nonprofits Population per nonprofit Revenue per capita Assets per capita North County 116 1,300 $1,452 $1,739 Mid-County 128 639 $1,037 $2,228 South County 603 353 $8,564 $21,287 Santa Barbara County 847 526 $4,774 $11,169 6 6 61 High Low Concentration of participating organizations
7 7
Nonprofit revenue sources
Overall, Santa Barbara County nonprofits heavily depend on contributions (e.g., individual donations, government grants, and foundation and corporate grants), making up 51% of their revenue, followed by program revenue at 44%, which includes fees for services such as ticket sales and medical fees. Investment and asset sales, as well as all other revenue, make up smaller portions of their revenue at 3% and 1%, respectively.
When compared to other selected California counties, Santa Barbara shows either a lower or equal percentage of revenue from contributions, while also having a higher percentage of revenue from programbased sources.
Revenue by primary source, select California counties, form 990/EZ in FY2020
The State of Nonprofits in SB County | Financial Health of the Sector
Region Contributions Program revenue Investment and asset sales All other revenue Monterey 51% 37% 6% 6% Sonoma 59% 35% 2% 4% Marin 56% 38% 5% 2% Santa Barbara 51% 44% 3% 2% California 34% 62% 2% 1% United States 42% 52% 5% 2% 62
The revenue sources of different subsectors vary considerably. For instance, Hospitals and Higher Education organizations rely heavily on program service revenue, whereas International and Public Benefit organizations rely mostly on contributions.
Revenues by primary source of nonprofits, form
| The State of Nonprofits in SB County Financial Health of the Sector
Barbara County Hospitals Higher education Health Education Environment Human services Arts, culture, and humanities Public and societal benefit Religion International 51% 3% 11% 19% 55% 60% 66% 69% 73% 73% 96% 44% 94% 81% 77% 39% 22% 31% 19% 10% 21% 0% 3% 2% 6% 2% 5% 14% 2% 10% 14% 0% 3% 2% 1% 2% 2% 2% 4% 1% 3% 3% 5% 1% Contributions Program Revenue Investment and asset sales All other revenue
63
Santa
990/990EZ, in FY2020
This current report, like the 2022 State of Nonprofits in Santa Barbara County report, found a discrepancy between the revenue source estimates provided by leader survey respondents and the 2020 IRS tax data for Santa Barbara County nonprofits.
The difference is primarily in the reporting of program revenue, with leader estimates indicating program revenue from fees for goods and services to be around 13%, while the IRS tax data shows program revenue to be around 44%.
It may be that this discrepancy is due to variations in the survey sample and the overall nonprofit sector, or confusion regarding the terminology used in the survey and tax forms.
Nonprofit revenue form various sources (n=123)
Foundation grants
Government grants and contracts
Individual donations
Fees for goods and services
Interest from investments
Membership dues and fees
Fundraising events
Corporate contributions
Other
The State of Nonprofits in SB County |
0.3% 5% 5% 6% 6% 13% 19% 21% 24%
Survey data 64 Financial Health of the Sector
This current report, like the 2022 State of Nonprofits in Santa Barbara County report, found a discrepancy between the revenue source estimates provided by leader survey respondents and the 2020 IRS tax data for Santa Barbara County nonprofits. The difference is primarily in the reporting of program revenue, with leader estimates indicating program revenue from fees for goods and services to be around 13%, while the IRS tax data shows program revenue to be around 44%.
It may be that this discrepancy is due to variations in the survey sample and the overall nonprofit sector, or confusion regarding the terminology used in the survey and tax forms.
Nonprofit revenue form various sources (n=123)
Survey data
Foundation grants
Government grants and contracts
Individual donations
Fees for goods and services
Interest from investments
Membership dues and fees
Fundraising events
Corporate contributions
Other
In 2020, contributed revenue accounted for 51% of total revenue for nonprofits in Santa Barbara County. Of these contributions, direct contributions made up more than half (54%) of contributions with government grants accounting for an additional 41%. Compared to other select counties, California State, and the United States, Santa Barbara relies more on government grants and less on direct contributions.
Revenues by primary source of nonprofits, form 990/990EZ, in FY2020
Direct contributions
Government grants
Indirect contributions Special events & memberships
| The State of Nonprofits in SB County
0.3% 5% 5% 6% 6% 13% 19% 21% 24%
United States California Santa Barbara Monterey Sonoma Marin 63% 58% 54% 71% 68% 73% 32% 39% 41% 26% 30% 16% 4% 2% 4% 1% 1% 10% 2% 1% 1% 1% 2% 1%
65 Financial Health of the Sector
Nonprofit leader assessment of financial health
A substantial portion of leader respondents reported having a favorable financial situation. Specifically, 67% of the participants (n=94) reported somewhat or very strong financial health.
Organizations with budgets greater than $5 million more frequently reported their financial health as strong or very strong compared to those with smaller budgets. There was also a higher proportion of organizations with budgets less than $250,000 that report their financial health as somewhat weak or very weak. Analysis also found that financial health reports varied by subsector with Environmental nonprofits more frequently describing their nonprofits financial health as somewhat strong or very strong.
The State of Nonprofits in SB County |
$50,000 or less $50,001 - $250,000 $250,001 - $1 million $1,000,001 - $5 million $5,000,001 - $10 million Greater than $10 million 22% 3% 8% 7% 22% 28% 3% 33% 35% 28% 11% 7% 11% 24% 44% 42% 7% 64% 11% 10% 18% 47% 80% 36% Very weak Somewhat weak Moderate Somewhat strong Very strong Overall Total 5%8% 21% 35% 32% Financial Health of the Sector
Financial health by nonprofit budget size (n=141)
Annual budget 66
94% of leader respondents (n=87) predicted that their financial health would either remain the same or improve in the next 12 months.
Additionally, survey responses highlighted the considerable proportion of the organizations that have a healthy cash reserve, with 66% of the respondents (n=89) reporting having six or more months of cash reserves on hand, which is higher than the typical amount for nonprofits.
Months of operating cash reserves on hand
# of months
16% 12 months +
(n=135)
50% 6-12 months
“Many new nonprofits are venturing into innovative financial sustainability models such as social entrepreneurship.”
“Watching the number of non-profits who cannot achieve sustainability…It would be good to see more Foundations fund sustainability in the form of staffing and administrative expenses”.
29% 3-5 months
5% Less than 3 months
| The State of Nonprofits in SB County
0% 6% 48% 36% 10%
Much worse About the same Somewhat better Much better Somewhat worse Expectation of financial health in 12 months (n=141)
Financial Health of the Sector 67
“It is essential to raise awareness among funders for unrestricted funding to assure organizational excellence, competent and responsible leadership and efficient operation of nonprofits.”
Leaders also predicted a favorable outlook for fundraising for the next fiscal year, with 51% predicting that it would be the same and 36% somewhat or much better.
“Fundraising as a new organization in the pandemic [and] building a community of donors virtually is really challenging... with a very small tight budget and not a lot of unrestricted support having space for our team to come together and work together in person is a challenge.”
Fundraising outlook for the next fiscal year (n=134)
Respondents were also asked about funder practices encountered during the pandemic and reported experiencing various changes in these practices to varying degrees. The most frequently experienced practices were identified as funding capacity building for nonprofits, offering unrestricted funding, giving priority to funding for BIPOC-serving nonprofits, and maintaining regular and proactive communication about decisionmaking.
Leaders’ perceptions of changes in funder practices (ns=114→126)
Funding capacity building for nonprofits
Providing unrestricted funding
Prioritizing funding BIPOC-serving nonprofits
Communicating proactively and regularly about decision making
Lifting up the voices of the communities least heard in public discourse
Shortening applications
Reducing reporting requirements
Funding advocacy and policy-related work
Providing multi-year support
The State of Nonprofits in SB County | Financial Health of the Sector
2% 12% 51% 28% 8% Much worse About the same Somewhat better Much better Somewhat worse
48% 51% 55% 59% 56% 59% 60% 60% 65% 5% 4% 3% 2% 7% 8% 10% 12% 8%
Some extent Great extent 68
Inflation has impacted Santa Barbara County nonprofits in various ways. Specifically, 81% of respondents stated that they had to raise prices for programrelated expenses, 79% had to increase salaries to keep up with the cost of living for their employees, and 47% experienced a decline in the value of their investments. Other respondents also indicated that they have experienced uncertainty in foundation funding.
Effects of inflation (n=129→139)
Increased prices for program-related costs
Pressure to raise salaries to meet increased cost of living for workers
Decrease in the value of investments
Decrease in the value of individual donations
We have had to raise prices clients/ consumers pay for our services
Higher interest rates on credit or loans
Not yet, but expect to in the next 12 months Yes
“The minimum wage increase has been a blessing for all workers, but it has also been an "unfunded mandate" since funders have not increased funding. In particular, the minimum wage increase has created significant salary compression in our organization. In addition, the high cost of living and, in particular, increasing housing costs is severely impacting our ability to recruit and attract new talent.”
“Our goal is to get to a living wage for all full time staff, but for some, that is a 35% pay increase!”
“We've already increased salaries twice this year-for inflation and for retention.”
| The State of Nonprofits in SB County
11% 22% 34% 47% 79% 81% 3% 10% 7% 3% 8% 4%
69 Financial Health of the Sector
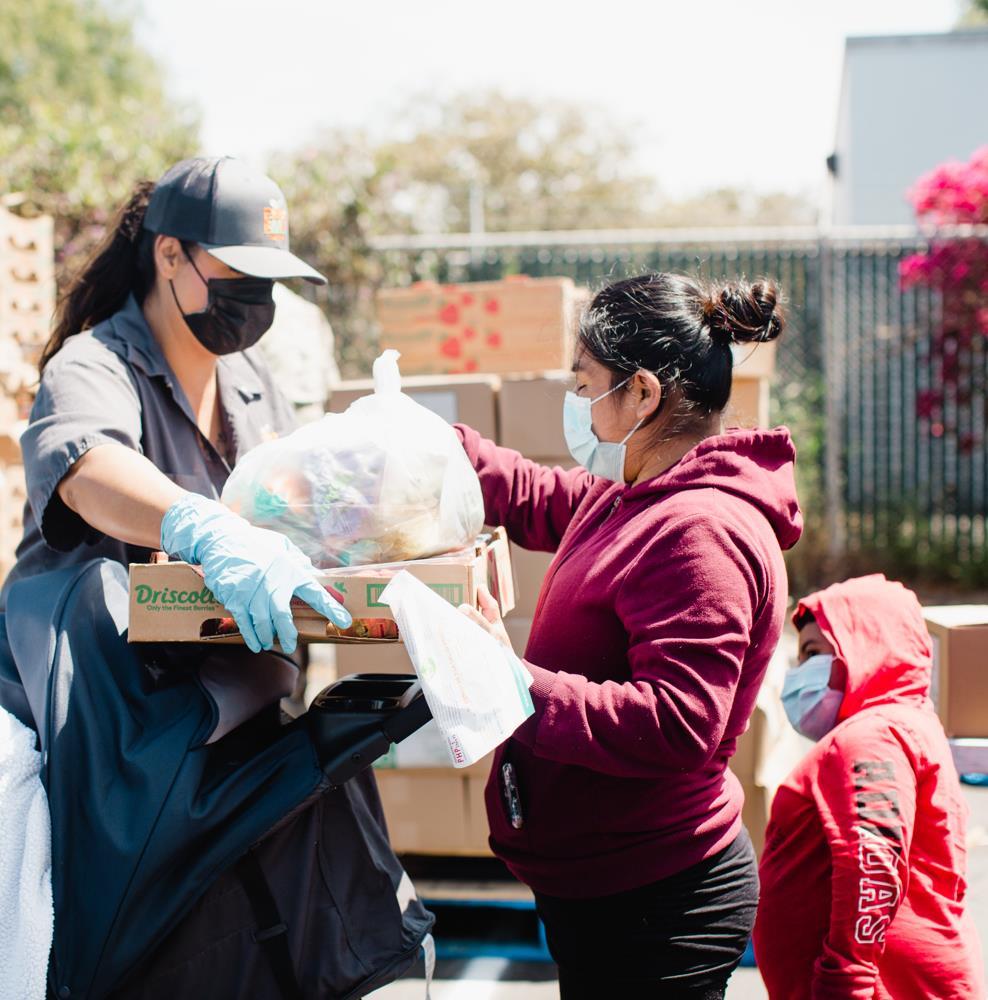
Foodbank of Santa Barbara County’s Healthy Farmworkers Program 70
Organizational Capacity
In Santa Barbara County, nonprofits have identified specific areas of organizational capacity building needs. Strategic planning, communication and public relations, and leadership development have been identified as among the top capacity building needs. In addition to these needs, nonprofit workforce members also shared their perspectives on other capacity building needs, including the need for greater access to qualified applicants and increased collaboration with other organizations.
This section of the report will explore these specific capacity building needs of nonprofits, including their belief in various groups to address critical challenges in the region and the perceived ability of organizations to conduct evaluation activities.
71
Surveyed leaders most frequently identified strategic planning, communication & public relations, leadership development, board governance, and DEIA training as their top five organizational capacity building needs during the next 12 months.
Top organizational capacity building needs (n=138)
Strategic planning
Communication and public relations
Leadership development
Board governance
DEIA training
Succession planning
Program evaluation
Volunteer engagement/administration
Collaborating with other organizations
Engaging in advocacy
Business modeling
Other Financial literacy
The State of Nonprofits in SB County | 7% 16% 17% 20% 33% 34% 38% 40% 43% 44% 48% 49% 65%
Organizational Capacity 72
What are your top organization capacity-building needs during the next 12 months?

Aside from funding, nonprofit workforce members emphasized the significance of increased collaboration for serving the larger community and the need for access to qualified applicants as the primary organizational capacity-building needs for the next 12 months. These needs align with survey responses, which also emphasized leadership development, succession planning, and communication and public relations.
Increased collaboration with other organizations
“[State and national grants are] looking for a collaboration across business sectors, government agencies, and non-profits, and they want to know that it is going to help the community as a whole …I'd like to see more activation in nonprofits working together and businesses and government agencies.”

Access to qualified applicants
“I find it very difficult to pull people away from [for profit] better paying positions that do comparable work.”
“We need access to talent. So we have a lot of open positions and very few candidates in the pools.”

Leadership development and succession planning
“Building up management, providing them with the tools necessary so that they feel like they can lead their team as well… just trainings in general, supporting staff, helping them build their skills and figuring out pathways to management.”
| The State of Nonprofits in SB County
Organizational Capacity
73
To determine which groups nonprofits believed were most capable of addressing the challenges in Santa Barbara County, the survey asked respondents to rate the leadership abilities of local representatives from different groups in enacting solutions.
Nonprofit organizations, followed by, community and private foundations, received the highest ratings for their perceived capacity to enact solutions.
Leadership demonstrated by local representatives to enact solutions to regional critical challenges (ns=132→134)
Not at all Little extent Some extent Great extent Very great extent
The State of Nonprofits in SB County |
Corporations Institutions of higher education Local government Individual philanthropists Community and private foundations Nonprofit organizations 13% 7% 7% 2% 1% 40% 28% 30% 20% 14% 4% 36% 39% 39% 45% 43% 27% 9% 22% 19% 26% 32% 46% 2% 5% 5% 7% 11% 24%
Organizational Capacity 74
As a component of organizational capacity, leaders were also asked about their confidence in their organization’s ability to conduct varying evaluation activities. Leaders reported the greatest confidence in their organization’s ability to track program outputs, accurately measure program outcomes, and use evaluation findings for decision making.
Confidence in ability to conduct evaluation activities (ns=132→135)
Not at all Little extent Some extent Great extent Very great extent
Track program outputs
Accurately measure program outcomes that result from your programs
Use evaluation findings for organizational decision making
Have dedicated staffing responsible for monitoring and evaluation
Seek out external consultants or organizations to help with conducting evaluations
| The State of Nonprofits in SB County
31% 23% 8% 6% 1% 15% 16% 14% 16% 5% 23% 28% 31% 31% 24% 20% 20% 30% 29% 35% 11% 14% 17% 18% 35%
75 Organizational Capacity
Additional external factors significantly impacting nonprofit work: Nonprofit workforce members
Nonprofit workforce members provided a range of insights into the challenges they encounter due to various factors affecting their nonprofit work. Among these factors, workforce members highlighted a lack of staff and organizational capacity, as well as funding, as the primary issues impacting their efforts. Additionally, workforce members also discussed the challenges they face in terms of recruiting new personnel and navigating the process of transitioning from the changes brought about by COVID-19.
Lack of Capacity
“There's a lot of problems with staffing and coverage to be able to provide services that you once provided or that you want to provide for your clients.”
Funding

“There could be more positions with more funding. We have the space for more people and we have the need in the community for more work…right now, it's me and two other full-time people… there's just a lot to do.”
Recruitment

“It's really difficult recruiting… gotten to the point which a lot of places is they can almost dictate their terms of work, because if you don't, they'll leave and then you have nothing.”

Transitioning back from COVID
“[What organizations are ] trying to do is instead of going back to the same old same old pre-COVID… is to take this opportunity to see how they can strategize for the future, see what their demographics are now… re-examine who our clients and constituents are, who are we serving, and is that still effective and valid.”
The State of Nonprofits in SB County |
Organizational Capacity
76
Additional external factors significantly impacting nonprofit work: Nonprofit leaders
When nonprofit leaders were asked about the additional external factors significantly impacting their work, several themes emerged. The most prominent external factors highlighted by leaders were funding, recruitment, the impact of COVID-19 and the transition back to in-person work, and access to physical spaces to provide services. Other factors mentioned by leaders included the cost of living, leadership and existing work culture (including toxic practices), time constraints, limitations in service provision, external decision-making (such as state-level decisions), and retention.
Physical spaces
Size reflects frequency of responses
COVID / inperson
External decision making
| The State of Nonprofits in SB County
Cost of living Time Leadership & work culture
Funding Recruitment
Services Retention
Organizational Capacity
77
UCSB Cheadle Center for Biodiversity and Ecological Restoration 78
Adaptations & Innovations
Nonprofit leaders in Santa Barbara County have responded to changing circumstances by modifying their organizations' practices through collaboration, adaptation, and innovation. They have formed new partnerships, shifted their programming, adjusted staffing models, and utilized technology to improve and better serve their communities.
The following section provides an overview of these collaborations, adaptations, and innovations, as well as highlight specific examples shared by nonprofit leaders through the survey.
55 UCSB - CCBER 79
What are the most pressing needs or issues for your organization?
Members of the nonprofit workforce expressed a range of pressing needs and issues within their organizations. The most prominent theme that consistently emerged was funding, specifically the need for flexibility in funding. Participants stressed that this flexibility would empower organizations to allocate funds to address specific needs within their own organizations.
Another critical and recurrent theme throughout the focus group responses was the necessity for increased collaboration and communication between agencies. The responses from nonprofit workforce members emphasized the significance of partnering with other nonprofits that share similar missions, with the common goal of serving the community in a more impactful manner. Respondents also highlighted the potential for smaller nonprofits to learn from larger organizations through such collaboration. Participants explained that by fostering increased collaboration and communication between agencies, organizations can promote growth and improve relationships.
Increased collaboration
Flexibility in funding
“There's not a lot of trust that philanthropic organizations have for donating because they like what you do and trusting you to use that money how you see best. So, just being more flexible in the money would be really great.”

Communication between other agencies
“The ability to have better communication between local government and emergency response... I don't think that we're communicating well enough, and I think the best way for me, because I've been here as long as I have, it's through relationships.”

The State of Nonprofits in SB County |
Adaptations & Innovations
80
“I feel like there are opportunities that would be great opportunities, but sort of not knowing how to grow and not knowing how to take on those bigger things. It's almost like we're growing too fast and... getting some insight from other non-profits about... manageable growth would be really, really helpful.”
Nonprofit stories of innovation, strategies, and partnerships
Of leaders said that their nonprofit participated in a network, coalition, or collective impact initiative. 84%
Number of collectives nonprofits are engaged with (n=110) # of volunteers
Nonprofit leaders reported that they actively participated in networks, coalitions, and collective impact initiatives. The majority of respondents reported being part of three (23%) or five (22%) such groups. Overall, collaboration and partnership were seen as important for addressing community needs.
Leaders also shared stories of how they have modified their organization's practices through collaboration, adaptation, and innovation. Among these stories, many leaders highlighted the importance of partnerships and networking, with numerous organizations forming new collaborations to pool resources and knowledge. Nonprofits have also partnered with local businesses and government agencies to address community needs effectively.
Along with collaboration, nonprofits have taken significant steps to adapt to the changing environment. Many organizations have shifted their programming online to continue providing services and support to clients while adhering to public health guidelines. Some nonprofits have adjusted their staffing models or changed their service delivery methods to better meet the needs of their communities. Moreover, many nonprofits are investing in innovation, exploring technology's use to enhance their service delivery and raise awareness of their programs.
In this next section, leaders' stories are highlighted to providing examples of the collaborations, adaptations, and innovations that have been implemented in nonprofits throughout the county.
| The State of Nonprofits in SB County 7% 1 17% 2 23% 3 4% 4 22% 5 27% 6+
81 Adaptations & Innovations
Nonprofit stories of innovation, strategies, and partnerships
“Because of the dramatic downturn in community volunteers, we are piloting a paid advocate supervisor position that [organization] is looking at for use nationwide. Advantages include increasing diversity and providing bilingual and bicultural staff to work with families in crisis. There are challenges we are learning about. It’s not nearly as efficient as our volunteer model. But it’s exciting to be helping to develop new possibilities for use nationwide so that more children in need get advocacy services.”
“During the pandemic, our low-income senior residents were socially isolated. An innovative on-line program provided them with the opportunity to connect with other senior citizens from other parts of the country and the world.”
“Switching to holding our groups on zoom has greatly increased public participation.”
“In response to higher construction costs we are sponsoring the use of new 3D printing technology to develop a prototype 3D printed affordable home. The home will demonstrate new robotics technology that has the potential to save time and cost in developing affordable housing. The home will use fire resistant, climate resilient natural building materials and incorporate solar photovoltaic systems and other sustainability features.”
“Participating in collaboratives/coalitions of similar mission across the state. We are working as far upstream as possible to align goals and objectives to move needles of change in state legislation and budgets. We are also participating in statewide economic development tables to assure our issue area is included in the planning and implementation process.”
“We are proud to have partnered with a local mental health organization to fulfill a critical need expressed by our constituents, 1:1 counseling, through a pilot program. We are proud to partner with this org and many others to use our unique skillsets and resources and work together for greater impact.”
Santa Barbara Channelkeeper
“We have had to totally adapt what was done by postal mail into a format that will be done by email. This has been a major challenge because it depends on parents, teachers, and or community leaders and many are still finding technology challenging”
“Asked a community ‘partner organization’…if we could hold our annual Gala at their facility to: increase our agency's presence and visibility along with THEIRS; expose our donors and supporters to THEIR programs and services…while concurrently exposing THEIR donors and supporters…to our agency; collaborating and "building community" with our partner agencies strengthens us individually and collectively..”
“Adopted a hybrid approach for most of our programing, which is working well and attracting different program participants than in the past. we've also expanded our program to compensate volunteers for childcare needs whenever they work on our direct service programing or participate in activities for the organization.”

“Looking for way to capitalize on using technology to promote different careers using a national network, looking for ways to reassess local needs and how to meet those needs.”
“Working with a collaborationfirst mentality, we have gathered groups of organizations to understand how we're serving our community, and where there are gaps and overlaps. We've then put together collaborative that have applied for funding, including a nearly half-million state grant to provide services to LBTQ women, non-binary, and trans people.”
“Collaborated with the local library and elementary schools to enroll children from BIPOC and low-income families. We have found over the years community members from these groups weren't being served by us as much as we wanted. So we went to them and continue to find ways to go to these communities, rather than hoping they find us.”
83
Santa Barbara Foundation Recommendations

This report reflects the Santa Barbara Foundation’s (SBF) best and most current understanding of the health and well-being of the Santa Barbara County nonprofit sector. Although limitations in available data highlight the need for improved metrics in the future, they cannot be the cause for inaction.
One of the most important results of producing this report has been a heightened sense of professional identity and respect for those who serve the nonprofit sector. Having this research shines light on those often overlooked and misunderstood elements of regional economies. Focusing on the economic impact of nonprofits as job producers distinguishes this report from typical reports on nonprofit activity.
The following recommendations are based on the trends in the research that stand out to SBF and how everyone can use this information to improve individual organizations and sector health through effective practices, policy, and additional research. We hope these recommendations help to form the basis of both sector-wide and cross-sector conversations in the months to come and that our communities work to translate the findings into timely and relevant action.
Invest in the Nonprofit Workforce:
The past year has brought increases in total nonprofit employment as well as higher salaries for nonprofit employees. Even so, a continued rise in the cost of living, the lack of affordable housing, and significant levels of increased community need and burnout among the workforce create hiring and retention
challenges. Fifty-eight percent of nonprofit leaders predict an increase in staff size, rendering fair wages, flexible work environments, and innovative employee benefits and/or incentives critical. As leaders struggle to balance the tradeoffs between an organization’s financial sustainability and the need to provide pay and benefits that can attract a workforce when competing with the private and public sectors, funders (individual donors, foundations, and government) should expect and support increased program costs. Funders should also consider increasing capacity building investments in areas such as professional development, specialized training, and volunteer management.
Increase Nonprofit Capacity in Mid- & North Santa Barbara County:
The Santa Barbara County nonprofit sector continues to see an increase in demand for services, with commensurate increases in expenses. The distribution of needs and services are imbalanced across the county. North and parts of Mid-County have larger populations, and fewer nonprofits headquartered in their region (per the graph on page 61). While there are countywide nonprofits prioritizing resources to serve Mid- and North County communities, there is still a substantial underrepresentation of assets based within those communities, as well as a lower density of locally provided services (per the graphs on pages 5 and 61). These findings suggest there is a significant need to fund and foster community-based organizations within underrepresented Mid- and North County.
84
8 8
This marks a significant stride for our county to better understand, not only the locations of nonprofits and donors, but also to identify the extent of service coverage and gaps. This initiative marks our initial attempt to achieve these insights.
Santa Barbara Foundation Recommendations
Prioritize Flexible Funding:
To the greatest extent possible, it is critical for all funders (individual donors, foundations, and government) to continue to provide flexible funding for nonprofits. Positive flexible funding practices include: unrestricted gifts, multi-year and/or general operating support grants, and streamlined application and reporting processes. These practices help nonprofits secure their financial footing, adapt operations to improve resilience, and prepare for crises and increases in demand for services.
Codify Diversity, Equity, Inclusion & Access:
The pandemic placed a spotlight on social inequities and structural racism in our county, generating significant buy-in across the sector to prioritize issues of diversity, equity, inclusion, and accessibility in our work. While there has been a noticeable increase in the number of nonprofits reporting their organizations have taken actions to engage these principles, there are still significant disparities in representation in leadership and governing positions. This demonstrates an opportunity to advance more equitable systems through comprehensive assessments and integrating practice principles into all functions of an organization. This can be accomplished for nonprofits by listening to voices beyond the leadership level and focusing on organizational readiness, governing practices, internal culture, and programs. This critical work will require deep reflection with a focus on trust, patience, and proactive and intentional practice.
Cultivate Trust, Collaboration, and Innovation:
During the pandemic, across the nonprofit sector, we forged alliances and unification as we worked collectively to come up with creative solutions to unprecedented problems. Funders and philanthropists partnered with their peers to merge resources and mobilize funds quickly through collaborative funding platforms. Nonprofits collaborated more deliberately and candidly than ever before to meet the various needs of their communities. There was an emphasis on trust building, which must be a central pilar within our sector and across sectors if we are to sustain high levels of cooperation and innovation in the long-term. A concerted focus on trust building will support the growth and effectiveness of existing collaborations as well as the formation of new, cross-sector approaches to our communities’ most challenging problems. We encourage funders (individual donors, foundations, and government) to lean into the six practices of Trust-Based Philanthropy: give multi-year, unrestricted funding, do the homework, simplify and streamline paperwork, be transparent and responsive, solicit and act on feedback, and offer support beyond the check.
1) peer-to-peer learning to cultivate collaborations;
We encourage nonprofits to consider
2) engaging board members and other stakeholders in building crosssector relationships;
3) joint mobilization to advocate as a sector/sub-sector on issues.
85

Leader respondent demographics
Most respondents to the Nonprofit Leader Survey of Santa Barbara County identified as executives, such as Executive Directors, Chief Executive Officers, or Presidents. Of those who selected job titles other than Executive Director / CEO / President or Board Chair and provided information about their identity, 78% identified as women and 68% identified as white.
County Region Classification
North County (Guadalupe | New Cuyama | Orcutt | Santa Maria)
Mid-County (Buellton | Lompoc | Los Alamos | Los Olivos | Santa Ynez | Solvang | Vandenberg SFB) South County (Carpinteria | Gaviota | Goleta | Isla Vista | Montecito | Santa Barbara | Summerland)
References
California Association of Nonprofits & The Nonprofit Institute. (2019). Causes Count: The Economic Power of California’s Nonprofit Sector.
U.S. Census Bureau. (2020). QuickFacts: Santa Barbara County, California. Retrieved from https://www.census.gov/quickfacts/santabarbaracountycalifornia
| The State of Nonprofits in SB County
87 Race/ethnicity (n=31) % White 67.7% Hispanic/Latino/a/e/x 12.9% Two or more races 9.7% African American/Black 3.2% Native American 3.2% Asian 0.0% Native Hawaiian/Pacific Islander 0.0% I prefer to self describe 3.2% Identity (n=32) % I identify as a woman 78.1% I identify as a man 21.9% I identify as gender non-binary 0.0% I have another gender identity (please specify) 0.0% I prefer not to disclose 0.0% Job Title (n=159) % Executive Director/Chief Executive Officer/President 73% Chief Operating Officer or Administrative Manager 4.4% Chief Financial Officer or Finance Director 1.9% Management Team Member (e.g., Development Director, Program Director, etc.) 15.1% Board Chair 3.1% Other 2.5% Appendix

Report designed by the UCSB Center for Evaluation & Assessment @ eval.education.ucsb.edu
