
Capacity Building for Tourism infrastructure
Case of Tourism influenced Regions in Uttar Pradesh


-APresentation

 by: Sayan Munshi IIIrd Sem, MURP FOAP, AKTU, Lucknow
-Guided
by: Dr. Subrajit Banerjee FOAP, AKTU, Lucknow
Introduction and Background
• Tourism is an integral pillar of the Make in India program.
• Tourism plays a role of significant economic multiplier in the states which acts as a host.
• As per the Manila Declaration on World Tourism of 1980 recognized its importance as "an activity essential to the life of nations because of its direct effects on the social, cultural, educational, and economic sectors of national societies, and on their international relations.”
• Tourism boosts the revenue of the economy, creates thousands of jobs, tend to develop the infrastructures of a country, and plants a sense of cultural exchange between foreigners and citizens.
Impacts of Tourism:
• As an impact the tourism industry tends to create a pressure on the existing infrastructure of a city, town or region and consume resources. Resources in the domain of infrastructure include the management of Solid waste, water supply, transportation, Housing and a mass migration of population from the surrounding area to the core area of tourism disturbs the balance of the area and tends to a deteriorate the quality of life of the residents.
• The load on the infrastructure can vary as per the tourist cycle thought the year as per the season of inflow of tourist depending on the destination and the travel pattern
• A number of organizations such as the United Nations World Tourism organization regulated the norms for the countries to operate and regulate tourism.
Tourism Infrastructure
Tourism infrastructure is the basis of tourism development and utilization of existing destination resources.
Tourism InfrastructureOrganizational Structure I. UNWTO II. Ministry of Tourism III. Ministry of Culture IV. India Tourism Development corporation V. National Cultural Fund VI. State Tourism Departments VII. Archeological Survey of India VIII.Indian National Trust forArts and Cultural Heritage IX. Stakeholders
Physical Cultural Service Governance


Conceptualization INBOUND TOURIST DESTINATION DESTINATION DESTINATION Tourism Generation Zone Tourism Destination Zone OUTBOUN D TOURIST Transit infrastructure Transit infrastructure StudyArea: • Lucknow • Varanasi • Prayagraj • Ayodhya Infrastructure Intervention of Policy Study Components Identification of tourism Circuit • As per Tourism Policy of the States • Tourism Policy of India 2002 Tourism Potential as per URDPFI Guidelines As per UN-WTO Dependent Areas
Hypothesis,
and Objective
Aim
of an equational model indicating tourism potential (y) of an area as the function of determinants of infrastructure
will
policy
function of x"
f(x)) means
y varies
to
value
Variables: Y = Tourism Potential, X = Determinants of Infrastructure, a/b/c/d = Coeff. Of determinants, k=constant, e= errors A causal relationship is often implied (i.e. "x causes y") y = f(x) Economy Tourism Infrastructure Tourism Potential Economy Tourism Infrastructure (y) (x) POLICY y = (ax1)+(bx2)+ (cx3)+….+ (anxn)+k +e Equation:
Hypothesis: Derivation
(x)
help in
formulation. The statement "y is a
(denoted y =
that
according
whatever
x takes on.
Aim, Objective and Need of the Study
Need for the Study
1. Due to the influx of tourism in the cities a load on the infrastructure and services can be observed, specifically in the Physical Infrastructure sectors.
2. Due to floating population in the designated tourism core of the Urban / Peri-Urban area, issues pertaining to Solid waste management and Transportation is highly observed.
3. Thus, a need of capacity building arises for the infrastructure impacted by tourism, which may result in the upgradation of the lifestyle of the city and its permanent users.
Aim:
To formulate a comprehensive model for capacity building related to tourism infrastructure.
Objectives:
1. To identify various tourism related infrastructure determinants.
2. To study the impact of determinants of infrastructure by the tourism industry.
3. To suggest an equational model to improve the tourism potential of the area by capacity building.
Scope, Limitation and Research Question
Scope:
a) To find and Analyze effect of tourism on an area.
b) Cultural tourism will be focused.
c) To find ways to augment the Existing infrastructure and find possible solution by capacity Building.
d) To develop a Structural Equation for Tourism Infrastructure.
Limitations:
a) Study will be limited to Urban Areas.
b) Study would focus on components/determinants of Infrastructure and its upgradation.
c) The study will be limited to a sub category of Inbound tourists.
d) The study will be limited to Tourism Circuits of Uttar Pradesh.
e) Economic aspects of tourism is not included.
Research Questions:
a) How does Capacity building help in strengthening and upgrading the Tourism Specific Infrastructure of an area or Region under tourism influx?
•
•
•
•
•
• Identification of determinant specific issues.
• Analysis of Load on infrastructure due to Floating Population
• Identification of Gaps
• Data collection based on Frameworks and Policies related to Tourism
• Formulation of Framework based on Infrastructural
• Suggestion of Augmentation possibilities for development of Tourism specific model for Medium towns
Tourism Infrastructure Physical Cultural Service Governance Data Collection on Case Primary & Secondary Case Study Bench Mark Analysis URDPFI Guidelines Tourism Potential Augmentation Possibility Gap in Tourism Infrastructure Tourism Framework Inference National Framework Comparison
Methodology
Enumeration of Tourism Specific Infrastructure (determinants)
Prime Sector of Infrastructure (Determinants)
Data collection based on Determinants of Infrastructure
Analysis of Destination and circuits based on parameters of Inbound Tourists.
determinants
• Inference with an equational model
• Transportation • Water Crisis
Solid Waste Management and Sewerage
• Drainage and Storm water management
BACKGROUND: Capacity Building for Tourism infrastructure
DEFINITION OF CAPACITY BUILDING
.
As per the United Nations, Capacity-building is defined as the process of developing and strengthening the skills, instincts, abilities, processes and resources that organizations and communities need to survive, adapt, and thrive in a fast-changing world.
TOURISM AND INDUSTRY
A large segment of people are involved directly and indirectly in the tourism industry who provide service to cater the industry but lack basic facilities.


UNWTO, is the specialized agency entrusted with the promotion of responsible, sustainable and universally accessible tourism.
The organization formulated guidelines for upgradation of destination with Basic Infrastructure services such as :
• Transportation
• Solid waste Management
• Clean and Portable water supply
• Good Telecommunication Services
DESTINATIONS
As per UNWTO, Destinations are places that have constructed an amalgam of tourist products and services. The destinations are well defined geographically and understood by the tourists as unique entities and exhibit several core provisions.

TOURISM POTENTIAL
The sum of the natural, anthropogenic and material resources and conditions necessary for a destination management.
POTENTIAL ANALYSIS DEMAND o Geographical o Socio-Economic o Need for Infrastructure o Cultural Value o Need for Services SUPPLY o Creation of tourism product o Provision of Infra. o Service DESTINATION COMPETANCE OFTOURISM SITES o Attractiveness ➢ Natural Values ➢ Cultural Values ➢ Historical Values CONDITION OFTOURIST SECTOR o Dependence on Infrastructural, Social, Physical and Environmental Components. o Based on the Component of Competitiveness DESTINATION COMPETIVENESS Determinants of competitiveness ➢ Attractiveness of the Natural Env. ➢ Hygiene and Sanitation ➢ Accommodation Standards ➢ Health Service ➢ Quality of Transport ➢ Quality of telecom ➢ Diversity of Tourism Destination competitiveness can be defined as the factor which makes the destinations of the region a magnet to attract tourists. Greater Competitiveness More need of Infrastructure = The usual demand-supply relation in destination, depends on the infrastructure. With the supply of Tourists in a destination , the demand for infrastructure increases. However, Tourism is
catalyst for infrastructure Growth, Better infrastructure, Better the Economy.
TOURISM
a
ASSUMPTIONS
1.
2.
3.
4.
5.
6.
DESTINATION ATTRACTIVENESS/ COMPETITIVINESS
Selected Locations are to be identified in a circuit
Identification of Indicators
Enumeration of Variable as per factors
Benchmarking as per established facts
Determining locations through Analytical Hierarchy Process (AHP) weighted Score
City wise analysis will be done by the waited ranks.
1.
2.
3.
4.
1. Number of Destination 2. Standards of
3. Standard of
Service 4. Standard of
5. Telecom Quality 6. Standards for Hygiene VARIABLES
PROCESS OF DETERMINATION OF DESTINATION INACIRCUIT As per the United Nations 1996, A study was conducted over 32 regions globally to determine the Tourist receipts and Distribution. And recommended enumerated core indications of sustainable tourism development,: • Site Protection • Stress • Use Intensity • Social Impact • Development Control • Waste Management • Planning Process • Tourist Transit • Consumer Satisfaction • Local Satisfaction
Geography of the destination is to be constant to perform reliability test, in order to reduce errors in analysis.
Market conditions are assumed constant.
Analysis is to be made on same scale
Tourism Typology must be constant.
Accommodation
Health
Local Transport
FACTORS 1. Cultural and Natural Attractiveness 2. Availability of
Facility
Tourist
DESTINATION ATTRACTIVENESS: A Case of Vietnam
A case of Vietnam is Studied as provided in a research by Huong T.T. Hoang of Vietnam National University (VNU). Vietnam is part of the Southeast Asian monsoon zone. The country stretches over a long narrow territory with various landscapes and seascapes such as mountains, hills, river deltas, coasts, beaches, and sea water bodies.

Amulti criteria evaluation was done with the following variable:


DESTINATION ATTRACTIVENESS: A Case of Vietnam


Based on Accessibility, the Map shows the major connecting areas in the region.
The interpretation of the data is ranged between the following values for the purpose of evaluation


Consistency index was calculated with lvalue The average consistencies of random matrices was incorporated to provide a weighted average to each destination

Based on the Tourism infrastructure, The following Alias of infra are identified to determine tourism potential:
• Transport Infrastructure
• Solid Waste Generation
• Standards ofAccommodation

• Nature ofAttractiveness (a)
METHOD
Multi Liner Regression is a statistical technique that can be used to analyze the relationship between a single dependent variable and several independent variables.

Questionnaires can be prepared to analyze the current case and determine the User need, however the questionnaires that are to be
floated would be subjected to Relatability test using Cronbach Alpha coeff.
Multiple linear models will be used as a summation to constitute for a equation
A base line formula will be derived as a summation of all the variables with their coeff.
FORMATION PRINCIPLE
Tourism Potential = Potential Aspects of Transportation + Potential Aspects of Solid waste generation + Potential Aspects of Accommodation
Coeff.
Potential
Determinants/ Variable
Number of Variable (n)
RESEARCH TOOL AND METHODS
Y i = a + β1χ1 + β2χ2 + β3χ3+ …..+ βnχn + �� ȳ = Tourism
a =
β =
χ =
ℰ =
=
Constant/ Intercept
Residual/ error i
A B C
MINITAB
LITERATURE REVIEW
The Process of literature review:
• Each head has a number of papers.
• Variable for analysis has been enumerated from each Manuscript.
• Analysis process has been identified and noted for further study.
Paper aims at community capacity building and finding relation between following varrible. stimulating change in social, cultural, environmental and economic dimensions, where tourism activities have had a close connection
Shiraj, S-W Iran MLR
participation (7 items), community leadership (6 items), community structure (5 items), skill and knowledge (5 items), community power (5 items), sense of community (7 items), resource mobilization (5 items) external support (5 items).
Lew (1987) discusses three major typology approaches for the classification of tourism attractions: 1. ideographic, 2. organizational approach, 3. the cognitive perspective.
Non Technical
1) Ideographic describes the concrete uniqueness of a site, rather than focusing on universal features. Typologies are identified individually by name, with which each group comprised of similar attraction types. Three tourist attraction categories are identified by this approach: nature, nature-human interface, and human.
2) The organizational approach does not examine attractions themselves but focuses on three categories: spatial features, capacity features, and temporal nature.
3) Cognitive perspective is based on tourist perceptions and experiences related to those attractions.
1. Capacity
2. Infrastructure 3. Tourism
4. Solid
5.
6.
7.
Building
Potential
Waste Management
Tourist Movement
Transportation
Ranking The literature review has been segregated into different heads such as :
No Category Paper / Book Name Author
Publisher Topic
Sl
Affiliation
Relation Review Study City/ Region Type of Analysis Variables (MODEL1)
1 Capacity Building Community Capacity Building in Tourism Development in Local Communities Ma'rof Redzuan Universiti Putra Malaysia Capacity Building Analysis through MLR
2 Capacity Building A framework of tourist attraction research Lew (1987) Northern Arizona University, USA Science direct segregation of destination
LITERATURE
The literature review has been segregated into different heads such as :
• Each head has a number of papers.
The Process of literature review: Sl
• Variable for analysis has been enumerated from each Manuscript.
Affiliation
Suraj V ayyappan, santhosh kumar P K jerlin jose
Christ university, bangalore Atna, journal tourism studies
Analysis of infrastructure typology, tourism demand function partial adjustment principle
To study the strength and significance of the relationship between foreign tourism demand and the different infrastructures, transport infrastructure is the most significant to foreign tourism demand and to domestic tourism demand
Orinary least square method and MLR
Railway telecom health urban roads aviation ports
4 Infrastructure Does infrastructure matter in tourism development Seetanah B University of mauritius
University of mauritius research journal
Infrastructure as a factor in destination development.
This paper investigates the significance of infrastructure as a factor in destination development. The classical demand for international tourism function is extended to include a proxy for infrastructure.
Mauritius Destination competitiveness MLR
Constant relative GDPF rooms distance infras
5 Infrastructure Infrastructure as important determinant of tourism development in the countries of southeast europe Sonja JOVANOVIĆ University of niš Eecoforum Tourism infrastructure, destination
Tourism infrastructure is the basis of tourism development and utilization of existing destination resources. Tourism infrastructure includes a large number of services, necessary to meet the needs of tourists and increase satisfaction during their stay at the destination.
Serbia Destination competitiveness MLR
Physical cultural service governance
2.
REVIEW 1. Capacity Building
Infrastructure 3. Tourism Potential 4. Solid Waste Management 5. Tourist Movement 6. Transportation 7. Ranking
No Category Paper / Book Name Author
• Analysis process has been identified and noted for further study. Publisher Topic
Relation Review Study City/ Region Type of Analysis Variables (MODEL1)
3 Infrastructure Infrastructural determinants of tourism in india
LITERATURE REVIEW
The literature review has been segregated into different heads such as :
The Process of literature review:
• Each head has a number of papers.
• Variable for analysis has been enumerated from each Manuscript.
• Analysis process has been identified and noted for further study.
12 Tourism potential Assessment of tourism potential in thane district, maharashtra, india Rajendra S. Suryawanshi University of pune, pune
IOSR journal of humanities and social science
Tourism potential
This study is carried out to analyze the potential of tourism in thane district of maharashtra. The types of tourism are landscape, landform and cultural. The weights were assigned to the village polygons on the basis of the value of variables The weights assigned range from 1 to 5. Using these weights a composite index for aerial differentiation based on the physical factors was defined
Thane Composite index
Accessibility to railways, national, state highways and district roads, government accommodation in terms of rest houses, market places, police stations, commercial banks, bus service, primary health centres
Safety and security inside the park
13 Tourism potential Tourism destination attractiveness as perceived by tourists visiting lake nakuru national park, kenya George ariya University of eldoret
International journal of research in tourism and hospitality
Tourism attractiveness compititiveness
Tourism destination attractiveness is the driving force for tourism in terms of visitors’ perceived value yet wildlife protected areas’ attractiveness like national parks has rarely been understood in tourism literature. The aim of this study was to establish tourism destination attractiveness as perceived by tourists visiting lake nakuru national park.
Eldoret-kenya
FL analysis, SD on ordinal scale
unique wildlife resources variety of wildlife resources proximity to attraction sites quality of park route signs quality of road systems abundance of wildlife resources park branding as rhino sanctuary park branding as bird sanctuary park entry fee guiding fee cost of meals and/or accommodation
14 Tourism potential Destination attractiveness and memorable travel experiences in silk road tourism in uzbekistan
Murodjon raimkulov
Sejong university, seoul Mdpi
Tourism attractiveness compititiveness
Explored the relationships between destination attractiveness, satisfaction, the sense of reliving, and loyalty among american tourists who had experienced silk road tourism in uzbekistan.
Uzbekistan Confirmatory factor analysis structural equation model
Gender age education marital status annual household income
1.
2.
3.
4.
Capacity Building
Infrastructure
Tourism Potential
Solid Waste Management 5. Tourist Movement 6. Transportation 7. Ranking
no Category Paper / book name Author
Publisher
Sl
Affiliation
Topic relation Review Study city/ region Type of analysis Variables (MODEL1)
LITERATURE REVIEW
Tourism Potential Analysis of Attraction Features of Tourism Destinations in a Mega-City Based on Check-in Data Mining A Case Study of Shenzhen, China
Location-based service information, provided by social networks, provides new data sources and perspectives to research tourism activities, especially in highly populated mega-cities
research project on the competitive position of Turkey vis-à-vis five countries in the Mediterranean basin: Spain, Italy, Greece, France and Cyprus. These partner countries are selfselected by foreign tourists and service providers (hoteliers, travel agents or tour guides) as the direct competitor to Turkey. The discussion of findings is based upon the analysis of data gathered from 1,086 respondents through a six-week period in the summer of 2004. Findings obtained from the two groups were then compared to each other usingt-test. Results suggest that both foreign tourists and service providers are homogeneous to suggest that Turkey is stronger on the friendliness of local people, but is weaker on the physical distance to the target markets and the effective using of methods for promotion and advertising.
Shenzhen, China Checkin Analysis Number of check ins
Quality of tourist services
Diversity of tourism products Level of hospitality / friendliness
Attractiveness of natural environment
Overall value for money Standard of hygiene and sanitation
Mediterranean basin: Spain, Italy, Greece, France and Cyprus
Factor Analysis, T-test,
Quality of local food and beverage Standard of accommodation facilities
Availability of nightlife and entertainment
Availability of sport activities and facilities
Availability of shopping facilities
Standard of health services Standard of facilities and activities for children
Quality of sea and beaches
Quality of local transport network and services
Quality of telecommunication network
1. Capacity Building 2. Infrastructure 3. Tourism
4. Solid
Management 5.
6.
7.
Potential
Waste
Tourist Movement
Transportation
Ranking The literature review has been segregated into different heads such as :
• Each head has a number of papers / Journals. • Variable for analysis has been enumerated from each Manuscript. • Analysis process has been identified and noted for further study. The Process of literature review:
/ Book Name
Sl No Category Paper
Author Affiliation Publisher Topic Relation Review Study City/ Region Type of Analysis Variables (MODEL1)
15
Zhihui Gu Shenzhen University MDPI
Tourism Destination Analysis
16 Tourism Potential Advancing Destination Competitiveness Reseaarch Ozan Bahar Mugla University
Journal of Travel & Tourism Marketing Destination Competitiveness
LITERATURE REVIEW
6 Solid Waste Management
Tourism induced Challenges in Municipal Solid Waste Management in Hill Towns: Case of Pahalgam Subzar Bashir Srinagar Development Authority, Srinagar, J&K, India Elsevier Solid waste Management
The Process of literature review:
• Each head has a number of papers.
• Variable for analysis has been enumerated from each Manuscript.
• Analysis process has been identified and noted for further study.
The study revealed that, in Pahalgam, tourism sector is the major generator of solid waste, The study also finds crucial issues related to lack of capacity of the local body and the issues related to lack availability of plain land, improper location of waste collection infrastructure.
Pahalgam Non-Tehnical
Street Sweeping Collection Cycle Waste Generation Accomodation Capacity Tourist Flow Floating Population Premanant Population
7 Solid Waste Management IntegratedModels for SolidWasteManagement in Tourism Regions: Langkawi Island,Malaysia Elmira Shamshiry
University of Kebangsaan Malaysia (UKM), Malaysia
Hindawi Publishing Corporation Solid waste Management
The problem in regulations of Langkawi Island has not been very effective according to questionnaire because inadequate institutional and human resource capacities to enforce them..
Langkawi Island Non-Tehnical
8 Solid Waste Management
9 Solid Waste Management
Prediction of
Solid Waste Generation
Rates
in Urban Region of Laos Using Socio-Demographic and Economic Parameters with a Multi Linear Regression Approach
Kanchan Popli Hallym University, Chuncheon MDPI
Prediction of SWM Generation
The predicted data for urban population, GDP per capita and urban solid waste generation rates will help the policymakers and the government to create a proper sustainable solid waste management policy in the country
Laos MLR
Urban Solid Waste Generation Rates
Gross Domestic Product (GDP) per capita
Urban Population Urban Literacy Rate Urban Poverty Incidence Urban Household Size Urban Unemployment Rate
Models of municipal solid waste generation and collection costs applicableto all municipalities in Thailand Chira Bureecam
irindhorn International Institute ofTechnology
Research Gate Model of MSW and Collection
This study showed the important link between population growth and urbanization will increase the amount of waste and the collection cost This can be a problem in the future for the management of local government with limited budget.
Thailand MLR
Household Size Population Density Area with or without M.Corp
1.
2.
3.
Capacity Building
Infrastructure
Tourism Potential 4. Solid Waste Management 5. Tourist Movement 6. Transportation 7. Ranking The literature review has been segregated into different heads such as :
Sl
No Category Paper / Book Name Author Affiliation Publisher Topic Relation
Review
Study City/ Region Type of Analysis Variables (MODEL1)
LITERATURE REVIEW
• Each head has a number of papers / Journals.
• Variable for analysis has been enumerated from each Manuscript.
Grzegorz Gołembski* University of Zielona Góra, Poland
consumer mood and thus the intensity and direction of tourism flows were influenced by violent socio-political changes,
There is a close relationship between tourism efficiency and transport accessibility, but tourism transport continued to improve, and spatial imbalance declined
Hubei, China DEA model Dijkstra Algorithm and Spatial Network Analysis
due to the rapid development of transport infrastructure and directions of tourist travels becoming more widespread what is in line with the development it is necessary to indicate an adequate strategy of promotional activities on foreign tourist markets.
Poland Isard’s (1954) gravity concept in international economics and MLR
no. of Star rated hotel no. of employee tertiary industry no. of travel Agency no. of A-Level Destinations 24 Transportation The impact of transport infrastructure on international inbound tourism –A GRAVITY MODEL FOR POLAND
Tourism Arrival, Income Per Capita Pop of Origin-Destination Export from Poland Risk of Tourists in Origin Country Difference between GDP Relative Price Distance Assessibility EU Membership
25 Transportation Transport Service as a Component of the Tourism Industry Development of Ukraine Hanna Brusiltseva
Simon Kuznets Kharkiv National University of Economics, Nauky SHS WC Destination development
the research on the impact of certain groups of transport infrastructure quality factors and tourist demand for transport services make it possible to claim their influence on the tourist destination development.
Ukrain MLR
transportation modes transport network fare or accessibility mobility integration of the connections and modes transport demand; a user of information mobility substitutes transport management factors of the land use telecommunications priority of the tourism development; the level of inaccessibility or isolation
1. Capacity
2.
3.
4.
5.
6.
7.
Building
Infrastructure
Tourism Potential
Solid Waste Management
Tourist Movement
Transportation
Ranking The literature review has been segregated into different heads such as :
• Analysis process has been identified and noted for further study. The Process of literature review:
Sl No Category Paper / Book Name Author Affiliation Publisher Topic Relation
Review Study City/ Region Type of Analysis Variables (MODEL1) 23 Transportation Analysis of the Relationships between Tourism Efficiency and Transport Accessibility A Case Study in Hubei Province, China Yaobin Wang Northwest Normal University, Lanzhou MDPI Tourism infrastructure, Destination
TYPES OF TOURISM
Tourism is considered as an activity essential to the life of nations because of its direct effects on the social, cultural, educational and economic sectors of national societies and on their international relations.
As per Ministry of Tourism, Government of India. Tourism can be classified as:
INFERENCE OF LITERATUE STUDY
Total Potential (V) = PotentialValue for PhysicalAspects (Vp) + Potential Value for SocialAspects (Vs) +
Potential Value for EnvironmentalAspects (Ve)
Potential (V) = ΣWi*[Σwjsj]
SELECTION OF CASE STUDY
Type: Cultural tourism
ASSUMPTIONS
1. Geography of the destination is to be constant to perform reliability test, in order to reduce errors in analysis.
2. Market conditions are assumed constant. 3. Analysis is to be made on same scale 4. Tourism Typology must be constant.
Source: Soumen Mitra & Abdulla Al Mamun
Cultural tourism is a type of tourism activity in which the visitor's essential motivation is to learn, discover, experience and consume the tangible and intangible cultural attractions/products in a tourism destination.
Tool: MLR – IBM – SPSS Statistics (Statistical Package for the Social Sciences)
Multiple equation will be formed for each determinant, and hence a summation equation will be made based on maximum output score.
DETERMINANTS OF INFRASTRUCTURE
1
TRANSPORTATION
SOLID
2
WASTE
Collection cycle
Tourist flow • Population
Household size
No of Accommodation
Disposal and treatment
Waste generation
3 • No. of Trip Generated • No of Parking at destination • Mode of transport • Condition of Road • No. of Destination per city • Population (Permeant) • Population (Floating) • Generation of Tourist
ACCOMODATION
• Duration of stay • Category of Hotel • Parking facility
• No. of Destination per city • Population floating • Need of Accommodation
1. Adventure tourism 2. Beach Tourism 3. Cultural tourism • Religious Tourism 4. Eco tourism 5. Medical tourism 6. Wildlife tourism
χ
χ
χ
•
•
•
•
•
•
LUKCNOW VARANASI PRAYAGRAJ AYODHYA


CITY-WISE ANALYSIS:
TRANSPORTATION SOLID WASTE ACCOMODATION χ1 χ2 χ3 • No. of Trip Generated • No of Parking at destination
Mode of transport
Condition of Road
No. of Destination per city
Population (Census)
Population (Floating)
Generation of Tourist • Collection cycle • Tourist flow • Population • Household size • No of Accommodation • Disposal and treatment • Waste generation • Duration of stay • Category of Hotel • Parking facility • No. of Destination per city • Population floating • Need of Accommodation DETERMINANTS OF INFRASTRUCTURE
•
•
•
•
•
•


CITY-WISE ANALYSIS: Perception Survey ] [ 1 3 5 7 9 TOURISM POTENTIAL INFRA POTENTIAL 54.89 54.31 43.9 32.25 25.47 0 10 20 30 40 50 60 70 0 5 10 15 20 25 Transportation X Y 1 2 3 4 5 ASSIGN WEIGHT OUT OF 100
CITY-WISE ANALYSIS: Based on Perception survey
VARANASI PRAYAGRAJ AYODHYA
Tourism Potential of Lucknow
Potential of
Tourism potential of Allahabad
Tourism potential of Ayodhya
ANALYSIS Based on the Analysis of Tourism potential VS Infrastructure, a Basic Minimum Average Value of 35.75 is calculated, through which the city eligible in the circuit is shortlisted. Lucknow (LK) and Varanasi (VA) is above the mean, Allahabad (AL) is near the mean, but Ayodhya (AY) with a score of 20, doesn't qualify to be in the circuit, hence it can be improved by improvement of infrastructure.
10
30
LUKCNOW
0 5 10 15 20 0
20
27.5 28
16.5 17 17.5 18 18.5
40 40.5 41 41.5 42 42.5 43 43.5 44 15 16 17 18 19
40 41 42 43 44 45 46 47 17 17.5 18 18.5 19
0 20 40 60
BMAV
28.5 29 29.5 30 30.5 31 31.5 32
Tourism
Varanasi LK VA AL AY 35.75 0 10 20 30 40 50 60
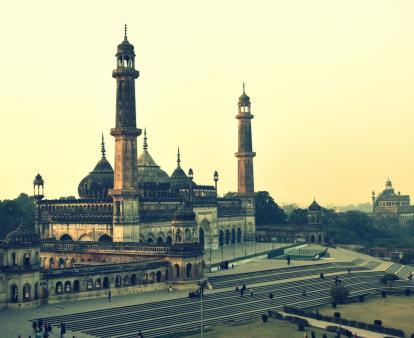
CITY-WISE ANALYSIS: 03 - Lucknow


Lucknow is the capital city of Uttar Pradesh and is the most developed city in the Northern India. With a rich cultural and heritage aspect, the city becomes a prime location for tourists. Lucknow International Airport makes this city an important transit city for other destinations.
URBANIZATION TRENDS
• The direction of growth in Lucknow have been observed towards northern, western and south eastern.

Demography
• The district's population increased from 36.47 lakhs in 2001 to 45.89 lakhs in 2011, resulting in increase in Urban Land use.
INTRODUCTION TO THE REGION
Lucknow
• Areas in the core Lucknow and heritage area has been under congestion due to high density

• The population is estimated increase to be around 10% to 12% since year 2015 of the total population.

MORPHOGICAL CHARACTER
Gomti River is the lifeline of the Lucknow city, as it divides the city into Cis and Trans Gomti region along both sides of the river Lucknow lies in Ganga basin with flat alluvial terrain and is covered with thick pile of Quaternary sediments overlying the basement of Bundelkhand Granitoids and sedimentary rocks of the Vindhyan Supergroup. The Quaternary sediments have been classified into Older and Newer Alluvium.
• The city reflects the riverine settlement pattern.
• River being the prime cultural importance, it defines the functions of the city
0 100 200 300 400 500 600 700 Builtup Agriculture Sand Water Scrub Open 1994 2018 Linear (2018)

Source: CDP Lucknow 2040
ANALYSIS
• The City of Lucknow being a Rivering settlement and being a important part of History of India shows a positive response to tourism.
• The city is exposed to high rate of commercialization and Land use shift.
Lucknow
Source: CDP Prayagraj 2041
4,000,000
3,000,000
2,000,000
1,000,000
• Maximum impact is observed in the built-up area. It encompassed 118 sq. km in 1996, to 350 sq km in 2011. 0
5,000,000 2001 2011
Population Floating Seasonal (Jan feb) Expon. (Floating)
Workforce of Lucknow
• With a increase in population, the floating population shows a gradual decrease in the last decade.
• The tourism led infrastructure is needed which would increase in the number of tourists.

Source: CDP Lucknow 2040
Source: CDP Lucknow 2040 0
4,000,000 Lucknow
2,000,000
Lucknow Population Workforce Migration
• The main industries of Lucknow are related to tourism, being the center for Chicken and Handloom.
• High dependency on tertiary sector can be observed, in development of Tourist product.
• Informal sector plays an important role in theEconomy.

Source: NCEUS 2020
Migration
Prayagraj
200,000
As per the Census of India, 2001, 8% of the total population in Lucknow UA comprises migrants Employment and moving with the household are two most prominent reasons for in migration to the city Of the 3 12 lakhs migrated into the city, 2,32,788 are from rural areas. They constitute 75% of the total migrants to the city 0

300,000 Outside Prayagraj R) Outside Prayagraj (U)
100,000
Population
Category Value Area 348 sq. km (Census 2011) Population 28.17 Lakh (28,17,105) (Census 2011) No of Zones / Wards 8 / 110 Planning Area Constituent 4 No. of Inbound Tourist / annum 19.27 Lakhs (1927363) (2020) Tourism type Cultural, Religious and Eco Tourism No of Destination 63(Ministry of Tourism) Transport Modes Rail, Roadways, water ways, Airways Number of Hotels 2443 (Official) (As per 2019) 49.50 Lakh 13500/ Day 63 4040
CITY-WISE ANALYSIS: 03 - Lucknow


Connectivity: Roadways
Lucknow is well connected by road, rail and airways with other parts of the country. Major Inter Regional Roads are:-
Road Category Connectivity
NH 30 Lucknow Sitapur Highway
NH 27 Lucknow Kanpur
NH 731 Lucknow Hardoi
Lucknow gets good connectivity through air, rail and Lucknow is a tourism hub both for domestic tourists International tourist. Hence its connectivity from and Other major city boosts its tourism sector being trading hub connected to delhi and other part country provides a good market for selling manufacture goods

ECONOMY
• Lucknow Contributes 4% in the Gross State Product of Uttar Pradesh, which in total have 76 where the main source of Revenue is Agriculture, Industrial Sector and Tourism respectively
In the tertiary sector, the city is a huge attraction tourists and pilgrims who come here for various activities.

Source CDP Lucknow 2040

Total Area under Road in Lucknow municipal corporation is 34,480 Ha, which is divided into four major categories, Highways, Arterial, Sub-Arterial and Others.
Connectivity: Railways
The Rail Network of Lucknow is well developed with 14 number of stations connecting cities including New Delhi, Mumbai, Kolkata, Chennai, Bangalore, Pune, Kanpur and Jaipur. The Metro Rail network operated by LMRC includes 21 metro station operating Lucknow airport and Munshipulia.
Connectivity: Metro
Lucknow Metro Rail Corporation operates Metro Rail in Lucknow. There is corridor of Lucknow Metro North-South (running) from Amousi Airport to Munshipulia Crossing and East West (Proposed) corridor from Vasant Kunj to Charbagh Railway Station.
Connectivity: Airways
Airport operating to major Indian Cities and few international destinations such as UAE, Hong Kong and Thailand.
Source: CDP Varansi 2041
INFORMAL SECTOR
Lucknow city this ratio has been on higher side where almost 5% of the population are engaged in various informal sectors like street vendors, weekly markets, road side stalls etc. Weekly markets are organized in different parts of the city in an unorganized way.
SPATIAL CHARACTER
• The built-up area of Lucknow is now approached towards Amausi Airport along the Lucknow-Kanpur Highways, towards south-east of LucknowRaebareily road, and Lucknow Hardoi road. It has been found that the spatial extent of urban sprawl is not linear or nodal in character, it seems to spread radial in all direction and is equally on both side of River Gomti.
the City and some also along the major Roads
• Tourism led Infrastructural development is aligned towards the periphery
• The least area in Land Use distribution is of Public Utilities
• Recreation area which has reduced to about 5% in the past decade

TOURISM TRENDS IN LUCKNOW CITY
Lucknow is known for its rich history and culture manifested by magnificent monuments of the past. Lucknow’s heritage can be categorized into various heads such as Forts, kothis, monuents, open spaces, gardens, etc.
The aim of the heritage walk is to make the people aware about the rich cultural heritage of the city The purpose of this walk is to make the new generation aware about our assets and heritage and teach them how to conserve it. The Lucknow heritage walks take place every weekend and conducted by experienced and knowledgeable walk leaders/volunteers. Visitors are provided with illustrated information material which includes relevant facts about the monuments, a route map etc.
Source: CDP Lucknow 2040
Tourism Alied Functions of Lucknow City
Area along both the side of Gomti River has been identified as Heritage Zone in Lucknow Master Plan 2021. The zone is divided into three parts namely

• Hussainabad Complex,
• Kaiserbagh Complex and
• Le Martinire Complex. Approx fifteen key heritage structures of Lucknow are located in this identified zone. Apart from monuments some of the major parks also come under these complexes i e Buddha Park, Hathi
Source: Author 2022 wrt CDP
Tourist Impacted areas under Study

• 20 km Radius in core City
• Banks of River Gomti
Lucknow
Seasonal Character
INTER ZONE CIRCUIT

The total route covers 18 Destinations and is divided into 3 major tourism zones
• Route covers 3 major areas with the Urban Limit,

• Hussainabad Complex,
• Kaiserbagh Complex and
• Le Martinire Complex.
• Impact 4 major Highways and state Highways
Source: CDP Lucknow 2041
Bihar Delhi Gujrat
Tourism Stakeholder
• ASI
• Ministry of tourism
• Regional Cultural Center
• Directorate of Archeology, UP
• Lucknow Development Authority
• Lucknow Municipal Corporation
• Heritage Cell
Tourism
Product
• Chicken craft • Zari crafts
• Handlooms
Source: CDP Lucknow 2040
0
2 per. Mov. Avg. (Tourist Flow (in Lakhs))

Based on the observation on the tourist Inflow statistics, a steady decleation is been observed from 2001 to 2018, but a growth of inflow can be seen in 2020, pandemic being a prime reason for revenge tourism
Source: UP Tourism
Seasonal Tourist inflow can be observed during Early December to April. This is the peak season and the need of Infrastructure increases in the city.
• Local craft products
• Bamboo products
50 100 150 2001 2011 2018 2020
0 200 400 600 800 1,000 1,200 1,400 Lucknow Population
CITY-WISE ANALYSIS: 03 - Lucknow
AP 4% WB
12%
4% AP
27% Bihar
Delhi 53% Gujrat
WB
TRANSPORTATION
Lucknow is one of the most important administrative centres as well as educational and cultural capital of Uttar Pradesh. Being a state capital city is well connected with other major towns of the state through national and state highways. Lucknow is connected to Delhi via NH 24, railways and airways, NH 25 connects the city to Jhansi (UP) and Shivpuri (MP), NH 28 to Barauni in Bihar, NH 24 B to Raibareli and NH 58 to Varanasi. There are two state highways crossing through the city.
Public Transportation in the City
• The modal share of non-motorized transport including walk, bicycle, and cycle rickshaw is 41%, which is the second-highest modal share in the city.

• There is corridor of Lucknow Metro North-South (running) from Amousi Airport to Munshipulia.
• UPRSTC operates 12429 busses in the city which are divided into Inter-state and Intrastate
• bus servicesParking Facility
Core City:
• Parking is a major problem in the city due to insufficient offstreet parking facility. Parking generally takes place along the roads in front of the commercial establishments, and public and semi-public establishments.
• Highest peak hour accumulation was observed at Allahabad Junction Railway Station on both City side and civil lines side
• Demand/Supply gap analysis indicates that there is an excess demand in case of on-street parking.
Tourism led Impact on Transportation
1. Transportation is impacted as the inclination towards public transportation increases.
2. Increase in Non state registered vehicles
3. Increase in demand of parking spaces around destination can be observed due to increase in on-road parking.

4. Informal market tends to increase in the core areas of the city.
5. Increase in trends of commercial encroachments Reduces ROW
Source: CMP Lucknow 2040

Old City
• Major core of traffic congestion along the major streets and narrow local streets.
• High speed / unaccounted hi-speed traffic is observed in the Local streets.
• Major intersections in the City has Active control, while local streets largely depends on passive control.
• On street parking can be observed due to uncontrolled commercialization along major roads.
New Developed Zone

• The road conditions are good but the road capacity is reduced due to the presence of a large number of slow moving vehicles and idle parking
• There is a high level of conflict between pedestrians and vehicular traffic in several parts.
• Lack of footpath raises safety concern.
• The existing right-of-ways for road network in Lucknow vary up to 30m.
• The wholesale and retail trade activities are also located in this part of the city which further creates congestion and bottlenecks.
• The old city comprises of closely spaced residential areas of Hussainganj, aliganj, etc.
6. Increase in private vehicles contribute towards congestion in the core city
7. Increasing tends of accidents near destination can be observed
8. Lack of pedestrian access to the destination.

INDICATOR Length (km) Total length of city roads in AMC area 3387 Paved tar roads 2578 Unpaved roads 809 Road area per capita 0.90 m
Development as per URDPFI
2W 42% NMT 41% 4W 5% Auto
2% PT 10% 2W NMT 4W Auto
Rickshaw
Rickshaw PT Modal Split
CITY-WISE ANALYSIS: 03
Lucknow
-
SOLID WASTE MANAGEMENT
The Lucknow city with population of 34 lakh, is adding on commercial centers and new urban extensions providing housing & services resulting into 50% additional generation of waste about 1812TPD in last 20 years. There are residential, commercial, industrial and institutional establishments. Lucknow Municipal Corporation has outsourced a third-party organization, M/s Eco green Energy Private Ltd for collection and transportation of


Composition of Solid
Source: Author 2021
• The wastes are taken to the transfer stations Biomedical waste generated in hospitals, nursing homes and clinics includes used syringes, cotton, human and animal tissues, apart from domestic waste
• The waste collected from each of the primary collection points is transported to designated open dump areas and DP containers (mostly on the main roads), which are the secondary collection points.
• M/s Eco green Energy Private Ltd for collection and transportation of wastes from residential as well as commercial
INDICATOR
• Waste is generated from various sources which is being managed effectively by the SWM systems established in the city. There are residential, commercial, industrial and institutional establishments. Lucknow Municipal Corporation has outsourced a third-party organization
Mixed Waste 8%
Constructi on Debris 16% Bio degradable Recyclable Drain Silt
Drain Silt 9%
waste Bio degradabl e 49% Recyclable 18%
Mixed Waste
• Per capita solid waste generation in the city is 0.79 kg/cap/day
• Tourism plays a major role in contribution of plastic in the composition
• The composition of MSW shows mostly organic matter (45 3%), so composting is a good method for the treatment and production of soil amendment
• Hotels in Lucknow accounts 2% of total MSW.
• LMC spends on average 21% of its total budget on solid waste management.
Treatment
• Unsegregated waste is transported to the treatment site in Baswar. The site is located at a distance of 19 Km from the city on an area of 25 hectare The facility houses a 500 TPD mechanical composting treatment plant and landfill site
Disposal
• Disposed in nearby low lying areas (uncontrolled)
• Site selection is based on availability, not on scientific and social environmental criteria(LNN).
• At present LMC has 6 active landfill sites namely:-
• Dubagga
• Jehta Mor Bundha
• RR Bhawan
• Daliganj Flyover
• Tile wale masjid
• Teli Bagh Bhatha maidan
Tourism led Impact on SWM
1. tourists produce up to twice as much waste as local residents.
2. Tourism has the potential to build awareness around the issues and spur waste infrastructure improvements.
• Door to door collection is present in 60% of Lucknow Residntial areas.
• Segregation of recyclable waste at source is not practiced. There is need to spread awareness on practicing segregation of waste
VALUE Total household served with D2D collection 80% Total waste generation 1129 TPD Total waste collected 900 TPD
of dustbins 80
215
Total number
Total number of vehicles
Frequency of collection (trips/day) 2 - 3
CITY-WISE ANALYSIS: 03 - Lucknow
CITY-WISE ANALYSIS: 03 - Prayagraj
Allahabad is a major urban agglomeration located in the south eastern region of the state of U.P; Allahabad Urban agglomeration is formed of the Allahabad Nagar Nigam area, Subedarganj Railway colony area and the cantonment.

URBANIZATION TRENDS
Demography
INTRODUCTION TO THE
Prayagraj
The pace of urbanization has historically been lower in the state. Urbanization in 2001 was 20.78% and it grew to 22.27% in 2011. The numbers of urban centers with more than one lakh population have grown slowly over the last thirty years
The city which has been visited by around 5.30 crore tourists in the last five years has the potential to become a tourist hub in Uttar Pradesh. On an average tourist arrival in Allahabad is 15-20 per cent of total tourist traffic in the state.
• The district's population increased from 49.37 lakhs in 2001 to 59.54 lakhs in 2011, resulting in increase in Urban Land use.
• Maximum impact is observed in the built-up area. It encompassed 285 sq. km in 1996, to 309 sq km in 2011.
Prayagraj
20,000,000
10,000,000
0
2001 2011
Population Floating
Seasonal (Jan feb) Expon. (Floating)
Workforce of Prayagraj
• With a increase in population, the floating population shows a gradual increase in the last decade.
• The tourism led infrastructure is needed most during the seasons, as users double during seasons.
Source: CDP Prayagraj 2041
Prayagraj
0 10 20 30 40 50 60
MORPHOGICAL CHARACTER
The geology map of Allahabad city shows the existence of Terrace Alluvium and Varanasi Alluvium as a geologic unit The Varanasi older alluvium, a polycyclic sequence of yellowish brown clay-silt and fine sand with dissemination of kankar, is found in the north of Yamuna.


Allahabad tahsil which depicts a flat plain except some undulation land along the rivers.
• The city reflects the riverine settlement pattern.
• River being the prime cultural importanace, it defines the functions of the city
10,000,000
Source: CDP Prayagraj 2041 0
Allahabad
Population Workforce Migration
Builtup Agriculture Sand Water Scrub Open 1994 2018 Linear (2018)
Source: CDP Varansi 2041
ANALYSIS
• High trend in urbanization in Prayagraj shows a dependency on Tertiary sector leading to largescale of Urban Migration.
• Decrease in Agriculture and Increase in Built up
Source: CDP Prayagraj 2041
• The main industries of Allahabad are tourism, being the center for pilgrimage.
• High dependency on tertiary sector can be observed, product being clothes and Spice.
• Informal sector is in the prime dominance as per NCEUS.
Source: UPNHM 2020
Migration
Prayagraj
As per the Census of India, 2001, 15% of the total population in Allahabad UA comprises migrants Employment and moving with the household are two most prominent reasons for in migration to the city Of the 1 5 lakhs migrated into the city, 53,774 are from rural areas. They constitute 33% of the total migrants to the city. 0
200,000 Outside Prayagraj ( R) Outside Prayagraj (U)
100,000
Population
Category Value Area 132 sq. km (Census 2011) Population 11.17 Lakh (11,17,094) (Census 2011) No of Zones / Wards 7 / 80 Planning Area Constituent 4 No. of Inbound Tourist / annum 3.59 Cr (3,59,33,758) (2020) Tourism type Cultural, Religious and Eco Tourism No of Destination 14 (Ministry of Tourism) Transport Modes Rail, Roadways, water ways, Airways Number of Hotels 2443 (Official) (As per 2019) 44.00 Lakh 12500/ Day 14 2443
REGION
Connectivity: Roadways
prayagraj is well connected by road, rail and airways with other parts of the country. Major Inter Regional Roads are:-

Prayagraj gets good connectivity through air, rail and road. Prayagraj is a tourism hub for domestic tourists. Hence its connectivity from Varanasi and Lucknow boosts its tourism sector Varanasi being trading hub connected to delhi and Lucknow provides a good market for selling the Local manufactured products (Furniture)
ECONOMY
• Tertiary sector of economy generates the maximum potion of the chart.

• Tertiary sector employs 70% of the Workers.
• Primary sector has been decreasing over time, and dominance of tertiary and secondary sector can be observed.

Source: CDP Varansi 2041
Allahabad is well-connected with other parts of the country by rail and road network Existing NH-2 (Grand Trunk Road) divides the city into two parts – the Civil Lines area and the Old City area The Allahabad Bypass, connecting NH-2, is a part of the National Highway Development Program (NHDP).


Connectivity: Railways
Allahabad Junction is one of the main railway junctions of northern India It is the headquarters of the North Central Railway Zone. The four prominent railway stations of Allahabad are Prayag Station, City Station at Rambagh, Daraganj Station and the main station is Allahabad Junction Allahabad is also connected to most cities in Uttar Pradesh such as Jhansi, Kanpur, and Lucknow Allahabad also lies in the path of the proposed eastern dedicated freight corridor (EDFC
Connectivity: Airways
There is an airport at Bamrauli which is about 10 kilometers from Allahabad. Presently, limited flights are available from this airport. The second nearest airport is at Varanasi that is 125 km from Allahabad.
Connectivity: Waterways
Allahabad is the starting point of National Waterway No 1 (NW-1), which was declared in 1986 NW-1 is a 1,620 km-long waterway between Allahabad and Haldia
Source: CDP Varansi 2041
Source: CDP Prayagraj 2041
In the tertiary sector, the city is a huge attraction for tourists and pilgrims who come here for various religious activities.
INFORMAL SECTOR
Source: CDP Prayagraj 2041
The activities that relate to provision of services to tourist especially need attention. Organized activities for tourists that are monitored and provided at one stop would significantly help the tourists who are usually hassled in the city.
SPATIAL CHARACTER

• The core city area has not grown as it is bound by rivers on three sides. Over the past decade, major unplanned development has taken place in Jhusi and Phaphamua. Naini was initially promoted as an industrial area.
• vacant spaces in the immediate neighborhood of the Ganga were filled in by Pukka houses.
• The urban area of Prayagraj continued to expand along the riverfront through the 19th century
• The old/core city is over crowded, resulting in high pressure on existing infrastructure The new development option city has to sprawl out.

• Tourism led Infrastructural development is aligned towards the periphery
• Recreational and open areas are not present in the core area Thus, the city is in immediate need of lung spaces and common facility spaces.
Road Category Connectivity Width NH 2- G.T. Road Mughal Sarai to Allahabad (Prayagraj)CITY-WISE ANALYSIS: 03 - Prayagraj
CITY-WISE ANALYSIS: 03 - Prayagraj
TOURISM TRENDS IN PRAYAGRAJ CITY
The city of Allahabad is among the largest cities of Uttar Pradesh and situated at the confluence of three rivers- Ganga, Yamuna and the invisible Sarasvati. Though the city is known for its religious tourism, but echelon into three categories viz. Historic, Cultural and Religious.
category as per
i. History flank includes Alfred Park, Victoria Memorial, Mayne and Thornhill Memorial aka Allahabad Public Library, Minto Park, Allahabad Fort, Ashoka Pillar and Khusro Bagh ii. religious attraction comprehend Kumbh Mela, Triveni Sangam and All Saints Cathedral iii. cultural segment has Allahabad Museum, Jawahar Planetarium and the University of Allahabad.

Tourism Alied Functions of Allahabad City

Kumbh Mela is considered to be largest peaceful gathering in the world with over 100 million people visiting during the Maha Kumbh Mela in 2013.
Melas are Classified into 4 category:
• Maha Kumbh Mela – 144 Years cycle
• Purna Kumbh – 12 Years cycle
• Ardh Kumbh mela – 6th year after kumbha mela
• Kumbha Mela – Every 3 years cycle
Components of Infrastructure:
• Sangam is undeveloped and even lacks basic facilities. The site does not have proper drinking water and sanitation facilities.
INTER ZONE CIRCUIT
The total route covers 14 Destinations and is divided into 3 major tourism types
• Route covers 3 major areas with the Urban Limit,
• Sangam Ghats
• Core City of Prayagraj
• Heritage areas
• Impact 2 major Highways out of one under Asian Highway network.
Source: CDP Prayagraj 2041
Tourism Stakeholder
• ASI
• Ministry of tourism
• Regional Cultural Center
• Directorate of Archeology, UP
• Prayagraj Development Authority
• Prayagraj Municipal Corporation
• Allahabad Heritage Cell
Tourism Product
• Moonj Products
• Furniture
• Palm Crafts

• Terracotta and pottery
• Cane furniture
Source: Author 2022
Tourist Impacted areas under Study
• 15km Radius in core City
Source: CDP Prayagraj 2041 2852
• Lack of proper solid waste management during the peak tourist months.
• Lack for transportation infrastructure.
• A systematic area development plan is needed for the sangam area.
Source: CDP Prayagraj 2041
• Banks of River Yamuna and Ganga
Seasonal Character
Prayagraj
100
60
80
0
20
40
120 2001 2011 2018 2019 2020
Based on the observation on the tourist Inflow statistics, a steady growth is been observed from 2001 to 2018, but a declination of inflow can be seen in 2020, pandemic being a prime reason.
Source: UP Tourism
Population
Seasonal Tourist inflow can be observed during November to February. This is the peak season and the need of Infrastructure increases in the city.
Prayagraj Tourist Flow (in Lakhs)
August September October November
January February March April May June July
December
TRANSPORTATION
Allahabad is bound by the rivers Ganga and Yamuna in the northern, eastern and southern sides, the city has shown significant linear growth along the NH-2 towards the airport in the western direction. National Highway 2 divides the city into two halves. The old city area is located in the southern part. The area is heavily built-up and characterized by mixed commercial, residential and transport related activities, although majority of the area is dotted with narrow lanes.
Public Transportation in the City
• As per CMP 2012, 2031 the traffic and transportation situation of will be completely unsustainable with only 10% trips by PT against a crucial 71% private modes.
• City Bus Augmentation and integration of City Bus System with IPT modes in an organised and rationalized manner, about 21% PT share is achieved. There are 44 routes.
Parking Facility
Core City:
• Parking is a major problem in the city due to insufficient offstreet parking facility. Parking generally takes place along the roads in front of the commercial establishments, and public and semi-public establishments.
• Highest peak hour accumulation was observed at Allahabad Junction Railway Station on both City side and civil lines side
• Demand/Supply gap analysis indicates that there is an excess demand in case of on-street parking.
Modal Split
Source: CMP Prayagraj 2041
Old City
• The old city has an irregular road network comprising of major roads, which are almost 2-3 lane wide.
• The width of these lanes varies from 1 to 2 meters and only pedestrian movement is possible.
• The secondary roads are narrower and congested due to encroachment in Attarsuiya and Malviya Nagar.
• Commercial encroachments considerably reduce the available RoW on all the roads leading to the Ghats.
New Developed Zone
• The road conditions are good inside the walled city, but the road capacity is reduced due to the presence of a large number of slow moving vehicles and idle parking
• There is a high level of conflict between pedestrians and vehicular traffic in several parts.
Development as per URDPFI
Tourism led Impact on Transportation
1. Transportation is impacted as the inclination towards public transportation increases.
2. Increase in Non state registered vehicles

3. Increase in demand of parking spaces around destination and River Fronts can be observed due to increase in onroad parking.
4. Informal market tends to increase in the core areas of the city and around the Sangam area
5. Increase in trends of commercial encroachments Reduces ROW and congestion take place
6. Increase in private vehicles contribute towards congestion in the core city.
7. Increasing tends of accidents near destination can be observed.
8. Lack of pedestrian access to the destination and lack of Bicycle friendly infrastructure
9. Decongestion and Alternate routes for linkages through Ganga and Yamuna River during Kumbh mela
10. Lack of Controlled Intersection
• The existing right-of-ways for road network in Allahabad vary upto 30m.

• The wholesale and retail trade activities are also located in this part of the city which further creates congestion and bottlenecks.
• The old city comprises of closely spaced residential areas of Mohatsamganj,
Length
Total length of city roads in AMC area 2357 Paved tar roads 2277 Unpaved roads 208 Road
per
1.87
INDICATOR
(km)
area
capita
m
2W 32% Cycle 16% 4W 30% Auto Rickshaw 10% Walk 3% NMT 9% 2W Cycle 4W Auto Rickshaw Walk NMT
CITY-WISE ANALYSIS: 03
Prayagraj
-
SOLID WASTE MANAGEMENT
Due to dispute arising out of tipping fee payment the contract has been terminated and AMC is now undertaking secondary collection and transportation of waste.
The local residents of towns generate solid waste at the rate of about 450 grams per capita per day on an average.
Composition of Solid waste

• Waste composition depends on a wide range of factors such as food habits, cultural traditions, lifestyles, climate and income, etc.
• The city has a large number of hotels and restaurants and more than 180,000 households. There are 20 vegetable, 5 fruits, 5 meat and 5 fish markets in the city leaving behind a large quantity of mixed waste rich in organic contents.
Cardboard 6%
Glass 7%
Paper 9%
Source: Author 2021
• Segregation of waste at source is not practiced in Allahabad
As per the secondary survey, there are no transfer stations also in Allahabad city wherein waste is segregated before dumping at the final disposal site


• The waste collected from each of the primary collection points mentioned above is transported to designated open dump areas and DP containers (mostly on the main roads), which are the secondary collection points.
• There are nearly 50 such points and about 160 bins spread over all 80 wards of the city.
INDICATOR VALUE
Total household served with D2D collection 0%
Total waste generation 500 TPD
Total waste collected 400 TPD
Total number of dustbins 80
Total number of vehicles 26
Frequency of collection (trips/day) 2 - 3
Treatment
Ash 5%
Food waste 32% Plastic 22% Textile 10%
Leather 6% Other 3% Food waste Plastic Textile Paper Glass Cardboard Ash Leather
• Per capita solid waste generation in the city is 0.45 kg/cap/day
• Tourism plays a major role in contribution of plastic in the composition .
• Bio-medical is treated at a common facility in Allahabad for medical waste collected from Allahabad and Pratapgarh. The site is located in Maheva Purabpatti, Mirjapur. Waste is treated by incineration and shredding The treatment capacity is 60 Kg per hour
• Unsegregated waste is transported to the treatment site in Baswar. The site is located at a distance of 5 Km from the city on an area of 25 hectare The facility houses a 350 TPD mechanical composting treatment plant and landfill site for a produce of 1000 MT per day during the season
Disposal
• The site is located at a distance of 19 Km from the city on an area of 25 hectare
Tourism led Impact on SWM
1. tourists produce up to twice as much waste as local residents but Prayagraj shows 50 gram over the national standard of 400g per person per day
2. Tourism has the potential to build awareness around the issues and spur waste infrastructure improvements.
3. Tourism causes pollutants to be released into the river during various cultural events.
4. Plastic being the major contribution of the tourism industry accounts 22% of the composition.
Issues
• Door to door collection is absent
• Segregation of recyclable waste at source is not practiced. There is need to spread awareness on practicing segregation of waste
• The waste collection centers are not being well managed
• Collection bins have huge waste overflowing on the streetsstray animals and other factors
• Dumping of garbage into the drains, leads to choking of drains
• User charge collection efficiency is low
CITY-WISE ANALYSIS: 03 - Prayagraj
CITY-WISE ANALYSIS: 02 - Varanasi
Varanasi, or Benaras, (also known as Kashi) is one of the oldest living cities in the world. Varanasi has also been a great center of learning for ages. Varanasi is associated with promotion of spiritualism, mysticism, Sanskrit, yoga and Hindi language
URBANIZATION TRENDS

Demography
INTRODUCTION TO THE REGION
Varana
si
It is the oldest living city and is heterogeneous with multiple layers of religion, culture, art forms, believes nature, profiles and individualities It is a sacred and holy place to Hindu, Buddhist, Jain and Muslim religion. It is also the home to numerous religious monuments (4000 temples, 300 mosques) and is famous as a Centre of music, arts, crafts, education and learning
• The district's population increased from 31.39 lakhs in 2001 to 36.77 lakhs in 2011, resulting in increase in Urban Land use.
• Maximum impact is observed in the built-up area. It encompassed 110.74 sq. km in 1996, to 130.6 sq km in 2011.
Varanasi
MORPHOGICAL CHARACTER
The northern part of the region is alluvial plain The western part of the district is also a plain sloping towards the east and south-east, A long tract of Khadar land is found along the Ganga river throughout the region. Banger plain comprises the northern part of the Ganga river and is similar to most of the parts of Pindara. Varanasi tahsil which depicts a flat plain except some undulation land along the rivers.

• The city of Varanasi houses 88 Mystical Ghats on the Bank of the River Ganga.
• The city reflects the riverine settlement pattern.
Source: CDP Varansi 2041
4,000,000
3,000,000
2,000,000
1,000,000
0
• With the increase in population, the floating population in Varanasi is increased by 152% since 2001 to 2011.
2001 2011
Population Floating Expon. (Floating)
Workforce of Varanasi
Varanasi
• This is led to the concern to increase the tourism infrastructure of the city
Source: CDP Varansi 2041
Source: CDP Varansi 2041
ANALYSIS
• The change in land use pattern can be observed in the built area from a transition between 1996 to 2017, a steep increase in built area can be seen.


• A wide scale commercialization started in Varanasi due to conversion into commercial plots.
Source: CDP Varansi 2041
0 5,000,000
Varansi Pindara
Population Workforce
Migration Expon. (Workforce)
• As per Survey by Ashutosh Shukla (UPNHM), around 33.1% of the population is under age group 21 – 35 which compose 48% Rural to Urban migration population.
• City has around 37.6% of slum population which is one third of total population encroached upon the government land.
Source: UPNHM 2020
Migration
Varanasi District has experienced a 10 7% of the state's migration Varanasi district does not attract many residents from other states of the country 85% of the migrant population in the district is from within the state Out of this, 69% are from the rural areas pointing primarily to distress migration.
Varanasi
1,000,000
500,000
0
Outside Varanasi ( R) Outside Varanasi (U)
Population
Category Value Area
Population
No of Zones / Wards 4 / 110 Planning Area 2 No. of Inbound Tourist / annum
Tourism type Cultural, Religious
Tourism No of Destination 39
Transport Modes Rail, Roadways, water ways, Airways Number of Hotels 9298
60 Lakh 16500/ Day 39 9298
130.00 sq. km (Census 2011)
11.98 Lakh (11,98,000) (Census 2011)
9.82 Lakhs (9,82,492) (2020)
and Eco
(Ministry of Tourism)
(Official) (As per 2019)
CITY-WISE ANALYSIS: 02 - Varanasi

Connectivity: Roadways
Varanasi is well connected by road, rail and airways with other parts of the country. Major Inter Regional Roads are:-


Road Category Connectivity Width
NH 2- G.T. Road Mughal Sarai to Allahabad (Prayagraj)
NH 29 Varanasi to Gorakhpur, Kushinagar
NH 56- Varanasi to Jaunpur Lucknow.
Varanasi gets good connectivity through air, rail and road from here as it is a tourism hub both for international and domestic tourists. Hence its connectivity from Delhi boosts its tourism sector Also Delhi is a good trading hub, therefore good connectivity with Delhi is providing a good market for selling the handloom manufactured products
ECONOMY
• Secondary sector of economy generates the maximum potion of the chart.

• Manufacturing employs 40% of the Workers.
• 50% of workers are employed in spinning and weaving industry.
Source: CDP Varansi 2041
These National Highways and state highways have high passenger traffic as these roads provide a good connectivity to the surrounding areas in the U P state as well as to metropolitan cities like Delhi and Kolkata. The Grand trunk road or NH-2 forms the main transportation spine of the city.
Connectivity: Railways
There are three rail lines entering to the city from Lucknow, Bhadoi and Allahabad and is diverted in two lines to Gorakhpur and Mughal Sarai The city lies on Delhi-Kolkata rail route of North Eastern Railways, which is the broad gauge
Connectivity: Airways
The town also has an airport at a distance of about 24 km away from the city. There are flights to Varanasi from Agra, Bhubaneswar, Kolkata, Delhi, Gorakhpur, Khajuraho, Lucknow, Mumbai, Raipur and Kathmandu (Nepal). It
Source: CDP Varansi 2041
Source: CDP Varansi 2041
In the tertiary sector, the city is a huge attraction for tourists and pilgrims who come here for various religious activities.
INFORMAL SECTOR
The activities that relate to provision of services to tourist especially need attention. Organized activities for tourists that are monitored and provided at one stop would significantly help the tourists who are usually hassled in the city. Kiosks for service providers could be established
SPATIAL CHARACTER
• significant is the -increase in the pakka houses which rapidly encroach upon the kachcha houses.
• vacant spaces in the immediate neighborhood of the Ganga were filled in by Pukka houses.
• The urban area of Varanasi continued to expand along the riverfront through the 19th century

• Northern and the North eastern railways along with the construction of the railway bridge near Rajghat, installation of water works and provision of improved sewerage and drainage works widely modified the cultural landscape of Varanasi in the last quarter of the nineteenth century
Source: CDP Varansi 2041
• The areas of Old City have become congested. The area is compact with high density. This leads to chaotic development of the area.
• The new development option city has to sprawl out.
• Tourism led Infrastructural development is aligned towards the periphery.

CITY-WISE ANALYSIS: 02 - Varanasi


TOURISM TRENDS IN VARANASI CITY
Varanasi heritage entails not only the famous Ghats and the historic properties along them but also the houses and the streetscapes in the area adjoining the Ghats, temples, Kunds, and all cultural practices and expressions that take place in these properties and areas.
Heritage areas are divided into 6 zones as per
i. Rural Buffer District the green strip of 300m wide.
ii. Landscape conservation district iii. 5.5 km long crescent shaped basin of the Ganga river from Nagwa to Raj Ghats iv. 5.3 km stretch of 83 Ghats
v. Urban Preservation Sub-Zone
vi. Urban Buffer SubZone, a strip of 50 m to 100 m wide
Source: CDP Varansi 2041
Source: CDP Varansi 2041
INTRA ZONE CIRCUIT
The total route covers 88 5km (25 krosha) and is divided into five parts marked by overnight stops
• Route covers 4 major areas with the Urban Lumit,
• Kard Madeshwar
• Manikarnika
• Shivpur
• Kapildhara
• Impact 3 major Highway
Tourism Stakeholder
• ASI
• Ministry of tourism
• Regional Cultural Center
• Directorate of Archeology, UP
• Varanasi Development Authority
• Varanasi Municipal Corporation
• Varanasi Heritage Cell
Tourism Product
• Varanasi Silk
• Crats Manufacturing
• Retail Commercial Goods
• Local Culinary goods
Character
50
0
Varanasi Population
100 2001 2011 2018 2020
Based on the observation on the tourist Inflow statistics, a steady growth is been observed from 2001 to 2018, but a declination of inflow can be seen in 2020, pandemic being a prime reason.
Source: UP Tourism
Source: CDP Varansi 2041 0 1 2 3 4 5 6
Varanasi Population
Seasonal Tourist inflow can be observed during October to February. This is the peak season and the need of Infrastructure increases in the city.
TRANSPORTATION
The city of Varanasi has grown outwards towards the west using the crescent shape of the River Ganga. This growth was facilitated by the growing transport network in this direction.
Public Transportation in the City
• Under JNNURM, VMC procured 130 buses and ferrying close to 20,500 passengers per day.
• Most of the routes are in the peripheral areas of Varanasi, as the buses cannot ply in more dense parts of the city.
• There are 44 routes but at present 2 routes are shut down hence 42 routes are plying.

Parking Facility
Core City:
• There is varied land-use pattern which is not supplemented by the relative parking spaces for the Private vehicles.
• Lack of access to public transport and list mile connectivity to it is an issue.
• There are no nodal points for the intermediate para transit parking and operations.
• Lack of parking for non motorized vehicles and security of vehicles.
Modal Split
INDICATOR VALUE
Total length of city roads in VMC area 1180 WBM 362 Paved tar roads 724 Unpaved roads 94 Road area per capita 1 m
Source: CDP Varanasi 2041
Old City
• The old town area includes very congested areas like Chauk, Kotwali, Adampura, etc., having very narrow streets and mixed land use.
• The width of these lanes varies from 1 to 2 meters and only pedestrian movement is possible however, people do ply two wheelers making it difficult for the pedestrians to walk.
• Commercial encroachments considerably reduce the available RoW on all the roads leading to the Ghats.
Central City
• The second zone comprises of the area beyond the old town area up to G T road in the north
• In this zone road widths are more as compared to the old town area, but the roads are still congested
• Roadside parking and street vendors add to traffic problems in the area reducing the road width available for movement.
Development as per URDPFI
Parking Facility
Central City:
• Lack of formal onstreet parking and offstreet parking vehicles park as per the available space on the road.
• Enforcement mechanism for parking is absent.
• Due to increase commercial activities, private vehicle movement and lack of recpective parking space results in spillover of parking onto the streets
• This area comprises of the Nadesar, Police lines, Tajpura etc that characteristically have reasonable road widths with few encroachments but no traffic signals
• The major problems areas in the zone are Pandeypur chowk, Andhra Bridge and Chauka Ghat.
Tourism led Impact on Transportation
1. Transportation is impacted as the inclination towards public transportation increases.
2. Increase in Non state registered vehicles
3. Increase in demand of parking spaces around destination can be observed due to increase in on-road parking.
4. Informal market tends to increase in the core areas of the city.
5. Increase in trends of commercial encroachments Reduces ROW
6. Increase in private vehicles contribute towards congestion in the core city
7. Increasing tends of accidents near destination can be observed
8. Lack of pedestrian access to the destination.
CITY-WISE ANALYSIS: 02 - Varanasi
2W 24% Cycle 8% 4W 16% Auto
43% Walk 3%
6% 2W Cycle 4W Auto
Rickshaw
NMT
Rickshaw Walk NMT
SOLID WASTE MANAGEMENT
The solid waste management system in Varanasi is now being managed by VMC. Till recently, the waste management was being managed by A2Z Infrastructure Private Limited. The concessionaire was responsible for door-to-door collection, transportation, treatment and disposal of solid waste from all wards.
Composition of Solid waste
Treatment
• Per capita solid waste generation in the city is 0.6 kg/cap/day

• Tourism plays a major role in contribution of plastic in the composition .
• The disposal and collection of the city of Varanasi is not capable to collect the waste to its full capacity
• About 120 TPD waste remains un-collected.
• A considerable proportion of organic carbon was found which causes the health problem to the workers
Disposal
• The disposal site is located 20 Km away from the city in Karsada on a 40 acre site. Currently

Tourism led Impact on SWM
1. tourists produce up to twice as much waste as local residents.
2. Tourism has the potential to build awareness around the issues and spur waste infrastructure improvements.
CITY-WISE ANALYSIS: 02 - Varanasi
2041 INDICATOR VALUE Total household served with D2D collection 0% Total waste generation 600 TPD Total waste collected 480 TPD Total number of dustbins 373 Total number of vehicles 1000 Frequency of collection (trips/day) 2 - 3
Food waste 32% Plastic 22% Textile 10% Paper 9% Glass 7% Cardboard 6% Ash 5% Leather 6% Other 3% Food waste Plastic Textile Paper Glass Cardboard Ash Leather
food
meat
• Waste composition depends on a wide range of factors such as
habits, cultural traditions, lifestyles, climate and income, etc. • The city has a large number of hotels and restaurants and more than 180,000 households. There are 20 vegetable, 5 fruits, 5
and 5 fish markets in the city leaving behind a large quantity of mixed waste rich in organic contents.
• The treatment plant of 500 TPD is under construction The treatment technology is RDF and windrow composting.
ANALYSIS ANALYSIS


• The riverine settlement of Lucknow shows a concentration of heritage tourism in the core city and along the river.
• This causes a inflow of tourists concentrated in the core which give rise to congestion and higher tourism led solid waste disposal.


• A gap in the infrastructure can be observed and need for transportation aids
• The riverine settlement of Prayagraj shows a concentration of Cultural and religious tourism in the core city and along the river.
• This causes a inflow of tourists in various destinations long the river and the core city which give rise to congestion and higher tourism led solid waste disposal.

• A gap in the infrastructure can be observed and need for transportation aids
ANALYSIS
• The riverine settlement of Varanasi shows a concentration of heritage, religious and cultural tourism along the river.
• This causes a inflow of tourists in various destinations long the river, being on the edge of the city the major accommodation lies in the core area which give rise to congestion and higher tourism led solid waste disposal.


• A gap in the infrastructure can be observed and need for transportation aids


Comparative
VARANASI 1.
2.
3.
4.
5.
6. %
7. NUMBER
63 8. DESTINAITON CONNECTION: NMT, PT, Pvt. T, PED 9. NUMBER
4040 1. AREA:
2.
3. TOURIST
4. TOURIST
5. NUMBER OF
2 6. % OF GAP
41.17% 7. NUMBER OF
14 8. DESTINAITON CONNECTION: NMT, Pvt. T, PED 9. NUMBER OF BEDS: 2443 1.
2.
3.
4. TOURIST
5.
6. % OF
7. NUMBER
8.
9.
LUCKNOW PRAYAGRAJ
AREA: 348 sq km
CENSUS POPULATION: 28.17 Lakh
TOURIST PER YEAR: 49.50 Lakh
TOURIST PER DAY: 13500 tourist/day
NUMBER OF HIGHWAY: 4
OF GAP IN SWM COLLECTION: 20.28%
OF DESTINATION:
OF BEDS:
132 sq km
CENSUS POPULATION: 11.17 Lakh
PER YEAR: 3.59 Cr
PER DAY: 73587 tourist/day
HIGHWAY:
IN SWM COLLECTION:
DESTINATION:
AREA: 130 sq km
CENSUS POPULATION: 11.98 Lakh
TOURIST PER YEAR: 60 Lakh
PER DAY: 16500 tourist/day
NUMBER OF HIGHWAY: 4
GAP IN SWM COLLECTION: 20%
OF DESTINATION: 39
DESTINAITON CONNECTION: NMT, Pvt. T, PED
NUMBER OF BEDS: 9298
R-squared is a measure of how well a linear regression model fits the data. It can be interpreted as the proportion of variance of the outcome Y explained by the linear regression model


Tolerance is a useful tool for diagnosing multicollinearity, which happens when variables are too closely related. A tolerance of below .40 is cause for concern.


Variance inflation factor (VIF) is a measure of the amount of multicollinearity in a set of multiple regression variables.


Computation Step 1: collection of Data in True Value Step 2: Interpretation =Sumproduct(Range,Range) K= Value x W. Score(10) M= x W. Score(100) Value Z Z Sum of Weights Sum of weights under each city’s infrastructure provides the ranking criteria Marking the ranks on the scatter plot LKVA AL AY 35.75 0 20 40 60 0 10 20 30 40 50 60 ANALYSIS Step 3: SPSS Data Assigning as per Weightage Step 4: Linear Regration with D/I Value and Analysis Type Step 5: Results
Step 6: Coefficient
7: FINAL FORMULA YFin=A + B + C
Step
PRAYAGRAJ

TRANSPORTATION
• Population (Floating)
• Generation of Tourist
R-squared is a measure of how well a linear regression model fits the data. It can be interpreted as the proportion of variance of the outcome Y explained by the linear regression model. It indicates a positive linear relationship between the 2 variables (when one increases, the other does)

Tolerance is a useful tool for diagnosing multicollinearity, which happens when variables are too closely related. A tolerance of below .40 is cause for concern. In this case a tolerance is found over 0.5.
Variance inflation factor (VIF) is a measure of the amount of multicollinearity in a set of multiple regression variables. A rule of thumb commonly used in practice is if a VIF is > 10, high multicollinearity exists. In this case, with values around 1, the regression is in good shape.

TRANSPORTATION
LUCKNOW
Transportation LUCKNOW W 10 VARANASI W10 PRAYAGRAJ W10 Generation of
4950000 3.22 6000000 3.91 4400000 2.87 Modal
- - - -
Pedestria n
63
Pop
Pop
33.63 39.10
VARANASI 0.00 10.00 20.00 30.00 40.00 1 2 3
Tourist
choice
NMT 143550 2.00 162000 2.25 413600 5.75 Private 2182950 3.78 1944000 3.37 1650000 2.86
143550 1.17 810000 6.58 277200 2.25 PT 2475000 3.25 3084000 4.05 2063600 2.71 2.55 4.06 3.39 Condition of Road 2578 4.34 2277 3.83 1086 1.83 No. of destination
5.43 39 3.36 14 1.21
(permanent) 2817105 5.49 1198000 2.33 1117000 2.18
(Floating) 13500 2.41 30000 5.36 12500 2.23
27.27
χ
1
• No. of Trip Generated
• No of Parking at destination
• Mode of transport • Condition of Road • No. of Destination per city
• Population (Census)
Ytrans=0.33(R_con) + 0.568(P_Float) + 0.34 Equation 1: Transport
is a measure of how well a linear regression model fits the data. It can be interpreted as the proportion of variance of the outcome Y explained by the linear regression model. It indicates a positive linear relationship between the 2 variables (when one increases, the other does)
Tolerance is a useful tool for diagnosing multicollinearity, which happens when variables are too closely related. A tolerance of below .40 is cause for concern. In this case a tolerance is found over 0.5.

Variance inflation factor (VIF) is a measure of the amount of multicollinearity in a set of multiple regression variables. A rule of thumb commonly used in practice is if a VIF is > 10, high multicollinearity exists. In this case, with values around 1, the regression is in good shape.

SOLID WASTE MANAGEMENT
LUCKNOW
0.00 0.50 1.00 1.50 2.00 2.50 3.00 3.50 1 2 3 Solid Waste Management LUCKNOW W 10 VARANASI W10 PRAYAGRAJ W10 Waste Generation (tourism) 74.25 2.41 165 5.36 68.75 2.23 Collection cycle 3 4.29 2 2.86 2 2.86 Tourist flow 4950000 3.22 6000000 3.91 4400000 2.87 Populaiton 2817105 5.49 1198000 2.33 1117000 2.18 Household Size 5.6 3.33 5.6 3.33 5.6 3.33 No of Accomodation 4040 2.56 9298 5.89 2443 1.55 Disposal and Treatment 900 5.29 400 2.35 400 2.35 waste generation per capita 5.5 3.33 5.5 3.33 5.5 3.33 29.93 29.37 20.70
χ2 • Collection cycle • Tourist flow • Population • Household size • No of Accommodation • Disposal and treatment • Waste generation
PRAYAGRAJ VARANASI
SOLID WASTE
R-squared
Y
=3.01(T_flow) -0.30(W_Disp)
5.702
SWM
-
Equation 2: SWM
R-squared is a measure of how well a linear regression model fits the data. It can be interpreted as the proportion of variance of the outcome Y explained by the linear regression model. It indicates a positive linear relationship between the 2 variables (when one increases, the other does)

Tolerance is a useful tool for diagnosing multicollinearity, which happens when variables are too closely related. A tolerance of below .40 is cause for concern. In this case a tolerance is found over 0.5.
Variance inflation factor (VIF) is a measure of the amount of multicollinearity in a set of multiple regression variables. A rule of thumb commonly used in practice is if a VIF is > 10, high multicollinearity exists. In this case, with values around 1, the regression is in good shape.

ACCOMODATION LUCKNOW
0.00 1.00 2.00 3.00 4.00 5.00 6.00 1 2 3 Accomodation LUCKNOW W VARANASI W10 PRAYAGRAJ W10 Number of Accommodation 4040 2.56 9298 5.89 2443 1.55 Duration of Stay 2 2.86 3 4.29 2 2.86 Category of Hotel 3 3.33 3 3.33 3 3.33 Distance of Accomodation from Destination 4 3.33 4 3.33 4 3.33 No of Destination 63 5.43 39 3.36 14 1.21 Floating Populaiton 13500 3.18 16500 3.88 12500 2.94 Hotel availability 19170 5.52 10544 3.03 5037 1.45 26.21 27.12 16.67 ACCOMODATION χ3 • Duration of stay • Category of Hotel • Parking facility • No. of Destination per city • Population floating • No. of Accommodation
PRAYAGRAJ VARANASI
Acco
–
Accommodation
Y
=2.675(D_Stay) +0.239 (N_des)
6.390 Equation 3:
PRAYAGRAJ
• Mode of transport • Condition of Road
• Population (Census)
• Population (Floating)
• Generation of Tourist
• Collection cycle
• Tourist flow
• Population
• Household size
• No of Accommodation
• Disposal and treatment
• Waste generation
• Duration of stay
• Category of Hotel
• Parking facility
• No. of Destination per city
• Population floating
1. Geography of the destination is to be constant to perform reliability test, in order to reduce errors in analysis. 2. Market conditions are assumed constant. 3. Analysis is to be made on same scale 4. Tourism Typology must be constant.
FINAL STRUCTURAL EQUATION FOR TOURISM POTENTIAL LUCKNOW
1 2
χ1 χ2 χ3
VARANASI 0.00 1.00 2.00 3.00 4.00 5.00 6.00
3 Accomodation TRANSPORTATION SOLID WASTE ACCOMODATION
• No. of Trip Generated • No of Parking at destination
• No. of Destination per city
INFRASTRUCTURE
0.00 0.50 1.00 1.50 2.00 2.50 3.00 3.50 1 2 3 Solid Waste Management 0.00 10.00 20.00 30.00 40.00 1 2 3 Transportation Ytrans + YSWM + YAcco =0.33 (R_con) + 0.568 (P_Float) + 0.34 + 3.01 (T_flow) -0.30 (W_Disp) -5.702 + 2.675 (D_Stay) + 0.239 (N_des) – 6.390 σ�� = 0.33 (R_con) + 3.578 (P_Float) - 0.30 (W_Disp) + 2.675 (D_Stay) + 0.239 (N_des) – 11.752 *P_Float = T_Flow
• Need of Accommodation DETERMINANTS OF
ASSUMPTIONS
APPLICATION σ�� = 0.33 (R_con) + 3.578 (P_Float) - 0.30 (W_Disp) + 2.675 (D_Stay) + 0.239 (N_des) – 11.752 *P_Float = T_Flow FOR LUCKNOW FOR VARANASI FOR PYAYAGRAJ Intercept 1 R_Con Intercept 2 P_Float Intercept 3 W_Disp Intercept 4 D_Stay Intercept 5 N_Des Constant + Error YLK = 0.33 4.34 0.3578 2.41 0.3 5.29 2.675 2.86 0.239 5.43 -11.752 = 24.58177 YVA = 0.33 3.83 0.3578 5.36 0.3 2.35 2.675 4.29 0.239 3.36 -11.752 = 27.9175 YAL = 0.33 1.83 0.3578 2.23 0.3 2.35 2.675 2.86 0.239 1.21 -11.752 = 21.79848 TPLKO = 24.58 TPVAR = 27.92 TPPYG = 21.80 TPSTD = 24.89
• It can be hereby inferred that, tourism potential of a region highly depends on the Infrastructural potential, hence to upgrade the Tourism potential of a region, the infrastructure should be improved. • By the above Equation, a structure and methodology has been formulated to calculate the tourism potentiality a region under certain assumptions, and hence with the values the equation ranks a city as followed: TP < 20 TP = 20 – 24.89 TP > 24.89 Critical need of Infrastructure to support Tourism Potential need of Infrastructure to support Tourism Upgradation of Infrastructure and Governance support Tourism • Based on the equation output, capacity building can be incorporated in the region and policy formulation can be framed.
INFERENCE
TP < 20 TP = 20 – 24.89 TP > 24.89
Critical need of Infrastructure to support Tourism
• Preparation of Tourism Master Plan
• Preparation or Modification in CMP
• Setup of Tourism Cell under Local Government
• Empowering Local Government with better structure of SWM
• PPP for Accommodation infrastructure
• Dedicated Transport system to ensure lower congestion and Higher LOS on local road.
• Training and employment of Tourism related Tertiary sector workers.
• Participatory approach by Diagnostics, Consultation, and Action plan
• Policy Guidance Document that mobilizes all Municipal policies and Tourism Ecosystem across a broad circuit.
Potential need of Infrastructure to support Tourism
• Preparation of Tourism Master Plan
• Preparation or Modification in CMP
• Setup of Tourism Cell under Local Government
• Empowering Local Government with better structure of SWM and Revenue Structure.
• PPP for Accommodation infrastructure and Control over Cost Structure.
• Dedicated Transport system to ensure lower congestion and Higher LOS on local road and Increase share of Public Transportation.
• Training and employment of Tourism related Tertiary sector workers.
• Participatory approach by Diagnostics, Consultation, and Action plan
• Policy Guidance Document that mobilizes all Municipal policies and Tourism Ecosystem across a broad circuit.
• Develop niche Markets and International Promotion
Upgradation of Infrastructure and Governance support Tourism
• Circuit Definition of Tourism Master Plan
• Circuit planning or Modification in CMP
• Improvisation of Tourism Cell under Local Government
• Empowering Local Government with better structure of SWM and Revenue Structure.
• PPP for Accommodation infrastructure and Control over Cost Structure.
• Dedicated Transport system to ensure lower congestion and Higher LOS on local road and Increase share of Public Transportation and Concentration Towards NMT.
• Action plan incorporated with Master Plan.
• Policy Guidance Document that mobilizes all Municipal policies and Tourism Ecosystem across a broad circuit Upgradation of the Peri Urban Area.
• Develop niche Markets and Strengthening assets
• Reinforce Emerging Sector and Digital Enterprises.
• International Promotion.
APPLICATION σ�� = 0.33 (R_con) + 3.578 (P_Float) - 0.30 (W_Disp) + 2.675 (D_Stay) + 0.239 (N_des) – 11.752 *P_Float = T_Flow
OF THESIS TOPIC σ�� = 0.33 (R_con) + 3.578 (P_Float) - 0.30 (W_Disp) + 2.675 (D_Stay) + 0.239 (N_des) – 11.752 *P_Float = T_Flow Based on the derived equation the tourism potential of cities with tourism value and laying under the Assumptions can be upgraded based on the 3 criteria mentioned as per value of Tourism potential. Upgradation of Infrastructure and Governance support Tourism TP < 20 TP = 20 – 24.89 TP > 24.89 Critical need of Infrastructure to support Tourism Potential need of Infrastructure to support Tourism LK VA AL AY 35.75 0 10 20 30 40 50 60 0 20 40 60 ANALYSIS As per the result of perception study THESIS TOPIC: Capacity Building for Urban Tourism Development of Ayodhya : An approach towards Infrastructural Upgradation HYPOTHESIS: Derivation of an equational model indicating tourism potential (y) of an area as the function of determinants of infrastructure (x) will help in policy formulation.
QUESTION: How does Capacity building help in strengthening and upgrading the Tourism Specific Infrastructure of an area or Region under tourism influx? AYODHYA (T.P) = 21.15 TRANSPORTATION – SWM - ACCOMODATION
DERIVATION
RESEARCH
Bibliography and References
• UN-WTO: United Nation World tourism Organization
• URDPFI – Tourism Guidelines (Ministry of Housing and UrbanAffairs).
• National Tourism Policy 2002, Ministry of Tourism and Culture.
• Tourism Policy Uttarakhand 2018, Uttarakhand Tourism Development Board.
• Tourism Policy Uttar Pradesh 2018, Department of Tourism, GoUP.
• India Tourism Statistics 2019, Ministry of Tourism, GOI.
• Tourism Statistics of India , (https://data.gov.in/).
• TOURISM - Statistical Year Book India 2018, (http://mospi.nic.in/statistical-year-book-india/2018/195).
• Ministry of Statistics and Programme Implementation (GOI).
• India Tourism Statistics 2000-2021 (https://www.macrotrends.net/)
• International Tourism (World Bank)
• Tourism Infrastructure Development (https://tourism.gov.in/)
• PRASHAD Scheme
• SWADESH DARSHAN: SCHEME GUIDELINES
• Guidelines for Tourism infrastructure development
• 88 Sources of Research paper as cited in the Literature Review
Thankyou