2021 INVESTMENT PORTFOLIO REVIEW MANAGER PRESENTATIONS & OTHER INFORMATION FOR FISCAL YEAR 2020-2021 PRESENTED BY OFFICE OF INVESTMENTS THE SALVATION ARMY SOUTHERN TERRITORY
OFFICE OF INVESTMENTS OVERVIEW
Established in 2008, the Office of Investments was created to handle the day-to-day management of the investable assets and to act as an internal resource regarding the portfolio for Territorial Headquarters and the field. The Office of Investments manages the corporate and planned giving assets, investment manager and other portfolio relationships, outright non-cash gifts throughout the Territory, and other duties. As of September 30, 2021, the assets under management by the Office of Investments totaled in excess of $2.78 billion


The mission statement of the Office of Investments is:

The Office of Investments provides oversight and investment responsibility for an institutional portfolio that is approximately $2.67 billion (excluding Planned Giving Assets). There are thirty-nine (39) manager relationships, representing seventy-one strategies (71). The responsibility for maintaining and overseeing the assets and these relationships is placed with the Office of Investments. All of these duties are accomplished with a staff of seven individuals as shown below:

OFFICE OF INVESTMENTS

“Investing prudently to grow the entrusted assets to support the Mission of The Salvation Army, Southern Territory”Lariza Vergara Investment Assistant / Project Manager Justin Goff, CFA Senior Investment Analyst Alex Lauchlan Investment Operations Manager Bob Li Investment Management Assistant Diane Kendrick Planned Gift Operations Manager Mike Sutton Director - Office of Investments
DUTIES OF THE OFFICE OF INVESTMENTS
The duties of the Office of Investments are illustrated with the chart below which shows the three key areas of responsibility:
PORTFOLIO ADMINISTRATION OFFICE OF INVESTMENTS
PLANNED GIVING ADMINISTRATION
ASSET PROCESSING AND OUTRIGHT GIFTS OF STOCK
PORTFOLIO ADMINISTRATION
The Office of Investments handles the complex operations involved in managing the portfolio’s asset allocation in line with the Investment Policy Statement, managing portfolio construction, monitoring tactical strategy, engaging in portfolio management and rebalancing, overall portfolio maintenance, which includes facilitating inflows and outflows, preparing portfolio reporting, assisting in the Territory’s external audit, and other functions. Additionally, the Office of Investments develops and maintains relationships with investment managers and investment consultants to help allocate and monitor the Territory’s assets. The Office of Investments serves as the primary point of contact for the portfolio’s investment managers, investment consultants, and custodian.
The Office of Investments also acts as the primary internal resource to evaluate macro-economic and financial market issues, and their relevance to, or impact on, the Territorial portfolio. The Office of Investments seeks out and analyzes information from news sources, investment managers, strategists, analysts, investment forums, consultants, contacts, and third-party providers to help provide due diligence and recommendations on investments and investment strategy.
In conjunction with the consultant, The Office of Investments is responsible for The Army’s due diligence of strategies and investment managers. The Board of Trustees has delegated authority to the Office of Investments for recommendations on managers, strategies, allocations, and operations to the Investment Advisory Board. It is also a responsibility of the Office of Investments to make spending policy recommendations to the Territorial Finance Council.
INVESTMENT PROCESS
Various internal and external parties are involved in the long-term, strategic management of the portfolio, while day-to-day management of this process is provided by the Territory’s Office of Investments. The Office of Investments acts to help coordinate the moving pieces and various parties involved in the investment process. Importantly, the Office of Investments also helps ensure continuity in the investment process when personnel or other changes occur with investment managers and other external service providers.


The portfolio’s assets are invested in a multitde of different strategies managed by professional investment management firms. These firms are approved by the Territorial Finance Council (under the direction of the Board of Trustees) as recommended by the Territorial Investment Advisory Board and monitored by the Office of Investments (Trustee), Pavilion Mercer (Consultant), and Northern Trust (Custodian).
Currently, the Territory utilizes the services of 39 professional investment managers across 71 different investment strategies as illustrated below:
T R A D I T I O N A L DOMESTIC EQUITY DOMESTICFI K1 INTERNATIONAL EQUITY GLOBAL GLOBALFI REAL A S S E T S HEDGEFUNDS REAL AS S E T S PRIVATE EQUITY A L T E R N A T I V E S INFLATION PROTECTION RISK REDUCTION GROWTH LIQUIDILLIQUID LIQUID
The Salvation Army Southern Territory exercises great care in the management, monitoring, and governance of the portfolio’s funds. The Board of Trustees, Territorial Finance Council, Investment
INVESTMENT PROCESS PORTFOLIO GOVERNANCE & OVERSIGHT
The Investment Policy Statement is designed to allow and guide the Office of Investments, with sufficient flexibility, in the management oversight process to capture investment opportunities as they may occur, while setting forth reasonable parameters to ensure discipline and care in the execution of the investment program. This statement will also assist The Army in its fiduciary obligation of managing the assets prudently, with attention to the portfolio as a whole and toward the overall long-term investment strategy.
DUE
The due diligence process is critical to ensure proper oversight of the assets under management (see below). Due diligence activities include, but are not limited to, manager meetings (on site or at THQ), conference calls, webinars, client conferences, and other methods. The overarching goal of the due diligence process is to ensure that The Army’s portfolio has the best available (“best in class”) investment managers and strategies to accomplish the investment objectives. In fiscal 2021, the Office of Investments participated in over 170 meetings with investment managers, the consultant, and other service providers as a part of the due diligence process (including meetings, conference calls, webinars, and conferences).
(Figure 2)
DILIGENCE
OFFICE OF INVESTMENTS
Directs day-to-day management of portfolio
Conducts manager visits and reviews
Ensures adherence to Army investment guidelines and philosophy
Engages in frequent dialogue, interaction and strategizing with consultant CONSULTANT • Performs in-depth research, reporting, and monitoring of managers and strategies • Monitors global economic and financial markets • Provides portfolio investment performance results, attribution analysis, and compliance reports • Engages in frequent dialogue, interaction, and strategizing with Office of Investments OFFICE OF INVESTMENTS CONSULTANT SUPPORTING ENTITIES SUPPORTING ENTITIES Investment Advisory Board • Portfolio oversight • Guidance Custodian • Safe keeping of assets • Asset servicing
Board, Office of Investments, Investment Consultant, Investment
and Custodian
play critical roles in the research, vetting, weighting, and execution of these individual investments and, therefore, the composition and performance of the overall portfolio.
•
•
•
•
Advisory
Managers,
all
The Office of Investments is also responsible for the oversight of the investment and administrative functions of the planned giving life income agreements across the Territory. Currently, the Office of Investments oversees or directly administers the activity of 1,355 life income agreements, makes payments to 836 income beneficiaries, and has a market value in excess of $102.1 million. The chart below provides a breakout of the various gifts under management:
The Gift Annuity program’s back-office administration is handled completely through the Office of Investments. The Gift Annuity investments are managed by Bank of New York Mellon Wealth Management. Gift Annuity software programs Crescendo Pro and Crescendo Admin are utilized in the administration of the program.
These software programs assist the Office of Investments with all aspects of gift administration. The Gift Annuity program is comprehensive and requires specific capabilities and skills to run efficiently. Tax reporting, payment calculation, database maintenance, and much more go into the efficient operation of this program.
The Gift Annuity investment pool, currently $67.1 million, is a commingled pool of all Gift Annuities. In some cases, it is segregated into various accounts representing the requirements of certain states. Generally, Gift Annuities are regulated by the states in which the Southern Territory operates. Bank of New York Mellon Wealth Management, along with the Office of Investments, monitors state requirements of the fifteen southeastern states and the District of Columbia to ensure that The Army’s Gift Annuity program is in continual compliance with these various governmental agencies.
Payments to beneficiaries are made on an ongoing basis. In fiscal 2021, over $4.8 million was dispersed through over 6,217 payments to beneficiaries.
GIVING ADMINISTRATION GIFT ANNUITIES GIFT ANNUITIES 836 $102.1 M1,355ToTal NuMber of agreeMeNTs NuMber of beNeficiaries FMV as of 9/30/2021 1,223 83 49 672 115 49 $67.1 M $32.1 M $ 2.9 M TRUSTS POOLED INCOME FUNDS LIFE INCOME AGREEMENTS
PLANNED
TRUSTS
Charitable Remainder Trusts are managed by both Bank of New York Mellon Wealth Management and the Office of Investments. Bank of New York Mellon Wealth Management is responsible for the investments and much of the administration. The Office of Investments ensures that all communications related to the beneficiaries are carried out in accordance with the direction of the beneficiary and the Planned Giving Department. Annual trust reporting packages are created for distribution to beneficiaries through the efforts of the Office of Investments and the Bank. In excess of 150 customized tax reporting packages are prepared each year for distribution to trust beneficiaries. These packages contain annual updates to the beneficiary on the performance of their trust, the asset make-up of the trust, payment information on the upcoming year, and the Grantor Tax Information Letter or K-1 (tax reporting from the prior year). Currently, the Office of Investments administers 85 charitable trusts covering 127 beneficiaries.
POOLED INCOME FUNDS
The Army’s four Pooled Income Funds (PIFs) are managed by BNY Mellon Wealth Management. These PIFs are The Salvation Army Pooled Income Fund, the William Booth Pooled Income Fund, the Evangeline Booth Pooled Income Fund, and the Catherine Booth Pooled Income Fund. These four PIFs combined represent 49 beneficiaries, with a market value in excess of $2.9 million.
ASSET PROCESSING & OUTRIGHT GIFTS OF STOCK
The Office of Investments is also tasked with the processing of outright gifts of securities, and asset transfers from around the Territory (generally non-cash gifts). In the processing of all outright gifts of securities, the Office of Investments is governed by, and adheres to Minute 31(c). All outright gifts of stock, fixed income instruments, mutual funds, etc. are directed to a brokerage account at BNY Mellon Capital Markets, where instructions are given for the liquidation. The Salvation Army does not attempt to time the markets, so all gifts below $250,000 in market value are liquidated immediately upon the market open of the following business day. Gifts in excess of $250,000 require sign off to ensure best pricing is obtained on these gifts. The Office of Investments oversees this operation and serves as the processing agent for the Territory for all of these types of gifts.
The Office of Investments processes gifts for Resource Development, Local Development (those units not part of Territorial Resource Development), and other channels. Additionally, the Office of Investments advises and assists the Territorial Legal Department with the transfer, re-titling, distribution, and liquidation of securities related to estates, trusts, and legacies. Furthermore, for those gifts that are not eligible for DTC (electronic) transfer into The Army’s account at BNY Mellon Capital Markets, the Office of Investments may initiate the opening of a brokerage account, the reconciliation and redemption of all assets, and the closure of the account.
During FY 2021 the Office of Investments processed a total of 1,067 gifts in the brokerage account, with a dollar value in excess of $17.8 million. The breakout for all gifts processed by the Office of Investments during fiscal 2021 is as follows:
Serving in a vital role of support to The Army’s Southern Territory, the Office of Investments has handled all of the functions listed in the preceding pages, and has guided the management of The Army’s portfolio since 2008. The Office of Investments has been tasked with producing investment results that have consistently met investment policy guidelines. The Office of Investments strives for efficiency, quality control, and smooth operations to ensure that the appropriate funding of the Mission of The Army is supported. The Office of Investments along with the Consultant and the exceptional manager line up will continue to strive to produce superior risk-adjusted returns in accordance with The Army’s guidelines, policies, and procedures.
GIFT
AS OF SEPTEMBER
CONCLUSION OUTRIGHT
PROCESSING
30, 2021 Resource Development Legal Broker Planned Giving Local Development TOTAL GIFT VALUE $8,866,009 $3,737,877 $3,111,774 $1,450,451 $662,741 AVERAGE GIFT $16,328 $8,693 $135,295 $80,581 $12,505 NUMBER OF GIFTS 543 430 23 18 53 1,067 % 51% 40% 2% 2% 5% 100% $17,828,852


Signed with permission
Signed with permission
Signed with permission
Signed with permission
Signed with permission
Signed with permission
Signed with permission
Signed with permission
Signed with permission

This page intentionally left blank
The Salvation Army Southern Territory
November 2021
This report has been prepared for the sole use by The Salvation Army Southern Territory. It is not for further distributionor communication to any other person or entity.


welcome to brighter

Relationship History
TheSalvationArmySouthernTerritoryhiredHammondAssociates,aninvestment consultingfirmbasedinSt.Louis,Missouri,toserveasitsadvisorinJune2008.In January2011,HammondAssociateswasacquiredbyMercerInvestmentConsulting, Inc.(Mercer).
Mercerhasprovidedinvestmentservicesformorethan45yearsandisoneofthe globalleadersinofferinginstitutionalinvestmentservices.MercerInvestment Consulting,Inc.wasincorporatedin1972toprovideinvestmentadvisoryservicesin theUS.InJanuary2016,MercerInvestmentConsulting,Inc.changedtheformofthe organizationfromacorporationtoalimitedliabilitycompanyand,therefore,the namewaschangedtoMercerInvestmentConsultingLLC(MIC).Recognizingthe needtoexpandandintegrateitsinvestmentservicesofferingsintheUS,in2005 MercerestablishedMercerInvestmentManagement,Inc.(MIM),aninvestment adviserspecializinginmulti-managerinvesting.AsofMarch29,2019,MICandMIM mergedintoonesingleentity,MercerInvestmentsLLC.
Mercerisaleadingglobalinvestmentconsultingfirm,whoseclienteleincludes corporateandpublicretirementbenefitplans,endowmentsandfoundations,as wellashealthcareandhighnetworthclients.Clientscontinuetoreceivepro-active advicefromMercer’sNot-ForProfitInvestmentConsultingteamalongwiththe depthandbreadthoftheworldwideMercerorganizationandresearchplatform.

Mercer’sInvestmentsbusinessisaglobaleffortwithover4,400clientsand60offices worldwideasofJune30,2021.IntheUnitedStates,Mercer’sInvestmentsbusiness has18officesandmorethan1,300institutionalclientswithmorethan$4.6trillionin assetsasofJune30,2021.Mercerprovidesafullrangeofinvestmentconsulting advicefortheArmy,includingassetallocation,investmentstrategy,manager researchandselection,performancereportingandriskmanagement.
TimWestrich,Principal,andMichaelAncell,Partner,leadtherelationshipandare ablyassistedbyBretWatson,Associate.KyleFreelsandDianaChurchillprovide additionalvaluableassistanceintheareasofinvestmentoperationsand performancereporting.TheteamoperatesfromMercer’sSt.Louisoffice.
1 PleaseseeImportantNoticesforimportantinformationaboutAssetsunderAdvisementandAssetsunder Management.
© 2020 Mercer LLC. Allrights reserved.
Consulting Team
TimothyWestrich,CFA(FirmTenure:14years/IndustryExperience:18years)
TimisaPrincipalandSeniorConsultantspecializinginadvisingendowmentandfoundation clients.PriortojoiningMercer,TimservedasaConsultantatHammondAssociates.Timhas alsoworkedasanAnalystintheInvestmentBankingdepartmentatA.G.Edwardsandasan AnalystinthePublicFinancedepartmentatEdwardJones.
TimholdsaBSBAinFinance/BankingandRealEstatefromtheUniversityofMissouri.Hehas earnedtheCharteredFinancialAnalyst(CFA)designationandisamemberoftheCFA InstituteandcurrentlyservesasTreasureroftheCFASocietyofSaintLouis.Timalsoholdsa Series3NationalCommodityFuturesLicense.
MichaelAncell,CFA(FirmTenure:17years/IndustryExperience:34years)
MichaelisaPartnerandSeniorConsultantwithMercerInvestments.Hehasadvised institutionalclientssince2004.
HispreviouscareerincludesservingasheadoffinancialinstitutionsequityresearchforBanc ofAmericaCapitalManagement,helpingmanageBankofAmerica's$300billionofassets undermanagement.PriortothathewasseniorfinancialservicesanalystforEdwardJones helpingconstructandmonitormodelequityportfolios.Michaelbeganhisprofessional careerasafinancialinstitutionexaminerwiththeFDIC.
HeholdsanMBAinFinancefromtheKelleySchoolofBusinessatIndianaUniversityin Bloomington.HegraduatedmagnacumlaudefromtheUniversityofMissouriColumbia withaBAdegreeinFinanceandhasreceivedhisCharteredFinancialAnalyst(CFA) designation.MichaelservedasPresidentoftheCFASocietyofSaintLouisandservesonthe BoardofTri-CountyTrustCompany.
BretWatson,CFA (FirmTenure:2years/IndustryExperience:8years)
BretisaseniorassociateatMercer,wherehemanagesandprovidesguidanceon institutionalinvestmentportfoliosandplandesign.Previously,Bretworkedasaportfolio analystforNeubergerBerman.
BretgraduatedfromtheUniversityofWisconsinwithaBBAinFinance&Investment BankingandisalsoaCFAcharterholder.HeiscurrentlyenrolledattheUniversityofChicago BoothSchoolofBusinesswhereheispursuingaMastersofBusinessAdministration.
© 2020 Mercer LLC. Allrights reserved.
Pavilion, a Mercer Practice At A Glance
Qualified,experienced,globalstaff Firm
1,300+ clients in the US1
48+ years advising institutional investors2
200+ research professionals in ten countries1
Consultants average 10+ years of investment experience2
NationalNon-ProfitCenterof Excellence
25+ years of experience
180+ retainer endowment & foundation clients2
1.Data as ofJune30, 2021. 2.Data as ofDecember31, 2020
Specialistexpertise
EndowmentandFoundation Consultingfocusing on issues such as asset allocation, spending methodology, manager selection, and alternative investments
HealthcareConsultingfocusing on issues such as integrated financial strategy with investment strategy
PrivateWealthConsultingfocusing on issues such as investment policy, asset allocation, tax implications, and complex reporting and analysis
DefinedBenefitPlans focusing on issues such as regulatory changes, risk management, plan design, funding, and investment strategy
DefinedContributionPlans focusing on issues such as benefit adequacy, member engagement, fee transparency and post-retirement spend down including significant experience with 403(b) plans
Outsourcing for clients who prefer to delegate some or all of their decisions to a third party combining customized strategic allocation advice with a robust specialist investment manager structure
© 2020 Mercer LLC. Allrights reserved.
Our Services
• Investment Policy Review and Development
• Investment Manager Due Diligence and Recommendations for Traditional and Alternative Asset Classes
• Asset Allocation Studies
• Spending Review
• Asset/Liability Studies
• Fee Analysis
• Performance Analytics
• Monthly/Quarterly Client Performance Reporting
• Comprehensive Reports
• Online Access to Performance Data
• Periodic Investment Review Meetings
•Capital Markets Research •Quarterly Research Report •Market Updates and Commentary •Alternatives Research •Peer Universe Rankings
•Research Articles / White Papers
© 2020 Mercer LLC. Allrights reserved.
Institutional Investment Consulting Proprietary Reporting Proprietary Institutional Research
Functional View of the World’s Asset Classes
GrowthAssets
Drives long-term capital appreciation
Seeks to mitigate high return volatility through diversification and tilts to areas with attractive relative valuations
Includes public and private equity, as well as growth fixed income.
RiskReductionAssets

Lower volatility asset classes
Minimize correlation to equity returns
Includes both US and global fixed income and hedge funds
InflationProtectionAssets
Attractive for institutions with inflation-sensitive liabilities
Protects against unanticipated inflation
Includes real estate and natural resources investments
© 2020 Mercer LLC. All
rights reserved.
Research and Thought Leadership
ResearchReportsProvidedtoClients
• Quarterly Market Environment Report –broad overview across markets and asset classes
• Capital Markets Outlook –updated quarterly
• Dynamic Asset Allocation Report –Short-term valuation-based signals
•Specialized white papers
• The Endowment Model
• Not for Profit Endowments and Foundations Top Considerations for 2021
• Prioritizing action in a market crisis -a framework for Endowments & Foundations
• Investment Beliefs –Governance Bedrock for E+F Investment Committees
• Effectively Aligning Definitions of Success with Proper Benchmark Selection
• A Trilogy on Return and Risk for Endowments and Foundations
• Viewing Spending Policies Through A Different Lens
• Beatingthe Pack -What Role ShouldPeer Relative Rankings PlayIn Endowment Planning?
• Mercer Capital Market Monitor –October 2021
• Mercer Market Environment Webcast: www.mercer.com/webcasts
ClientConferences
•Annual Non-Profit Client Conference
• St. Louis, typically held in the fall
•Global Investment Forums
• 2022 schedule and locations to be determined
© 2020 Mercer LLC. Allrights reserved.
Global Manager Research
Manager and StrategyStatistics as of30 June2021,includes sub-advisedstrategies.
InvestmentProfessionalsexcludeFinancial Servicesand are FTE (not countof employees).ResearchSpecialists exclude10 central support/adminstaff.
https://www.mercer.com/our-thinking/mercer-esg-ratings.html
https://www.mercer.com/content/dam/mercer/attachments/private/nurture-cycle/gl-2018-wealth-guide-to-mercersinvestment-strategy-research-ratings-mercer.pdf
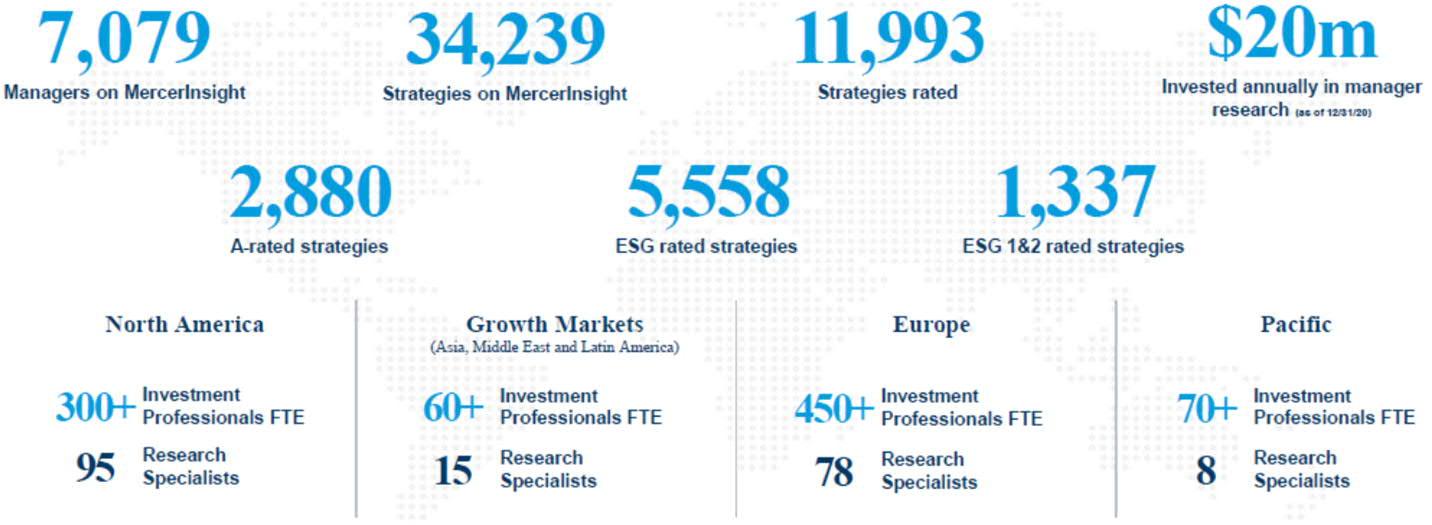
Mercer’s Manager Research team is located around the globe, allowing us to provide The Salvation Army with access to potential solutions in all major markets.
Our local presence allows us to provide frequent and in-depth updates on asset managers and new innovative ideas around the globe.
However, all members of our ManagerResearch team use the same rigorous process to assess asset managers’ capabilities to ensure that we identify the appropriate managers regardless of their geographic location.
© 2020 Mercer LLC. Allrights reserved.
Investment Manager Research Rigorous Framework and Ratings Process
Ideageneration
We appraise the manager’s ability to generate or source value-adding investment ideas
Portfolioconstruction
The quality of a manager’s portfolio construction process will determine how effectively its value-adding investment ideas are converted into consistent outperformance
Implementation
Value added at the idea generation and portfolio construction stages must outweigh the drag on performance due to transaction costs and overcome limitations relating to capacity constraints
Businessmanagement
Well-managed investment firms are more likely to maintain and enhance the competitiveness of their investment strategies over time
Aboveaverageprobability of outperformance
Averageprobability
Belowaverage probability
Not rated
Provisionalrating:Where there is uncertainty about a rating that we expect to resolve quickly
Watch: Where there is some uncertainty about a rating that we do not expect to be resolved soon but consider it unlikely that it will lead to a rating change
TrackingError:Potential for high tracking error or high volatility
Some research performed but not completed for a variety of reasons
Ratings are Mercer’sview onprospectivefuture performancerelative to benchmarks,on a risk-adjusted basis,over a full business cycle.Theymay or may notbe in keepingwith pastperformance.
© 2020 Mercer LLC. Allrights reserved.
B
C
N
P
A
W
R
T
1 2 3 4


The Salvation Army and Northern Trust


northerntrust.com | © 2021 Northern Trust
COMMITTED TO SERVICE, EXPERTISE AND INTEGRITY
Core principles that guide everything we do for clients, partners and the communities we serve.
Exceptional service for our clients, partners and communities
Client-focused
Service Expertise
Integrity
Act with the highest ethics, utmost honesty and unfailing reliability
Expanding our knowledge and capabilities to your advantage
northerntrust.com | © 2021 Northern Trust
northerntrust.com | © 2021 Northern Trust RELATIONSHIP SUMMARY The Salvation Army transitioned to Northern Trust as custodian, effective April 2019. The relationship is coordinated by Bob Johnson(Senior Vice President & Client Executive) and Melissa Becker(Client Service Manager). Bill Kincaid coordinates Transition Management. Northern Trust is providing the following services to The Salvation Army’s investment portfolio: • Alternative Asset Servicing * Safekeeping • Trade Settlement *Tax reclamation • Proxy voting *Capital Call Execution • Valuation Reporting *Transition Management • Level Determination Reporting Custody Profile 77 Accounts(totaling $2.67 billion) 3Actively Managed Domestic Accounts 3Actively Managed Global Accounts 5Client Directed Accounts 1Cash Account 65 Partnership, Commingled & Mutual Fund Accounts
•
•
•
•
•
•
•
•
•
•
•
northerntrust.com | © 2021 Northern Trust CLIENT-CENTRIC, FOCUSED BUSINESS MODEL Asset servicing, asset management and banking for personal and institutional clients, supported by our integrated operating platform. Corporate & Institutional Services
Insurance companies
Pensions
Sovereign entities
Fund managers
Foundations and endowments Wealth Management
Individuals
Families
Family offices
Foundation
Endowments
Privately held businesses Figures as of September 30, 2021 unless otherwise indicated (*Amounts shown are in U.S. Dollars) Source: Northern Trust $12.2 trillion assets under custody $15.8 trillion assets under custody/ admn $1.5 trillion assets under management Corporate & Institutional Services Wealth Managemen t
OUTSTANDING FINANCIAL STRENGTH AND STABILITY
Well-positioned for continued investment in our business, across all market cycles
STRONG CAPITAL POSITION
Northern
Advanced Approach
Common Equity Tier 1 13.0% 4.5%
Tier 1 14.1% 6.0%
Total 15.4% 8.0%
Tier 1 Leverage 7.1% 4.0%
Supplementary Leverage 8.4% 3.0%
Standardized Approach
Common Equity Tier 1 11.9% 4.5%
Tier 1 12.9% 6.0%
Total 14.3% 8.0%
SUPERIOR CREDIT RATING
Tier 1 Leverage 7.1% 4.0% Standard
Northern Trust Corporation
Short Term/Commercial Paper
The Northern Trust Company
Short
HIGH QUALITY BALANCE SHEET
Securities 36% Money market assets 33%
Loans and leases 23% Other 8%
Balance sheet is highly liquid and low risk
Standard & Poor’s assigned the highest credit ratings of any comparable U.S. based bank to our Corporation and main bank subsidiary, The Northern Trust Company.
| © 2021 Northern Trust
northerntrust.com
1 All figures as of September 30, 2021. Capital ratios are preliminary until regulatory reports have been filed. * Rating removed as of September 16, 2016, as Northern Trust does not have an active Commercial Paper Program.
Corporation Capital Ratios1 3Q21 Minimum Capital Ratios
Trust
& Poor’s Moody’s Fitch Ratings DBRS
A
1 No Rating* F1+ R 1 (middle)
Long Term/Senior Debt A+ A2 A+ AA (low)
Term/Deposits A 1+ P 1 F1+ R 1 (high)
Long Term/Deposits AA Aa2 AA AA

northerntrust.com | © 2021 Northern Trust New York Toronto Chicago Dublin London Guernsey Amsterdam Luxembourg Tokyo Beijing Hong Kong Bangalore Singapore Melbourne Abu Dhabi Limerick Stockholm Riyadh Kuala Lumpur Seoul Manila Tempe Clients in 53 countries 26,000+ Staff Worldwide* Services in 101 markets A Network of Offices in 19 States and Washington D.C. Sydney Pune GLOBAL COVERAGE, LOCAL EXPERTISE Basel As of September 30, 2021 (updated quarterly) Source: Northern Trust *Total employees 21,167 of which are permanent Oslo
EXPERTISE
of top-tier public and private
northerntrust.com | © 2021 Northern Trust
Our
Northern
trusted
organizations Notes: Figures updated annually in Q1/Q2 based on mostly recently published lists (various as of dates). Statistics indicate the percentage of clients (not assets) we service in each sector; US asset owner statistics include asset servicing, asset management, credit and banking. Sources include Pensions & Investments (US retirement plans, worldwide asset managers and hedge fund managers), Money Market Directors (endowments, foundations and nonprofit healthcare), Professional Pensions (UK retirement plans and the SWF Institute. 50 U.S. Healthcare 50 U.S. Foundations 50 U.S. Endowments 76% 32% 68% Of the top… Northern Trust serves: Foundations, Endowments and Healthcare 100 U.S. Public Plans 25 Taft Hartley Plans 30% 40% Of the top… Northern Trust serves: Public Funds/Taft Hartley 100 U.S. Corporate Plans 200 U.S. Retirement Plans Of the top… Northern Trust serves: Corporate/Pensions 62% 47%
IN KEY CLIENT SEGMENTS Through a focused, targeted business strategy we have built a significant presence and expertise in our chosen segments.
expertise is shared across our client base and across borders.
Trust is proud to have established
and rewarding relationships with a significant number
AWARDS FOR INNOVATION AND CORPORATE CITIZENSHIP
We consistently rank among the premier providers of trust, custody and private banking services.
Awards/Rankings Date Publication/Source
• Custodian of the Year 2021 Global Investor Investment Excellence Awards
• Best Administrator Technology 2021 HFM US Services Awards
• Best Mental Health in the Workplace Strategy: Multinational Implementation 2021 This Can Happen Awards
• Best Custody Specialist Institutional 2021
• Best Asset Servicing Mandate, Alternatives (Modular) 2021
• Best Middle Office Outsourcing, Fund Managers (FSI) 2021
The Asset Triple A Sustainable Investing Awards for Institutional Investor, ETF, and Asset Servicing Provider 12th consecutive year
The Asset Triple A Sustainable Investing Awards for Institutional Investor, ETF, and Asset Servicing Provider
The Asset Triple A Sustainable Investing Awards for Institutional Investor, ETF, and Asset Servicing Provider
• Best Custodian 2021 Private Equity Wire European Awards
• Best Cash Management / Treasury Services 2021 HFM US Quant Awards
• Best Mutual Fund Administrator 2021 Fund Intelligence Operations and Services Awards
• Gender Equality Index Member 2021 Bloomberg Fourth consecutive year
• Top ranking of 100% on the Human Rights Campaign Foundations, “Best Place to Work for LGBTQ Equality” 2021 Corporate Equality Index 14th consecutive year
| © 2021 Northern Trust
northerntrust.com
WHY NORTHERN TRUST?

We’re unique…
In our product leadership and innovation
We are a diversified, world class asset servicer offering comprehensive product capabilities.
In our strong culture and heritage
Our 130 year heritage is undiluted by mergers and strengthened by strategic acquisitions.
In our financial strength and stability
Market opinion assigns us a P/E premium up to twice that of our peers, especially reassuring during difficult economic times.
In our service model
We approach every client as a fiduciary aligned with their best interests, free of conflict.
In our client standards
Our client centric approach is committed to providing service, expertise and integrity.
In our business focus
We are highly focused, client centric and lead in the industry markets we serve.
northerntrust.com | © 2021 Northern Trust
IMPORTANT INFORMATION
Confidentiality Notice: This communication is confidential, may be privileged, and is meant only for the intended recipient. If you are not the intended recipient, please notify the sender as soon as possible. All materials contained in this presentation, including the description of Northern Trust, its systems, processes and pricing methodology, are proprietary information of Northern Trust. In consideration of acceptance of these materials, the recipient agrees that it will keep all such materials strictly confidential and that it will not, without the prior written consent of Northern Trust, distribute such materials or any part thereof to any person outside the recipient’s organization or to any individual within the recipient’s organization who is not directly involved in reviewing this presentation, unless required to do so by applicable law. If the recipient is a consultant acting on behalf of a third party client, the recipient may share such materials with its client if it includes a copy of these restrictions with such materials. In such event, the client agrees to comply with these restrictions in consideration of its accepting such materials.
© 2021 Northern Trust Corporation. Head Office: 50 South La Salle Street, Chicago, Illinois 60603 U.S.A. Incorporated with limited liability as an Illinois corporation under number 0014019. Products and services provided by subsidiaries of Northern Trust Corporation may vary in different markets and are offered in accordance with local regulation. This material is directed to professional clients only and is not intended for retail clients. For Asia-Pacific markets, it is directed to expert, institutional, professional and wholesale clients or investors only and should not be relied upon by retail clients or investors. For legal and regulatory information about our offices and legal entities, visit northerntrust.com/disclosures. The following information is provided to comply with local disclosure requirements: The Northern Trust Company, London Branch, Northern Trust Global Investments Limited, Northern Trust Securities LLP and Northern Trust Investor Services Limited, 50 Bank Street, London E14 5NT. Northern Trust Global Services SE, 10 rue du Château d’Eau, L 3364 Leudelange, Grand Duché de Luxembourg, incorporated with limited liability in Luxembourg at the RCS under number B232281; Northern Trust Global Services SE UK Branch, 50 Bank Street, London E14 5NT; Northern Trust Global Services SE Sweden Bankfilial, Ingmar Bergmans gata 4, 1st Floor, 114 34 Stockholm, Sweden; Northern Trust Global Services SE Netherlands Branch, Viñoly 7th floor, Claude Debussylaan 18 A, 1082 MD Amsterdam; Northern Trust Global Services SE Abu Dhabi Branch, registration Number 000000519 licenced by ADGM under FSRA # 160018; Northern Trust Global Services SE Norway Branch, 3rd Floor, Haakon VII's Gate 6, 0161 Oslo, Norway; Northern Trust Global Services SE, Leudelange, Luxembourg, Zweigniederlassung Basel is a branch of Northern Trust Global Services SE (itself authorised by the ECB and subject to the prudential supervision of the ECB and the CSSF). The Branch has its registered office at Aeschenplatz 6, 4052, Basel, Switzerland, and is authorised and regulated by the Swiss Financial Market Supervisory Authority FINMA. The Northern Trust Company Saudi Arabia, PO Box 7508, Level 20, Kingdom Tower, Al Urubah Road, Olaya District, Riyadh, Kingdom of Saudi Arabia 11214 9597, a Saudi Joint Stock Company Capital 52 million SAR. Regulated and Authorised by the Capital Market Authority License # 12163 26 CR 1010366439. Northern Trust (Guernsey) Limited (2651)/Northern Trust Fiduciary Services (Guernsey) Limited (29806)/Northern Trust International Fund Administration Services (Guernsey) Limited (15532) Registered Office: Trafalgar Court, Les Banques, St Peter Port, Guernsey GY1 3DA. Northern Trust International Fund Administration Services (Ireland) Limited (160579) / Northern Trust Fiduciary Services (Ireland) Limited (161386), Registered Office: Georges Court, 54 62 Townsend Street, Dublin 2, D02 R156, Ireland.
northerntrust.com
| © 2021 Northern Trust
Polsinelli Legal Services The Salvation Army

October 2021

POLSINELLI OVERVIEW FOR THE SALVATION ARMY
Firm Name
Polsinelli PC 100 S. Fourth Street, Suite 1000 St. Louis, MO 63102 314.889.8000
Firm Overview
Polsinelli is a large, national, first generation law firm with the entrepreneurial DNA of its earliest days. Built over 40 years ago on a strong foundation, we now are an Am Law 100 firm with 900 attorneys in 21 offices. Like minded legal talent from across the country who hold in high regard the same principles of superior client service, diversity of thought and collaboration has made us who we are today. The firm’s attorneys provide value through practical legal counsel infused with business insight, and focus on health care, financial services, real estate, intellectual property, middle market corporate, labor and employment and business litigation.


Principal Offices
We strive to align our services to our clients' business goals. Doing so has allowed us to attract experienced attorneys across the country seeking a platform best suited to their clients' priorities.
POLSINELLI OVERVIEW FOR THE SALVATION ARMY
With our firm’s concentration of presence in lower overhead markets, we are able to offer more comprehensive services than local or regional firms and more competitive overall cost than national firms concentrated in higher cost markets.
Firm Practice Areas and Specialties
We are a full service law firm with broad expertise in virtually every legal discipline. Below are areas of our experience we believe most applicable to The Salvation Army.
Limited Partner Representation
We represent large institutional investors, such as charitable organizations and endowments, family offices and funds of funds and high net worth individuals, in their investments in a variety of asset classes. We have extensive experience negotiating governing documents and side letters, mitigating complex tax issues such as UBTI, ECI, and other U S and foreign tax issues and working through regulatory, governance and ESG issues. We work with investors investing in private equity funds, hedge funds, real estate, separately managed accounts, operating companies and commodity pools. More specifically, we routinely handle the following types of matters for our investor clients:
▪
▪
▪
Negotiate side letters with fund managers, and when appropriate, negotiate changes to the limited partnership agreements and other organizational documents of the funds.
Assist in the final close “most favored nations” side letter election process by reviewing each of the offered provisions in light of the client’s specific circumstances.
For our tax exempt clients, evaluate the tax driven structures being employed by funds (e.g., corporate blockers).
▪
▪
▪
▪
Negotiate investor letters and render legal opinions (in the event we have been unable to remove that requirement in a side letter) with respect to credit facilities entered into by funds.
Analyze and provide advice concerning appropriate registration and exemption issues with respect to the investment structure and operations of clients under the Investment Advisers Act of 1940, the Investment Company Act of 1940 and the Commodity Exchange Act.
Assist on co investments and other direct investments made as part of an alternative investment mandate.
Negotiate investment management agreements with advisers (usually with respect to separately managed accounts and mandates) and consultants (usually with respect to general oversight of investment policies and adviser/manager selection).
Nonprofit Organizations
Polsinelli is one of the nation’s leading providers of legal services to nonprofit organizations. We’ve built our team with nationally recognized nonprofit attorneys that hold business acumen and in depth industry knowledge on state and federal tax and nonprofit issues. Our attorneys are well versed on the challenges facing tax exempt organizations, which has
POLSINELLI OVERVIEW FOR THE SALVATION ARMY
enabled us to make significant contributions to nonprofit entities through our use of innovative approaches to meeting their legal and organizational needs.
Corporate and Transactional
Polsinelli’s Corporate and Transactional practice provides a range of legal services from selecting the appropriate choice of entity through exit strategies and everything in between during the life cycle of a business. Working in collaboration with attorneys from the firm's Tax and other related practices allows us to provide our clients with comprehensive legal advice designed to minimize liability, maintain flexibility and advance our client’s objectives.
Securities & Corporate Finance
Polsinelli’s Securities & Corporate Finance attorneys combine significant transactional capabilities and regulatory knowledge with experience across a range of industries to help publicly traded and privately held companies plan and execute capital raising transactions, address complex disclosure and regulatory issues and establish appropriate governance policies and practices.
Our significant experience providing counsel in a full range of financial transactions to a variety of capital markets participants, including public and private issuers, underwriters and placement agents, allows us to deliver practical solutions to our clients quickly and efficiently
Our team focuses its counsel on the following areas and services:
Debt and equity capital markets
SEC disclosure, corporate governance and listed company compliance
REITS and real estate capital markets
M&A, going private and other strategic transactions
Polsinelli Contacts
Ruben K. Chuquimia, Shareholder Ruben’s practice includes a broad range of corporate, securities, and transactional work. He has represented a wide variety of corporate clients, including large publicly traded corporations, privately held entities, private equity funds, start up companies and entrepreneurs. Ruben has been recognized for his experience in corporate and M&A work by Chambers USA every year since 2011 and by The Best Lawyers in America every year since 2012.
Relationship with Polsinelli
Polsinelli’s engagement by The Salvation Army commenced in April of 2012. The principal focus of the engagement is to review potential alternative investments and to negotiate investment terms with fund managers.
Value Added Services
Ensuring clients receive exceptional value as part of their experience with Polsinelli is central to how
▪
▪
▪
▪
POLSINELLI OVERVIEW FOR THE SALVATION ARMY
we approach relationship building. We understand and respect that our clients’ desire for a robust partnership is evolving and driven by growing internal expectations and constraints. Below is a selection of services we offer.
Thought Leadership and Education
Firm hosted events for CLE credit
E Alerts, newsletters and other updates on new regulations and trends
Technology
Cloud based file sharing through data rooms or client extranets
client portals to support cost tracking, matter or case progression, attorney time tracking, project tools and forms and historical data
▪
▪
▪
▪
Podcasts
Webinars
▪
▪
Interactive
▪
▪
▪
Access to Firm Resources
Availability of firm offices for clients’ internal meetings
Complimentary seminars at the firm’s offices
Full and part time secondments at preferred rates, both on and off site
polsinelli.com | Polsinelli is very proud of the results we obtain for our clients, but you should know that past results do not guarantee future results; that every case is different and must be judged on its own merits; and that the choice of a lawyer is an important decision and should not be based solely upon advertisements. Polsinelli PC. Polsinelli LLP in California. Polsinelli PC (Inc.) in Florida.

46 Southfield Avenue, Suite 450, Stamford, CT 06902 battea.com | +1 203 987 4949 | info@battea.com

October2021
BatteaClassActionServices,LLCisagloballeaderandexpertinallstagesofassertingand processingsettlementclaimsinconnectionwithantitrustandsecuritieslitigation. Battea has beenaleaderinthespace since 2001,servingmorethan900institutionsaroundtheworld, includingmanyoftheworld’slargestbanks,hedgefunds,assetmanagersandbuy-side investors.Withdeeprootsintheclaimsfilingandfinancialtechnologysectorsanditsglobal presence,Batteaisoptimallypositionedtohelpclientsnavigatetheincreasinglycomplex processofobtainingtrustworthyinformationaboutlitigationthatimpactstheirinvestments andbusinesses.ThecombinedexperienceoftheBatteateamisunrivaledamongindustry peersandbroughttobearforourclients,guidingthemthroughtheentirecycleofthe litigationandsettlementprocess.Battea’sexpertiseissimplyunmatched.
ThelandscapeforU.S.classactions,internationalsecuritieslitigationandsecuritiescentricanti trustlitigationhasevolvedrapidlyaroundtheglobe.ThatiswhyBatteahasaugmentedits professionalstaffthroughkeyhiresthatcreateauniqueblendoftradingtransactionanddata securitytechnologists,formerclaimsadministrators,financialindustryexperts,securities litigationanalystsandeconometricexperts,andaprofessionalbusinessdevelopmentteam includingfull servicemarketingandcommunicationsservices.
• Average of 25 years of experience
• Foremost experts in financial trading technologies
• Executives include former CEO, CIOs, CTOs, CFOs
• Management holds MBAs, CPAs, and CFAs
• Series 3, 6, 7, 24, 27, 34, 55, & 63 Certified
Main Contacts:
Trent Calabretta
VP, Sales 203 987 4949 trent@battea.com
Chris Marcon VP, Account Management 203 987 4949 cmarcon@battea.com
46 Southfield Avenue, Suite 450, Stamford, CT 06902 battea.com | +1 203 987 4949 | info@battea.com
Service Commencement Date:
March 15, 2019
Services Provided:
Securities and antitrust litigation settlement research, global fund damage analysis, and securities class and collective action claims filings.
46 Southfield Avenue, Suite 450, Stamford, CT 06902 battea.com | +1 203 987 4949 | info@battea.com
This page intentionally left blank
American Century Investments

November
2021
Non-U.S. Growth FOR INSTITUTIONAL USE ONLY/NOT FOR PUBLIC USE American Century Investments
Bringing You Up-to-Date on American Century Investments
Firm
▪
▪
Assets under management were US$236.1 billion as of 9/30/2021.
Year to date as of 9/30/2021, more than US$6.6 billion in institutional assets were gained through new or additional fundings across multiple vehicles and strategies.
Ownership Structure
100%
80%
60%
16%20%
40% 10%
▪
Our Diversity, Equity and Inclusion (DEI) efforts fall under three pillars: Employee Engagement, Talent Development and Community Partnerships. Six Business Resource Groups Accelerate, Charlie Mike, Emerging Professionals, Enable, Mosaic and Pride have been formed to offer prioritization and support for DEI initiatives.
40%
20%
44%
70%
▪
The firm recently established a “Green Team” to further formalize its commitment to promoting sustainable business practices. The Green Team collaborates across the company in organizing and facilitating action around sustainable environmental opportunities that affect our employees, clients, and community.
▪
American Century Investments® won the 2021 Refinitiv Lipper’s Best Overall Large Firm and Best Equity Large Group Awards.
Investments
▪
As of September 30, 2021, more than 80% of firm assets under management are subject to the application of ESG considerations into the investment process employed by each strategy’s portfolio managers. The degree to which ESG considerations impact a portfolio’s holdings vary by portfolio.
0%
Equity Voting
Employeesand othershareholders
Nomura Holdings, Inc. StowersInstitute and family
Data as of 9/30/2021
Foundation for Success
■ Founded in 1958
▪
Enhanced our Target Date offering through the introduction of One Choice Blend+, a new series of active target date portfolios that blend fundamental active strategies with systematic low cost strategies.
▪
Expanded our fixed income capabilities with the launch of two new strategies: a blended Emerging Markets Bond offering and a Multi Sector Fixed Income strategy. Additionally, in September, the firm hired the portfolio management team responsible for Aberdeen Standard Investments’ Total Return Bond strategy. The team utilizes the same methodology they employed at Aberdeen and brings additional expertise to the fixed income platform.
▪
Launched four Avantis strategies (ETFs only) in September: U.S. Large Cap Value, International Large Cap Value, Emerging Markets Value (all cap) and the REIT ETF which invests globally
Thought Leadership
▪
Investment Opportunities in a Post COVID World ▪
2020 Emerging Markets Sustainable Impact Report ▪
ESG Outlook: 6 Key Trends We’re Tracking 2021 ▪ Navigating the Low Volatility Anomaly ▪
Our 2021 Capital Market Assumptions ▪
Integrating ESG Criteria in Multi Asset Portfolios ▪ Revisiting Earnings Acceleration ▪
Emerging Markets Review & Outlook: Sequenced Rather Than Synchronized ▪ U.S. Sustainable Large Cap Core: Sustainability Report ▪ Breakthrough Medical Treatments Brighten Outlook for Alzheimer's Patients ▪ Small Cap Biopharmaceuticals: The Epicenter of Medical Innovation
Firm data as of 9/30/2021
■ $236 billion in assets $111 billion in Institutional assets ■ ■ 197 investment professionals ■ More than 200 institutional clients ■ Globally located
Expertise spans five distinct investment disciplines
Kansas City (Headquarters) New York Mountain View (CA) Los Angeles London Hong Kong Sydney Frankfurt
Data as of 9/30/2021. Assets in USD.
American Century Investments FOR INSTITUTIONAL USE ONLY/NOT FOR PUBLIC USE
Investing With a Well-Defined Bottom-Up Growth Philosophy
We believe that accelerating, sustainable growth in revenues and earnings, driven by an inflection in business fundamentals, results in stock price outperformance.
We focus on inflection points in companies’ fundamentals because we believe markets are inefficient at identifying these changes.
Our process is designed to uncover stocks that outperform as earnings growth accelerates, market expectations rise and multiples expand.
We believe the direction of earnings growth is a more powerful predictor of stock price performance than the absolute level of growth.
15%7%10% 22%
Growth Over Time
21%23%20% 20%
Growth Over Time
American Century Investments FOR INSTITUTIONAL USE ONLY/NOT FOR PUBLIC USE
Identifying Market Inefficiencies


Persistent Inefficiencies
▪ Market is slow to recognize positive inflection points in the earnings cycles of individual companies.
▪ Market is inefficient in extrapolating current operating trends into future earnings around these inflection points.
Actual company fundamentals Wall Street consensus expectations
American Century Investments FOR INSTITUTIONAL USE ONLY/NOT FOR PUBLIC USE
Growth Rate
Time
I INFLECTION V VALUATION/ RISK REWARD S SUSTAINABILITY G EARNINGS GAP
(%)
Initiate position Exit position
The Salvation Army Non-U.S. Growth (Gross of Fees)
The Salvation Army Non-U.S. Growth (Net of Fees)
MSCI EAFE
The Salvation Army Non-U.S. Growth (Gross of Fees) 0.24 7.03 21.37 14.74 14.21 11.04
The Salvation Army Non-U.S. Growth (Net of Fees) 0.10 6.61 20.72 14.12 13.59 10.43
MSCI EAFE 0.45 8.35 25.73 7.62 8.81 7.46
Excess Return (Gross of Fees) 0.69 1.32 4.36 7.12 5.40 3.58
Excess Return (Net of Fees) 0.55 1.74 5.01 6.50 4.78 2.97
Data as of 9/30/2021. Performance in USD Periods greater than one year have been annualized. Inception date: 11/1/2012. Past performance is no guarantee of future results.
Source: FactSet
Performance American Century Investments FOR INSTITUTIONAL USE ONLY/NOT FOR PUBLIC USE -5 0 5 10 15 20 25 30 Quarter YTD 1 Year 3 Year 5
Year Inception
Return (%)
Quarter YTD 1 Year 3 Year 5 Year Inception
Cash Flow Summary USD Cash Flow Summary USD InceptionDate: 11/1/2012 InceptionDate: 11/1/2012 Market Value 9/30/2020 $ 67,903,714 Market Value 11/1/2012 $ 25,000,000 Contributions $ 0 Contributions* $ 14,000,000 Withdrawals ($ 2,600,000) Withdrawals** ($ 7,600,000) Market Value Gain/Loss $ 14,053,995 Market Value Gain/Loss $ 47,957,709 Market Value 9/30/2021 $ 79,357,709 Market Value 9/30/2021 $ 79,357,709 *9/6/2013: $14.0 million contribution **10/12/2018: $5.0 million withdrawal **7/21/2021: $2.6 million withdrawal The Salvation Army - 2021 Fiscal Year The Salvation Army - Since Account Inception
Performance Commentary – One Year Ending 9/30/2021
▪
The Salvation Army Non U.S. Growth portfolio underperformed the MSCI EAFE benchmark for the one year ended September 30, 2021, gaining 20.7% net of fees versus the index gain of 25.7%. The portfolio faced a strong headwind of the outperformance of value vs. growth, as the MSCI Value index gained 30.7% vs. the MSCI Growth index up 20.9%.
▪
Stock prices gained early in the year fueled by strong evidence of a global recovery in earnings growth despite new virus variants complicating the re opening in some regions. Economic activity was driven by strong rebound in both consumer demand and capital investment.
▪
The first 6 months of the fiscal year were led by stocks believed to benefit the most from re opening and cyclical recovery. This manifested in a high beta, low quality bounce off the market bottom irrespective of company specific fundamentals. The MSCI EAFE Value index outperformed the Growth index by 1600bps in this time period.
▪
Earnings growth continued to come in better than expectations setting records for sequential earnings beats. Broad based earnings gains led the global earnings revision ratio to new highs. Visibility into future earnings growth improved and it became apparent earnings would exceed pre pandemic levels sooner than expected.
▪
▪
▪
While the momentum of the cyclical recovery persisted through the time period, it is no longer accelerating. Much of the deep cyclical recovery is reflected in earnings estimates and valuations.
Growth rates are expected to normalize as macro influences stabilize. Structural and secular drivers will dominate. We anticipate earnings will be the key driver of stock price performance as PE multiples have declined.
The portfolio underperformed for the time period primarily due to positioning in financials, energy and materials. In addition, stock selection within consumer discretionary detracted from returns.
▪
Within consumer discretionary, top detractors included UK online apparel retailer ASOS. The company experienced slowdown in UK sales due to supply chain issues and has been unable to turn around its flailing U.S. business. The team sold the stock. China based Alibaba declined due to concerns over regulatory issues, and the team exited the position. Brazil based Magazine Luiza was weak despite continued strong earnings results.
▪
▪
The portfolio underweight in energy detracted 107 bps from excess returns.
Within financials, the underweight in banks detracted 150 bps from excess returns. In addition, long time portfolio holding London Stock Exchange declined due to concerns over delays in realization. The portfolio is underweight banks but does have some exposure to names with company specific drivers to growth.
▪
▪
On a positive note, multiple portfolio holdings added to the strong absolute returns. The common theme of top contributors was strong earnings reports and improved visibility of durable earnings improvement.
Multiple names within information technology added to returns, including payment processor Adyen, semiconductor equipment manufacturer ASML, components supplier Murata Manufacturing, and IT services provider Capgemini.
▪
Several holdings in industrials added as well. Top performers included Japan HR technology company Recruit Holdings, which owns Indeed.com, U.K. Construction equipment leasing company Ashtead, and power tool manufacturer Techtronic Industries.
As of 9/30/2021. Opinions and estimates offered constitute our judgment and along with other portfolio data are subject to change without notice. References to specific securities are for illustrative purposes only and are not intended as recommendations to purchase or sell securities.
FOR INSTITUTIONAL USE ONLY/NOT FOR PUBLIC USE American Century Investments
Portfolio Outlook and Positioning
▪
▪
▪
We remain focused on our disciplined, bottom up fundamental process aimed at identifying opportunities with accelerating, sustainable growth, where we see upside to consensus estimates.
While rates of growth have peaked, visibility into a long duration, earnings recovery has improved despite shortterm transitory issues. Earnings are forecasted to reach pre pandemic levels sooner than originally anticipated.
We believe 2022 will be a year of more normalized earnings growth as macro influences stabilize. This could lead to increased dispersion of returns as the market rewards stocks on fundamental merits.
▪
▪
We anticipate earnings will be the key driver of stock price performance and could continue to see multiple contraction.
We continue to take a balanced approach in the portfolio but believe company specific and secular drivers are becoming more attractive versus reopening or cyclical factors. We have exposure to companies poised to benefit from cyclical strength but also possess outsized durable growth drivers, as well as those supported by ongoing long term secular themes.
▪
▪
Input prices such as raw materials, labor and natural gas continue to rise, some at an accelerated pace. We are closely monitoring the acceleration of price increases and potential impact on profits and end market demand.
Recovery in travel names remains volatile. We trimmed positions where visibility remains low. We maintain positions in companies that also have support of specific competitive advantages.
▪ We added to positions in European banks as we see loan growth improving with economic activity.
▪ We maintain exposure to multiple secular growth themes including:
The Shift to Online Activity – E commerce penetration remains high and is growing in some industries.
Importance of a Strong, Global Communications Infrastructure Demand for data, cloud computing and remote access are driving increased investment as companies debate the need for a large central office.
Digitization – The need for efficiency and productivity will continue to drive spending in multiple industries.
Increased Environmental Awareness and Investment in Green Energy Solutions The trend is accelerating with the support of multiple fiscal stimulus programs in all regions of the world.
Luxury and Premium Brands – Pent-up consumer demand and high savings rates are driving increased consumer spend.
Construction and Infrastructure Spending Supported by fiscal programs, corporate CAPEX and strong housing trends.
Production and Supply Chain Reorganization Companies continue to invest to bring capacity closer to home. The quest for greater efficiency leads to higher usage of automation and robotic solutions.
The opinions expressed are those of American Century Investments and are no guarantee of the future performance of any American Century Investments portfolio. This material has been prepared for educational purposes only and is not intended as a personalized recommendation or fiduciary advice. It is not intended to provide, and should not be relied upon for, investment, accounting, legal or tax advice.
As of 9/30/2021. Opinions and estimates offered constitute our judgment and along with other portfolio data, are subject to change without notice.
Refinitiv Lipper Awards Important Disclosures:
The Refinitiv Lipper Fund Awards, granted annually, highlight funds and fund companies that have excelled in delivering consistently strong risk adjusted performance relative to their peers.
The Refinitiv Lipper Fund Awards are based on the Lipper Leader for Consistent Return rating, which is a risk adjusted performance measure calculated over 36, 60 and 120 months. The fund with the highest Lipper Leader for Consistent Return (Effective Return) value in each eligible classification wins the Refinitiv Lipper Fund Award. For more information, see lipperfundawards.com . Although Refinitiv Lipper makes reasonable efforts to ensure the accuracy and reliability of the data contained herein, the accuracy is not guaranteed by Refinitiv Lipper.
Refinitiv Lipper Fund Awards, ©2021 Refinitiv. All rights reserved. Used under license.
American Century Investments FOR INSTITUTIONAL USE ONLY/NOT FOR PUBLIC USE
Composite Performance
December 31, 2020
Non-U.S. Growth Equity (USD) Benchmark: MSCIEAFE (Net) Index
Year
2011-10.88-12.00-12.1422.2622.436N/A$2,548,748$109,483,940 201222.8521.5317.3219.8819.37120.54$4,138,412$124,740,627 201324.7223.5822.7816.3016.25120.54$5,477,857$139,308,411 2014-3.91-4.71-4.9012.4113.03180.32$6,617,164$145,752,355 20151.630.87-0.8111.4012.46170.48$6,151,546$146,186,455 2016-4.93-5.621.0011.8812.46180.40$6,139,121$156,826,943 201731.9331.1125.0311.8212.00170.87$7,367,617$173,311,771 2018-14.15-14.60-13.7912.5811.40150.47$5,371,754$149,483,375 201929.7329.0722.0112.0710.96120.24$6,220,141$178,050,055 202027.3626.727.8217.7318.1490.42$6,894,543$212,549,453
Performance Disclosures
December 31, 2020
Non-U.S. Growth Equity (USD)
For purposes of compliance with the Global Investment Performance Standards (“GIPS®”), the Firm is defined as American Century Investment Management, Inc (“ACIM” or “the Firm”)
American Century Investment Management, Inc. claims compliance with the Global Investment Performance Standards (GIPS®) and has prepared and presented this report in compliance with the GIPS standards ACIM has been independently verified for the periods January 1, 1992 to December 31, 2020 A firm that claims compliance with the GIPS standards must establish policies and procedures for complying with all the applicable requirements of the GIPS standards Verification provides assurance on whether the firm’s policies and procedures related to composite and pooled fund maintenance, as well as the calculation, presentation, and distribution of performance, have been designed in compliance with the GIPS standards and have been implemented on a firm wide basis The Non U S Growth Equity composite has had a performance examination for the periods January 1, 1994 to December 31, 2020. The verification and performance examination reports are available upon request.
The Non U S Growth Equity strategy seeks to provide a total return that exceeds the benchmark (MSCI EAFE (Net) Index) by 2% to 3% on an annualized basis over a full market cycle using a fundamentally driven growth equity investment strategy targeting predominantly large cap companies in developed markets outside the U S with the ability to investment up to 15% of the portfolio in emerging markets
Performance shown represents total returns that include accrued interest and dividend income, realized and unrealized gains and losses. The performance for this composite is net of foreign income tax withholding and includes the effect of foreign currency where applicable
Gross of fee returns are net of all trading costs and are calculated before management fees, administrative fees, custody fees and distribution and service fees, as applicable Net of fee returns are calculated after all trading costs, actual management fees, custody fees, distribution and services fees, as applicable Beginning December 1, 2018, the composite includes one or more accounts that utilize a model fee to calculate account level net of fee performance Net of fee returns utilizing a model fee are calculated after applying the standard management fee schedule for separate accounts based on the individual account's daily asset levels Actual management fees may differ from the standard management fee schedule Policies for valuing investments, calculating performance, and preparing GIPS Reports are available upon request
The management fee schedule for separate accounts is as follows: 75% on the first $25 million; 65% on the next $25 million; 60% on the next $50 million; 55% on all assets thereafter Both the highest management fee and highest total expense ratio for the American Century Non U S Growth Trust, which is included in the composite, is 0 68% on all assets.
The composite’s dispersion of annual returns is measured by the asset weighted standard deviation of individual portfolio gross of fee annual returns Only portfolios that have been managed within the composite for the full year are included in the asset weighted standard deviation calculation. Dispersion is not calculated for composites that have five or fewer portfolios for the full calendar year
The MSCI EAFE (Net) Index is designed to measure developed market equity performance, excluding the U S and Canada The performance results for the MSCI EAFE (Net) Index are net of foreign income tax withholding
The Firm established a $5 million minimum portfolio size for inclusion in the composite.
The creation date for this composite is June 16, 2000 The inception date for this composite is June 1, 1991
A list of all composite and pooled fund investment strategies offered by the firm, with a description of each strategy, is available upon request The type of portfolios in which each strategy is available is indicated
Past performance may not be indicative of future returns. The value of any investment may rise or fall over time Principal is not guaranteed, and investors may receive less than the full amount of principal invested at the time of redemption if asset values have declined
GIPS® is a registered trademark of CFA Institute CFA Institute does not endorse or promote this organization, nor does it warrant the accuracy or quality of the content contained herein
American Century Proprietary Holdings, Inc All rights reserved
American Century Investments FOR INSTITUTIONAL USE ONLY/NOT FOR PUBLIC USE
GrossTotal Return (%) Net Total Return (%) Benchmark Return (%)
Composite Gross Annualized 3-Yr Standard Deviation (%) Benchmark Annualized 3-Yr Standard Deviation (%) Number of Portfolios Composite Dispersion (%) Composite Assets (USD in 000s) Total Firm Assets (USD in 000s)
©2021
American Securities

1 November
2021
0
American Securities Overview


ASP I $71mm
ASP II $350mm
ASP III $650mm ASP IV $1bn ASP V $2.3bn ASP VI $3.6bn ASP VII $5bn ASP VIII $7bn


American Securities is a North American buyout firm that partners with experienced management teams and continuously invests in their long-term success

$25+ billion of committed capital firmwide, including affiliates
42-person Investment Team serving as thought partner to CEOs and their management teams on strategic direction and capital allocation
53-person in-house Resources Group to assist management teams in functional and strategic execution
3
American Securities | Confidential
1994 1998 2002 2006 2008 2011 20192016
American Securities is founded by Charles Klein and Michael Fisch
American Securities launches the Resources Group
American Securities opens Shanghai office
2021
2
Firm Developments
Notable Promotion
Mark Lovett, who originally joined American Securities in 2007 as a pre-MBA Associate and then rejoined as a Vice President in 2012 after working at a former American Securities portfolio company, was promoted to Managing Director at year-end 2020
ESG & DEI
In August 2021, engaged third-party provider to assist in ESG KPI collection across ASP VIII portfolio for reporting in 2022
In April 2021, formed DEI Committee with members from different teams and of different seniorities to continue driving progress on DEI
AS Birch Grove
In June 2021, American Securities closed the merger of its opportunistic credit business with Birch Grove Capital, a credit asset management business This transaction does not impact American Securities’ ownership or management
The combined entity, which is named AS Birch Grove, manages approximately $5 billion in credit assets
4
American Securities | Confidential
3
American Securities Partners VIII, L.P.
ASP VIII is a 2019 vintage fund with $7 billion in commitments
Declared effective on January 15, 2019
Investment period of six years, concluding on January 15, 2025 Fund life of up to 25 years 10-year initial term with three one-year extensions 12 additional one-year extensions, provided that a majority in interest of Limited Partners does not object in writing to any such extensions TSA Southern Territory’s commitment to ASP VIII is $30 million
To date, approximately $15.9 million has been called for investments, fees, and expenses(1)
June 30, 2021(4) 1.3x 37.0% 1.2x 22.9% (5) December 31, 2020 1.1x 7.2% 0.9x -13.5% (5) December 31, 2019 1.0x 0.0% N/A N/A
Past performance is not indicative of future results. Comparable benchmark performance results are unavailable at this timefor 2019 vintage North American buyout funds.
(1)Excludes capital related to closed transactions that was funded via American Securities Partners VIII’s credit facility and has not yet been called from investors. Including capital outstandingon the credit facility,approximately $16.8 million of TSA SouthernTerritory’s commitment has been utilized.
(2)Gross IRRs are calculated (x) with respect to realized investments, based on the actual daily capital inflows to and outflowsfrom ASP Portfolio Companies, and (y) with respect to unrealizedinvestments and the remainingunrealizedportions ofpartiallyrealized investments, based upon the timingofactual dailycapital inflows and the assumptionthat such unrealized investments are disposed of for cash at their respective unrealizedvalues as ofperiodend.
(3)Net IRR represents the cumulative internal rate of return since the fund’s inception based on the due dates of capital contributions, the actual date of distributions, and the net asset valueof limitedpartners(which has takeninto consideration managementfees, partnershipexpenses, and carried interest) asofperiodend.
(4)The Q3 reporting process is still underway at this time. Quarterly letters, inclusive of performance information as of September 30, 2021, will be distributed in early-to-mid November.
(5)Excluding the effect of the credit facility, ASP VIII’s estimated net IRR would be 17.5% as of June 30, 2021and -8.9% as of December 31, 2020.
5
American Securities | Confidential
Gross Net Multiple IRR(2) Multiple IRR(3)
4
American Securities Partners VIII Investments


As of June 30, 2021 ($ mm)(1)
Acquisition
Dec 2019 $377.0$483.7 1.3x17.7%
Dec 2019 $516.1$471.3 0.9x-5.9%
Jan 2020 $372.0$737.2 2.0x61.6%
Debt Initiative(3) Mar 2020 –Mar 2021 $51.7$61.2 1.2x37.6%
Jan 2021 $527.5$584.3 1.1x27.5%
Apr 2021 $187.0$236.8 1.3x N/M
Leading provider of non-destructive testing and related services to energy and industrial end markets in North America
Largest developer and operator of fitness clubs under the Planet Fitness brand
Leading contractor to the U.S. federal government and select allied national governments, supporting programs of critical national significance across defense, security and intelligence, energy, and environmental cleanup
Three former American Securities portfolio companies and 14 where we previously performed significant due diligence
Leading specialty building product distributor of wallboard, suspended ceiling systems, metal framing, and complementary products in North America

One of the largest independent outpatient medical imaging providers and physician radiology practices in the U.S.
(1)The Q3 reporting process is still underway at this time. Quarterly letters, inclusive of performance information as of September 30, 2021, will be distributed in early-to-mid November.
(2)Gross IRRs are calculated (x) with respect to realized investments, based on the actual daily capital inflows to and outflowsfrom ASP Portfolio Companies, and (y) with respect to unrealized investments and the remaining unrealized portions of partially realized investments, based upon the timing of actual daily capital inflows and the assumption that such unrealized investments are disposed of for cash at their respective unrealized values as of June 30, 2021.
(3)Excludes an investment in the debt of United PF, which is recorded as part of the United PF entry in the table above.
6
Confidential
American Securities |
Date Capital Invested Total Value Multiple of Cost Gross IRR(2) Description
5
American
Partners VIII Investments (Continued)
May 2021 $400.0$567.21.4xN/M
Leading renewable energy services business focused on the engineering, procurement, and construction and development of solar and storage projects

Regional last-mile delivery company providing residential e-commerce delivery solutions, custom-routed logistics, and global critical delivery services
May 2021 $562.0$754.01.3xN/M
Global leader in premium kitchen electrics appliances, non-electric kitchenware, personal care, grooming, health, and beauty products Oct 2021 $299.5


Provider of technology hardware, software, and services to over 2,500 enterprise and mid-market customers in the U.S. Pending ~$380
Renewable energy company focused on engineering, procurement, and construction and operations & maintenance services mainly for large scale solar and storage markets
7 American Securities | Confidential
Date Capital Invested Total Value Multiple of Cost Gross IRR(2)
Securities
Acquisition
Description
May 2021 $245.0$245.0 1.0x0.0%
6
As of June 30, 2021 ($ mm)(1) (1)The Q3 reporting process is still underway at this time. Quarterly letters, inclusive of performance information as of September 30, 2021, will be distributed in early-to-mid November. (2)Gross IRRs are calculated (x) with respect to realized investments, based on the actual daily capital inflows to and outflowsfrom ASP Portfolio Companies, and (y) with respect to unrealized investments and the remaining unrealized portions of partially realized investments, based upon the timing of actual daily capital inflows and the assumption that such unrealized investments are disposed of for cash at their respective unrealized values as of June 30, 2021.
The Salvation Army Southern Territory Annual Portfolio Review Meeting


November 2021
Organizational Update
As of September 30, 2021
$34.5 Billion in Assets
• Assets under management: $28.3 billion
• Assets under advisement: $6.2 billion
Ownership
•Part of Morgan Stanley Investment Management, the asset management division of Morgan Stanley
Investment Strategies
• High Quality Small / SMID Cap/ Select Equity: $18.8 bnin assets
• High Quality Large Cap Growth: $1.3 bnin assets

• High Quality Socially Responsible : $6.7 bnin assets
• High Quality Fixed Income : $1.5 bnin assets
Fiscal 2020 Significant Events:
On October 8, 2020, Morgan Stanley (MS) announced its intention to acquire Eaton Vance (EV), the majority owner of Atlanta Capital Management. The transaction was completed in March of 2021. There has been no change to our investment team or investment process.
COVID-19 Response/Update:
In March 2020, we elected to have all employees work remotely for health reasons. In September 2020, we began a formal return to office (RTO) program where all investment professionals who have received a COVID vaccine are back in the office full time.
Small Cap Portfolio Management Bios
Charles B. Reed, CFA is a Managing Director-Equities and Principal of the firm. Mr. Reed serves as a portfolio manager for Atlanta Capital’s Small Cap, SMID Cap and Select Equity portfolios. Prior to joining the firm in 1998, Mr. Reed was a portfolio manager with the Florida State Board of Administration. He was responsible for managing their internal special situation equity fund. Mr. Reed holds a Chartered Financial Analyst designation and is a graduate of Florida State University where he earned a Bachelor of Science degree in Finance.
William O. Bell, IV, CFA is a Vice President and Principal of the firm and serves as a portfolio manager on the Small Cap, SMID Cap and Select Equity portfolios. Prior to joining the firm in the fall of 1999, Mr. Bell was a portfolio manager with the Florida State Board of Administration. He was responsible for managing their internal special situation equity fund. Mr. Bell is a graduate of Florida State University, where he earned a Bachelor of Arts in Finance. Mr. Bell holds a Chartered Financial Analyst designation.
W.Matthew Hereford, CFA is a Vice President and Principalof the firm and serves as a portfolio manager on the Small Cap, SMID Cap and Select Equity portfolios. Prior to joining Atlanta Capital in December 2002, Mr. Hereford worked for 5 years at INVESCO. He was responsible for managing their Concentrated Equity Portfolio. Mr. Hereford is a graduate from the University of Mississippi, where he earned a Bachelor of Business Administration degree in International Business. Mr. Hereford holds a Certified Financial Analyst designation and is a member of the Atlanta Society of Financial Analysts.
Salvation Army Small Cap
Investment Returns as of September 30, 2021
Market Value 9/30/20$58,539,450 Market Value 9/30/21$76,214,270
Inception Date 4/30/95 $6,000,200
1Year 9/20 –9/21
PriorFiscal 9/19 –9/20 Three Year* 9/18 –9/21 Five Year* 9/16 –9/21
Total Fund 30.64 -2.53 10.11 14.07
Russell 2000® Index 47.68 0.39 10.54 13.45
Significant Flows since 04/30/95
08/01/97 $9,638,673 07/28/989,000,000 08/19/981,000,000 05/27/993,000,000 02/27/011,000,000 10/29/03 -20,000,000 04/14/09 -8,750,000 09/07/10 -9,750,000 05/26/11 -10,000,000 03/28/12 -5,000,000 12/17/13 -10,000,000 05/08/14 -10,000,000 06/30/16 -5,000,000 08/01/16 -5,000,000 08/23/16 -15,000,000 06/13/17 -10,000,000 10/23/19 -3,000,000 01/13/20 -10,000,000 09/04/20 10,000,000 09/11/20 10,000,000
*Annualized returns
Salvation Army Small Cap
Calendar Year Returns
Investment Objective:
The investment objectives, in order of priority, are (1) the preservation of capital; (2) to earn, on an annualized basis, over a full market cycle (three to five years), a total return (net-of-fees) which will exceed CPI plus 5%; and, (3) to achieve asset returns which exceed the performance of the Russell 2000 Index.
YearTotal FundRussell 2000
199624.816.5 199740.622.4 19985.1-2.5 19990.421.3 200017.4-3.0 200111.12.5 2002-7.1-20.5 200327.647.3 200420.218.3 20056.14.6 200616.118.4 20076.8-1.6 2008-19.5-33.8 200927.027.2 201025.926.9 201110.4-4.2 201212.116.3 201342.638.8 20143.14.9
Salvation Army Small Cap
Calendar Year Returns (cont’d)
Investment Objective:
The investment objectives, in order of priority, are (1) the preservation of capital; (2) to earn, on an annualized basis, over a full market cycle (three to five years), a total return (net-of-fees) which will exceed CPI plus 5%; and, (3) to achieve asset returns which exceed the performance of the Russell 2000 Index.
YearTotal FundRussell 2000
2015 5.1 -4.4 201618.98 21.31 2017 14.69 14.65 2018 1.72 -11.01 201927.06 25.53 202012.15 19.96 2021 YTD8.49 12.41
Since Inception (4/30/95) 13.25 9.79
Salvation Army Small Cap One Year as of September 30, 2021
The portfolio experienced strong absolute performance but underperformed the benchmark over the past twelve months, gaining +30.6% versus the Russell 2000 Index return of +47.7%.

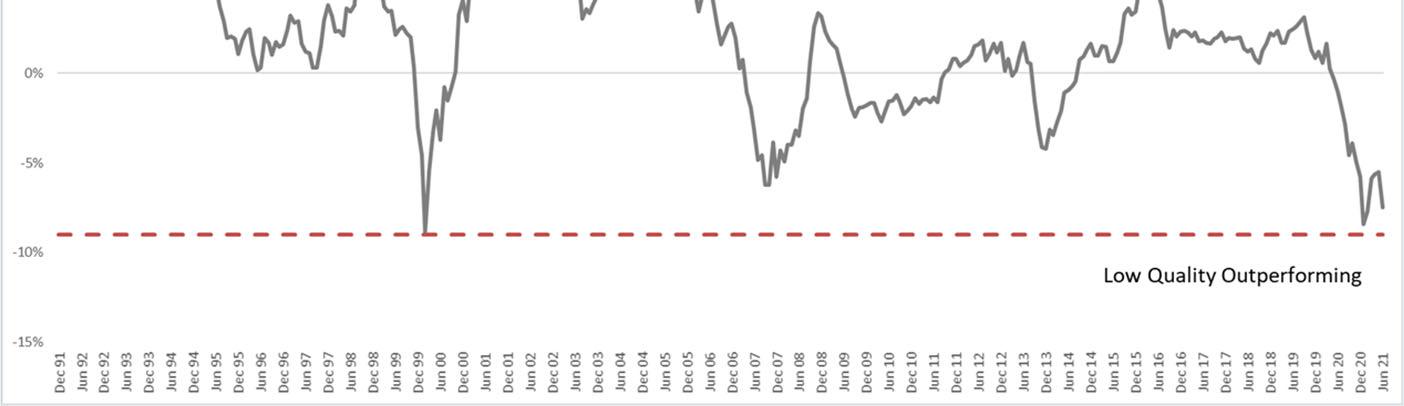
Low quality stocks have largely outperformed high quality stocks since the March 2020 pandemic lows due to the record amount of stimulus injected into the economy. Current low quality small cap outperformance is similar to levels experienced prior to the “Dot-Com” and Financial Crisis (see graph above). We would expect this extreme to normalize in favor of higher quality.
During the fiscal year, the portfolio experienced positive stock selection in Communication Services. Negative stock selection was most pronounced in Industrials, Consumer Discretionary, Technology, Financials, and Materials.
Our underweight to Health Care, Utilities, and Real Estate benefited overall allocation. Our underweight to Energy detracted from performance as commodity price inflation lifted energy stocks.
While low quality market dynamics are a near-term challenge to high quality strategies, we remain committed to investing in higher quality companies with positive earnings, strong balance sheets, and strong levels of profitability.
Sources:
High and low quality research portfolios compare the aggregate of all companies within the benchmark index with SPGMI Quality Rankings of B+ or Better to those with SPGMI Quality Rankings of B or Below.Thedata equalstherolling 5-year returnofthehigh qualityresearchportfoliominustherolling 5 year returnofthe lowqualityresearchportfolio fortheindex.
S&PGlobal,FTSERussell,WilshireAtlas,eVestment, AtlantaCapitalasof June 30, 2021.Salvation Army Small Cap Small Cap Investment Process
Step 1 CREATE A “FOCUS LIST” OF HIGH QUALITY COMPANIES
Evaluate U.S. companies within the $200 million to $4 billion capitalization range.
Exclude companies with:
• Volatile earnings streams
• Short operating histories
• High levels of debt
• Weak cash flow generation
• Low returns on capital
The result is a focus list of approximately 200 high quality companies.
Step 2 CONDUCT PROPRIETARY FUNDAMENTAL RESEARCH
Company specific research includes: Research must answer the following questions:
• Selectively meet company management and visit facilities
• Communicate with competitors, suppliers and buyers
• Review annual reports, 10K’s, 10Q’s, periodicals, and journals
• Is this the type of business we want to own?
• What price are we willing to pay?
“We believe that companies with a demonstrated history of consistent growth & stability in earnings provide attractive returns with moderate risk over the long-term.”
Salvation Army Small Cap
•
•
•
•
•
•
•
•
Cap Investment Process
Small
Prudent profit
price
taking/portfolio rebalancing as a response to
changes
Change
in management or business strategy
Deterioration
of financial quality
valuation
Excessive
WELL-DIVERSIFIED PORTFOLIO
More compelling investment candidate materializes Step 3 CONSTRUCT A FOCUSED YET
Focused
portfolio of generally 60-70 companies that reflect our best ideas
5%
max position sizes
Sector
MONITOR HOLDINGS & REVIEW FOCUS LIST
weights limited to 30% absolute
Step 4
“We will sell a business if”
Information for Investment Portfolio Annual Review Meeting
The Salvation Army Southern Territory

November 2021

BAILLIE GIFFORD
Baillie Gifford and the Salvation Army Southern Territory
Appointed to manage $61 million in an International Non US equity portfolio for The Southern Territory from October 2, 2000
Appointed to manage $50 million in the Emerging Markets Fund from May 3, 2010
Appointed to manage $56 million in the Long Term Global Growth Equity Fund from August 31, 2017
Baillie Gifford remains an independent partnership since its formation in 1908. It has 47 partners, 1,576 staff (319 investment professionals) and $466.8 billion under management as at September 30, 2021
Changes at Baillie Gifford in the year to September 30, 2021
3 new partners appointed, and 2 partners retired in 2021, including Joint Senior Partner, Charles Plowden
13 new investment graduate trainees joined in September 2021
Baillie Gifford The Salvation Army Southern Territory November 2021Teams
International Equities
Gerard Callahan*
30 years’ experience
30 years with Baillie Gifford
Joe Faraday
19 years’ experience 19 years with Baillie Gifford
Iain Campbell*
17 years’ experience 17 years with Baillie Gifford
Emerging Markets Team
Will Sutcliffe*
22 years’ experience
22 years with Baillie Gifford
Andrew Stobart
30 years’ experience 30 years with Baillie Gifford
Ben Durrant
9 years’ experience 4 years with Baillie Gifford
Huatai Cui
2 years’ experience 2 years with Baillie Gifford
Long Term Global Growth Team
Mark Urquhart*
25 years’ experience 25 years with Baillie Gifford
James Anderson*
38 years’ experience 38 years with Baillie Gifford
John MacDougall*
21 years’ experience 21 years with Baillie Gifford
Michael Pye
8 years’ experience 8 years with Baillie Gifford
Sophie Earnshaw 11 years’ experience 11 years with Baillie Gifford
Moritz Sitte 11 years’ experience 11 years with Baillie Gifford
Mike Gush* 18 years’ experience 18 years with Baillie Gifford
Roderick Snell 15 years’ experience 15 years with Baillie Gifford
Sophie Earnshaw 11 years’ experience 11 years with Baillie Gifford
Kitsu Egerton
Joined Baillie Gifford in September 2021
Alice Stretch 3 years’ experience 3 years with Baillie Gifford
Gemma Barkhuizen 4 years’ experience 4 years with Baillie Gifford
Robert Wilson 5 years’ experience 5 years with Baillie Gifford
Brogan Harris
Joined Baillie Gifford in September 2021
November 2021
Baillie Gifford The Salvation Army Southern Territory
* Partner
International Equities Portfolio
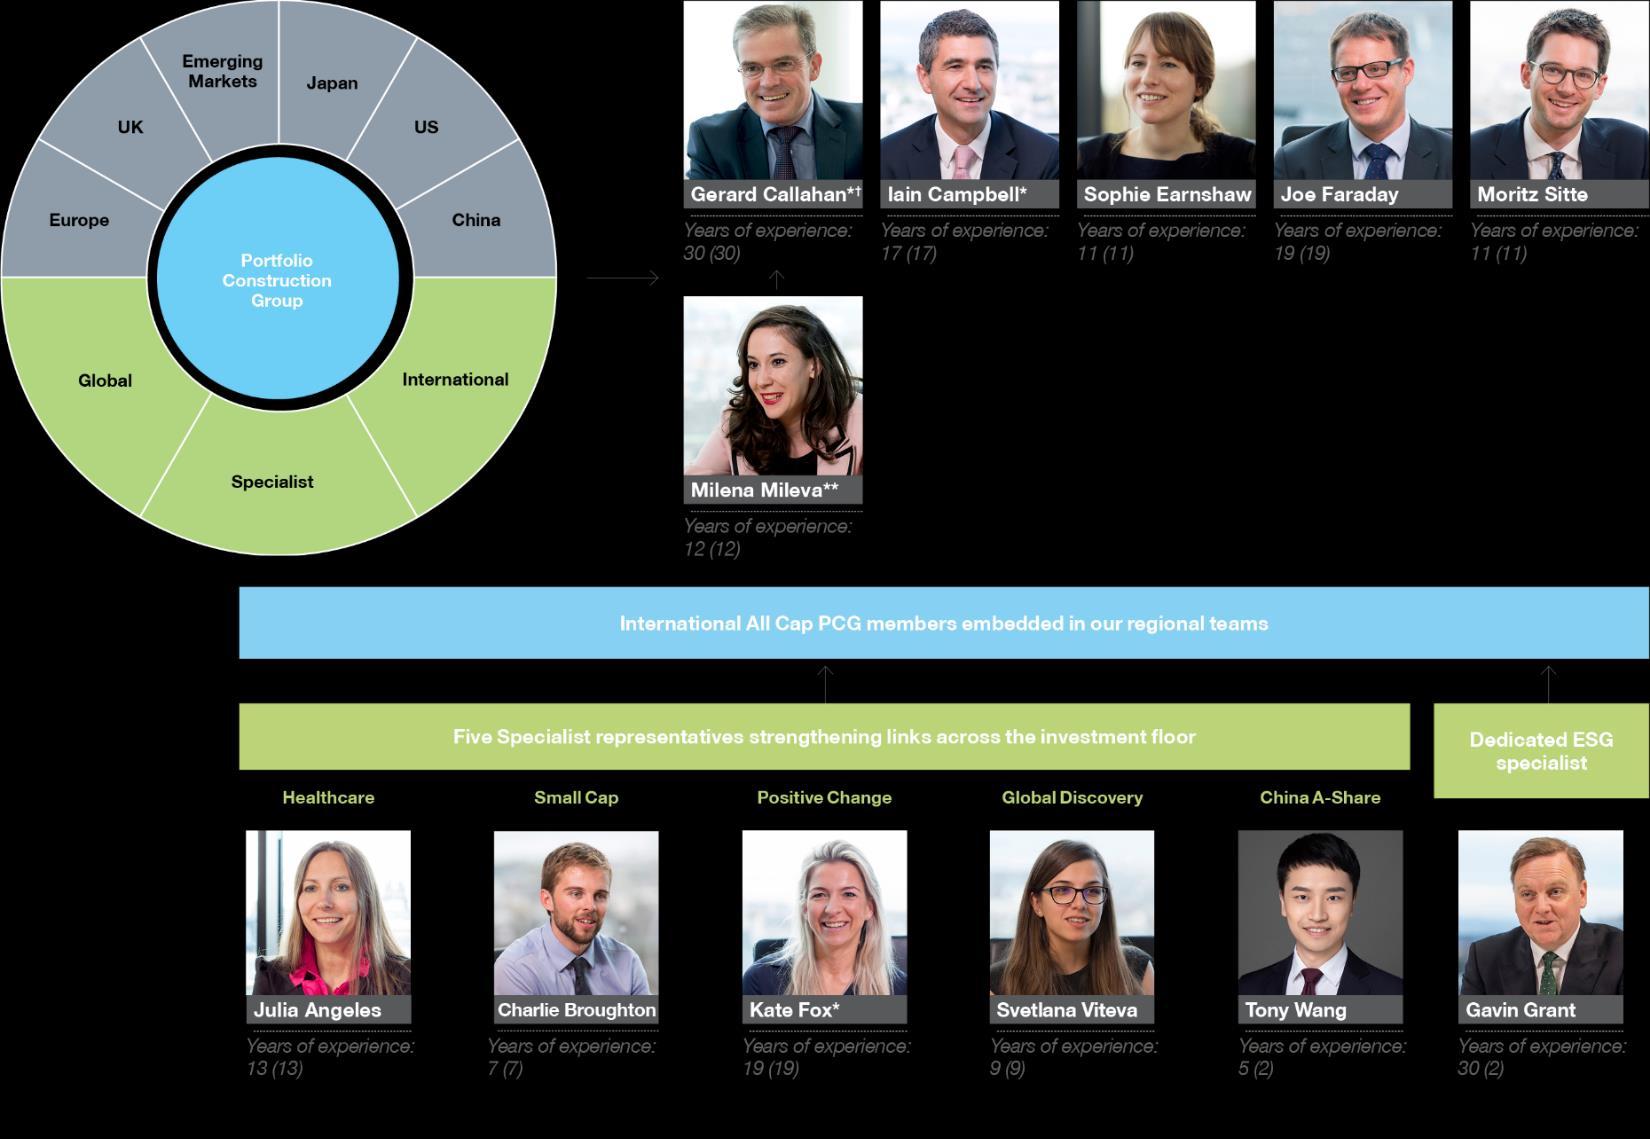
Investment Philosophy and Process
Philosophy
Growth: We believe superior profit growth leads to outperformance in the long run
Active: Bottom up stock selection enables exploitation of inefficiencies
Long term: Share prices reflect fundamentals over the long term
Investment Process
November 2021
Baillie Gifford The Salvation Army Southern Territory International Equities
Performance
Fund % MSCI EAFE Index %
12 Months to September 30, 2021 21.81 26.29
12 Months to September 30, 2020 25.51 0.93
3 Years to September 30, 2021 (p.a.) 14.66 8.11
5 Years to September 30, 2021 (p.a.) 12.68 9.32
Since Inception (10/31/00) to September 30, 2021 (p.a.) 6.81 5.15
Since Inception (10/31/00) to December 31, 2000 1.42 0.28
12 Months to December 31, 2001 19.09 21.21
12 Months to December 31, 2002 18.08 15.66
12 Months to December 31, 2003 31.89 39.17
12 Months to December 31, 2004 17.09 20.70
12 Months to December 31, 2005 14.85 14.02
12 Months to December 31, 2006 23.34 26.86
12 Months to December 31, 2007 13.29 11.63
12 Months to December 31, 2008 41.99 43.06
12 Months to December 31, 2009 38.32 32.46
12 Months to December 31, 2010 16.36 8.21
12 Months to December 31, 2011 10.86 11.73
12 Months to December 31, 2012 20.18 17.90
12 Months to December 31, 2013 26.19 23.29
12 Months to December 31, 2014 4.28 4.48
12 Months to December 31, 2015 4.41 0.39
12 Months to December 31, 2016 0.31 1.51
12 Months to December 31, 2017 27.11 25.62
12 Months to December 31, 2018 15.75 13.36
12 Months to December 31, 2019 33.68 22.66
12 Months to December 31, 2020 28.12 8.28
Year to Date to September 30, 2021 5.59 8.79
Source: StatPro, MSCI. Gross of fees. The returns presented are gross of fees. The results do not reflect the deduction of investment management fees; the return will be reduced by the management fees and any other expenses incurred in the management of the account. For example, an account, paying a 0.50% annual fee, with a given rate of 10% annualised over a 10 year period would result in a net of fee return of 9.5% p.a.
Market value
As at 09/30/20: $90,149,250*
As at 09/30/21: $101,533,847*
Investment objective
To achieve a rate of return on the Fund comparable to the MSCI EAFE Index over a full market cycle (3 to 5 years)
Performance measurement
From October 31, 2000
All investment strategies have the potential for profit and loss. Past performance is not a guide to future returns.
Source: Baillie Gifford & Co. *Excludes accrued income
Significant cashflows (>$1,000,000)
07/23/21: $7,900,000
09/14/20: $10,000,000
10/25/19: $3,000,000 05/29/19: $5,000,000 09/25/18: $15,000,000 08/31/18: $5,000,000 08/31/17: $73,000,000 09/04/14: +$30,102,419 (cash and stock)
09/14/09: $9,000,000 01/15/09: +$5,000,000
10/29/07: +$23,000,000
Baillie Gifford The Salvation Army Southern Territory International EquitiesNovember 2021
Key Factors Influencing Performance:
During the twelve months to September 2021, the EAFE portfolio that we manage for you underperformed its benchmark index by 4.93% (21.36% (net) vs 26.29%).
Looking at performance from a regional perspective, the UK was the main detractor while Europe (ex UK) contributed most strongly. Turning to sectors, the main detractors were Consumer Discretionary and Financials, while Health Care and Information Technology contributed most strongly.
Our bottom up stock picking approach to portfolio construction means that it is most appropriate to look at individual stocks when considering our performance. The holdings which detracted most from relative performance were Kingspan (Ireland listed manufacturer of insulation panels for buildings) and ASOS (UK listed online apparel retailer), while the main contributors were ASML (manufacturer of lithography equipment for the production of semiconductors) and NIBE (producer of heating solutions for buildings).
We endeavour to remain focused on the long term prospects for the businesses in which we invest, and this approach remains unaltered as the world's markets and economies emerge from the period of uncertainty resulting from the coronavirus pandemic. We invest over a horizon of five years and beyond, and believe that our performance should therefore be assessed over meaningful time periods. We remain confident that the international businesses in your EAFE portfolio are well placed to deliver the growth that we seek on your behalf.
Annual Discrete Performance
Salvation Army Southern Territory International Equities 09/30/16 09/30/17 09/30/17 09/30/18 09/30/18 09/30/19 09/30/19 09/30/20 09/30/20 09/30/21
Fund Gross (%) 14.91 4.79 1.30 25.51 21.81
Fund Net (%) 14.48 4.35 1.73 25.00 21.36
MSCI EAFE Index (%) 19.65 3.25 0.82 0.93 26.29
Source: StatPro, MSCI.
Baillie Gifford The Salvation Army Southern Territory International Equities November 2021Emerging Markets Equity Portfolio
Investment Philosophy and Process

Philosophy
Active management enables exploitation of inefficiencies
Partnership structure promotes long term thinking
Culture of debate encourages broader sense of perspective
Embrace uncertainty in the search for under appreciated growth
Process
Initial Idea 110+ analysts at firm 1000+ external contacts Focus on differentiated sources of information


Consultation with colleagues Research Double in 5 years?
Discussion 100 150 stocks per year Decision Lead manager and PCG

A process centred on research and discussion

November 2021
Baillie Gifford The Salvation Army Southern Territory Emerging Markets Equities
Performance
Fund (NAV) % MSCI Emerging Markets Index %
12 Months to September 30, 2021 16.25 18.58
12 Months to September 30, 2020 17.05 10.91
3 Years to September 30, 2021 (p.a.) 12.30 8.94
5 Years to September 30, 2021 (p.a.) 13.33 9.62
Since Inception (05/03/10) to September 30, 2021 (p.a.) 6.76 4.77
Since Inception (05/03/10) to December 31, 2010 16.31 16.21
12 Months to December 31, 2011 19.96 18.17
12 Months to December 31, 2012 13.92 18.63
12 Months to December 31, 2013 3.99 2.27
12 Months to December 31, 2014 0.26 1.82
12 Months to December 31, 2015 8.27 14.60
12 Months to December 31, 2016 3.24 11.60
12 Months to December 31, 2017 53.25 37.75
12 Months to December 31, 2018 14.80 14.25
12 Months to December 31, 2019 28.19 18.88
12 Months to December 31, 2020 29.75 18.69
Year to Date to September 30, 2021 7.18 0.99
Source: Bank of New York Mellon, StatPro, MSCI.
The Net Asset Value performance shown above is based on Share Class 3 until 12/31/14 and Share Class 5 thereafter.
Market value
As at 09/30/20: $66,971,776
As at 09/30/21: $67,974,556
Source: Baillie Gifford & Co.
Investment objective
To achieve a rate of return above that of the MSCI
Emerging Markets Index in US dollar terms
Performance measurement
From May 3, 2010
Significant cashflows (>$1,000,000) 07/19/21: $10,520,000
09/24/20: -$10,000,000 01/15/20: $2,000,000 10/24/19: $3,000,000 09/02/19: -$10,000,000 09/01/17: $24,000,000 08/01/17: $10,000,000 03/29/12: +$20,000,000 01/03/12: +$8,000,000
Source: Baillie Gifford & Co.
Baillie Gifford The Salvation Army Southern Territory Emerging Markets Equities November 2021Key Factors Influencing Performance:
During the twelve months to September 2021, the EM Fund that we manage for you underperformed its benchmark, however, was up meaningfully (c.16%) in absolute terms.
A number of businesses have seen demand buoyed by the pandemic and their operating results have been very strong as a result. Examples are wide ranging, but include SEA in the ASEAN region (gaming and ecommerce), Mercadolibre in Latin America (ecommerce and payments) and CATL in China (batteries and energy storage). It has been pleasing to see strong contributions from a diverse range of companies.
Amongst the performance detractors, Chinese companies are prominent given the impact of Chinese regulation on market sentiment, especially towards the end of the period. Examples include Alibaba and Ping An Insurance. Ping An has faced a series of issues with the ongoing restructuring of its agency sales force, the acquisition of troubled Founder Group and the launch of a basic, city government backed medical insurance plan, ‘HuiMinbao’. While these relatively short term concerns have dampened the share price, in the longer term it remains the case that China’s insurance penetration (insurance premiums as a percentage of GDP) is very low and this year’s Chinese census pointed to an ageing population, suggesting a long runway of growth for the insurance industry and strong prospects for Ping An, one of the brand leaders in the sector.
With concerns about the Federal Reserve tapering, Covid 19 and Chinese regulation and real estate, it is not surprising that markets have not been paying too much attention to company fundamentals in the short term. We cannot control any the above, but we can make sure that the companies in the portfolio are performing operationally as we expect. To a great extent, this is happening, with most companies hitting their straps through a series of results seasons. As long as this continues to be the case, we continue to be optimistic about the longer term outlook for the portfolio
Baillie Gifford The Salvation Army Southern Territory Emerging Markets Equities November 2021Long Term Global Growth Portfolio
Investment Philosophy and Process
Philosophy
Long Term: An increasing edge in an impatient industry
Global and Purely Stock Driven: Completely benchmark unconstrained
Focus on Exceptional Growth: Earnings growth ultimately drives share prices
Process
10 question stock research framework
Industry background
Competitive advantage
Q1 Is there ro to at least double sales over the next five years?
Q2 What happens over ten years and beyond?
Q3 What is your competitive advantage?
Q4 Is your business culture clearly differentiated? Is it adaptable?
Q5 Why do your customers like you? What societal considerations are most likely to prove material to the long term growth of the company?
Q6 Are your returns worthwhile?
Financial strength?
Management attitudes
Valuation
Q7 Will they rise or fall?
Q8 How do you deploy capital?
Q9 How could it be worth five times as much or more?
Q10 Why doesn’t the market realise this?
November 2021
Baillie Gifford The Salvation Army Southern Territory LTGG
Performance
Fund (NAV) % MSCI ACWI Index %
12 Months to September 30, 2021 25.25 27.98
12 Months to September 30, 2020 103.40 11.00
3 Years to September 30, 2021 (p.a.) 33.43 13.10 Since Inception (08/31/17) to September 2021 (p.a.) 32.74 12.70
12 Months to December 31, 2018 1.41 8.93
12 Months to December 31, 2019 33.50 27.30
12 Months to December 31, 2020 101.76 16.82
Year to Date to September 30, 2021 5.61 11.49
Source: Bank of New York Mellon, StatPro, MSCI. Returns are based on the K share class from April 28, 2017. Prior to that date, returns are calculated based on the oldest share class of the Fund, adjusted to reflect the K share class fees where these fees are higher.
Market value
As at 09/30/20: $68,184,961
As at 09/30/21: $75,097,478
Source: Bank of New York Mellon
Investment objective
To provide long term capital appreciation through investment in a portfolio of global equity securities without reference to benchmark constraints
Source: Baillie Gifford & Co.
Key Factors Influencing Performance:
Performance measurement: From August 31, 2017
Significant cashflows (>$1,000,000)
07/19/21: $10,520,000 09/25/20: $16,000,000 07/27/20: $30,000,000 01/10/20: $10,000,000
During the twelve months to the end of September 2021, the LTGG portfolio that we manage for you delivered absolute returns of 25%, which was slightly behind the index. Macroeconomic uncertainties surrounding the coronavirus (Covid 19) pandemic remain and global equity markets experienced volatility amid the uncertain regulatory backdrop in China.
North American holdings were the main driver of outperformance. In terms of sector exposures, the lion’s share of performance came from Health Care. That said, the Long Term Global Growth strategy is unconstrained, and very focused on bottom up stock picking, so any exposures to particular classifications are merely an output of the investment process.
At a stock level, the largest contributors were Moderna, Tesla and BioNTech.
November 2021
Baillie Gifford The Salvation Army Southern Territory LTGG
Legal Notices
Contracting Entity Baillie Gifford Overseas LimitedMSCI Source: MSCI. The MSCI information may only be used for your internal use, may not be reproduced or re disseminated in any form and may not be used as a basis for or a component of any financial instruments or products or indices. None of the MSCI information is intended to constitute investment advice or a recommendation to make (or refrain from making) any kind of investment decision and may not be relied on as such. Historical data and analysis should not be taken as an indication or guarantee of any future performance analysis, forecast or prediction. The MSCI information is provided on an "as is" basis and the user of this information assumes the entire risk of any use made of this information. MSCI, each of its affiliates and each other person involved in or related to compiling, computing or creating any MSCI information (collectively, the "MSCI Parties") expressly disclaims all warranties (including, without limitation, any warranties of originality, accuracy, completeness, timeliness, non infringement, merchantability and fitness for a particular purpose) with respect to this information. Without limiting any of the foregoing, in no event shall any MSCI Party have any liability for any direct, indirect, special, incidental, punitive, consequential (including, without limitation, lost profits) or any other damages. (www.msci.com)
GROWTH

November 2021
DFJ Growth
DFJ Growth
History/Background: DFJ Growth grew out of Draper Fisher Jurvetson (“DFJ”), a renowned venture capital firm with a 30+ year history of backing disruptive technology startups. DFJ Growth was initially formed with the launch of DFJ Growth 2006, an outgrowth of the collaboration of John Fisher, a founding member of DFJ, and three of its venture partners who possessed deep operating and entrepreneurial experience: Mark Bailey, Randy Glein, and Barry Schuler. This founding team was convinced there were shifts occurring in the public markets that would cause venture backed companies to stay private longer, thereby requiring more capital and expertise to build greater scale prior to accessing the public markets. Their conviction led to the formation of DFJ Growth, a firm they have built together over the past 14 years.

DFJ Growth raised its first $271 million fund in 2006, its second $450 million fund in 2013, its third $515 million fund in 2016, and its fourth $947 million fund that held its first close in 2020 and its final close earlier this year.
DFJ Growth believes one of the most important factors contributing to the success of any firm focused on growth investments is the extent to which it has built an industry recognized “franchise.” Franch ise value leads to a virtuous cycle of success: DFJ Growth believes high quality entrepreneurs come to DFJ Growth because of the reputation it has developed in the market as a team of high quality, experienced investors and the franchise value associated with the DFJ brand developed over the past 30 years and in particular, entrepreneurs’ experience working with the Partners and team at DFJ Growth.
DFJ Growth has spent the past 15 years developing a leading presence in the market with entrepreneurs and venture capital investors for providing capital, insights and expertise to high growth technology companies. DFJ Growth believes that such presence has raised and will continue to raise, in a self perpetuating manner, the profile of DFJ Growth in entrepreneurial and investment circles, making DFJ a firm that highly qualified entrepreneurs will seek out for investment partnership.
Management Team: DFJ Growth currently has 11 investment professionals located at 2882 Sand Hill Road, Suite 150, Menlo Park, CA 94025. DFJ growth welcomed a new Partner in October, Justin Kao. We engage an additional staff of operating partners, back office support and administrative support, totaling approximately 13 people, many of whom are shared resources with Threshold Ventures (formerly DFJ Venture).
Growth’s strategy is designed to build a portfolio with attractive risk/reward characteristics, seeking to provide exposure to the substantial upside of high growth, expansion stage companies balanced with less capital risk than is commonly associated with early stage venture investing. DFJ Growth focuses on investing in companies that typically have achieved market validation, are scaling rapidly, and address large market opportunities with innovative products and services.
DFJ Growth believes the accelerating pace of innovation and technological change will continue to create fertile opportunities for the foreseeable future. Principal areas of focus for the funds include the
broad categories of enterprise information technology, internet media, consumer information technology, and disruptive enabling technologies. Continued advancements in computing power, ubiquitous broadband and mobile connectivity, cloud based services, smart devices, and machine learning are expected to drive the emergence of exciting new markets as well as opportunities for new entrants to disrupt industry incumbents and transform existing markets. Additional areas of opportunity are emerging through new sources of innovation in artificial intelligence, big data, digital health, genomics, next generation computing interfaces (e.g., virtual reality), blockchain based financial services, robotics, and myriad other technological advancements on the horizon. These trends and market opportunities will form the basis for investment themes expected to yield many opportunities for the funds. In addition, the dynamic nature of technology driven industries will no doubt cause current investment themes to evolve and change over time, and the funds plans to take advantage of new sources of innovation and market opportunities as they emerge.
The Salvation Army Southern Territory invested in DFJ Growth III, L.P. and DFJ Growth IV, L.P.
DFJ Growth III, L.P. and DFJ Growth IV, L.P. are Delaware Limited Partnerships.
DFJ Growth III and DFJ Growth IV (together, the “Funds”) are natural progressions of the strategy pursued by the prior two DFJ Growth funds with a focus on identifying and investing in the next generation of disruptive, growth stage technology leaders.
Investment Strategy
The Funds seek to invest in exceptional technology driven growth companies meeting the following criteria:
Potential to be disruptive category leaders
Address large market opportunities
Extraordinary entrepreneurs
Market validation with rapid and sustainable growth
Venture return upside balanced with capital preservation
The Funds focus on investing in companies that typically have achieved market validation, are scaling rapidly, and address large market opportunities with innovative products and services. Market validation is achieved only after the product is built and demonstrates a clear value proposition, customers adopt and pay for the product, and the business begins scaling. When all of these factors align, the expected result is a period of rapid growth in customer base and revenue that signals the opportunity to create significant enterprise value. The Funds typically seek companies with at least $10 million of annualized revenue or bookings run rate as part of this “validation” criteria, although the Funds expect to make, and have made, some number of investments based on other metrics or signals that provide indications of market validation (e.g., companies with rapid user growth or companies experiencing significant product adoption within “freemium” models that have not yet begun significant monetization).
Fund Name:
DFJ Growth III, L.P.
DFJ Growth IV, L.P.
Vintage Year: 2017 2020
Total Commitments: $515M $947M
Investment Period: 6 years from May 1, 2017 6 years from June 22, 2020
Life of the Fund: 10 years from May 1, 2017 unless extended by a Notice of Extension
10 years from June 22, 2020 unless extended by a Notice of Extension
TSA Southern Territory commitment: $15M $15M
DFJ Growth III: Period in Review (10/1/20
Invested $428.3 million in 21 companies since inception
Invested $45.9 million since 9/30/20
– 9/30/21)
11 follow‐on financings: AnyVision (Q3 2021), Armis (Q1 2021), Collective (Q2 2021), DataRobot (Q4 2020), Helix (Q2 2021), Immuta (Q1 2021), Neuralink (Q3 2021), Outreach (Q2 2021), Patreon (Q2 2021), Splice (Q4 2020), Yellowbrick Data (Q2 2021)
13 markups and 0 markdowns
Portfolio construction comp lete, excellent portfolio progress
DFJ Growth III: Performance Snapshot as of 9/30/21
Fund Size
$515.0M DPI 0.31 Gross Multiple 2.8x Capital Drawn $489.2M RVPI* 1.80 Net Multiple* 2.1x
Total Fund Value** $1,030.7M TVPI* 2.11 Gross IRR 46.9%
Active Companies 21 Net IRR 33.2% **Net of carry *On drawn capital
DFJ Growth IV: Period in Review (10/1/20
Invested $201.8 million in 9 companies since inception
– 9/30/21)
Six new portfolio companies: Alchemy (Q2 2021), Dutchie (Q1 2021), Hopin (Q4 2020), NotCo (Q3 2021), Salt (Q2 2021), Sysdig (Q2 2021)
Three follow‐on financings: Dutchie (Q3 2021), NotCo (Q3 2021), SpaceX (Q1 2020)
5 markups and 0 markdowns
Portfolio construction initiated, opportunity‐rich pipeline
DFJ Growth IV: Performance Snapshot as of 9/30/21
Fund Size
$946.7M DPI 0 Gross Multiple 1.6x
Capital Drawn $234.8M RVPI* 1.29 Net Multiple* 1.3x
Total Fund Value** $303.3M TVPI* 1.29 Gross IRR 88.8%
Active Companies 9 Net IRR 46.4% **Net of carry *On drawn capital
Ownership
DFJ Growth III, L.P.
The Salvation Army Southern Territory
%: 2.9128%
Total Commitment: $15,000,000 Called to Date: (13,830,000) Unfunded Commitment: $ 1,170,000
Statement of Changes in Partner’s Capital
For Period ended June 30, 2021 (Unaudited)
Beginning of Period (6/30/20) 14,389,511 Capital Calls 1,695,000 Partner Transfer 0 Syndication Costs (28,804)
Cash Distribution 0 Stock Distribution* (3,313,895)
Interest Income (3,662) Less: Management Fee (346,196) Other Expenses (11,333) Net Investment Loss (361,191)
Realized Gain (Loss) 0 Deemed Gain Stock Distribution* 2,935,038 Unrealized Gain (Loss)* 10,546,998
End of Period (6/30/20) $25,862,657
*Stock Distribution and Unrealized Gain (Loss) do not affect taxable income
This statement includes information prepared by the General Partner which has not been audited or reviewed by independent Certified Public Accountants.
DFJ Growth IV, L.P.
The Salvation Army Southern Territory
Ownership %: 1.5844%
Total Commitment: $15,000,000 Called to Date: (2,895,000) Unfunded Commitment: $12,105,000
Statement of Changes in Partner’s Capital
For Period ended June 30, 2021 (Unaudited)
Beginning of Period (6/30/20) 876,275 Capital Calls 2,025,000 Partner Transfer 0 Syndication Costs (39,989)
Cash Distribution (55,065) Stock Distribution* 0
Interest Income 55,065 Less: Management Fee (266,529) Other Expenses (2,892) Net Investment Loss (214,356)
Realized Gain (Loss) 0 Deemed Gain Stock Distribution* 0 Unrealized Gain (Loss)* 876,476
End of Period (6/30/20) $3,468,341
*Stock Distribution and Unrealized Gain (Loss) do not affect taxable income
This statement includes information prepared by the General Partner which has not been audited or reviewed by independent Certified Public Accountants.
This page intentionally left blank

November
2021
As of 9/30/2021, the firm had approximately $60.4 billion assets under management and 11 investment professionals.
During Fiscal 2021, Edgewood changed its principal place of business to 600 Steamboat Road, Suite 103, Greenwich, CT 06830. Edgewood will maintain its office located at 535 Madison Avenue, 15th Floor, New York, NY, 10022 mainly for use by administrative staff.
Edgewood has one Large Cap Growth strategy. Edgewood’s goal is to produce superior and sustainable long term performance by investing in growth companies it deems to be of high quality. Edgewood’s investment philosophy is grounded in the conviction that earnings growth will drive stock prices over the long term. Edgewood’s Large Cap Growth Equity strategy is bottom-up and pursues long-term growth through a portfolio of 22 stocks of predominately large size companies that are distinguished by their financial strength, levels of profitability, strong management teams and the possibility to deliver long term earnings power.
Edgewood draws from the universe of public equities and initially screens for and eliminates cyclical stocks. Then a market capitalization screen is used to capture companies with a market capitalization of $5 billion and above. Edgewood’s “working list” of securities is determined through a focus on companies that are distinguished by their strong cash generation capabilities, consistent earnings power, superior revenue growth, return on equity, low debt, solid business models, good unit volume growth, recurring revenues and fee based businesses.
Both portfolio managers and analysts propose new investment ideas. The team seeks companies that are considered according to its investment methodology, as well positioned for long term growth driven by the demand for their products and services, trading at substantial discounts to their fair market value, and are at an early stage in their potential profit cycle.
Based on the team’s fundamental analysis of a company’s profit cycle, Edgewood builds a five year discount to present value model for each company. Edgewood visits the company and meets the management team to perform a comprehensive analysis of the company. The criteria do not differ by sector or security type, however, there is a 25% limit on any one sector, as defined by Edgewood’s Investment Committee, in the portfolio which the Investment Committee will take into account when researching new ideas.
Edgewood is committed to a strong and coordinated team approach when making investment decisions, individual portfolio managers do not act independently. All recommendations are presented by one of the six portfolio managers to the Investment Committee and all new investment decisions are made on a unanimous basis. The team will not deviate from its discipline. Every day, Edgewood is evaluating every position. When a new holding is introduced to the universe, it forces the team to challenge the conviction level of all of the existing stocks in the portfolio. Portfolio construction is strictly defined at 22 companies with the limitation that for a name to be added, another name must be sold.
To sell a stock it requires a majority vote by the Investment Committee. If a company misses earnings 2 quarters in a row, there is a 15% drop in the stock relative to its peers or if there is a change in industry or company fundamentals, the Investment Committee will discuss selling the stock, decreasing the weighting in the portfolio or adding to the weighting in the portfolio. The primary Portfolio Manager responsible for the stock loses coverage and it is reassigned to one of the other Portfolio Managers. At that point, the company is reassessed against the original investment thesis given
the new information and a recommendation is presented to the Investment Committee. The original Portfolio Manager stays on the committee as a source of information but loses his vote in the decision. A majority vote (3 2) is required to remove a stock from the portfolio.
Inception date: 09/16/2021
AUM as of 09/30/2021: $73,298,710

This page intentionally left blank
Freeman Spogli & Co.
November 2021
FS
*The Salvation Army Southern Territory committed $25.0 million to FS Equity Partners VIII, L.P. (“Fund VIII”). Fund VIII was raised in October 2019 and is 51% invested as of September 2021.November 2021
Freeman Spogli is a leading private equity firm dedicated to investing with management in middle market companies in the consumer and distribution sectors.
The firm was founded by Bradford M. Freeman and Ambassador Ronald P. Spogli in 1983 with the goal of investing capital in partnership with management teams to help build growth-oriented companies. Mr. Freeman and Ambassador Spogli were among the pioneers in the private equity business and raised the firm's first institutional equity fund in 1986. Over the four decades in business, the firm has grown to 25 investment professionals in two offices and has invested over $5 billion of private equity capital in 66 companies and over 125 add-on acquisitions. Freeman Spogli currently manages four investment funds totaling $5 billion in committed capital and has investments in 18 companies with total sales of over $3 billion.
Since the firm’s founding in 1983, Freeman Spogli has managed nine investment partnerships including eight institutional funds. The firm’s investors include public and private pension funds, insurance companies, endowments, foundations, corporations, family offices and individuals. In total, Freeman Spogli has raised $7 billion of equity capital and is currently investing FS Equity Partners VIII, L.P., a $1.85 billion fund.
Firm Overview
Experienced and Cohesive Team:
Consistent team, focus and strategy for four decades
Partners average 26 years with Freeman Spogli
Investments are cross-staffed between Los Angeles and New York offices
Specialized Focus:
Dedicated exclusively to middle market private equity
Specialize in consumer and distribution businesses in the U.S.
Proven and replicable playbook of value creation drivers
Consistent Multi-Cycle Track Record:
Gross IRR of 24% (15% net) and gross MOI of 2.3x (1.9x net) since inception
52 investments have been fully or partially realized
Strong results through multiple market cycles demonstrates resilient strategy
Alignment of Interest:
Significant cash commitment from FS investment professionals
Significant GP commitment since inception of the firm (6% of capital raised)
LP friendly distribution waterfall and fee construct
© 2021 Freeman Spogli & Co. All rights reserved. Los Angeles | New York
November 2021
Cornerstones of Freeman Spogli
*The Salvation Army Southern Territory committed $25.0 million to FS Equity Partners VIII, L.P. (“Fund VIII”). Fund VIII was raised in October 2019 and is 51% invested as of September 2021.

Experience, Focus and Continuity
Freeman Spogli’s team is experienced in investing in middle market consumer and distribution businesses. The firm’s focus on companies in these two broad sectors of the U.S. economy differentiates Freeman Spogli from other private equity firms. Moreover, the team’s continuity and length of tenure are unique in the industry. The partners of Freeman Spogli have been with the firm for an average of 26 years and have successfully executed and managed investments through various economic and market cycles since the firm’s founding.


© 2021 Freeman
& Co.
rights
Los Angeles | New York
Spogli
All
reserved.
November 2021

*The Salvation Army Southern Territory committed $25.0 million to FS Equity Partners VIII, L.P. (“Fund VIII”). Fund VIII was raised in October 2019 and is 51% invested as of September 2021.


Criteria for Investment Industry: Established companies in the consumer and distribution sectors Transaction Types: Management buyouts, leveraged recapitalizations, growth investments, corporate carve-outs and equity investments Company Characteristics: Strong management teams Defensible market positions Platform for organic and acquisition growth Solid margins and free cash flow Geography: North America Company/Transaction Size: Companies with EBITDA of $10 million to $75 million Equity investments of $75 million to $300 million Transactions of $100 million to $750 million in total size © 2021 Freeman Spogli & Co. All rights reserved. Los Angeles | New York
*The Salvation Army Southern Territory committed $25.0 million to FS Equity Partners VIII, L.P. (“Fund VIII”). Fund VIII was raised in October 2019 and is 51% invested as of September 2021.
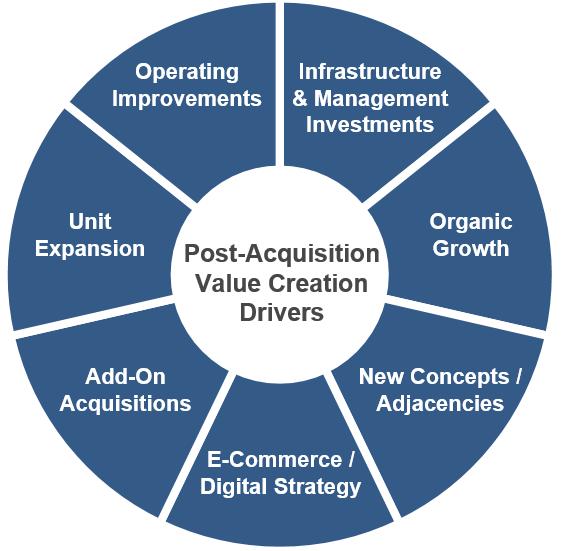
Proven, Disciplined and Consistent Investment Approach Focus and specialization in the middle-market consumer and distribution sectors Leading businesses with transformative opportunities Partnership with proven management teams Active post-acquisition engagement and value building initiatives Utilization of Industry Executives Preference for control Proactive deal sourcing and rigorous due diligence Prudent use of leverage and downside protection Illustrative Post-Acquisition Value Creation Drivers © 2021 Freeman Spogli & Co. All rights reserved. Los Angeles | New York
November 2021
November 2021
2020 and YTD 2021 Activity Overview
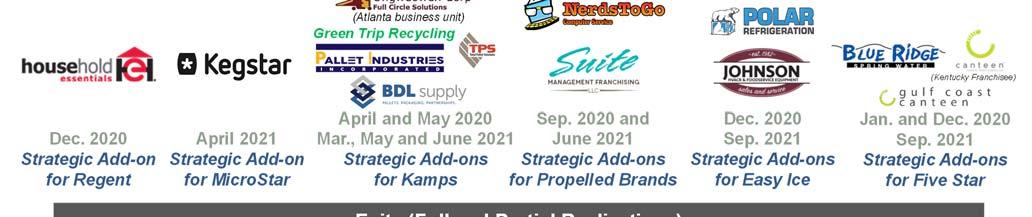


*The Salvation Army Southern Territory committed $25.0 million to FS Equity Partners VIII, L.P. (“Fund VIII”). Fund VIII was raised in October 2019 and is 51% invested as of September 2021.
Current Portfolio Companies

© 2021 Freeman Spogli & Co. All rights reserved. Los Angeles | New York
November 2021
Contact Us
Los Angeles: 310.444.1822 | New York: 212.758.2555
Investor Contact: IR@freemanspogli.com
*The Salvation Army Southern Territory committed $25.0 million to FS Equity Partners VIII, L.P. (“Fund VIII”). Fund VIII was raised in October 2019 and is 51% invested as of September 2021.
© 2021 Freeman Spogli & Co. All rights reserved. Los Angeles | New York
This page intentionally left blank
November 2021

Genstar by the Numbers ▪ 30+ Year Track Record ▪ ~$33 billionAUM ▪ $11.9 billion Raised for Genstar X1 ▪ 4 Targeted Industry Verticals ▪ 25 InvestmentProfessionals ▪ 30 Strategic Advisory Board Members Founded in 1988, Genstar Capital is a leading private equity firm based in San Francisco.Genstar executes control investments in growthoriented companies in the financialservices, healthcare, industrial, and software sectors. Genstar partners with its managementteams and network of strategic advisors to transformits portfoliocompanies into industry-leadingbusinesses. Differentiated Investment Strategy The Genstar Advantage: One Office, One Culture, One Asset Class FIRM OVERVIEW November 2021 Presentation Material:The Salvation Army Southern Territory Genstar Capital | Four EmbarcaderoCenter, Suite 1900 | San Francisco,CA 94111 Phone: (415) 834-2350 | Fax: (415) 834-2383 | www.gencap.com Singular Focus ▪ North America,middlemarket, control buyout ▪ Targeting total equity of $250M 1B per investment Vertical Specialists Leverage deep domain knowledge, extensive executive networks, and proprietarydeal flow in four targeted industry verticals ▪ FinancialServices ▪ Healthcare ▪ Industrials ▪ Software Effectuate Change Aim to build industry leadingbusinesses ▪ Accelerate revenue and earnings growth ▪ Transformbusiness through acquisition,strategic realignment,and enhancement of human capital Talent Management Partner with top-tier management teams and operating executives 1. Includes $1.5B Genstar X Opportunities Fund. ▪ Southern Territory invested $15M in Fund IX (2019) and $20M in Fund X (2021) ▪ Fund IX is 82% invested with 15 platform companies ▪ Fund X is 21% invested with 3 platform companies1 The Salvation Army Southern Territory Presentation Material 1. As of September 30, 2020
Harris Associates CONCENTRATED VALUE EQUITY Salvation Army- Southern Territory November
Michael J. Mangan, CFA, CPA Partner and Portfolio Manager Head of Private Wealth Management Harris Associates | Private Wealth Management 111 South Wacker Drive, Suite 4600 Chicago, IL 60606 312.646.3595 mmangan@harrisassoc.com www.harrisassoc.com ©2021 Harris Associates L.P. All rights reserved. This material may not be distributed, published, or reproduced, in whole or in part. For institutional use only
2021
Salvation Army- Southern Territory
Account Inception: January 25, 2002
History / Ownership
Harris Associates L.P. (“Harris”), a Delaware limited partnership, with Harris Associates, Inc. as its general partner, was founded in 1976 by experienced investment professionals to provide investment advice to wealthy individuals and institutions. These professionals, who had formerly worked in the private investment office of a prominent Chicago entrepreneur, created and refined the distinct value investment philosophy that has guided the firm since its inception. Harris offers U.S. equity, international equity, global equity, balanced and fixed income strategies to institutions and individuals worldwide. As of September 30, 2021, total assets under management totaled over $120 billion.
Harris and Harris Associates, Inc. are wholly owned subsidiaries of Natixis Investment Managers, LLC, which is an indirect subsidiary of Natixis Investment Managers, an international asset management group based in Paris, France. Natixis Investment Managers is in turn owned by Natixis, a French investment banking and financial services firm. Natixis is principally owned by BPCE, France’s second largest banking group.
Harris retains full control of investment decisions, the investment philosophy and day to day operations.
Product Offerings
As of September 30, 2021, Harris manages approximately $56 billion in equity, $3 billion in balanced portfolios and $3 million in fixed portfolios for individual and institutional clients. We employ an active value philosophy using a bottom up stock selection process and fundamental analysis. Harris Associates is the adviser to The Oakmark Funds. Guided by the same disciplined value investment philosophy, The Oakmark Funds have delivered results that we believe place them among most well regarded mutual fund families in America. As of September 30, 2021, The Oakmark Funds assets under management were approximately $62 billion.
Professionals
As of September 30, 2021, Harris has 199 employees. Of the 199 there are 71 professionals employed by the firm (nine portfolio managers, two client portfolio managers and 26 analysts, nine traders, seven marketing & client relations professionals and five key management professionals President, General Counsel, Chief Financial Officer, Chief Technology Officer and Chief Information Security Officer; 14 additional compliance and legal professionals Chief Compliance Officer (CCO), a Compliance Manager/Deputy CCO, a Compliance Manager, a Compliance Supervisor, three Senior Compliance Officers and two Compliance Officers, a Deputy General Counsel, an Assistant General Counsel, Director of Legal Operations, and a Paralegal)
2021 (YTD September 30, 2021) firmwide Professional Staff (Hires/Departures/Promotions/Changes):
The following changes occurred specific to executive professionals (Operating Board, Operating Committee, additional Chief level positions and other individuals that have a say in the management of the firm) in the firm:
On July 1, 2021, Win Murray was elected to replace Kevin Grant as a member of the Operating Board of Harris Associates L.P. and Harris Associates, Inc. (Harris’ general partner). On June 30, 2021, Kevin Grant, Co Chairman of Harris Associates, in preparation for his retirement from Harris at the end of 2021, he retired from his role as a member of the Operating Board of Harris Associates L.P. and Harris Associates, Inc. (Harris’ general partner). In June 2021, Erin Yarnall, Chief Human Resources Officer, left the firm and Operating Committee. In April 2021, Kristi Rowsell, Partner and Past President, retired from the firm. In January 2021, Rana Wright was elected a Director of Harris Associates, Inc., Harris’ general partner. In January 2021, Rana Wright, General Counsel, was promoted to Chief Administrative Officer of Harris Associates L.P. and Harris Associates, Inc. (Harris’ general partner)., in addition to her role as General Counsel. In January 2021, Christopher Keller, Chief Operating Officer, was promoted to President of Harris Associates L.P. and Harris Associates, Inc. (Harris’ general partner). Christopher served as the Chief Operating Officer of Harris from 2015 2020.
The following changes occurred specific to investment professionals (portfolio managers, analysts and traders) in the firm: Stephanie Gan, International Investment Analyst, joined the firm in September 2021. Doug Fagan, International Investment Analyst, joined the firm in September 2021. Matthias Nikaj, International Investment Analyst, joined the firm in August 2021. Christopher Kim, International Investment Analyst, left the firm in July 2021. Rajesh Paryani, U.S. Senior Equity Trader, joined the firm in July 2021. As of July 1, 2021, Eric Liu was named co Portfolio Manager on the Global Strategy. While David Herro and Tony Coniaris will remain the lead portfolio managers for the strategy, Eric Liu will replace Michael Manelli as co portfolio manager. This change will help the firm better leverage responsibilities and more effectively balance workloads. Emily Neumark and Mark Small were each named Portfolio Managers for Private Client Strategies in June 2021. Liam McGarrity was named U.S. Investment Analyst in May 2021. Diane Mustain, Director and Portfolio Manager, retired from the firm in April 2021.
The following changes occurred specific to firm’s Marketing and Client Relations, Compliance and Legal professionals: Megan Claucherty, Assistant General Counsel, left the firm in May 2021. Vineeta Raketich, Managing Director, Global Operations & Client Relations, left the firm in February 2021.
Firm Strengths
Harris was founded in 1976 by dedicated investment professionals who believed that delivering successful investment results for clients requires a consistent investment philosophy, a commitment to superior investment research, and a high level of customer service. We believe Harris distinguishes itself in its steadfast conviction to invest where we see the greatest value. This conviction, backed by discipline and consistency, forms the foundation of our philosophy: to pursue superior results over time by investing as owners in high quality companies at a significant discount to their true economic value.
We put our philosophy into practice with a rigorous, fundamental research process. One distinctive aspect of our process is our generalist approach to finding and evaluating potential investments. Our experienced research team analyzes value opportunities on an absolute basis, without regard to country, sector or industry. Our long term investment horizon allows us to steer clear of the emotion of day to day stock price movements and instead concentrate on enduring business fundamentals.
Another advantage at Harris is that our portfolios are focused to enable our best ideas to exert a meaningful effect on performance. Finally, we believe all of our clients deserve individual attention, and to that end, we strive to provide the highest quality of care while helping them pursue their investment objectives.
Portfolio Team
U.S. Concentrated Strategy Team
Tony Coniaris, CFA* Co Chairman, Portfolio Manager and U.S. Analyst
• 22 years investment experience
• Joined Harris in 1999 M. Colin Hudson, CFA* Portfolio Manager and U.S. Analyst

• 23 years investment experience
• Joined Harris in 2005
Robert F. Bierig* Portfolio Manager and U.S. Analyst
• 22 years investment experience
• Joined Harris in 2012
INVESTMENT TEAM
Adam D. Abbas, Portfolio Manager and Co-Head of Fixed Income (17) William C. Nygren, CFA*, CIO-U.S. Equities and Portfolio Manager (40)

Clyde S. McGregor, CFA*, Portfolio Manager (44)
Joseph P. Pitman, CFA, U.S. Analyst (17) Michael J. Mangan, CFA, CPA*, Partner and Portfolio Manager (33)
Thomas W. Delaney, CFA, Director and Portfolio Manager (13) Kevin G. Grant, CFA*, Co-Chairman, Portfolio Manager and U.S. Analyst (30)
Alex Fitch, CFA, Director of U.S. Research and U.S. Analyst (11) Tony Coniaris, CFA*, Co-Chairman and Portfolio Manager (22)

Marko Lazarevic, CFA, U.S. Analyst (11) Andrew M. Gluck, CFA, Senior Portfolio Manager (25)
John A. Sitarz, CFA, CPA, U.S. Analyst (9) M. Colin Hudson, CFA*, Portfolio Manager, Co-Head of Fixed Income and U.S. Analyst (23) Brian T. Bourn, CFA, U.S. Analyst (7) Robert F. Bierig*, Portfolio Manager and U.S. Analyst (22)
Mark C. Small, CFA, Portfolio Manager (5) Ben S. Nielson, U.S. Analyst (22)
Jeremy G. Thames, CFA, U.S. Analyst (5) Michael A. Nicolas, CFA*, Portfolio Manager and U.S. Analyst (18)
Liam M. McGarrity, U.S. Analyst (3)
Emily S. Neumark, Portfolio Manager (2)
Stock Selection Group
As of 10/26/2021; years of investment experience in parentheses
* Denotes partner
Asset Reconciliation & Cash Flow
Salvation Army Southern Territory
Investment Objective: Preservation of real (inflation adjusted) asset value plus a 5% annualized total rate of return, net of fees, before the impact of withdrawals. Exceed the rate of return of passive investments in market driven benchmarks, as specified, net of fees.
Portfolio Reconciliation
Since Inception Fiscal Year 1/25/2002 9/30/2020 through through 9/30/2021 9/30/2021
Beginning Assets 43,950,435 70,290,649 Net Contributions/Withdrawals (141,718,867) (24,144,596) Gain/Loss from Investment 177,070,185 33,155,700 Supervised Total 79,301,753 79,301,753
Cash Flows Exceeding $1 million- Since Inception
Contributions
12/19/2005 15,000,000.00 12/27/2005 4,025,782.25 1/15/2009 5,000,000.00
Withdrawals
2/6/2004 (4,000,000.00) 9/14/2009 (5,000,000.00) 9/10/2010 (11,000,000.00) 3/29/2010 (5,000,000.00) 4/1/2014 (20,000,000.00) 7/31/2014 (12,500,000.00) 8/26/2014 (18,045,694.16) 11/5/2015 (5,000,000.00) 12/28/2015 (10,000,000.00) 6/8/2016 (5,000,000.00) 9/9/2016 (17,000,000.00) 7/27/2017 (5,000,000.00) 8/14/2019 (10,000,000.00) 3/13/2020 (2,000,000.00) 7/23/2021 (23,650,000.00)
Performance Salvation Army Southern Territory
Performance (net of fees)
Time Period
Salvation Army S&P 500 Total Return Russell 1000 Value
01-25-02 to 09-30-02 -23.52% -27.27% -22.40% 09-30-02 to 09-30-03 35.81% 24.40% 24.37% 09-30-03 to 09-30-04 17.30% 13.87% 20.52% 09-30-04 to 09-30-05 12.41% 12.25% 16.69% 09-30-05 to 09-30-06 7.75% 10.79% 14.62% 09-30-06 to 09-30-07 19.90% 16.44% 14.45% 09-30-07 to 09-30-08 -22.43% -21.98% -23.56% 09-30-08 to 09-30-09 11.68% -6.91% -10.62% 09-30-09 to 09-30-10 11.05% 10.16% 8.90% 09-30-10 to 09-30-11 -2.75% 1.14% -1.89% 09-30-11 to 09-30-12 27.06% 30.20% 30.92% 09-30-12 to 09-30-13 29.66% 19.34% 22.30% 09-30-13 to 09-30-14 16.02% 19.73% 18.89% 09-30-14 to 09-30-15 -8.01% -0.61% -4.42% 09-30-15 to 09-30-16 14.36% 15.43% 16.20% 09-30-16 to 09-30-17 28.64% 18.61% 15.12% 09-30-17 to 09-30-18 8.31% 17.91% 9.45% 09-30-18 to 09-30-19 1.68% 4.25% 4.00% 09-30-19 to 09-30-20 9.98% 15.10% -5.01%
Year to Date
12-31-20 to 09-30-21 18.90% 15.92% 16.14%
1 Year 09-30-20 to 09-30-21 46.35% 30.00% 35.01%
3 Year Annualized 09-30-18 to 09-30-21 17.85% 15.99% 10.07%
5 Year Annualized 09-30-16 to 09-30-21 17.93% 16.90% 10.94%
Since Inception Annualized 01-25-02 to 09-30-21 10.85% 9.17% 8.08%
Top 10 Holdings
As of September 30, 2021

Top 10 Holdings
% of Equity
Alphabet Cl A 12.0
Keurig Dr Pepper 5.3 Fiserv 5.1
Meta Platforms Cl A 4.7
HCA Healthcare 4.7
Charter Communications Cl A 4.6
CBRE Group Cl A 4.0
Charles Schwab 3.9 American Intl Group 3.9 Booking Holdings 3.8 51.9
Fiscal Year 2021
• The trailing twelve months have been historically strong for equity markets, as unprecedented levels of fiscal and monetary stimulus fueled a strong recovery effort. We continue to find intriguing opportunities, but given current elevated market conditions, are paying particular attention to disciplined buy targets.
• Since September 2020, the S&P 500 returned 30% while the account has returned 51.30%. This performance compares favorably to the more stylistically comparable Russell 1000 Value, which returned 19.07%. The largest contributors to this outperformance have been Alphabet (+71.09% total return), CBRE (107.38%), HCA (96.24%) and Charles Schwab (103.56%).
• Following the largest underpricing of value relative to growth in history last year, we have since seen this gap compress as value begins to make up ground. However, by historical standards, value continues to remain underpriced and, as a result, we expect them to perform well moving forward.
Investment Philosophy
1.

Value
Purchase Trim Discount of
30% Add Final Sale For illustrative purposes only.
Intrinsic
Initial
at least
Three key tenets:
Buy
Invest
businesses at a significant discount to our estimate of intrinsic value 2. Invest in companies expected to grow per share value over time 3.
with management teams that think and act as owners
Value is a function of price and quality
This page intentionally left blank
K1 Investment Management, LLC (the “Firm’) November 2021

Firm Name: K1 Investment Management, LLC (the “Firm”)
Date: November 2021
FIRM SUMMARY
Inception Date: 2010
AUM: Approx. $8.393 billion as of 12/31/20
Number of Investment Professionals: 107 employees as of 9/30/2021
Significant Events:
Realization Events.
o Certent. K1 Private Investors, L.P. and K1 Private Investors (A), L.P. realized the full investment of $25.8 million in Certent in December 2020, representing an 3.0x Gross MoC, 18% Gross IRR.
o Granicus. K3 Private Investors, L.P. realized its investment of $49.1 million in Granicus in February 2021, representing an 4.9x MoC, 46% Gross IRR. The Fund rolled a portion of its proceeds as a part of the transaction and remains partially invested in the company.
o Clarizen. K3 Private Investors, L.P. realized its investment of $40.7 million in Clarizen in February 2021, representing an 4.7x MoC, 58% Gross IRR. The Fund rolled a portion of its proceeds as a part of the transaction and remains partially invested in the company.
Current Fund Status.
o K4 Private Investors, L.P. (“Fund IV”). As of September 30, 2021, Fund IV has completed 13 platform investments and 36 add on investments, amounting to $2.2 billion of committed capital and $1.5 billion of invested capital, representing approximately 109% committed and 75% invested, respectively, of its $2.0 billion total commitments.
o K5 Private Investors, L.P. (“Fund V”). As of September 30, 2021, Fund V has completed 12 platform investments and 3 add on investments, amounting to $2.2 billion of committed capital and $1.4 billion of invested capital, representing approximately 49% committed and 30% invested, respectively, of its $4.6 billion total commitments.
New Hires. Since the beginning of 2021, the Firm hired 34 new junior level employees to support its sourcing, diligence, execution, reporting, and operational functions.
TSA SOUTHERN TERRITORY COMMITMENTS

K4 Private Investors, L.P.
Inception Date of Commitment: 6/1/18
Level of Commitment: $30 million
K5 Private Investors, L.P.
Inception Date of Commitment: 4/22/20
Level of Commitment: $20 million
Firm Name: K1 Investment Management, LLC (the “Firm”)
Date: November 2021
FUND HIGHLIGHTS
K4 Private Investors, L.P. (Drafted performance as of September 30, 2021)
Feb-20 20,000,000$ 5,106,924$ $ 18,366,000$ 18,366,000$ 3.6x122%
Advyzon
Accessibe Feb-20 60,000,000 37,237,431 - 95,776,633 95,776,633 2.6x146%
Rethink (h) Jan-20 250,000,000 154,311,857 1,856,601 288,356,493 290,213,094 1.9x40%
AppLearn Aug-19 40,000,000 12,418,113 - 13,013,866 13,013,866 1.0x2%
Subsplash May-19 100,000,000 38,343,568 - 216,827,538 216,827,538 5.7x86%
Jebbit Mar-19 40,000,000 10,148,917 - 10,000,000 10,000,000 1.0x (1%)
Trackforce Feb-19 180,000,000 104,194,582 107,661,299 107,661,299 1.0x1%
Emburse Feb-19 365,000,000 354,543,893 871,672 550,462,045 551,333,717 1.6x21%
GoCanvas (i) Dec-18 175,000,000 118,254,731 907,104 145,587,830 146,494,934 1.2x7%
Digital Pharmacist Dec-18 175,000,000 112,328,342 - 115,356,304 115,356,304 1.0x1%
Jobvite (j) Nov-18 400,000,000 246,081,624 1,870,680 434,928,349 436,799,029 1.8x28%
Onit (k) Nov-18 200,000,000 197,169,766 - 415,323,674 415,323,674 2.1x37%
PerfectServe May-18 200,000,000 113,562,463 - 254,871,432 254,871,432 2.2x24%
Total 2,205,000,000$ 1,503,702,211$ 5,506,057$ 2,666,531,463$ 2,672,037,520$ 1.8x26%1.5x21%
Please refer to the separately provided quarterly letters for detailed footnote descriptions.
To date, the Fund has completed investments in the following companies: PerfectServe, Inc., Jobvite, Inc., Onit, Inc., Digital Pharmacist, Inc., Canvas Solutions, Inc., TRACKFORCE, Emburse, LLC, Jebbit, Inc., Subsplash, Inc , AppLearn International Limited, Rethink Autism, Inc., accessiBe LTD, and yHLsoft, Inc.
The first investment was in PerfectServe, Inc. (“PerfectServe”) in May 2018. The aggregate investment in PerfectServe is $113.6 million for 66.9% ownership of common equity.
Founded in 2000, PerfectServe is the provider of a clinical communication and coordination platform that connects physicians, nurses and other care team members across both inpatient and outpatient facilities. Its solution identifies the appropriate care team member depending on the clinical situation, allows users to communicate across a variety of communication device types and integrates with the facility’s PM/EMR platform to ensure records are correctly maintained, and ultimately allows facilities to decrease the time that is needed to achieve successful clinical outcomes. PerfectServe has over 3,600 customers, with notable customers including Mercy Health, St. John Providence Healthcare and Advocate Healthcare. Since the initial investment, PerfectServe has completed three add on acquisitions.
In November 2018, the Fund completed an investment in Jobvite, Inc. (“Jobvite”), which represents an aggregate investment of $246.1 million for 69.4% ownership of common equity.
Founded in 2006, Jobvite provides enterprise grade applicant tracking software (ATS) and additional solutions for recruitment marketing to encourage referrals as well as targeted campaigns, career website management and onboarding processes to streamline paperwork and compliance. Jobvite integrates with job board platforms, assessment and screening tools, scheduling platforms and human resource information systems. Jobvite serves over 1,600 customers including enterprise, mid market and SMB clients. Since the initial investment, Jobvite has completed seven add on acquisitions.
In November 2018, the Fund completed an investment in Onit, Inc. (“Onit”), which represents an aggregate investment of $197.2 million for 76.2% ownership of common equity.
Founded in 2007, Onit provides mission critical software applications to legal departments within large enterprises. Its enterprise legal management (ELM) platform offers solutions for spend and matter management, contract management and business process management. The ELM software helps to automate routine processes and to facilitate better
Gross Net Investment Capital Capital Realized Unrealized Total Multiple Gross Multiple Net Date Commitment Invested (a) Proceeds (b) Value (c) Value (d) of Cost (e) IRR (f,g) of Cost (h) IRR (i)
Firm Name: K1 Investment Management, LLC (the “Firm”)
Date: November 2021
collaboration across teams. Onit serves over 110 enterprise clients, including a growing number of Fortune 500 companies and over a thousand law firms. Since the initial investment, Onit has completed five add on acquisitions.
In December 2018, the Fund completed an investment in Digital Pharmacist, Inc. (“Digital Pharmacist”), which represents an aggregate investment of $112.3 million for 72.5% ownership of common equity.
Digital Pharmacist provides patient adherence and secure communication solutions targeted primarily toward independent pharmacies in the U.S. Its product suite includes HIPAA compliant, SEO- and mobile optimized websites, mobile applications and digital marketing tools that empower independent pharmacies and deliver significant time savings. Digital Pharmacist helps its customers engage with patients, drives adherence and integrates with over 60 prescription management systems, which allows for automated refill and reminder solutions. Digital Pharmacist serves over 4,000 pharmacies. Since the initial investment, Digital Pharmacist has completed two add on acquisitions.
In December 2018, the Fund completed an investment in Canvas Solutions, Inc. (“GoCanvas”), which represents an aggregate investment of $118.3 million investment for 72.7% ownership in common equity.
Founded in 2008, GoCanvas provides a no code form building platform that uses mobile and tablet interfaces to fill out forms or to collect other data. Its product allows businesses to streamline workflows and to disperse data across an organization in real time. The company's drag and drop solution is used across industries and use cases, including helping to facilitate paperless invoicing, creating damage and safety inspection reports and intaking medical applications. GoCanvas serves approximately 6,500 companies, with notable customers including PG&E, Verizon, Post Consumer Brands, Red Bull and Sprint. Since the initial investment, GoCanvas has completed two add on acquisitions.
In February 2019, the Fund completed an investment in TRACKFORCE (“Trackforce”), which represents an aggregate $104.2 million investment for 65.5% ownership in common equity.
Founded in 2000, Trackforce is a provider of a cloud based security workforce management platform that increases workforce accountability, improves operational efficiency and enables better communication between multiple stakeholders. The company has mobile and desktop products that offer a fully integrated security solution for guards to post orders, report incidents, log time and attendance, train and certify employees, process visitor registration, manage assets and more. Trackforce has over 400 customers that span airports, corporate facilities and security companies and include McKesson, Toronto Pearson Airport, the U.S. Embassy and the City of Dallas. Since the initial investment, Trackforce has completed four add on acquisitions.
In March 2019, the Fund completed an investment in Jebbit, Inc. (“Jebbit”), which represents an investment of $10.1 million for 20.0% ownership in preferred and common equity.
Founded in 2011, Jebbit is an enterprise ‘declared data’ capture platform that allows enterprise customers to capture consumer information at scale through a self service digital experience builder. As a result, marketing teams can deliver personalized campaigns to consumers. ‘Declared data’ is first party information that is willingly and explicitly shared by the consumer and is therefore timelier and more accurate than traditional third party data, resulting in higher conversion rates and ROI. Jebbit provides a system of record platform that stores captured consumer data and integrates with leading CRM and marketing automation platforms. Jebbit serves over 60 companies, with notable customers including Expedia, Proctor & Gamble, NFL (Atlanta Falcons and Buffalo Bills), NBA (Boston Celtics and Houston Rockets), Cathay Pacific, StubHub, and Monster.com.
In February 2019, the Fund completed an investment in Emburse, LLC (“Emburse”), which represents an aggregate investment of $354.5 million for 67.2% of preferred and common equity.
Founded in 2008, Emburse, is a leading provider of cloud based expense management, purchase order accounting, accounts payable management and time and attendance software for enterprise clients. The platform also provides online travel booking capabilities. The company’s multi tenant SaaS solutions allow companies to streamline the entry, reporting and approval process for employees and managers. Its solutions offer strong workflows, customization and deep
Firm Name: K1 Investment Management, LLC (the “Firm”)
Date: November 2021
integration with ERP, travel management, finance and accounting systems. The company has over 12,000 customers globally, with notable customers including Splunk, Smarsh, FitBit, SurveyMonkey, Check Point Software, Indeed and CrossFit. Since the initial investment, Emburse has completed 10 add on acquisitions.
In May 2019, the Fund completed an investment in Subsplash, Inc. (“Subsplash”), which represents an aggregate investment of $38.3 million for 54.9% ownership in preferred and common equity.
Founded in 2005, Subsplash is a provider of online and mobile products sold to churches, ministries and other for profit and non profit entities. The flagship offering is a subscription and custom configured mobile app featuring sermon delivery, digital bulletins and events. The platform also includes an integrated payment processing platform that enables users to easily and quickly setup donations via app, web and text. Subsplash’s customer base includes over 6,000 churches including megachurches such as Saddleback Church, North Point Community Church and New Life Church. Since the initial investment, Subsplash has completed four add on acquisitions.
In August 2019, the Fund completed and investment in AppLearn International Limited (“AppLearn”), which represents an aggregate investment of $12.4 million for 30.7% ownership in preferred and common equity.
Founded in 2016, AppLearn is a leading mission critical digital adoption platform that helps enterprises drive high user adoption of enterprise software applications, including Workday, SAP SuccessFactors, Cornerstone and Salesforce. Its key product, ADOPT, uses product usage data as well as support tickets to identify application workflows that are causing user drop off. Once identified, enterprises can use its various learning modules (split screen, splash pages and trails) to drive adoption and engagement. Split screen allows enterprises to link training materials (PDFs, videos, etc.) to a page or workflow, splash pages allow the creation of a pop up page that must be interacted with prior to exiting out and trails is a walkthrough product. ADOPT optimizes high user adoption, reduces cost and increases productivity. The company serves more than 34 clients including Toyota, AMEX, Prudential, UPS, Chanel and Rolls Royce.
In January 2020, the Fund completed an investment in Rethink Autism, Inc. (“Rethink”), which represents an aggregate investment of $154.3 million for 67.2% ownership in common equity.
Founded in 2007, Rethink provides a behavioral health and developmental disabilities platform sold to enterprises, school districts and behavioral health clinicians. Rethink’s solutions include a content library of 1,500+ internally developed exercises that are used to train employees, parents, staff and therapists about how to best treat children with autism and other behavioral health issues. Additionally, Rethink has developed its own practice management platform that is sold to clinicians as a bundled offering with the core platform. The videos provide best practices on Applied Behavioral Analysis methods which are utilized to improve the social, communication, reading and academic skills of caregivers and clients. The company serves more than 700 clients including Amazon, Facebook, Microsoft, Salesforce and Starbucks. Since the initial investment, Rethink has completed five add on acquisitions.
In February 2020, the Fund completed an investment in accessiBe LTD (“accessiBe”), which represents an aggregate investment of $37.2 million for 36.8% ownership in preferred and common equity.
Founded in 2017, accessiBe provides a web accessibility product that automates compliance standards (e.g., ADA & WCAG 2.1) for its customers and agency partners. The product transforms web accessibility by replacing a costly, manual process with automated, state of the art AI technology. Its technology seamlessly makes web content and websites accessible for people with disabilities, who represent approximately 20% of the population. accessiBe’s solutions are available for those with motor impairment, vision impairment, cognitive disorders, epilepsy and other disabilities. The company serves over 10,000 websites across more than 4,700 clients including Hilton, BMW, Belkin, Louisiana Department of Health, Wilson Sonsini, Rag & Bone and SEIKO.
Firm Name: K1 Investment Management, LLC (the “Firm”)
Date: November 2021
In February 2020, the Fund completed an investment in yHLsoft, Inc. (“Advyzon”), which represents an aggregate investment of $5.1 million for 11.1% ownership in preferred and common equity.
Founded in 2012, Advyzon is an all-in-one practice management solution for registered investment advisors (“RIAs”). The platform includes modules in portfolio management (portfolio accounting, portfolio reporting, analytics), CRM, billing and client communications. By housing both client and portfolio data in one location, Advyzon is able to drive cost savings through the elimination of multiple technology licenses as well as manual reconciliations between systems (e.g. per management billing is simplified to minutes versus hours / days). The company serves more than 670 RIAs.
K5 Private Investors, L.P. (Drafted performance as of September 30, 2021)
Routeware
Sep-21 350,000,000$ 227,842,577$ $ 227,842,577$ 227,842,577$ 1.0x NM
HR Acuity Sep-21 100,000,000 47,308,976 - 47,308,976 47,308,976 1.0x NM
Logicbroker Sep-21 200,000,000 137,195,401 137,195,401 137,195,401 1.0x NM
Irwin Aug-21 40,000,000 19,739,747 - 19,739,747 19,739,747 1.0x NM
ComplySci (h) Jun-21 225,000,000 117,600,937 - 117,600,937 117,600,937 1.0x NM
Eltropy Apr-21 50,000,000 21,306,501 - 21,306,501 21,306,501 1.0x NM
SimPRO (i) Jan-21 400,000,000 278,724,976 202,845 278,724,976 278,927,821 1.0x NM
XTM International (j) Jan-21 100,000,000 64,476,996 64,476,996 64,476,996 1.0x NM
Reveal Brainspace (k) Jan-21 300,000,000 217,199,213 - 217,199,213 217,199,213 1.0x NM
Panopto (l) Dec-20 350,000,000 204,485,159 231,694 204,485,159 204,716,853 1.0x NM
Atera Aug-20 50,000,000 37,658,043 - 102,437,341 102,437,341 2.7x213%
TechnoMile Apr-20 50,000,000 10,253,617 - 31,915,086 31,915,086 3.1x118%
Total 2,215,000,000$ 1,383,792,143$ 434,539$ 1,470,232,910$ 1,470,667,449$ 1.1x14% NM NM
Please refer to the separately provided quarterly letters for detailed footnote descriptions.
To date, the Fund has completed investments in the following companies: TechnoMile LLC, Atera Networks Ltd., Panopto, Inc., Reveal Data Corporation, XTM International, simPRO Software, Eltropy, Inc., Compliance Science, Inc, Platform Group Limited DBA Irwin, Logicbroker, Inc., HR Acuity, LLC, and Routeware LLC
In April 2020, the Fund completed an investment in TechnoMile LLC (“TechnoMile”), which represents an aggregate investment of $10.3 million for 28.6% ownership in preferred and common equity.
Founded in 2010, TechnoMile is a leading provider of mission critical governance, risk, compliance and operational software. Its platform enables government contractors to qualify, win, service and manage new business by improving industry awareness and data governance. Its product suite includes three main modules: Growth, FedCLM and FedPM. Its Growth product delivers software to automate workflows for managing contract opportunity pipelines and sales operations tasks. Its FedCLM product offers contract lifecycle management solutions such as milestone tracking, approval automation and subcontractor management. Its FedPM product offers a project management solution that is compliant with required government reporting standards. The company serves over 75 customers primarily within the government, aerospace and defense sectors, as well as in the architecture, engineering, construction and professional services sectors. Notable customers include: BAE Systems, Bell Textron, Leidos Holdings, AECOM, GDIT, Johnson Controls and Unisys.
In August 2020, the Fund completed an investment in Atera Networks Ltd. (“Atera”), which represents an aggregate investment of $37.7 million for 20.9% ownership in preferred equity.
Founded in 2011, Atera is a leading provider of mission critical remote IT monitoring and management software (“RMM”). Its technology provides managed service providers (“MSPs”) and IT professionals with an all-in-one solution for managing devices and networks remotely and allows for more controlled and efficient IT operations. Atera integrates core IT responsibilities into a unified dashboard that provides visibility of connected endpoints, activities and network performance to ensure remotely connected assets are standardized and perform optimally. The platform supplies wide ranging tools including custom scripting, patch management, remote access and support, contract and service level
Gross Net Investment Capital Capital Realized Unrealized Total Multiple Gross Multiple Net Date Commitment Invested (a) Proceeds (b) Value (c) Value (d) of Cost (e) IRR (f,g) of Cost (h) IRR (i)
Firm Name: K1 Investment Management, LLC (the “Firm”)
Date: November 2021
agreement management, invoicing and billing, real time alerts and network discovery. The company serves over 4,500 SMB and middle market businesses, primarily representing MSPs and internal IT teams.
In December 2021, the Fund completed an investment in Panopto, Inc. (“Panopto”), which represents an aggregate investment of $204.5 million for 83.9% ownership in preferred and common equity.
Founded in 2007, TechnoMile is a leading provider of mission critical enterprise video content management software. Its platform allows educational institutions and enterprise customers to centralize video assets into a single, secure, searchable system and allows users to record and capture videos from multiple sources. The company serves over 1,500 customers, including 22 of the top 25 global universities and Fortune 100 companies across various industries. Notable customers include: Nike, Google, General Electric, T Mobile, University of Pennsylvania, Columbia University and Harvard University. Since the initial investment, Panopto has completed one add on acquisition.
In January 2021, the Fund completed an investment in Reveal Data Corporation ("Reveal") and Brainspace Data Corporation ("Brainspace"), which represents an aggregate investment of $217.2 million for 85.7% ownership in preferred and common equity.
Founded in 2008, Reveal Brainspace is the leading provider of end to end eDiscovery software platform. The company’s solutions include data analytics powered by Artificial Intelligence (“AI”) and machine learning technology as well as document review capabilities. The combined solution leverages Brainspace’s powerful interactive data visualization tools and Reveal’s advanced review technology to quickly surface actionable insights for its customers. The company serves more than 150 clients including Epiq, Lighthouse, Deloitte, KPMG, PwC, AlixPartners, K&E, DLA, Exxon, Dell, Lockheed and Freddie Mac.
In January 2021, the Fund completed an investment in XTM International (“XTM”), which represents an aggregate investment of $64.5 million for 67.4% ownership in preferred and common equity.
Founded in 2002, XTM is a leading provider of mission critical translation management software. Its platform enables companies to localize their content and automate the translation process. XTM International integrates with various content repositories to make the localization process more efficient, while also acting as a system of record for previously translated materials. The company serves over 150 customers, primarily enterprise businesses and language service providers. Notable customers include: Expedia, SAP, Cisco, IKEA, Caterpillar, Nestle, Toyota, Adidas and Twitter. Since the initial investment, XTM has completed one add on acquisition.
In January 2021, the Fund completed an investment in simPRO Software ("simPRO"), which represents an aggregate investment of $278.7 million for 52.0% ownership in preferred and common equity.
Founded in 2002, simPRO is a leading provider of mission critical field service management software designed for trade and service industry businesses such as plumbing, electrical and HVAC. The company’s web and mobile solutions allow businesses to manage complex, multi stage projects, reduce reliance on paper processes and easily manage relationships with customers, employees and contractors. The platform offers a wide range of capabilities including scheduling, payment processing and inventory management to create an end to end platform. The company serves over 8,500 customers globally across different industry verticals such as electrical, HVAC, plumbing, security, maintenance services, fire, construction and solar.
In April 2021, the Fund completed an investment in Eltropy, Inc. ("Eltropy"), which represents an aggregate investment of $21.3 million for 22.9% ownership in preferred and common equity.
Founded in 2013, Eltropy provides a messaging platform that enables financial institutions (Credit Unions, Banks, etc.) to communicate with customers and drive key processes. The platform features tools that accelerate processes around underwriting, payments, marketing, support requests and business development, allowing these processes to occur virtually. Additionally, the platform allows organizations to track and stay compliant with consumer’s messaging preferences while increasing speed and lowering costs. The company serves more than 150 customers. Notable customers include: Redstone Federal Credit Union, California Credit Union and Max Credit Union.
Firm Name: K1 Investment Management, LLC (the “Firm”)
Date: November 2021
In June 2021, the Fund completed an investment in Compliance Science, Inc ("ComplySci"), which represents an aggregate investment of $117.6 million for 58.9% ownership in preferred and common equity.
Founded in 2003, ComplySci is a leading provider of regulatory compliance solutions sold to mid market and enterprise financial institutions. Its solutions are focused on compliance processes related to core business functions such as licensing and registration, compliance management, regulatory change management and policy governance to help clients maintain compliance with financial services regulators. The company serves over 1,300 customers. Notable customers include: Jeffries, KKR, Brookfield Asset Management, Carlyle Group, New York Life and Bridgewater Capital.
In August 2021, the Fund completed an investment in Platform Group Limited DBA Irwin ("Irwin"), which represents an aggregate investment of $19.7 million for 30.3% ownership in preferred and common equity.
Founded in 2017, Irwin is a leading provider of mission critical investor relations software primarily sold to public companies and investor relation consultancies. The solution allows customers to find new investors, understand their shareholder base, manage current investor relationships, communicate with investors, and track the output of their IR initiatives with an end to end software platform that includes a CRM. The company serves over 300 customers. Notable customers include: Banc of California, Tabula Rasa, Deloitte, Constellation Software.
In September 2021, the Fund completed an investment in Logicbroker, Inc. ("Logicbroker"), which represents an aggregate investment of $137.2 million for 75.8% ownership in preferred and common equity.
Founded in 2010, Logicbroker is a leading provider of supply chain automation software for retailers and suppliers to help them run their eCommerce businesses, primarily focusing on drop shipping. The platform connects supply chain constituents through various methods (API, EDI, FTP, native connectors) to exchange key transaction information, such as inventory, shipmentand billing, to enable order fulfillment. The company serves over 220 customers. Notable customers include: Kroger, Rite Aid, Walgreens, Coca Cola and Samsung.
In September 2021, the Fund completed an investment in HR Acuity, LLC ("HR Acuity"), which represents an aggregate investment of $47.3 million for 25.1% ownership in preferred and common equity.
Founded in 2010, HR Acuity is a leading provider of system of record employee relations management software to manage internal employee matters in accordance with HR, legal, and compliance best practices. The company enables customers to proactively reduce risk and handle workplace issues consistently while improving the employee experience. Its platform includes workflow automation, investigation and case management, benchmarking, and business intelligence to help mitigate employee related risk. The company serves over 200 customers. Notable customers include: ADP, Bloomberg, MasterCard, LinkedIn, Lyft, KPMG and Workday.
In September 2021, the Fund completed an investment in Routeware LLC ("Routeware"), which represents an aggregate investment of $227.8 million for 71.9% ownership in preferred and common equity.
Founded in 1999, Routeware is a leading provider of waste management software for private haulers and municipalities. The solution allows customers to manage truck dispatching, route optimization, billing, and provides constituent engagement including scheduling of pick ups and payments. The company serves over 950 customers, primarily municipalities and private waste haulers. Notable customers include: Pride Disposal Company, City of San Diego and City of Tampa.
Firm Name: K1 Investment Management, LLC (the “Firm”)
Date: November 2021
INVESTMENT OBJECTIVE & PROCESS
K1 was established in 2010 as a values driven firm, with a focus on passion, persistence, humility and excellence and an investment strategy focused on sector, sourcing and operations (“SSO”). K1’s senior management team consists of Hasan Askari, Taylor Beaupain, Ronald E. Cano II, R. Neil Malik, George Mansour III and Michael Velcich (the “Principals”)
K1 believes the Fund represents a compelling and differentiated investment opportunity based on the following factors:
Cohesive and Experienced Team
The Principals have complementary skills and are supported by a team divided into functional specialties across: (i) sourcing; (ii) execution; (iii) diligence; (iv) reporting; and (v) operations. K1 has built dedicated teams focused on these activities to allow each Principal and team member to focus on his or her strengths and contribute to the investment process within his or her area of expertise.
Enterprise Software Sector Focus
Since inception, K1 has focused on investing in enterprise software companies and invests across a diverse set of sub industries in the software and related technology sector. K1 believes that the market opportunity in enterprise software is driven by compelling trends related to advances in computing power, enterprise adoption of Software as-a-Service (“SaaS”) applications and the resulting productivity gains derived from the automation of manual processes.
Lower Middle Market Investing
K1 believes that investing in software companies in the lower middle market offers the potential for greater returns relative to investing in larger companies, where more competition may exist. K1 believes that smaller companies are particularly underserved and can face acute capital constraints. Within this space, K1 focuses on directly sourced opportunities that fit a set of strict criteria which it believes are typical of the strongest investment opportunities, i.e.: mission critical applications, systems of record, substantial recurring revenue, high customer retention and a diversified customer base. Additionally, given the fragmented nature of the sector (especially at the lower end of the market that K1 is targeting), K1 believes there exists meaningful opportunity for consolidation. Since K1’s inception, the Principals believe they have built a substantial pipeline of proprietary prospects that represent significant investment opportunities in the software and related technology sector.
This page intentionally left blank
Meeting November 2021
1
The Salvation Army - Southern Territory Board of Trustee Portfolio Review
Firm Name
Firm Summary
Inception Date
Kohlberg Kravis Roberts & Co. L.P. (“KKR”) 1976
* As of September 30, 2021
AUM*
# of Inv. Prof.*
$459 billion 600+
Established in 1976, Kohlberg Kravis Roberts & Co. L.P. (“KKR”) is a leading global investment firm with industry-leading investment experience, in-depth industry knowledge, sophisticated processes for growing and improving businesses, and a strong culture committed to teamwork.
The Firm has over 1,800 employees and KKR Capstone has over 85 executives. There are over 440 private market investment professionals and approximately 160 public market investment professionals. We conduct our business through our offices in 21 cities on four continents. Our geographic breadth provides us with a preeminent global platform for sourcing transactions, raising capital, and carrying out capital markets activities.
KKR has offices in New York, San Francisco, Menlo Park, Houston, Hong Kong, Tokyo, Beijing, Paris, London, Stockholm, Dublin, Madrid, Luxembourg City, Frankfurt, Sydney, Shanghai, Singapore, Mumbai, Dubai, Riyadh and Seoul. KKR operates through three primary business lines: Private Markets, Public Markets and Capital Markets. KKR’s primary business lines are augmented by operational consultants, experienced advisors, public affairs executives, capital raising executives and macro research professionals.
KKR Business Platform
As of September 30, 2021. Numbers may not sum due to rounding. (1) Private Equity AUM includes Growth Equity, Core Equity, and other co investment vehicles and other structured vehicles & products, some of which may invest across other asset classes. (2) KKR's pro rata portion of the AUM of strategic partners in which KKR holds a minority ownership interest (Marshall Wace, PAAMCO Prisma, Blackgold and iCapital).
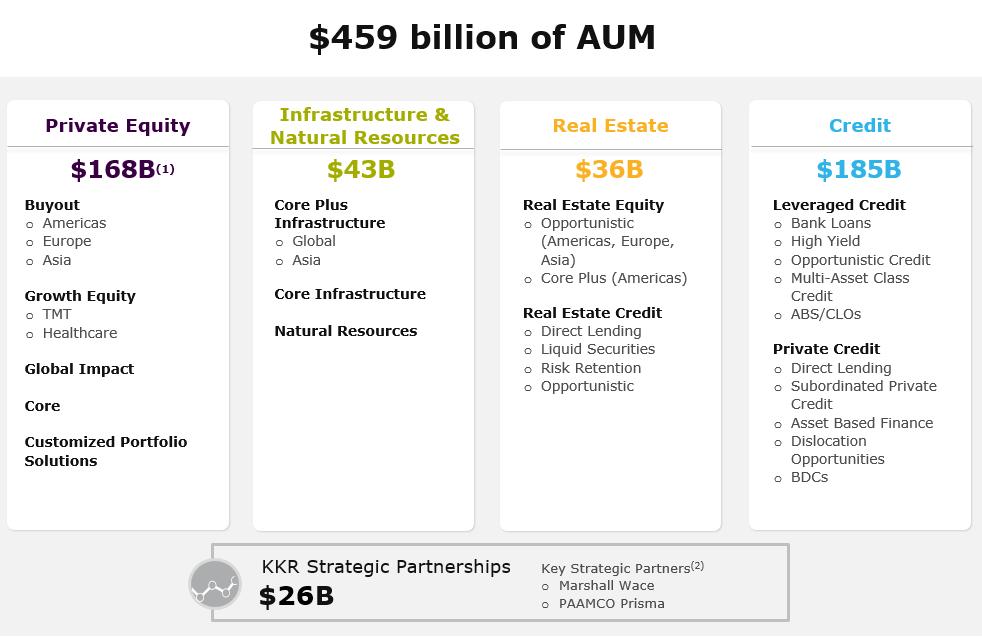
Confidential
Private Markets
As of September 30, 2021, KKR has a total of over $247 billion in private markets assets under management.
The Private Equity team prospects for, evaluates, and executes investments on behalf of our private equity funds. Globally, the Firm employs approximately 250 private equity investment professionals who are regionally focused and aligned by industry sector. As of September 30, 2021, KKR has a total of over $168 billion in private equity assets under management 1, managed across North America, Asia, and Europe regional funds and separately managed accounts.
Our Energy Real Assets team is focused on identifying, evaluating and executing real asset investment opportunities in the North American upstream oil and gas industry. As of September 30, 2021, KKR team manages approximately $3.5 billion in energy real assets and is comprised of 12 investment professionals, supported by additional technical and financial energy professionals. The team is led by David Rockecharlie, Head of Energy Real Assets.
Our Infrastructure team is focused on identifying, evaluating and executing opportunities in infrastructure assets with limited commercial, financial, and operating risk. The team manages approximately $40 billion in infrastructure assets and is comprised of over 60 investment professionals. The Infrastructure team is currently managed by Raj Agrawal.
Our Real Estate team focuses on identifying, evaluating and executing opportunities including property level equity, debt and special situations transactions and businesses with significant real estate holdings that can benefit from KKR’s operational expertise. The team manages over $36 billion in real estate assets and is comprised of approximately 120 investment professionals. The Real Estate team is led by Ralph Rosenberg.
Public Markets:
As of September 30, 2021, KKR has a total of over $211 billion in public markets assets under management.
KKR Credit
KKR’s public markets business (“KKR Public Markets”) is established under KKR Credit. KKR Credit is comprised of approximately 160 dedicated investment professionals globally. KKR Credit invests across the corporate credit spectrum, including in leveraged credit strategies, such as syndicated bank loans and high yield bonds, and alternative credit strategies such as direct lending, private opportunistic credit, strategic investments and revolving credit. KKR Credit manages a number of investment funds, structured finance vehicles and separately managed accounts. As of September 30, 2021, KKR Credit had approximately $185 billion of assets under management. Scott Nuttall, Co Chief Executive Officer of KKR, and Todd Builione, President of KKR Credit and Capital Markets, provide management oversight of KKR Public Markets. The Fund will be managed within KKR Credit.
Capital Markets:
KKR Capital Markets (“KCM”) was developed to provide KKR with a capital markets oriented perspective on our deal financings and portfolio company capital structure management, as well as to give the Firm the ability to draw on creative and differentiated capital sources. KCM’s over 65 professionals globally add value by providing insight and direct access to financing sources that helps us improve the capital structures of our portfolio companies. In particular, the KCM team has been involved in developing and executing KKR’s portfolio company refinancing strategy. Since 2009 and as of September 30, 2021, our team has helped KKR portfolio companies from around the world refinance over $420 billion of debt. KCM is led and managed by Adam Smith.
1 Private Equity AUM includes Growth Equity, Core Equity, Impact and other co investment vehicles and other structured vehicles & products, some of which may invest across other asset classes. Please refer to “Important Information” regarding the calculation of AUM.
Confidential
2021 Updates:
Affiliated Companies and Joint Ventures/Strategic Partnerships
Please refer to KKR’s 10-K and 10-Q for a list of KKR subsidiaries, which can be accessed via the following link: https://ir.kkr.com/sec filings annual letters/sec filings/
On February 1, 2021, KKR & Co. Inc. (NYSE: KKR) and Global Atlantic Financial Group Limited (“Global Atlantic”) announced the closing of their previously announced strategic transaction, whereby KKR agreed to acquire Global Atlantic. Global Atlantic is one of the largest fixed rate and fixed indexed annuity providers in the United States, offering annuities for individuals through a network of banks, broker dealers, and insurance agencies as well as life insurance for individuals and corporates. Global Atlantic is also a leader in the institutional channel, providing customized reinsurance solutions to its life and annuity company clients. Global Atlantic will continue to operate as a separate business with its existing brands and management team, and Global Atlantic will continue to be run by its existing senior leadership team led by Allan Levine, Global Atlantic’s Chairman and Chief Executive Officer.
Succession Plans
Henry Kravis and George Roberts are both extremely committed to continuing in their leadership roles at the Firm.
At the same time, we recognize the need to plan for contingencies and also to continue the institutionalization of KKR. To that end, over the past several years, Henry Kravis and George Roberts have formally delegated leadership responsibilities for our businesses to senior key executives.
On October 11, 2021, KKR announced that Joe Bae and Scott Nuttall have been appointed Co Chief Executive Officers, and Co Founders Henry Kravis and George Roberts will remain actively involved as Co Executive Chairmen of KKR’s Board of Directors. The leadership transition is effective immediately.
Co-founded in 1976 by first cousins George Roberts and Henry Kravis together with Jerome Kohlberg, KKR has evolved from a U.S. focused private equity firm to a global financial services enterprise that invests across many alternative asset classes in addition to private equity, including leveraged and alternative credit, infrastructure, real estate, growth equity, impact, core, and energy. The firm also has a capital markets business, a retirement and life insurance business through Global Atlantic, and hedge fund partnerships, including with Marshall Wace.
Joe Bae and Scott Nuttall are the firm’s second pair of Co Chief Executive Officers. Mr. Bae and Mr. Nuttall both joined KKR in 1996 and have served as Co Presidents and Co Chief Operating Officers of KKR since July 2017.
The Investment Committees, Portfolio Management Committees, Investment Heads Committee, Distribution Heads Committee, and Risk and Operations Committee ensure broad participation in the management of our funds and the Firm's business, and formalize our long held culture of consensus decision making.
Confidential
KKR Private Equity Fund Performance
Please refer to the table below for KKR’s Overall Private Equity Composite Returns vs. Market Indices from inception to September 30, 2021.
30.00%
25.00%
20.00%
15.00%
10.00%
5.00%
0.00%
Returns 25.61% 18.92% 12.02% 11.75% 13.59% 13.86%
Note: Past performance is no guarantee of future results. See Important Information for how our performance is calculated and details regarding indices presented as benchmarks. The KKR gross IRR, net IRR, and market indices are calculated based on our first 19 private equity funds which represent all of our private equity funds that have invested for at least 24 months prior to September 30, 2021. Date of inception is April 7, 1977. For index analysis, assumes reinvestment of dividends.
Confidential
Composite Gross
KKR PE Composite Net
S&P 500
3000 Overpeformance
Overpeformance to
KKR PE
IRR
IRR
Russell
to S&P
Russell
Net Performance vs. Benchmark
The following reports the net fund return information through September 30, 2021 for each of the funds in which The Salvation Army Southern Territory is invested in and the compounded annual returns for the relevant indices: S&P 500 Index, MSCI Europe Index, and the MSCI Asia Pacific Index over the same periods, determined on a comparable basis. The commencement of the Investment Period of the 2006 Fund, European Fund, European Fund II, European Fund III, E2 Annex Fund, Global Infrastructure Investors Fund, Asian Fund II, Asian Fund III, Global Infra III, Asian Fund IV and Global Infra IV are September 2006, October 1999, November 2005, March 2008, August 2009, June 2012, October 2013, and August 2017, July 2018, February 2021, and August 2021 respectively.
50.00%
40.00%
30.00%
20.00%
10.00%
0.00%
-10.00%
-20.00%
2006 European Fund European Fund II European Fund III E2 Annex Fund Global Infra Asian Fund II Asian Fund III Global Infra III Asian Fund IV Global Infra IV
Net Return 9.16% 23.07% 4.77% 11.59% -2.87% 18.16% 9.41% 42.96% 5.67% 8.11% 0.00% Index Return 8.44% 13.76% 2.16% 6.41% 7.47% 6.08% 8.49% 11.75% 7.22% -8.99% 0.00%
Net Return Index Return
Note: Past performance is no guarantee of future results. See “Important Information” for how our performance is calculated and details regarding indices presented as benchmarks.
(1) Index Key: 2006 Fund (S&P 500), European Funds (MSCI Europe Index), Asian Fund II (MSCI Asia Pacific Index). Index returns include dividends. No benchmark given for Global Infrastructure Investors, given lack of comparable benchmark for the infrastructure asset class.
Confidential
KKR Cumulative Fund Net Performance for The Salvation Army Southern Territory vs. S&P 500 Total Return Index
The chart below represents the performance since inception of The Salvation Army Southern Territory’s equity investments in KKR’s Private Markets funds, comprising KKR’s European Fund, European Fund II, 2006 Fund, European Fund III, E2 Annex Fund, KKR Global Infrastructure Investors L.P., Asian Fund II and Asian Fund III.
Note: Past performance is no guarantee of future results. See “Important Information” for how our performance is calculated and details regarding indices presented as benchmarks
KKR Private Equity Investment Objective
• Our investment approach is focused on acquiring attractive business franchises and working closely with management over the long-term to design and implement value creating strategies.
• KKR is notable for its long term track record of investing large pools of capital and for generating attractive returns and large multiples of invested capital.
KKR Infrastructure Investment Objective
• Target infrastructure assets with limited commercial, financial and operating risk and drive value creation through operational engagement and stakeholder management.
• KKR has made a number of notable infrastructure investments historically, typically in first mover and highly complex situations. The Global Infrastructure fund is thus a logical extension of our investing experience, and reflects our desire to pursue infrastructure opportunities more systematically with a dedicated pool of capital.
Prior Fund Details (as of September 30, 2021)
Confidential
Fund Capital Committed Vintage(6) Fund Cycle Strategy Geographic Focus Gross Multiple Net Multiple Gross IRR Net IRR European Fund $3,085 1999 Completed Buyout Europe 2.8 2.3 26.9% 20.2% European Fund II $5,751 2005 Harvesting Buyout Europe 1.5 1.3 6.1% 4.5% 2006 Fund $17,642 2006 Harvesting Buyout North America 2.1 1.8 12.0% 9.4% European Fund III(1)(2) $5,562 2008 Harvesting Buyout Europe 2.0 1.7 16.6% 11.5% E2 Investors Annex(1)(3) $196 2009 Completed Buyout Europe 1.0 1.0 0.6% 0.5% Global Infra $1,045 2011 Harvesting Infrastructure OECD 2.1 1.9 17.6% 15.6% Asian Fund II(4) $5,825 2013 Harvesting Buyout Asia 1.6 1.4 12.8% 9.4% Asian Fund III(5) $9,000 2017 Actively Investing Buyout Asia 2.3 2.0 53.0% 42.5% Global Infra III $7,270 2018 Actively Investing Infrastructure OECD 1.1 1.1 9.2% 6.0% Asian Fund IV(7) $14,735 2020 Actively Investing Buyout Asia 1.1 1.0 63.3% 13.6% Global Infra IV(8) $12,606 2021 Actively Investing Infrastructure OECD N/A N/A N/A N/A 0.00% 2.00% 4.00% 6.00% 8.00% 10.00% 12.00% 14.00% 16.00% S&P 500 All Funds
(1) Capital Committed is current actual commitment adjusted for F/X (Total original commitment plus Foreign Exchange Adjustment).
(2) Incorporates reduction in original commitment size which was rolled over to E2 Investors.
(3) European Fund III size net of release of unused commitment.
(4) Excluding recycled capital, the invested amount for Asian Fund II is $5,203mm.
(5) For Asian Fund III, capital committed, invested amount, realized value and unrealized value represent consolidated amounts from Asian Fund III and Asian Fund III (EEA). Performance represents performance from Asian Fund III.
(6) Vintage year signifies the year of first investment.
(7) Asian Fund IV is expected to have a final close in Q4 2020 to Q1 2021
(8) Global Infra IV has not yet had its final close. MOIC and IRR for Global Infrastructure Investors IV is not material ("N/M") as the fund has less than one year of activity
KKR
KKR E2 Investors L.P. $898,029 $0 $818,304 $818,304 $0 ($79,725)
KKR Global Infrastructure Investors L.P. $14,990,893 $0 $31,631,988 $31,616,202 $15,786 $16,641,095
KKR Asian Fund II L.P. $11,734,835 $6,782,560 $17,207,925 $9,254,330 $7,953,595 $5,473,090
KKR Asian Fund III L.P. $11,653,312 $10,856,656 $24,096,346 $2,625,915 $21,470,431 $12,443,034
KKR Global Infrastructure Investors III L.P. $8,550,307 $8,317,629 $9,736,281 $746,076 $8,990,205 $1,185,974
KKR Asian Fund IV SCSp $2,858,736 $2,847,634 $2,915,056 $0 $2,915,056 $56,320
KKR Global Infrastructure Investors IV (USD) SCSp $0 $0 ($102,718) $0 ($102,718) ($102,718) IRISID:632 US Dollar Total $107,316,144 $32,410,168 $196,421,600 $151,909,189 $44,512,411 $89,105,456
Remaining
European Fund $15.00 $0.00
European Fund II $15.00 $0.00 2006 Fund $15.00 $0.25
European Fund III $12.30 $0.43 E2 Investors ("Annex") $1.00 $0.00
Global Infrastructure Investors $15.00 $0.53 Asian Fund II $10.00 $0.05 Asian Fund III(1) $15.00 $3.97
Global Infrastructure Investors III(2) $15.00 $6.98 Asian Fund IV(3) $20.00 $17.14
Global Infrastructure Investors IV(4) $25.00 $25.00
(1)Adjusted Unused Capital Commitment, which is adjusted for the outstanding line of credit balance is $2.41mm (2)Adjusted Unused Capital Commitment, which is adjusted for the outstanding line of credit balance is $1.15mm (3)Adjusted Unused Capital Commitment, which is adjusted for the outstanding line of credit balance is $0.77mm (4)Adjusted Unused Capital Commitment, which is adjusted for the outstanding line of credit balance is $22.04mm Cash Inflows
Confidential
Investment Portfolio Summary By Company Equity Investments for The Salvation Army - A Georgia Corporation As of 9/30/2021 Investment Name Amount Invested Remaining Cost Current Valuation Amount Realized Amount Unrealized Current Net Gain/Loss US Dollar IRISID:632 KKR European Fund I, Limited Partnership $15,000,000 $0 $38,691,410 $38,691,410 $0 $23,691,410 KKR European Fund II, Limited Partnership $15,000,000 $247,400 $21,244,788 $21,137,859 $106,929 $6,244,788
Portfolio Summary
$14,752,360
KKR 2006 Fund L.P.
$1,769,779 $28,563,564 $25,938,485 $2,625,079 $13,811,204
Limited Partnership
European Fund III,
$11,877,672 $1,588,510 $21,618,656 $21,080,608 $538,048 $9,740,984
Commitment
Committed ($MM) Unused Capital Commitment ($MM)
Summary Fund Capital
and Outflows (as of September 30, 2021)
Please refer to Attachment I for The Salvation Army Southern Territory cash flows in Excel format.
Key Factors Influencing Performance
North American Summary
In our North American private equity business, we generally focus our efforts on seeking opportunities to invest substantial capital to acquire a controlling ownership stake in leading companies which we believe to have strong business franchises, attractive growth prospects, defensible market positions, and the ability to generate attractive returns.
As of September 30, 2021, our KKR North America PE Funds returned a cumulative Gross IRR of 25.8% (Net IRR of 19.3%) and a Gross MOIC of 2.5x (Net MOIC of 2.1x).
• KKR’s North American private equity funds have returned approximately $51.1 billion since January 2013 with approximately $4.7 billion distributed in 2013, $3.7 billion distributed in 2014, $7.1 billion distributed in 2015, $6.3 billion distributed in 2016, $6.6 billion distributed in 2017, $6.3 billion distributed in 2018, and $3.1 billion distributed in 2019, and $4.6 billion distributed in 2020 and $8.7 billion distributed YTD in 2021 as of September 30, 2021.
• The KKR deal pipeline [1] in North America remains strong with a number of actionable opportunities in various stages of progress, and we are seeing attractive opportunities, including:
o Corporate divestitures
o Large, family owned companies
o Structured minority investments with significant influence/governance
o Build up opportunities
o Opportunistic public toe hold investments
o Market dislocations
• We feel we are well positioned to capitalize on the current market environment.
Note: Unless indicated, the above reflects current market views, opinions and expectations of KKR based on its historic experience and proprietary research. Historic market trends are not reliable indicators of actual future market behavior or future performance of any particular investment which may differ materially, and should not be relied upon as such. There can be no assurance that investors in any account, or fund or other vehicle will receive a return of capital. All Americas private equity investment returns presented are net of transaction costs and performance fees, but gross of management fees. Management fees are imposed at the fund or account level, and have not been allocated to each individual investment for purposes of this presentation. After payment of management fees at the fund or account level, the actual return to investors with respect to these investments was less than indicated above.
European Summary
We believe that Europe continues to represent a solid and attractive platform for private equity investing. In spite of headwinds at the macro economic level from the COVID 19 crisis, our European portfolio has so far proved very resilient. We have also been highly active in deploying capital year todate, as we believe that COVID 19 is creating attractive investment opportunities.
As of September 30, 2021, our KKR European Private Equity Funds I-V have returned 2.1x gross MOIC (1.8x net MOIC) on a fully realized basis, corresponding to a gross IRR of 15.4% (net IRR of 12.7%) in EUR. Collectively the Funds had generated a total return of 1.9x gross MOIC (1.6x net MOIC) or 15.5% gross IRR (11.2% net IRR) in EUR – this is inclusive of our more recent partially realized and unrealized investments through Q3 2021. In total from our European Funds we have invested €17.8bn since European Fund I in 1999, and we have distributed approximately €25.3bn.
[1] Data represents Americas based private equity deal flow for the period January 2017 to September 30, 2021; includes a small number of opportunities related to existing KKR portfolio companies. Please see Important Information for additional disclosure regarding KKR’s internal information barrier policies and procedures, which may limit the involvement of certain personnel in some investment decisions and discussions most investments are presented to the Investment Committee numerous times throughout the diligence process, however this count includes each unique investment opportunity once and does not include subsequent presentations. Number of committed or closed investments excludes toehold / public stakes investments. Does not include investments announced or closed post September 30, 2021.
Confidential
Among our dedicated European private equity funds, our KKR European Funds I (1999) and II (2005) are fully realized, and we remain focused on returning capital to our investors from KKR European Funds III (2008), and IV (2015). We are currently deploying capital from KKR European Fund V (2019), which is approximately 70% committed/invested as of September 30, 2021. We formally launched European Fund VI in July 2021 and we will hold a 1A close in November 2021.
Note: Unless indicated, the above reflects current market views, opinions and expectations of KKR based on its historic experience and proprietary research. Historic market trends are not reliable indicators of actual future market behavior or future performance of any particular investment which may differ materially, and should not be relied upon as such. There can be no assurance that investors in any account, or fund or other vehicle will receive a return of capital.
(1) Past performance of any KKR sponsored fund, account or investment, including, but not limited to, the European Funds, is not indicative of future results of Fund V.
Asian Summary
Similar to other regions, KKR has been very active in deploying capital in the year to date period, while the current portfolio remains resilient in the face of COVID 19. Asia has been the first region globally to return to growth, and we are seeing encouraging performance in our portfolio companies which are returning to pre crisis levels of activity, in particular in China, Japan, Korea and Australia.
As of September 30, 2021, our KKR Asian Private Equity Funds I-IV have returned 2.3x gross MOIC on a fully realized basis, corresponding to a gross IRR of 21.6% in USD. Collectively the Funds have generated a total return of 1.9x gross MOIC (1.7x net MOIC) or 20.8% gross IRR (15.8% net IRR) in USD – this is inclusive of our more recent partially realized and unrealized investments through Q3 2021. In total from our Asian Funds we have invested ~$20 billion since our first investments in Asia in 2005 and we have distributed approximately $16.2 billion.
Among our dedicated Asian private equity funds, KKR Asian Fund I (2005) is close to fully realized. We remain focused on returning capital to our investors from KKR Asian Fund II (2013) and KKR Asian Fund III (2017), while KKR Asian Fund IV (2020) has been actively investing since July 2020. As of September 30, 2021, Asian Fund IV has eight investments.
Note: Unless indicated, the above reflects current market views, opinions and expectations of KKR based on its historic experience and proprietary research. Historic market trends are not reliable indicators of actual future market behavior or future performance of any particular investment which may differ materially, and should not be relied upon as such. There can be no assurance that investors in any account, or fund or other vehicle will receive a return of capital. Return information as of September 30, 2021. Past performance is no guarantee of future results.
Global Infrastructure Summary
KKR has a risk based, rather than sector based, approach to infrastructure investing, we seek to generate attractive risk-adjusted returns by focusing on critical infrastructure investments with low volatility and strong downside protection where KKR believes it can use the KKR Advantage to tackle complexity in sourcing, structuring, operations, and execution and deliver attractive returns with a low risk profile. We seek to generate returns through both long term capital appreciation and current income generation, targeting an overall gross return in the mid teens and an overall net return in the low teens from a portfolio that is broadly diversified across a number of different infrastructure subsectors, geographies and asset types.
In KKR’s view, a confluence of key drivers has led to a significant global Infrastructure capital need, including: economic growth; historic governmental underinvestment; increasing urbanization, congestion, and quality of life issues; heightened energy and environmental concerns; developments in technology; and growth in emerging markets. A meaningful portion of current infrastructure investing is already predominantly in the private domain, particularly in the power and utilities, renewables, midstream energy, and telecommunications sectors. The investment opportunities in these sectors are large and growing and we expect this trend to continue. In addition, traditional public financing sources have been unable to keep pace with global investment requirements particularly in the transportation, water, and social infrastructure sectors. KKR believes that infrastructure needs coupled with limited public resources are likely to exacerbate these funding challenges in the future.
Confidential
KKR’s global infrastructure strategy track record includes the following performance highlights as of September 30, 2021:
• Global Infrastructure Fund I investments are valued at $2,228.43 million as of September 30, 2021 based on $1,050.12 million of cost, representing a Gross IRR of 17.6% (and a Net IRR of 15.6%) and a gross multiple of 2.1x (and a net multiple of 1.9x). In 2019 and 2020, Global Infrastructure Fund I generated 6.1% and 8.9%, respectively, of annualized yield. As of September 30, 2021, Global Infrastructure Fund I had returned 212% of invested capital commitments to its limited partners.
• Global Infrastructure Fund II investments are valued at $6,012.4 million as of September 30, 2021 based on $3,163.2 million of cost, representing a Gross IRR of 20.8% (and a Net IRR of 18.1%) and a gross multiple of 1.9x (and a net multiple of 1.7x). In 2019 and 2020, Global Infrastructure Fund II generated 4.5% and 3.6%, respectively, of annualized yield. As of September 30, 2021, Fund II had returned 107% of invested capital commitments to its limited partners.
• Global Infrastructure Fund III investments are valued at $4,651.0 million as of September 30, 2021 based on $4,072.81 million of cost, representing a Gross IRR of 9.2% (and a Net IRR of 6.0%) and a gross multiple of 1.1x (and a net multiple of 1.1x). In 2019 and 2020, Global Infrastructure Fund III generated 3.6% and 4.3%, respectively, of annualized yield. As of September 30, 2021, Fund III had returned 8% of invested capital commitments to its limited partners.
• Global Infrastructure Fund IV launched on November 11, 2020 and the initial closing period commenced on May 24, 2021 and the Fund held subsequent rolling closes through June 2021 and additional closes in August and September. We have currently raised ~$15.3 billion in total capital commitments to date and we expect to hold a final close in Q1 2022.
KKR’s Investment Process
Due diligence is conducted globally. Regardless of where a deal is sourced, we use the professionals who we consider most appropriate for the particular investment no matter where they are located around the world. In the due diligence phase of a transaction, the deal teams include KKR Capstone 2 , Senior Advisors 3 , the Global Macro and Asset Allocation team and our Global Public Affairs professionals where appropriate to help conduct a thorough, detailed review of the opportunity and market environment. Leveraging the professional knowledge gained during this process, the KKR deal team will develop a strategy and detailed plan for the portfolio company, known as the 100 Day Plan, which sets forth the initial steps that KKR and company management have agreed are necessary to achieve immediate operational goals.
We canvas and preliminarily discuss private equity investments at regular meetings, ultimately bringing these ideas to colleagues in other divisions and geographies at the Firm who might have ideas on or contributions to the opportunity. When an investment team is sufficiently convinced that a business is worth serious due diligence, the opportunity is presented to the relevant regional Private Equity Investment Committee. We accomplish the critical work of due diligence through painstaking execution of techniques that equip us to analyze operations in locations throughout the world. The relevant regional Private Equity Investment Committee provides quality control over our due diligence processes and provides advice and guidance in pricing and structuring our investments.
Two internal committees the regional Private Equity Investment Committees and the Portfolio Management Committees are primarily responsible for our investment processes. The Private Equity Investment Committees provide decision-making oversight for potential investments. The Portfolio Management Committees oversee the monitoring, building, and exiting of investments.
2 KKR Capstone is not a subsidiary or affiliate of KKR. Please see “Important Information” at the end of this DDQ for additional disclosure regarding KKR Capstone.
3 Senior Advisors, Industry Advisors, and KKR Advisors are engaged as consultants and are not employees of KKR. Please see Important Information at the end of this Presentation for additional information.
Confidential
Private Equity Investment Committees
The Private Equity Investment Committees review all private equity investment proposals for their region, implement rigorous and consistent due diligence practices, and work with the deal team to set pricing and negotiation tactics. The Private Equity Investment Committees’ participants work actively with our private equity investment teams to ensure that due diligence on our potential investments is comprehensive and appropriately focused. The Private Equity Investment Committees also provide input on structuring each investment. In the process of making an investment, deal teams present formally to their regional Private Equity Investment Committee on multiple occasions, so that the risks and opportunities of the business are carefully vetted.
Portfolio Management Committees
Our regional Portfolio Management Committees instill discipline into the process of building value in our portfolio companies post acquisition. The Committees plays a significant role in a variety of portfolio management decisions, such as deploying investment professionals where needed, making the difficult decisions when companies are underperforming, and monitoring and advising on exit strategies. While the Portfolio Management Committee is organized with a regional focus, there remains a shared mandate across the regional committees.
During the due diligence period, the relevant investment team crafts a strategy and details plans for the portfolio company, which we call the 100 Day Plan. This plan, which delineates the operational issues to be addressed immediately after the acquisition, is presented to the applicable regional Portfolio Management Committee. After the first 100 days of an investment, the investment team returns to the Committee to present its progress against the plan and outline its goals for the remainder of the year. Thereafter, the investment team updates the Committee with monthly and quarterly financial reports and an annual analysis on the portfolio company’s ability to continue to compound our investment at attractive rates of return.
Each regional Portfolio Management Committee meets monthly, designating a number of investment teams on a rotating basis for presentation of their respective portfolio companies. On occasion, a senior executive from a particular portfolio company, typically the Chief Executive Officer, will also present at the meetings. The meetings are very interactive and present an excellent forum for discussing and solving operational issues within portfolio companies. Additionally, it is through these discussions that the accumulated investment knowledge of the Firm’s senior executives and advisors is passed on to the next generation of KKR professionals.
Confidential
Important Information
The following information has been provided by Kohlberg Kravis Roberts & Co. L.P. (together with its affiliates, “KKR” or the “Firm”) at your request. This information is being provided on a confidential basis for discussion and informational purposes only and is not an offer to sell or a solicitation to purchase any securities of any investment fund or vehicle sponsored by KKR. There is no representation or guarantee regarding the reliability, accuracy, or completeness of the information contained in this document, and KKR will not be liable for any damages, including loss of profits, which may result from reliance on this information. KKR is not under any obligation to update or keep current the information contained in this document. Nothing set forth below is or shall be deemed to be investment advice or the offer of investment advice to any recipient thereof.
In this Questionnaire, references to “KKR Capstone” or “Capstone” are to all or any of KKR Capstone Americas LLC, KKR Capstone EMEA LLP, KKR Capstone EMEA (International) LLP, KKR Capstone Asia Limited and their Capstone branded subsidiaries, which employ operating professionals dedicated to supporting KKR deal teams and portfolio companies.
References to operating executives, operating experts, or operating consultants are to such employees of KKR Capstone. In this due diligence questionnaire, views and other statements regarding the impact of initiatives in which KKR Capstone has been involved are based on KKR Capstone’s internal analysis and information provided by the applicable portfolio company. Such views and statements are based on estimates regarding the impact of such initiatives that have not been verified by a third party and are not based on any established standards or protocols. They can also reflect the influence of external factors, such as macroeconomic or industry trends, that are unrelated to the initiative presented. Employees of KKR Credit Advisors (US) LLC and KKR Capital Markets LLC (“KKR Capital Markets” or “KCM”) located in the U.S. are dual employees of KKR.
References to “Senior Advisors” and “Industry Advisors” are to individuals who are engaged, as consultants, to assist KKR with sourcing or developing investment ideas and a variety of other matters. These individuals are not employees of KKR. The portion of the compensation paid to Senior Advisors and Industry Advisers that is related to fund activities, such as sourcing investments or monitoring portfolio companies, may be borne by the relevant funds. References to “KKR Advisors” are to individuals who were formerly employees of KKR and are engaged as consultants for KKR. None of the compensation of KKR Advisors is borne by the funds.
The reported impact of initiatives provided in this questionnaire is based on internal analysis of KKR and/or KKR Capstone and information provided by the applicable portfolio company. Impacts of such initiatives are estimates that have not been verified by a third party and are not necessarily reported according to established voluntary standards or protocols. KKR does not guarantee the accuracy, adequacy, or completeness of such information. They may also reflect the influence of external factors such as macroeconomic or industry trends. There is no guarantee that results shown will be replicated in the future and actual results may be better or worse in future years.
Unless otherwise indicated, statements in this Questionnaire are made as of September 30, 2021. The delivery of this Questionnaire at any time shall under any circumstances create an implication that the information contained herein is correct as of any time subsequent to such dates.
Confidential
This page intentionally left blank
Lexington Capital Partners IX, L.P.
Lexington Capital Partners VIII, L.P.
Lexington Middle Market Investors III, L.P.

November 2021
Presentation to The Salvation Army Southern Territory

• • • • • • • • • • • • •
• • • • • • • •
• • • •
• • • • • • • •
1
• • • • • • •
This presentation (the “Presentation”) is being provided to the Salvation Army Southern Territory at its request and on a confidential basis for informational and discussion purposes only and does not constitute an offer to sell or a solicitation of an offer to purchase a limited partner interest in the Partnership. Any such offer or solicitation shall be made only pursuant to the confidential private placement memorandum (as modified, amended, restated or supplemented from time to time, the “Memorandum”), which describes certain risks related to an investment in the Partnership and which qualifies in its entirety the information set forth herein. The Memorandum, including the risk factors and potential conflicts of interest described therein, should be read carefully prior to investment. Capitalized terms used throughout this document shall have the meanings ascribed to such terms in the Limited Partnership Agreement or as otherwise defined herein. The information contained herein should be treated in a confidential manner and may not be reproduced or used in whole or in part for any other purpose. Each person accepting this Presentation hereby agrees to return it promptly upon request. Lexington Partners L.P. (together with its affiliated entities, “Lexington”) does not make any representation or warranty, express or implied, as to the accuracy or completeness of the information contained herein and nothing contained herein shall be relied upon as a promise or representation whether as to the past or future performance. Lexington does not have or undertake any obligation to update or keep current the information contained herein.
During the period 1990 to 1995, Lexington helped organize and provide investment services to six secondary funds with Landmark Partners Inc. (“Landmark”) (collectively, the “Co-Managed Funds”): Landmark Venture Partners, L.P. (“LVP”), Landmark Equity Partners II, L.P. (“LEP II”) and Landmark Equity Partners V, L.P. (“LEP V”), for the purchase of secondary venture capital interests; Landmark Equity Partners III, L.P. (“LEP III”) and Landmark Equity Partners IV, L.P. (“LEP IV”), for the purchase of secondary buyout interests; and Landmark Mezzanine Partners, L.P. (“LMP”), for the purchase of secondary mezzanine interests. LVP, LEP II and LEP V are collectively referred to as the “Co-Managed Venture Capital Funds.” LEP III, LEP IV and LMP are collectively referred to as the “Co-Managed Buyout and Mezzanine Funds.” The aggregate Net IRR and Net Multiple for the Lexington Secondary Funds as of June 30, 2021 is 17.0% and 1.6x, respectively. Excluding the Co-Managed Fundsformed prior to the establishment of Lexington as an independent firm in 1994 (for which only certain current and former Lexington investment professionals were involved in investment decisions and who may not be involved in investment decisions for more recent funds, including the Partnership), the aggregate Net IRR and Net Multiple for the Lexington Secondary Funds as of June 30, 2021 is 13.8% and 1.6x, respectively.Lexington was established in 1994 as an independent entity by certain principals and employees of Landmark. Lexington assumed primary, but not exclusive, responsibility to source investment opportunities and make investment recommendations to the respective general partner entities of the Co-Managed Buyout and Mezzanine Funds. Landmark assumed primary, but not exclusive, responsibility to source investment opportunities and make investment recommendations to the respective general partner entities of the Co-Managed Venture Capital Funds. The investment performance of the Co-Managed Funds contained herein was achieved under different market conditions and with involvement from investment professionals that have not and will not be involved with the investment activities of the Partnership. In addition, the Co-Managed Venture Capital Funds and LMP pursued investment strategies that were materially different than the investment strategy of existing and future Lexington-sponsored funds, including the Partnership.Accordingly, such performance information is provided solely for background purposes, should be given qualified consideration and should not be considered as an indication of future performance by the Partnership. The Lexington Secondary Funds include: the Co-Managed Funds, Lexington Capital Partners I, L.P. (“LCP I”), Lexington Capital Partners II, L.P. (“LCP II”), Lexington Capital Partners III, L.P. (“LCP III”), Lexington Capital Partners IV, L.P. (“LCP IV”), Lexington Capital Partners V, L.P. (“LCP V”), Lexington Capital Partners VI, L.P. (“LCP VI”), Lexington Capital Partners VII, L.P. and associated vehicles (collectively, “LCP VII”), Lexington Capital Partners VIII, L.P. and its parallel vehicle (“LCP VIII”), Lexington Capital Partners IX, L.P. and its parallel vehicles (“LCP IX”), Lexington Middle Market Investors, L.P. (“LMMI I”), Lexington Middle Market Investors II, L.P. (“LMMI II”), Lexington Middle Market Investors III, L.P. (“LMMI III”), Lexington Middle Market Investors IV, L.P. (“LMMI IV”), and Lexington Emerging Partners, L.P. (“LEP”). Lexington’s founder, Brent R. Nicklas (the “Founder”), has delegated the management activities of Lexington to a management committee (the “Management Committee”) currently comprised of Wilson S. Warren (President of Lexington), Pål B. Ristvedt, Duncan A. Chapman, and Thomas Giannetti.
As used herein, LCP VII includes capital from separate vehicles which pursue a substantially similar strategy and are subject to reduced fees. Aside from Total Capital and unless otherwise stated, LCP VIII, LCP IX, and LMMI IV data excludes $905 million, $2,005 million, and $601 million, respectively, of capital from separate vehicles.
Unless otherwise indicated, the vintage year referenced for each Lexington fund is the year of first closing; provided that in the event the year of first closing had no meaningful investment, the vintage year is generally determined by the year in which amounts invested exceed 10% of the fund’s capital.
The past performance information contained herein is not necessarily indicative of future results and there can be no assurance that the Partnership will achieve comparable results or that the Partnership will be able to implement its investment strategy, achieve its investment objectives, or avoid substantial losses. Prospective investors are cautioned not to rely on the prior performance information set forth herein in making a decision whether or not to purchase an interest. Unless otherwise explicitly stated, the prior performance information contained herein has not been audited or verified by any independentparty and is not necessarily representative of the returns that may be received by an investor in the Partnership or any other Lexington fund. Certain factors exist that may affect comparability between the Partnership and affiliated investment funds including, among others, differences with respect to fees and expenses and the payment of a carried interest (which may be different for the Partnership) as well as other factors. For example, all of the Partnership’s investments will be subject to the same level of advisory fees and carried interest at the level of the Partnership, while its predecessorfunds’ investments in Primary Funds were subject to reduced investment advisory fees and no carried interest. Except as otherwise explicitly noted, all information contained herein describing prior performance is on a gross basis before giving effect to management fees, the general partner’s carried interest, taxes, transaction costs and other expenses to be borne by investors, the application of which would reduce such rates of return. See “Investment Performance” on page 45 for Net IRR information. Investors may suffer the loss of their entire investment. The information provided in these materials is illustrative and no assurance is given that any indicated returns, performance or results will be achieved.
Certain information contained in this Presentation has been obtained from sources outside Lexington. While such information is believed to be reliable for purposes used herein, no representations are made as to the accuracy or completeness thereof. Unless otherwise indicated, public market index returns have been calculated using a “public market equivalent approach” whereby cash flows into and out of private equity funds are treated as investments and sales in the public market index, interim balances are carried forward at riskless rates, and the resulting ending value is treated as a measure of performance. The returns for the public market index have been calculated without dividend reinvestment. The market volatility, liquidity, and other characteristics of private equity investments are materially different from those of the public markets.
Statements contained in this Presentation (including those relating to current and future market conditions and trends, in respect thereof) that are not historical facts are based on Lexington’s current expectations, estimates, projections, opinions, and/or beliefs.Certain information contained in this Presentation constitutes “forward-looking statements,” which can be identified by the use of forward-looking terminology such as “may,” “will,” “should,” “could,” “expect,” “anticipate,” “project,” “estimate,” “intend,” “continue,” “target,” “pro forma,” “plan” or “believe” or the negatives thereof or other variations thereon or comparable terminology.Due to various risks and uncertainties, actual events or results or the actual performance of the Partnership and any other Lexington fund may differ materially from those reflected or contemplated in such forward-looking statements. Moreover, no assurance can be given that the events, views, conditions, trends or themes described in this presentation will occur or continue, particularly since they will often depend upon future events outside of the control of Lexington.
To calculate Net Committed Capital, LCP IX’s gross committed capital (which is net of $748.6 million of contractual commitments that are not expected to be called) is reduced by $2,746.5 million as of 10/15/21 for (i) deferred purchase price payments and other obligations of special purpose vehicles (“SPVs”) formed to make investments which the general partner expects to be satisfied by proceeds generated by such investments (“SPV Obligations”), and (ii) projected proceeds generated from investments that will be used by the partnership to pay outstanding and contemplated LCP IX Facility borrowings, but which will not reduce the partnership’s available capital (“Facility Obligations” and, together with SPV Obligations, “Partnership Obligations”). As of 6/30/21, $993.1 million of proceeds were received and applied to Partnership Obligations. As of September 2021, Lexington has adjusted its projections relating to Facility Obligations and increased the amount of proceeds expected to be applied to Facility Obligations by $800 million, which will result in the partnership being allocated a greater portion of new investments than would otherwise be the case, and in separate vehicles in the LCP IX program being allocated a smaller portion of new investments than would otherwise be the case.
Lexington put in place a revolving credit facility (the “LCP IX Facility”) at the beginning of LCP IX’s investment period in the amount of $1.75 billion. As of March 6, 2020, Lexington increased the size of the LCP IX Facility to $3.2 billion in the aggregate and may increase the size of the facility to an amount not to exceed 30% of total Capital Commitments at any point in time. The stated maturity date of the LCP IX Facility is October 23, 2021, with a one-year extension option.As a result of the revolving nature of the LCP IX Facility, on a cumulative basis, aggregate borrowings over the life of the LCP IX Facility are expected to exceed 30% of aggregate capital commitments. Advances under the LCP IX Facility are expected to generally bear interest at a rate per annum equal to LIBOR plus 1.50% (1.63% as of 9/30/21).As of September 30, 2021, the LCP IX Facility has an outstanding balance of $2.8 billion. Through September 30, 2021 on a cumulative basis, LCP IX has borrowed approximately $4.6 billion on the LCP IX Facility and repaid approximately $1.8 billion. The general partner of LCP IX currently intends to utilize the LCP IX Facility for the duration of its term to efficiently manage the LCP IX acquisition program and working capital.
LCP VIII has a revolving credit facility (the “LCP VIII Facility”) that, as of February 9, 2021, allows for maximum outstanding borrowings of $100 million and bears interest at LIBOR plus 1.95% (2.08% as of 9/30/21). The LCP VIII Facility’s current maturity date is February 8, 2022.Prior to stepping down to a $100 million working capital facility in February of 2021, for a one-year period the LCP VIII Facility allowed for maximum borrowings of $200 million; for the one-year period prior to that, $300 million; and for the one-year period prior to that, $1.95 billion.Prior to that, the LCP VIII Facility allowed for maximum borrowings of $2.25 billion. As a result of the revolving nature of the LCP VIII Facility, through September 30, 2021 on a cumulative basis, LCP VIII has borrowed approximately $5.0 billion on the LCP VIII Facility and repaid approximately $4.9 billion.Of this $5.0 billion, approximately $3.2 billion represents borrowing for the purpose of interim financing and covering the Investment Advisory Fee.The general partner of LCP VIII currently intends to utilize the LCP VIII Facility for the duration of its term to efficiently manage working capital.
Lexington put in place a working capital facility for LMMI III (the "LMMI III Facility") in September of 2012 in the amount of $35 million. After the fund's final closing, the line was increased to $150 million and subsequently increased to $200 million.In May of 2019, the line of credit matured and the fund entered into a new line of credit with a stated maturity date of May 17, 2022.The LMMI III Facility currently allows for maximum borrowings of $100 million and bears interest at LIBOR plus 1.50% (1.63% as of 9/30/21).As of September 30, 2021, the LMMI III Facility has an outstanding balance of $47 million. The general partner of LMMI III currently intends to utilize the LMMI III Facility for the duration of its term to efficiently manage working capital.
Lexington’s Proprietary Database: Lexington has assembled a proprietary database, which is compiled from various sources, including, without limitation: third party agents, publications, public filings, industry sponsors and market participants. Lexington’s database includes over 40,000 private equity and alternative interests.
Discount: As used herein, “discount to market value” and “purchase discount” shall mean the difference between purchase price and Market Value except for LMMI I and LMMI II for which purchase discount is to contributed capital. Unless otherwise indicated, “Market Value” means the value reported by the general partner of each underlying private investment fund at the Record Date, adjusted to reflect (i) interim activity between the Record Date and the date of closing of the purchase and sale, (ii)the stock price of publicly traded companies on the date of closing, and (iii) in certain instances, adjustments to private company valuations based on more recent generalpartner valuations subsequent to the Record Date.“Record Date” means the quarter or period-end date of the financial report of the underlying private investment fund thathas been agreed upon with the seller to be used in a secondary acquisition.Industry Average discount estimates are based on data from Lexington’s Proprietary Database of secondary transactions.Secondary transaction data is analyzed to estimate industry average discounts. Although Lexington’s data includes over 40,000 private equity interests, Lexington’s industry average discount estimates do not reflect all secondary transactions in a given period and may differ materially from actual industry average discounts in any such period.In order to provide a meaningful basis for comparison against Lexington discounts (which are adjusted to reflect activity between the Record Date and the date of closing – see “Discount” above) such industry average discounts are adjusted to take into account movement in NAV consistent with broader markets between the Record Date and the date of closing – see “Discount” above) such industry average discounts are adjusted to take into account movement in NAV consistent with broader markets between the Record Date and the date of closing.This adjustment is applied using an estimated appreciation equal to the average of (i) 2.5%, (ii) performance of the S&P 500 over the applicable time period and (iii) the industry average discounts without adjustment.
Structure-Adjusted Purchase Discount: As used herein, “structure-adjusted purchase discount” shall mean the difference between the adjusted net purchase price and Market Value. Unless otherwise indicated, “Adjusted Net Purchase Price” is defined as the purchase price post-deal structuring (i.e., net of any deferred amount) plus the present value of the deferred amount, calculated as of the deal closing date.
Reported Value: “Reported Value” is typically the aggregate value of the Lexington Secondary Fund’s interests, as applicable, in such underlying private equity fund as most recently reported by the general partners thereof as of 3/31/21 increased for cash contributions paid to, and decreased for realized cash proceeds received from, such underlying investment funds for the intervening period through 6/30/21, provided that the Reported Values for LCP VII, LCP VIII, LCP IX, LMMI III, LMMI IV, and LEP are net of deferred purchase price obligations of NA, NA, $461.9 million, NA, $19.5 million, and NA, respectively, and other assets of $22.7 million, $94.3 million, $268.3 million, $4.0 million, $23.1 million, and $1.3 million, respectively, as of 6/30/21. The Reported Value of LCP VIII reflects shares of Apax Global Alpha at the closing price of £1.94, shares of Moonpig at the closing price of £4.29, shares of Compass at the closing price of $13.14, as well as shares of Keurig Dr. Pepper at a closing price of $35.24 as of 6/30/21 less a discount due to any legal restrictions on the sale of shares. In addition, any portfolio acquisitions that have been made during the current quarter have been included at their fair value, in accordance with U.S. GAAP. Reported Values are net of all fees, expenses and “carried interest” borne by investors in the underlying private equity funds, but do not reflect the management fees, “carried interest,” taxes and other expenses to be borne by investors in the applicable Lexington partnership, which will reduce returns and, in the aggregate, are expected to be substantial. The actual returns on investments for which a Reported Value has been used to calculate Gross IRRs and Net IRRs will depend on, among other factors, the value of the assets and market conditions at the time of disposition of each underlying investment of the applicable underlying fund, which may differ from assumptions of the general partners of the underlying funds on which the Reported Value is based. Accordingly, the actual realized returns on these unrealized investments may differ materially from Reported Values and there can be no assurance that unrealized investments will be realized at the valuations shown.
Distributions Received: “Distributions Received” for LCP VII excludes $508.8 million of distributions received by SPVs in respect of underlying investments (“SPV Distributions”) applied to SPV Obligations and not distributed to LCP VII. Distributions Received for LCP VIII excludes $1,477.3 million of SPV Distributions applied to SPV Obligations and not distributed to LCP VIII, but includes $1,576.7 million of distributions applied to Facility Obligations. Distributions Received for LCP IX excludes$686.8 million of SPV Distributions applied to SPV Obligations and not distributed to LCP IX, but includes $306.3 million of distributions applied to Facility Obligations. Distributions Received for LMMI III excludes $76.2 million of SPV Distributions applied to SPV Obligations and not distributed to LMMI III, but includes $217.2 million of distributions applied to Facility Obligations. Distributions Received for LMMI IV excludes $100.5 million of SPV Distributions applied to SPV Obligations and not distributed to LMMI IV, but includes $133.2 million of distributions applied to Facility Obligations. Distributions Received for LEP excludes $17.8 million of SPV Distributions applied to SPV Obligations and not distributed to LEP.
CONFIDENTIAL TRADE SECRET
Endnotes
Neuberger

Berman Private Markets November 2021
 The Salvation Army – USA Southern Territory 2021 Annual Portfolio Review Meeting
For
The Salvation Army – USA Southern Territory 2021 Annual Portfolio Review Meeting
For
the exclusive use of The
Salvation
Army not for redistribution
Neuberger Berman Overview
We are a leading independent private asset management firm with an integrated private equity platform, which provides robust deal flow and enhanced due diligence insights
• $437 billion1 assets under management as of September 30, 2021
• Experience: 82 year firm history; 25+ average years of industry experience for lead portfolio managers; 99% of clients’ assets managed by lead PMs who have 20+ years of industry experience
• Stability: Awarded 1st or 2nd Place in Each of the Last Seven Consecutive Years (2014 2020) by Pensions & Investments as “Best Place to Work in Money Management2
• Alignment: 100% employee owned; ~$6B invested by Neuberger Berman employees alongside clients3; 100% PMs deferred cash compensation directly linked to team and firm strategies
• Global Presence: 2,403 employees in offices in 36 cities globally
Neuberger Berman Private Markets Overview
Note: As of June 30, 2021. Represents aggregate committed capital since inception in 1987, including commitments in the process of documentation or finalization. Includes estimated allocations of dry powder for diversified portfolios consisting of primaries, secondaries, and co investments. Therefore, amounts may vary depending on how mandates are invested over time.
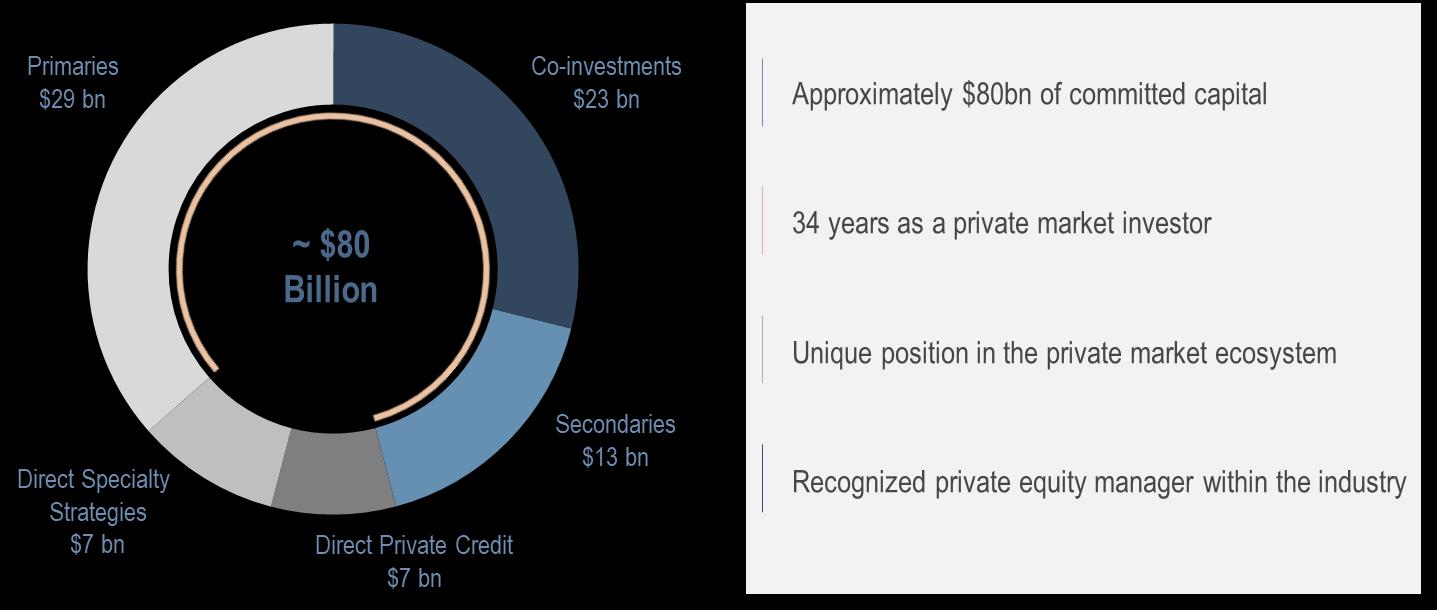
• Deep and Experienced:
o 190+ private markets professionals
o 70+ senior private markets investment professionals
o 21+ years of average experience across 70+ senior private markets investment professionals
• Global: Private Markets offices in New York, Dallas, Boston, London, Hong Kong, Tokyo, Zurich and Shanghai
• Stable:
o 98% retention levels of NB Private Markets Managing Directors and Principals4
o Aligned: Majority of Investment Team members participate in carried interest
Secondaries
Dedicated Secondary Team Biographies
Brian Talbot is a Managing Director of Neuberger Berman and founder and Chairman of NB Secondary Private Equity. He is a member of the Secondary, Real Estate Secondary, Strategic Capital and Athyrium Investment Committees. Mr. Talbot joined Neuberger Berman Private Equity from Deutsche Bank AG where he was global head of Secondary Investing and president of Deutsche Bank Investment Partners, the fund investing arm of Deutsche Bank. Prior to joining Deutsche Bank in 1989, Mr. Talbot was a manager in the Financial Services group at Ernst and Young. Mr. Talbot holds a BS in Accounting from Fordham University.
Tristram Perkins is a Managing Director of Neuberger Berman and Global Head of NB Secondary Private Equity. He is a member of the Secondary, Real Estate Secondary, Strategic Capital and Renaissance Investment Committees. Mr. Perkins oversees the origination and valuation of secondary investments. Mr. Perkins joined Neuberger Berman Private Equity from Deutsche Bank, where he worked for eight years in the private equity division
1 As of September 30, 2021
2 For seven consecutive years, the company has been named first or second in Pensions & Investments Best Places to Work in Money Management survey (among those with 1,000 employees or more).
3 Employee assets include current and former employees and their family members.
4 Average annual retention over from 2009 through May 2021 of Private Investment Portfolios and Co investment Investment Team Managing Directors and Principals. Computed as number of departures over total number of senior investment professionals among the Private Investment Portfolios and Co investment senior team only.
investing in secondary private equity and directly in operating companies. Prior to joining Deutsche Bank, Mr. Perkins worked for four years in investment banking with Alex. Brown & Sons in New York, working in both the Restructuring Group and the Industrial Technologies Group. Mr. Perkins received his MBA from Columbia Business School and his BA from Middlebury College.
Ethan Falkove is a Managing Director of Neuberger Berman and a member of the Secondary, Strategic Capital and the Real Estate Secondary Investment Committees. He is primarily responsible for sourcing, evaluating, structuring and purchasing secondary investment opportunities. Prior to joining Neuberger Berman, Mr. Falkove worked at Deutsche Bank in the private equity division, investing in secondary private equity and directly in operating companies. Mr. Falkove received his MBA from Columbia Business School and his BS from the Wharton School of the University of Pennsylvania.
Benjamin Perl is a Managing Director of Neuberger Berman and a member of the Secondary, Real Estate Secondary and Strategic Capital Investment Committees. Mr. Perl joined the firm in 2001 and Neuberger Berman Private Equity in 2007. Prior to that, Mr. Perl worked as an Associate at Lehman Brothers Venture Partners (now Tenaya Capital), where he was responsible for executing and evaluating mid through late stage equity investments across a wide range of industries. He also worked in Lehman Brothers’ Investment Banking Division in New York and San Francisco as part of both the Consumer Retail and Equity Capital Markets Groups. Mr. Perl holds an MBA, with High Distinction (Baker Scholar), from Harvard Business School and a BA, Phi Beta Kappa, from Wesleyan University.
Peter Bock is a Managing Director of Neuberger Berman and a member of the Secondary and Strategic Capital Investment Committees. Prior to joining Neuberger Berman in 2005, Mr. Bock was an Associate at Lightyear Capital, a $3 billion private equity fund. Prior to that, Mr. Bock worked at PaineWebber Inc., in both investment banking advising on corporate transactions including M&A, restructurings and equity and debt, and strategic investing. Mr. Bock holds an MBA from The Fuqua School of Business, Duke University and a BA from Amherst College.
Philipp Patschkowski is a Managing Director of Neuberger Berman and a member of the Secondary and Strategic Capital Investment Committees. He initially joined Neuberger Berman as a senior member of the Firm's Private Investment Portfolios group where he was responsible for leading primary and secondary fund investments and direct co investments. Prior to joining the Firm, Mr. Patschkowski was at Coller Capital where he was responsible for originating and executing secondary and strategic primary fund investments and co investments. Mr. Patschkowski received an MBA from INSEAD in France/Singapore, and a Diploma in Mathematics and Economics from the University of Ulm in Germany. Mr. Patschkowski is a member of the LP Council of Invest Europe, the European private equity association.
Scott Koenig is a Managing Director of Neuberger Berman and leads the firm’s real estate secondary investment activities. Mr. Koenig joined the firm in 2017 from Deutsche Bank, where he was head of real estate secondaries for DB’s private equity business for four years. From 2001 2013, Mr. Koenig was a member of DB’s real estate private equity team, including most recently as head of portfolio management overseeing two global real estate private equity funds, and worked on more than US$3 billion of direct real estate transactions. Prior to DB, he worked for Nomura in their commercial real estate lending program and for Price Waterhouse in their real estate advisory services group. Mr. Koenig received his MBA. from Columbia Business School and his B.A. from Princeton University.
Frank Guglielmo is a Principal of Neuberger Berman and focuses on secondary investment activities. Prior to joining Neuberger Berman Private Equity in 2010, Mr. Guglielmo was an Investment Banking Analyst at TM Capital, a boutique middle market investment bank. Mr. Guglielmo graduated cum laude from New York University’s Leonard N. Stern School of Business in 2008 with a BS in Finance and Accounting.
Boriana Karastoyanova is a Principal of Neuberger Berman and a member of the Secondary Private Equity Team. Prior to joining Neuberger Berman in 2019, Mrs. Karastoyanova was with Blackstone's Strategic Partners Fund Solutions where she focused on originating, evaluating, structuring and negotiating secondary private equity transactions, co investments and primary commitments. She previously was with Strategic Partners while it was in the Asset Management division of Credit Suisse. From 2005 to 2008, she led Strategic Partners' European operations out of London. Mrs. Karastoyanova began her career in Investment Banking at Citigroup. She holds a BA from Middlebury College.
Victor Ko is a Principal at Neuberger Berman. Prior to joining Neuberger Berman Private Equity, Mr. Ko was a principal at New 2ND Capital, a secondary private equity firm focused on GP led transactions. Mr. Ko also worked at HarbourVest Partners in its Boston and London offices focusing on secondary private equity opportunities including portfolios of direct investments and various structured transactions. Mr. Ko started his career as an investment banking analyst at Jefferies & Company in New York and was previously a Sergeant in the Republic of Korea Army. He received a BA in Economics from the University of Chicago.
Ted Rykowski is a Principal of Neuberger Berman and focuses on real estate secondary investment activities. Mr. Rykowski joined Neuberger Berman from Deutsche Asset Management, where he worked on real estate secondary investing for their private equity business. Prior to this, Mr. Rykowski was in the Real Estate, Gaming and Lodging investment banking group at Bank of America Merrill Lynch. He was also an analyst in the Real Estate Investment Banking Group at Jones Lang LaSalle and an acquisitions analyst at the real estate investment manager National Real Estate Advisors. Mr. Rykowski holds an MBA from the McCombs School of Business at the University of Texas and an AB from Harvard College.
Adrian Gimenez is a Vice President of Neuberger Berman and focuses on real estate secondary investment activities. Mr. Gimenez joined Neuberger Berman from Hines, where he worked most recently as Director of Portfolio Management for Europe overseeing a €4bn real estate portfolio. Prior to this, Mr. Gimenez was Senior Portfolio Manager at Landsec and an Asset Manager at Hammerson. He also worked for 6 years at Unibail Rodamco
where he held different roles on real estate acquisitions and asset management. Mr. Gimenez holds an MBA from London Business School, MSc in Finance and Economics from London School of Economics and a degree from Universitat Pompeu Fabra.
Jordan Mark is a Vice President at Neuberger Berman. Prior to joining Neuberger Berman Private Equity, Mr. Mark was a member of Greenhill & Co.’s Private Equity Secondary Advisory team (previously known as Cogent Partners). At Greenhill, Mr. Mark advised clients on the sale, purchase and valuation of private equity fund interests on the secondary market. Mr. Mark graduated from Vanderbilt University with a BA in Economics.
Matthew Tai is a Vice President at Neuberger Berman. Prior to joining Neuberger Berman Private Equity, Mr. Tai worked for two years in Technology, Media & Telecom Investment Banking at Barclays Capital, where he advised clients on numerous M&A and financing transactions. Mr. Tai graduated from McGill University with a BCom with High Distinction.
Scott Matza is a Senior Associate at Neuberger Berman. Prior to joining Neuberger Berman Private Equity, Mr. Matza worked for two years in Generalist Investment Banking program at Moelis & Company, where he advised clients on numerous M&A and special situations transactions. Mr. Matza graduated from the University of Michigan with a BBA with High Distinction from the Stephen M. Ross School of Business.
Brandon Glick is an Associate at Neuberger Berman. Prior to joining Neuberger Berman Private Equity in 2018, Mr. Glick worked for 4 years in the Merger & Acquisitions Group at Oppenheimer & Co., where he advised clients on numerous M&A and financing transactions. Before working at Oppenheimer, he spent nearly 2 years working at SkyWorks Capital, an advisory firm exclusively serving clients in the aviation industry. Mr. Glick graduated with high honors from Lehigh University with a BS in Finance.
Christian Kemph is an Associate at Neuberger Berman. Prior to joining Neuberger Berman Private Equity, Mr. Kemph worked for three years in Corporate Finance Investment Banking at Wells Fargo Securities, where he advised clients on numerous M&A transactions. Mr. Kemph graduated from Northeastern University magna cum laude with a BS in Mathematics.
Luke Lee is an Associate at Neuberger Berman. Prior to joining Neuberger Berman Private Equity, Mr. Lee was an associate at RBC Capital Markets’ Media & Entertainment Investment Banking group, where he advised clients on numerous M&A and financing transactions. Mr. Lee graduated from University of Southern California with a Bachelor in Business Administration from Marshall School of Business.
Amy Li is an Associate at Neuberger Berman. Prior to joining Neuberger Berman Private Equity, Ms. Li worked for two years in Corporate Finance Investment Banking at Wells Fargo Securities. Ms. Li graduated from Duke University magna cum laude with a BS in Economics.
Susie Liu joined Neuberger Berman in 2019 as an associate on Private Equity Secondary Team. Prior to joining Neuberger Berman Private Equity, Susie spent 2 years as an investment banking analyst at the Diversified Industries Coverage team at BNP Paribas, structuring and executing strategic advisory and financing transactions for multinational corporates in the North America regions. In 2017, Susie Liu graduated from University of Michigan with honors with a BS in Engineering and minor in Financial Mathematics.
Karl Werner is an Associate at Neuberger Berman. Prior to joining Neuberger Berman Private Equity, Mr. Werner worked for two years in Technology, Media and Telecom Investment Banking at Guggenheim Partners, where he advised clients on numerous M&A and financing transactions. Mr. Werner graduated from the University of Michigan with a BBA with High Distinction from the Stephen M. Ross School of Business.
Tammy Xu is an Associate at Neuberger Berman. Prior to joining Neuberger Berman Private Equity, Ms. Xu worked for two years in the Energy Investment Banking Group at RBC Capital Markets, where she advised clients on M&A, restructuring, and debt and equity financings across the upstream, midstream and oilfield service sectors. Ms. Xu holds a BA in Mathematical Economic Analysis and Managerial Studies (cum laude) from Rice University.
Giuseppe Liori is a Private Equity Analyst of Neuberger Berman. Previously, he interned at NB Renaissance, the Italian direct buyout strategy of Neuberger Berman. Mr. Liori holds a Master of Science in Accounting, Financial Management and Control and a Bachelor of Science in Economics and Finance, both from Bocconi University.
Investment Summary: NB Secondary Opportunities Fund III


STATEMENT OF CHANGES IN INDIVIDUAL PARTNER'S CAPITAL
For the Six Month Period Ended June 30, 2021 The Salvation Army, A Georgia Corporation
*Note that the information contained in this Statement of Changes in Individual Partner's Capital was extracted from the accounting books and records used to compile the June 30, 2021 unaudited financial statements of the Partnership. The General Partner confirms that this statement has been calculated in accordance with the terms and provisions of the Partnership Agreement. This Statement of Changes in Individual Partner's Capital has not been audited.
Burgiss Secondary Private Equity Index: Based on data compiled from 280 secondary funds, including fully liquidated partnerships, formed between 1988 and 2021. The benchmark relies on Limited Partners reporting data for compilation and as such is subject to the quality of the data provided. The median metrics of the Burgiss Secondary Index are presented for each vintage year as of June 30, 2021, the most recent available. Presented for illustrative purposes only to show general trends in the market for the relevant periods shown. The investment objectives and strategies of each fund in the benchmark may be different than the investment objectives and strategies of the Fund and the Prior Funds, and may have different risk and reward profiles. A variety of factors may cause this comparison to be an inaccurate benchmark for any particular fund and the benchmarks do not necessarily represent the actual investment strategy of a fund. It should not be assumed that any correlations to the benchmark based on historical returns would persist in the future.
NB Secondary Opportunities Fund III Performance Versus Burgiss Secondary Index(1)Note: The recent COVID 19 pandemic has had serious and adverse consequences to business conditions in North America and elsewhere around the globe following December 31, 2019, including limitations on travel, transportation, education, production of goods, provision of services and businesses operations generally. Further, the equity and other securities markets have experienced significant volatility, with substantial losses in the equity markets as compared to year end. Although the long term economic fallout of COVID 19 is difficult to predict, the challenging business conditions in the economy generally are likely to adversely affect financial markets, and challenging business conditions are likely to have adverse effects on the financial performance of companies in the United States and abroad. As a result, these conditions are likely to lead to adverse impacts on valuations and other financial analyses for future periods. If the economic fallout is severe and/or extended, the adverse impacts may be material.
1. The benchmark performance is presented for illustrative purposes only to show general trends in the market for the relevant periods shown. The investment objectives and strategies of each fund in the benchmark may be different than the investment objectives and strategies of the Fund and the Prior Funds, and may have different risk and reward profiles. A variety of factors may cause this comparison to be an inaccurate benchmark for any particular fund and the benchmarks do not necessarily represent the actual investment strategy of a fund. It should not be assumed that any correlations to the benchmark based on historical returns would persist in the future.
2. Returns that are presented on a “net” basis include the estimated effect of the carried interest, management fees and other expenses for institutional investors in Fund III as applicable, that would be paid to the general partner if the entire portfolio were liquidated at the remaining value. Note that economic terms differ for non institutional investors. The net returns shown are for the limited partners, in aggregate, in the onshore institutional fund (NB Secondary Opportunities Fund III LP) and include investments held through alternative investment vehicles, including alternative investment vehicles associated with offshore feeder funds that invest in the onshore institutional fund through a master feeder structure. The reported performance reflects the remaining values of investments as well as realized proceeds. Because the remaining values are generally based on valuations of the underlying portfolio investments by the underlying funds’ sponsors, rather than the cost of the investments, purchase discounts (or premiums) can initially impact the reported performance data, which over time will reflect subsequent changes in the valuations of the underlying investments. Fund III employed a subscription line credit facility. Net returns of Fund III without the use of a credit facility would be lower.

3. The “Secondary Index” represents the median reported performance for 2013 vintage year secondary funds as reported by Burgiss as of June 30, 2021, which is the most recent data available. This Burgiss benchmark represents median returns of sixteen 2013 vintage secondary funds and is used for purposes of comparison only and should not be understood to mean that there will necessarily be a correlation between the Fund’s returns and this benchmark.
4. Net Cash on Cash Multiple reflects the net cash amounts which actually occur between Fund III and their respective limited partners. For instance, when a capital call and distribution take place on the same day, only the net amount is included in the calculation (as a capital call if the net amount is a negative number, or as a distribution if the net amount is a positive number).
5. DPI is calculated by dividing the total capital distributed to limited partners by total capital called from limited partners
NB Secondary Opportunities Fund III Top Ten Portfolio Companies as of June 30, 2021 (Fair Value)
NB Secondary Opportunities Fund III Performance Commentary
Fund III held a final closing in October 2013 with total aggregate investor commitments of $1,975.5 million. Through June 30, 2021, Fund III had committed $2,140.2 million, or 108%, of the Fund’s committed capital in 111 transactions. Fund III has invested $2,006.7 million into these investments. The portfolio has generated $2,318.8 million of distributions5 and has remaining value of $1,055.6 million. The remaining portfolio is well diversified and currently has approximately 582 underlying companies.
As of June 30, 2021, Fund III had a gross investment multiple (MOIC) of 1.68x and a gross IRR of 21.1%.6 The June 30, 2021 values reflect an aggregate write up in the value of the underlying portfolio of approximately 6.5% for the quarter. While we believe the portfolio in aggregate has
5 Represents cash realizations from investments received by the Fund.
6 Gross returns do not include carried interest, management fees and other expenses of the Fund. Note, net returns will be lower.
continued to perform well and be resilient, we continue to work with the General Partners of the funds in which we invest and with Neuberger Berman’s team of internal industry analysts to monitor and assess the ongoing impact of the pandemic on the SOF III portfolio.7
Crossroads Portfolios: Biographies: Private Investment Portfolios and Co investment Investment Committee “PIPCO”) (Fund XX, XXI, and XXII)
Anthony Tutrone is the Global Head of NB Alternatives and a Managing Director of Neuberger Berman. He is a member of all NB Private Markets’ Investment Committees. Mr. Tutrone is also a member of Neuberger Berman's Partnership, Operating, and Asset Allocation Committees. Prior to Neuberger Berman, from 1994 to 2001, Mr. Tutrone was a Managing Director and founding member of The Cypress Group, a private equity firm focused on middle market buyouts that managed approximately $3.5 billion of commitments. Prior to The Cypress Group, Mr. Tutrone began his career at Lehman Brothers in 1986, starting in Investment Banking and in 1987 becoming one of the original members of the firm’s Merchant Banking Group. This group managed a $1.2 billion private equity fund focused on middle market buyouts. He has been a member of the board of directors of several public and private companies and has sat on the advisory boards of several private equity funds. Mr. Tutrone earned an MBA from Harvard Business School and a BA in Economics from Columbia University.
John Buser is the Executive Vice Chairman of NB Alternatives and a Managing Director of Neuberger Berman. He is also a member of the Private Investment Portfolios, Co investment, Northbound and Secondary Investment Committees. He is Head of Private Market Client Initiatives and previously Mr. Buser was Global Head of Private Investment Portfolios for 13 years. Before joining Neuberger Berman in 1999, Mr. Buser was a partner at the law firm of Akin, Gump, Strauss, Hauer & Feld, LLP, where he had extensive experience in the practice of domestic and international income taxation and complex partnership negotiation during his 17 year tenure. Mr. Buser was admitted to the State Bar of Texas in 1982 after receiving his JD from Harvard Law School. Prior to attending law school, Mr. Buser graduated summa cum laude with a BS in accounting from Kansas State University.
Kent Chen, CFA, is a Managing Director of Neuberger Berman and leader of Neuberger Berman’s private equity efforts in the Asia Pacific region. He is also a member of the Private Investment Portfolios and Co Investment Investment Committee. Mr. Chen joined Neuberger Berman in May 2015 from the Hong Kong Monetary Authority (HKMA) after 17 years of central banking in various positions including Deputy Chief Representative of the HKMA’s New York Office and Advisor to the Executive Director for China at the International Monetary Fund in Washington D.C. From 2008, Mr. Chen helped to establish the HKMA’s private equity program, comprising of global buyout, Asia private equity and global energy investments. Before joining the HKMA in 1998, Mr. Chen was Head of China Research at Daiwa Securities in Hong Kong covering the Chinese stocks market with a focus on infrastructure, energy and power equipment stocks. Mr. Chen has been awarded the Chartered Financial Analyst designation and earned a Master of Public Administration from Columbia University, MBA from University of Hull and BS in Economics from University of London.
Michael Kramer is a Managing Director of Neuberger Berman. He is a member of the Co investment, Credit Opportunities, Marquee Brands and Private Investment Portfolios Investment Committees as well as a member of the Board of Directors for Marquee Brands. Mr. Kramer is currently a board observer for By Light Professional IT Services, which is a portfolio company of our dedicated Co investment funds. Before joining Neuberger Berman in 2006, Mr. Kramer was a vice president at The Cypress Group, a private equity firm with $3.5 billion under management. Prior thereto, he worked as an analyst at PaineWebber Incorporated. Mr. Kramer holds an MBA from Harvard Business School and a BA, cum laude, from Harvard College.
John Massey is the Chairman of the Neuberger Berman Private Investment Portfolios Investment Committee. He is also a member of the Coinvestment Investment Committee. In 1996, Mr. Massey was elected as one of the original members of the board of directors of the PineBridge Fund Group. Mr. Massey is active as a private investor and corporate director. Previously, he was Chairman and CEO of Life Partners Group, Inc., a NYSE listed company. Over the last 35 years, Mr. Massey has also served in numerous executive leadership positions with other publicly held companies including Gulf Broadcast Corporation, Anderson Clayton & Co., and Gulf United Corporation. He began his career in 1966 with Republic National Bank of Dallas as an investment analyst. Mr. Massey currently serves on the boards of several financial institutions, including Central Texas Bankshare Holdings, and Hill Bancshares Holdings, Inc., among others. He is also the principal shareholder of Columbus State Bank in Columbus, Texas and Hill Bank and Trust Company in Weimar, Texas. Mr. Massey received the Most Distinguished Alumnus award from SMU’s Cox School of Business in 1993. In 2009, he and Mrs. Massey were jointly named Most Distinguished Alumnus by The University of Texas from the Dallas/Fort Worth area. He currently serves as Chairman of the Development Board for the University of Texas School of Law and is President Elect of Texas Exes at The University of Texas. He is also active in oil and gas, agricultural and wildlife conservation activities in Colorado County and Matagorda County, Texas. Mr. Massey received a BBA from Southern Methodist University and an MBA from Cornell University. He also earned an LLB from The University of Texas at Austin. He received his Chartered Financial Analyst designation and has been a member of the State Bar of Texas since 1966.
David Morse is a Managing Director of Neuberger Berman and is the Global Co Head of Private Equity Co investments. He is also a member of Co investment, Private Debt and Private Investment Portfolios Investment Committees. Mr. Morse is currently a Board Observer of Behavioral Health Group, C.H. Guenther, CSC, and ProAmpac, all of which are portfolio companies of our dedicated Co investment funds. Mr. Morse joined Lehman Brothers in 2003 as a Managing Director and principal in the Merchant Banking Group where he helped raise and invest Lehman Brothers Merchant Banking Partners III L.P. Prior to joining Lehman Brothers, Mr. Morse was a founding Partner of Hampshire Equity Partners (and its predecessor entities). Founded in 1993, Hampshire is a middle market private equity and corporate restructuring firm with $825 million of committed capital over
7 Subject to Neuberger Berman’s policies and procedures, including certain information barriers within Neuberger Berman that are designed to prevent the misuse by Neuberger Berman and its personnel of material information regarding issuers of securities that has not been publicly disseminated.
three private equity funds. Prior to Hampshire, Mr. Morse worked in GE Capital’s Corporate Finance Group providing one stop financings to middle market buyouts. Mr. Morse began his career in 1984 in Chemical Bank’s middle market lending group. Mr. Morse holds an MBA from the Tuck School of Business at Dartmouth College and a BA in Economics from Hamilton College. Mr. Morse is a member of the MBA Advisory Board of the Tuck School, a member of the Alumni Council of Hamilton College, and a member of the Board of Trustees of the Berkshire School.
Joana Rocha Scaff is a Managing Director of Neuberger Berman, Head of Europe Private Equity and a member of the Private Investment Portfolios, Co Investment, and Secondary Investment Committees. She is also a member of Neuberger Berman’s ESG Advisory Committee. Ms. Rocha Scaff has over 20 years of experience in financial markets, the majority of which in private equity investing and prior to that in investment banking. She has been with the firm since 2005. Prior to NB Private Markets, Ms. Rocha Scaff worked in the investment banking division of Lehman Brothers, and prior to that at Citigroup Global Markets and Espirito Santo Investment Bank. She advised on corporate transactions including M&A, financial restructurings and public equity and debt offerings in the United States, Europe and Brazil. Ms. Rocha Scaff received her MBA from Columbia Business School and her BA in Business Management and Administration from the Universidade Catolica of Lisbon. Ms. Rocha Scaff is the current Vice Chair of the LP Committee of the BVCA British Private Equity Association and is a member of the Limited Partner Advisory Committee of multiple European private equity funds.
Jonathan D. Shofet is the Global Head of the Firm’s Private Investment Portfolios group and is a Managing Director of Neuberger Berman. He is also a member of the Private Investment Portfolios and Co investment Investment Committee. Prior to joining Neuberger Berman in 2005, Mr. Shofet was a member of the Lehman Brothers Private Equity division, focusing on mid through late stage equity investments primarily in the technology, communications and media sectors. Prior to that, Mr. Shofet was a member of the Lehman Brothers Investment Banking division, where he focused on public and private financings, as well as strategic advisory in the real estate, technology and utility sectors. Mr. Shofet has been, or currently sits, on the Limited Partner Advisory Boards of a number of funds including those managed by Amulet Capital, Beacon Capital Partners, Castlelake, Cerberus Institutional Partners, Clearlake Capital, ComVest Investment Partners, DFW Capital, Oak Hill Capital Partners, Platinum Equity, Thomas H. Lee Partners and Vector Capital Partners. He has also been a Board Observer for several private companies. Mr. Shofet holds a BA from Binghamton University, where he graduated summa cum laude, Phi Beta Kappa.
Brien Smith is a Managing Director of Neuberger Berman and the Chief Operating Officer of the Neuberger Berman Private Equity Division. He is a member of the investment committees for the Private Investment Portfolios, Co investment and Private Debt programs. Mr. Smith is a member of Neuberger Berman’s Operating Committee. Mr. Smith is also a member of Neuberger Berman’s Investment Risk and Operational Risk Committees. Prior to joining Neuberger Berman in 2001, Mr. Smith worked in the middle market private equity firm Mason Best Company, L.P., and its affiliates. Mr. Smith began his career at Arthur Andersen & Co. Mr. Smith is a life member of the Red McCombs School of Business Advisory Council at the University of Texas at Austin. Mr. Smith also currently serves on the board of the Texas Exes Alumni Association and chairs its investment committee. He serves and has served on a number of other boards of directors. Mr. Smith received a Master’s in Professional Accounting and a BBA from the University of Texas at Austin.
David Stonberg is a Managing Director of Neuberger Berman and is the Global Co Head of Private Equity Co investments. He is also a member of the Co investment, Private Investment Portfolios, Renaissance, Secondary and Real Estate Secondary Investment Committees. Before joining Neuberger Berman in 2002, Mr. Stonberg held several positions within Lehman Brothers’ Investment Banking Division including providing traditional corporate and advisory services to clients as well as leading internal strategic and organizational initiatives for Lehman Brothers. Mr. Stonberg began his career in the Mergers and Acquisitions Group at Lazard Frères. Mr. Stonberg holds an MBA from the Stern School of New York University and a BSE from the Wharton School of the University of Pennsylvania.
Elizabeth Traxler is a Managing Director of Neuberger Berman and a senior member of the Private Investment Portfolios & Co investments team. She is also a member of the Private Investment Portfolios and Co investments Investment Committee and the Secondary Investment Committee. Prior to joining Neuberger Berman in 2008, Ms. Traxler was at Wachovia Capital Partners (now known as Pamlico Capital), where she focused on making direct growth equity and buyout investments across a broad range of industries. Ms. Traxler also worked at Wachovia Securities in the Leveraged Capital Group, which provided senior and mezzanine debt for private equity backed transactions. She is currently a Board Observer for several private companies and Advisory Board member for a number of private equity funds. Ms. Traxler received an MBA from the Kellogg School of Management at Northwestern University and a BA, cum laude, in Economics from Vanderbilt University.
Peter von Lehe, JD, is the Head of Investment Solutions and Strategy and is a Managing Director of Neuberger Berman. He is also a member of the Athyrium, Co investment, Private Investment Portfolios, Marquee Brands and Renaissance Investment Committees, as well as a member of the NB Insurance Linked Strategies Underwriting Committee and a Chairman of NB Reinsurance Ltd. Mr. von Lehe sits on the Limited Partner Advisory Boards of a number of investment relationships globally on behalf of Neuberger Berman funds. Previously, Mr. von Lehe was a Managing Director and Deputy Head of the Private Equity Fund of Funds unit of Swiss Reinsurance Company. At Swiss Re, Mr. von Lehe was responsible for investment analysis and product structuring and worked in both New York and Zurich. Before that, he was an attorney with the law firm of Willkie Farr & Gallagher LLP in New York focusing on corporate finance and private equity transactions. He began his career as a financial analyst for a utility company, where he was responsible for econometric modeling. Mr. von Lehe received a BS with Honors in Economics from the University of Iowa and a JD with High Distinction, from the University of Iowa College of Law. He is a member of the New York Bar.
Jacquelyn Wang is a Managing Director of Neuberger Berman and a senior member of the private equity investment team. She is also a member of the Private Investment Portfolios and Co investment Investment Committee. Ms. Wang joined Neuberger Berman in 2007, focusing on direct Co investments, Primary Investments and Secondary Investments. Prior to joining Neuberger Berman, Ms. Wang worked in Corporate Development at
Verizon Communications focused on corporate M&A. Previously, Ms. Wang worked at Spectrum Equity Investors, where she was responsible for sourcing, executing and evaluating buyout and growth equity investments in media, technology and telecom. Ms. Wang began her career in the investment banking division of Lehman Brothers advising on corporate transactions in the communications and media industries. Ms. Wang received an MBA from The Wharton School of the University of Pennsylvania and a BA with honors from The Johns Hopkins University.
Patricia Miller Zollar is a Managing Director of Neuberger Berman and a leader of the Firm’s Private Investment Portfolios practice. She is a member of the Co Investment and Private Investment Portfolios Investment Committees. Additionally, Ms. Zollar sits on the limited partner advisory boards of a number of funds. Before rejoining Neuberger Berman in 2004, Ms. Zollar was a vice president in the Asset Management Division of Goldman Sachs. Ms. Zollar began her career as a Certified Public Accountant in the Audit Division of Deloitte & Touche. She received her MBA from Harvard Business School and her BS, with highest distinction, from North Carolina A&T State University, where she is Chairperson Emeritus of the Board of Trustees and the recipient of an honorary Doctorate degree. Ms. Zollar is a member of the Executive Leadership Council, the Harvard Business School Alumni Board and was a former member of the executive board of the National Association of Investment Companies. She serves as Vice Chairman of The Apollo Theater and a member of the Investment Committee of the Robert Wood Johnson Foundation’s Board of Trustees.
INVESTMENT SUMMARIES
NB Crossroads Fund XX – Asset Allocation LP
NB Crossroads Fund XX is our 20th private investment program and continued to offer clients best in class portfolios that tactically allocated to attractive strategies by investing with high quality GPs and managing risk through diversification, manager selection and securing key legal rights. Crossroads Fund XX purchased limited partner interests in more mature private equity funds in the secondary market and co invested directly in transactions alongside high quality private equity firms. Crossroads Fund XX is diversified across four strategic asset classes: (i) small and mid cap buyout; (ii) special situations (primarily distressed oriented strategies); (iii) venture and growth capital; and (iv) large cap buyout.
STATEMENT OF CHANGES IN INDIVIDUAL PARTNER'S CAPITAL- UNAUDITED (1)
For the Six Month Period Ended June 30, 2021 The Salvation Army, A Georgia Corporation
1. Note that the information contained in this Statement of Changes in Individual Partner’s Capital was extracted from the accounting books and records used to compile the June 30, 2021 financial statements of the Fund. This Statement of Changes in Individual Partner’s Capital has not been audited.
2. Expenses incurred directly by NB Crossroads Fund XX Asset Allocation LP and its related holding funds are included in Net investment income (loss).
3. Expenses incurred by the underlying investment partnerships held by NB Crossroads Fund XX holding funds are included in Net realized gain (loss) on investments.
Fund XX Overview
Fund XX held a final closing on June 30, 2014 with aggregate investor commitments of $904.1 million8. Through June 30, 2020, Fund XX had committed $927 7 million or 102% of the Funds committed capital in 115 closed transactions and had deployed 72%9 of the committed capital to investments. The transactions at that date included 52 primary commitments, 14 secondary commitments, and 49 co investments. As of June 30, 2021, the gross IRR was 20.6% and the net IRR was 17.1% and the gross multiple was 2.03x and the net multiple was 2.30x 10 Fund XX has received a total of $682.2 million of distributed capital from underlying investments since inception as of June 30, 2021.

LTM 2Q2021 Activity
None, NB Crossroads Fund XX is no longer in the investment period but is in the harvesting phase Fund XX received $252 7 million of distributed capital from underlying investments over the past twelve months as of June 20, 2021.
Deal Pipeline
At this point, the Fund XX is fully committed and is no longer investing
8 Final closing occurred on June 30, 2014 with a limited extension approved by the LPAC for certain specific investors who closed no later than September 30, 2014.
9 As of June 30, 2019.
10 Reflects pooled performance of all Asset Allocation investors across all feeders in NB Crossroads Fund XX. Gross performance is calculated on a weighted allocation basis per the commitments to each asset class.
Fund XX Performance Commentary
NB Crossroads Fund XX is currently held at a 2.03x gross multiple and 2.30x net multiple based on the pooled performance of all Asset Allocation investors across all feeders in NB Crossroads Fund XX. Crossroads XX Fund as of June 30, 2021. Fund XX is over 100% committed and 72% deployed as of September 30, 2021. Primaries within the NB Crossroads Fund XX portfolio have delivered a 23.3% gross IRR, the funded primaries have delivered a 19.0% gross IRR, the co-investments within the portfolio have delivered a 16.0% gross IRR and the secondaries have delivered a 21.4% gross IRR. Significant value has been driven by the venture capital and growth equity asset class delivering a 3.31x gross multiple as of June 30, 2021.
RELATIVE PERFORMANCE VERSUS BENCHMARKS
Note: NB Crossroads Fund XX performance as of June 30, 2021. The median multiple of invested capital and median IRR of Burgiss Fund of Funds Index as of June 30, 2021. Burgiss data provided at no charge The benchmark performance is presented for illustrative purposes only to show general trends in the market for the relevant periods shown. The investment objectives and strategies of each fund in the benchmark may be different than the investment objectives and strategies of NB Crossroads Fund XX and may have different risk and reward profiles. A variety of factors may cause this comparison to be an inaccurate benchmark for any particular fund and the benchmarks do not necessarily represent the actual investment strategy of a fund. It should not be assumed that any correlations to the benchmark based on historical returns would persist in the future. Indexes are unmanaged and are not available for direct investment. Investing entails risks, including possible loss of principal. PME analysis considers the hypothetical return to an investor based on purchasing units of an index at the dates of the respective net cash flows, which is meant to show how the public index performs over the time period. This analysis also takes into consideration the ending price of the index at the valuation date. Please note that the index used for comparison purposes may not actually be available for purchase. Past performance is not indicative of future results. Please refer to Endnotes attached. Reflects pooled performance of all Asset Allocation investors across all feeders in NB Crossroads Fund XX, net of GP and LP fees and carry.
NB CROSSROADS FUND XXI ASSET ALLOCATION LP
NB Crossroads Fund XXI is our 21st private investment program and will continue to offer clients best in class portfolios that tactically allocate to attractive strategies by investing with high quality GPs and managing risk through diversification, manager selection and securing key legal rights. Crossroads Fund XXI will also seek to purchase limited partner interests in more mature private equity funds in the secondary market and to co invest directly in transactions alongside high quality private equity firms. Crossroads Fund XXI will be diversified across four strategic asset classes: (i) small and mid cap buyout; (ii) special situations (primarily distressed oriented strategies); (iii) venture and growth capital; and (iv) large cap buyout.

STATEMENT OF CHANGES IN INDIVIDUAL PARTNER'S CAPITAL UNAUDITED (1)
For the Six Month Period Ended June 30, 2021 The Salvation Army, A Georgia Corporation
1. Note that the information contained in this Statement of Changes in Individual Partner’s Capital was extracted from the accounting books and records used to compile the June 30, 2021 financial statements of the Fund. This Statement of Changes in Individual Partner’s Capital has not been audited.
2. Expenses incurred directly by NB Crossroads Fund XXI Asset Allocation LP and its related holding funds are included in Net investment income (loss).
3. Expenses incurred by the underlying investment partnerships held by NB Crossroads Fund XXI holding funds are included in Net realized gain (loss) on investments.
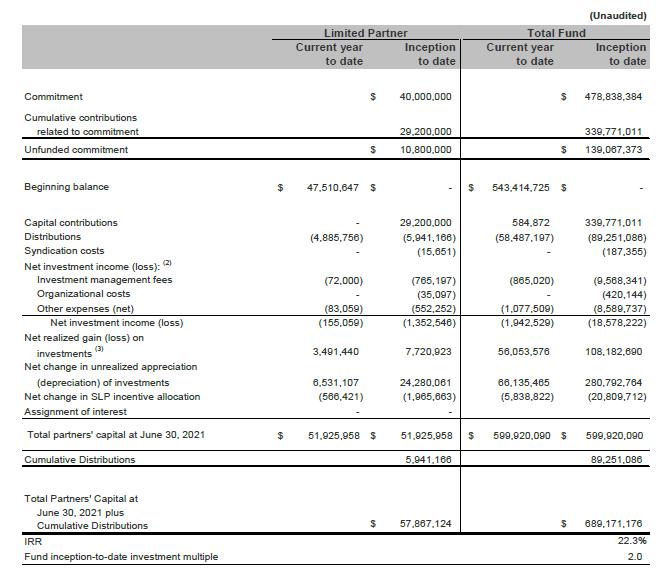
Fund XXI Overview
Fund XXI closed on October 15, 2016 with $832 million commitments. Through June 30, 2021, Fund XXI had committed $872.0 million of the Funds committed capital in 130 transactions. The transactions at that date included 55 primary commitments, 8 secondary commitments, and 67 co investments. As of June 30, 2021, gross IRR was 25.0% with a net IRR of 22.06% and the gross multiple was 1.87x and the new multiples was 1.96x 11 Fund XXI has received a total of $371.3 million of distributed capital from underlying investments since inception as of June 30, 2021
LTM 2Q2021 Activity
None, NB Crossroads Fund XXI is no longer in the investment period but is in the harvesting phase Fund XXI received $208.8 million of distributed capital from underlying investments over the past twelve months as of June 30, 2021.
Deal Pipeline
At this point, the Fund XXI is over 100% committed due to reinvestment of early proceeds.
11 Note: As of June 30, 2021. Past performance is not indicative of future results. Reflects pooled performance of all Asset Allocation investors across all feeders in NB Crossroads Fund XXI. Gross performance is calculated on a weighted allocation basis per the commitments to each asset class.
Fund XXI Performance Commentary
NB Crossroads Fund XXI is currently held at a 1.87x gross multiple and 1.96x net multiple based on the pooled performance of all Asset Allocation investors across all feeders in NB Crossroads Fund XXI as of June 30, 2021 Fund XXI is over 100% committed and 74% deployed as of September 30, 2021. Early value creation has come through funded primaries and co investments. Primaries within the Fund XXI portfolio have delivered a 26.8% gross IRR and co-investments within the portfolio have a 22.9% gross IRR to date while secondaries have generated a 18.3% gross IRR. The venture capital and growth equity portfolio along with the special situations portfolio have delivered attractive returns for Crossroads Fund XXI. The venture capital and growth equity investments have a 28.9% gross IRR and the special situations investments have delivered a 27.6% gross IRR as of June 30, 2021. The inclusion of co investments at 29% of the portfolio has helped lift the overall returns as the gross TVPI for co investments is 2.0x as of June 30, 2021
RELATIVE PERFORMANCE VERSUS BENCHMARKS
Note: NB Crossroads XXI Fund performance as of June 30, 2021. The median multiple of invested capital and median IRR of Burgiss Fund of Funds Index as of June 30, 2021. Burgiss data provided at no charge. The benchmark performance is presented for illustrative purposes only to show general trends in the market for the relevant periods shown. The investment objectives and strategies of each fund in the benchmark may be different than the investment objectives and strategies of NB Crossroads Fund XXI, and may have different risk and reward profiles. A variety of factors may cause this comparison to be an inaccurate benchmark for any particular fund and the benchmarks do not necessarily represent the actual investment strategy of a fund. It should not be assumed that any correlations to the benchmark based on historical returns would persist in the future. Indexes are unmanaged and are not available for direct investment. Investing entails risks, including possible loss of principal. PME analysis considers the hypothetical return to an investor based on purchasing units of an index at the dates of the respective net cash flows, which is meant to show how the public index performs over the time period. This analysis also takes into consideration the ending price of the index at the valuation date. Please note that the index used for comparison purposes may not actually be available for purchase. Past performance is not indicative of future results. Please refer to Endnotes attached.

1. Reflects pooled performance of all Asset Allocation investors across all feeders in NB Crossroads Fund XXI, net of GP and LP fees and carry.
NB CROSSROADS FUND XXII ASSET ALLOCATION LP
NB Crossroads Fund XXI is our 22nd private investment program and will continue to offer clients best-in-class portfolios that tactically allocate to attractive strategies by investing with high quality GPs and managing risk through diversification, manager selection and securing key legal rights. Crossroads Fund XXII will also seek to purchase limited partner interests in more mature private equity funds in the secondary market and to co invest directly in transactions alongside high quality private equity firms. Like its predecessor funds, Crossroads Fund XXII will be diversified across four strategic asset classes: (i) small and mid cap buyout; (ii) special situations (primarily distressed oriented strategies); (iii) venture and growth capital; and (iv) large cap buyout.
STATEMENT OF CHANGES IN INDIVIDUAL PARTNER'S CAPITAL- UNAUDITED (1)
For the Six Month Period Ended June 30, 2021 The Salvation Army, A Georgia Corporation
1. Note that the information contained in this Statement of Changes in Individual Partner’s Capital was extracted from the accounting books and records used to compile the June 30, 2021 financial statements of the Fund. This Statement of Changes in Individual Partner’s Capital has not been audited.
2. Expenses incurred directly by NB Crossroads Fund XXII Asset Allocation LP and its related holding funds are included in Net investment income (loss).
3. Expenses incurred by the underlying investment partnerships held by NB Crossroads Fund XXII are included in Net realized gain (loss) on investments.

Fund XXII Overview
Fund XXII held a final close on March 22, 2019. Through June 30, 2021, Fund XXII had committed $1,220.0 million of the Funds committed capital in 131 closed investments. The closed transactions at that date included 39 primary commitments, 12 secondary commitments, and 80 co investments. As of June 30, 2021, gross IRR was 34.5% with a net IRR of 29.5% and the gross multiple was 1.64x and the net multiple was 1.71x 12 Fund XXII has received a total of $262.5 million of distributed capital from underlying investments since inception as of September 30, 2021.
LTM 2Q2020Activity
Fund XXII has committed over 100% of the fund Fund XXII received $208.8 million of distributed capital from underlying investments over the past twelve months as of June 30, 2021.
Deal Pipeline
As of June 30, 2021, Fund XXII has committed over 100% of the fund and deployed 74% of its capital
12 Note: As of June 30, 2021. Past performance is not indicative of future results. Reflects performance of all Asset Allocation Investors across all feeders in NB Crossroads Fund XXII. Gross performance is calculated on a weighted allocation basis per the commitments to each asset class.
Fund XXII Performance Commentary
We are pleased with the performance to date of the fund. NB Crossroads Fund XXII is currently held at a 1.64x gross multiple and 1.71x net multiple based on the pooled performance of all Asset Allocation investors across all feeders in NB Crossroads Fund XXII as of June 30, 2021. Primaries in the portfolio have delivered 34.4% gross IRR and co investments have delivered a 35.0% gross IRR, and secondaries within the portfolio have delivered 38.3% gross IRR as of June 30, 2021 The venture capital and growth equity investments have also delivered attractive returns for Crossroads Fund XXII with a 42.3% gross IRR as of June 30, 2021. Our strategy remains to create early value creation through funded primaries, co investments and secondary investments.
The information contained herein must be treated in a confidential manner and may not be reproduced, used or disclosed, in whole or in part, without the prior written consent of the Adviser or the Fund. Disclosure to persons other than the recipient potential Investor and their representatives is prohibited.
This presentation (the "Presentation") is being furnished on a confidential basis to a sophisticated investor for informational and discussion purposes only and does not constitute an offer to sell or a solicitation of an offer to purchase any security. Any such offer or solicitation shall be made pursuant to additional documentation relating to the Fund, which documentation describes risks related to an investment in the Fund as well as other important information about the Fund and its sponsor. The information set forth herein does not purport to be complete and is subject to change. This Presentation is qualified in its entirety by all of the information set forth in any such additional documentation. This Presentation does not constitute a part of any offering documentation of any Fund. Please refer to the Memorandum for important disclosures regarding various risks related to investment in the Fund. An investment in the Fund involves significant risks, including the risk of total loss of capital.
This presentation may include information from other funds managed by the Adviser and its predecessors in interest. Neuberger Berman and its affiliates are the successor to all of the predecessors’ operational assets, and employ substantially all of their key personnel, and the Adviser became either the advisor or sub advisor to the funds previously advised by the predecessors. Historical information contained herein is for illustrative purposes only; such information is based on market and other conditions at the time that may significantly change, and should not be relied upon. Past performance is not indicative of future results. There can be no assurance that investments marked with the footnote “Pending investments in process of documentation” will close, or that any of the terms of such transactions described herein or under discussion will be achieved. There can be no assurance that the Fund will achieve comparable results, that targeted diversification or asset allocations will be met or that the Fund will be able to implement its investment strategy and investment approach or achieve its investment objective.
Where an unrealized investment has been valued by the general partner of the fund, there can be no assurance that these values will ultimately be realized upon disposition of the investments. The values of unrealized investments are estimated, inherently uncertain and subject to change. Actual returns on unrealized investments will depend on, among other factors, future operating results, the value of the assets and market conditions at the time of disposition, legal and contractual restrictions on transfer that may limit liquidity, any related transaction costs and the timing and manner of sale, all of which may differ from the assumptions and circumstances on which the valuations used in the prior performance data contained herein are based. Accordingly, actual realized returns on unrealized investments may differ materially from the returns indicated herein.
Statements contained in this Presentation that are not historical facts are based on current expectations, estimates, projections, opinions and beliefs of the General Partner. Such statements involve known and unknown risks, uncertainties and other factors, and undue reliance should not be placed thereon. In addition, this Presentation contains "forward looking statements." Actual events or results or the actual performance of the Fund may differ materially from those reflected or contemplated in such forward looking statements. No presentation or warranty is made as to future performance or such forward looking statements. Financial or other projections described herein are illustrative and intended for discussion purposes only. Alternative assumptions may result in significant differences in such illustrative projections. Opportunities described in such illustrative projections may not be found nor is prospective performance of the type described guaranteed, and the Fund may not be able to achieve its objective or implement its strategy. Certain economic and market information contained herein has been obtained from published sources prepared by third parties and in certain cases has not been updated through the date hereof. While such sources are believed to be reliable, neither the Fund, its General Partner, the Adviser nor their respective affiliates or employees assume any responsibility for the accuracy or completeness of such information. Unless otherwise indicated, returns are presented on a “gross” basis (i.e. they do not reflect the management fees, carried interest, transaction costs and other expenses that may be paid by Investors, which may be significant and may lower returns).
Neither Neuberger Berman nor any of its affiliates have made any representation or warranty, express or implied, with respect to the fairness, correctness, accuracy, reasonableness or completeness of any of the information contained herein (including but not limited to information obtained from third parties unrelated to Neuberger Berman), and they expressly disclaim any responsibility or liability therefore. In particular, no third party has prepared, reviewed or approved the information contained herein and, accordingly, no third party has made any representation or warranty, express or implied, with respect to the fairness, correctness, accuracy, reasonableness or completeness of any portion of the information contained herein. Neither Neuberger Berman nor any of its affiliates have any responsibility to update any of the information provided in this summary document. Fund terms described herein are summaries only and may be incomplete. Such summaries are qualified in their entirety by the Memorandum and fund documents, including the Partnership Agreement, which may change without notice.
These materials and the information contained herein are not, and under no circumstances are to be construed as, an advertisement or a public offering of securities in Canada or any province or territory thereof. Under no circumstances are these materials and the information contained herein to be construed as an offer to sell securities or as a solicitation of an offer to buy securities in any jurisdiction of Canada. Any offer or sale of the securities described herein in Canada will be made only under an exemption from the requirements to file a prospectus with the relevant Canadian securities regulators and only by a dealer properly registered under applicable securities laws or, alternatively, pursuant to an exemption from the deal registration requirement in the relevant province or territory of Canada in which such offer or sale is made. No securities commission or similar regulatory authority in Canada has reviewed or in any way passed upon the merits of the investments described herein and any representation to the contrary is an offence. In Canada, NB Alternatives Advisers LLC relies on the “international investment fund manager exemption” under Multilateral Instrument 32 102 Registration Exemptions For Non Resident Investment Fund Managers in Ontario, Quebec and Newfoundland and Labrador, and the “international adviser exemption” under National Instrument 31 103 Registration Requirements, Exemptions and Ongoing Registrant Obligations in Ontario. This material is general in nature and is not directed to any category of investors and should not be regarded as individualized, a recommendation, investment advice or a suggestion to engage in or refrain from any investment related course of action. Neuberger Berman is not providing this material in a fiduciary capacity and has a financial interest in the sale of its products and services. Investment decisions and the appropriateness of this material should be made based on an investor's individual objectives and circumstances and in consultation with his or her advisors. This material may not be used for any investment decision in respect of any U.S. private sector retirement account unless the recipient is a fiduciary that is a U.S. registered investment adviser, a U.S. registered broker dealer, a bank regulated by the United States or any State, an insurance company licensed by more than one State to manage the assets of employee benefit plans subject to ERISA, or, if subject to Title I of ERISA, a fiduciary with at least $50 million of client assets under management and control, and in all cases financially sophisticated, capable of evaluating investment risks independently, both in general and with regard to particular transactions and investment strategies. This means that “retail” retirement investors are expected to engage the services of an advisor in evaluating this material for any investment decision. If your understanding is different, we ask that you inform us immediately.
© 2021 NB Alternatives Advisers LLC
DISCLAIMER
EmergingMarkets Equity

November2021
AUMby StrategyType Emerging Markets 59% Global 41%
thefewassetmanagementfirmstobuildaglobal franchisefromemergingmarketorigins. 1,174 Permanentemployees 241 Investmentprofessionals WithInvestmentandOperationalhubsin NewYork,London,Luxembourg,Cape Town,HongKong,SingaporeandSydney GlobalAUM trulyunique NinetyOneisona journey 59% dedicatedtoemergingmarkets …with 15yearsaverage seniormanagementtenure US$192billion Source: Ninety One. All figures shown are as of June 30, 2021 unless otherwise stated. AUM excludes SA fund platform AUM of ~$11.5 billion. *Employee information and AUM by strategy type are as of March 31, 2021. Due to Ninety One’s earnings release schedule, much of our firm-related information can only be provided as of March 31, 2021 or June 30, 2021. Information as of September 30, 4Factor Capability US$71.7bn 4FactorEmerging MarketsEquity Strategy US$11.7bn
LaunchedinSouthAfricain1991,weareoneof
Firmeventsoverthe12monthsendingSeptember30,2021
NinetyOneBoard
TherewasachangetotheNinetyOneBoardofDirectors-resignationof FaniTitiandtheappointmentofKhumoShuenyaneinAugust2021.
Personnelchanges
Nochangetothe4FactorPMs.
Thefollowingsignificantnon-investmentpersonneladditionsoccurred duringthepast12months:
SandyWelthagen–GlobalHeadofProductDevelopment
InSeptember2020,KhadeejaBassier,previouslyourGlobalHeadof ProductandStrategicChange,waspromotedtoChiefOperatingOfficer andSandyWelthagenwaspromotedtoGlobalHeadofProduct DevelopmenteffectiveNovember1,2020.
CathyGibson–GlobalHeadofTrading
CathyGibsonwasappointedasourLondon-basedGlobalHeadofTrading toleadthesupportofourglobalinvestmentteamsinJanuary2021.Cathy GibsonhasextensiveFixedIncomeandMulti-Assetexperienceandhas18 yearsofinvestmentexperience,mostrecentlyheadingupdealingatRoyal LondonAssetManagement.DougBlatchremainsCapeTown-basedand willbeinstrumentalinsupportingCathytoensurethatwefuture-proofour abilitytoaccessliquidityappropriately.
RichardBrearley–HeadofCompliance
RichardjoinedinJanuary2021asHeadofCompliancefortheUnited Kingdom,Europe,andAsiaandisbasedintheLondonoffice.Priorto joiningthefirm,Richardspentfiveyearsasregionalheadofcompliancein EMEAattheMacquarieGroupwherehehadcomplianceresponsibilityfor theirsellsidebusinesses(salesandtrading,investmentbanking,lending, andleasing)andtheirbuysidebusinesses(investmentmanagement, infrastructure,andrealassets).BeforethisRichardspentnineyearsas headoflegalandcomplianceforInvestecPlcinLondon.
MalcolmFried–ChiefMarketingOfficer
WewelcomedMalcolmFriedtoNinetyOneasourChiefMarketingOfficer (CMO)inMarch2021.MalcolmjoinedusfromtheInvestecGroupwhere hewastheCMOforthelast5yearsandinthisrole,hewasveryclosely involvedinthedevelopmentofournewnameandbrand.
NinetyOne–SignificantEvents(10/1/2020–9/30/2021)
TheSalvationArmySouthernTerritory Inceptiondate 12/6/2018 Valuation $34,932,848 Investmentstrategy 4FactorEmergingMarketsEquity Comparativeindex MSCIEmergingMarketsIndexNDR Performancetarget 2to3%perannum,grossoffees,overarollingthree-yearperiod For further information on indices, investment process and performance target, please see the Important Information section. YourMandate InvestmentSummaryasofSeptember30,2021
Teamunitedbyacommonlanguage
Globalandregionalspecialistsandsupportstructure


Theinvestmentteamissubjecttochangenotnecessarilywithpriornotification.Asat30September2021.
Forfurtherinformationonindices,investmentprocessandperformancetarget,pleaseseetheImportantInformationsection.
Philosophy
Characteristicswebelievedrivelong-termoutperformance
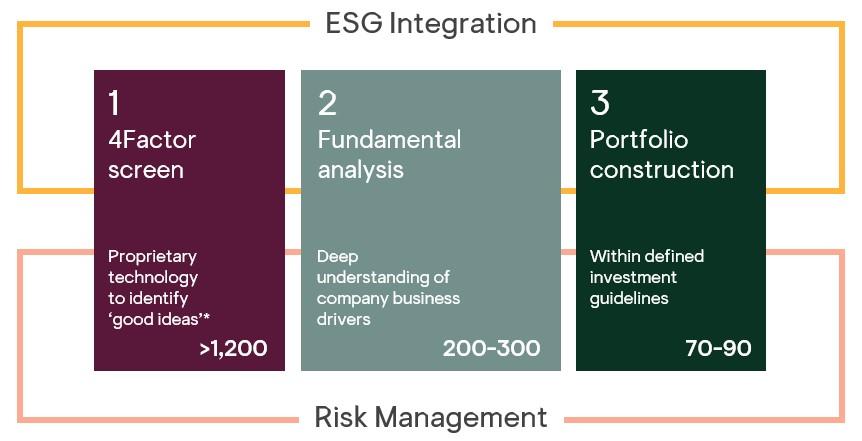

TheSalvationArmy,SouthernTerritory-Performance
AsofSeptember30,2021
Portfolio -8.5% 0.0% 19.9% 12.1% Comparisonindex** -8.1% -1.3% 18.2% 11.8% RelativePerformance-0.4% 1.2% 1.7% 0.3%
Portfolio 16.4% 20.9% Comparisonindex** 18.3% 18.4% RelativePerformance-1.9% 2.5%
Past performance is not a reliable indicator of future results, losses may be made.
Source: Ninety One, September 30, 2021, returns are stated net of fees in USD
* Inception date: December 6, 2018
** Comparison index: MSCI Emerging Markets Index NDR For further information on indices, please see the Important Information section.
Annualized(Net)Performance-Periodic -8.5% 0.0% 19.9% 12.1% -8.1% -1.3% 18.2% 11.8% 3Months YTD 1Year SinceInceptionp.a. PortfolioBenchmark
Annualized(Net)Performance–CalendarYear 2020 2019
Importantinformation
Thiscommunicationisforinstitutionalinvestorsandfinancialadvisorsonly.Itisnottobedistributedtothepublicorwithin acountrywheresuchdistributionwouldbecontrarytoapplicablelaworregulations.
Theinformationmaydiscussgeneralmarketactivityorindustrytrendsandisnotintendedtoberelieduponasaforecast, researchorinvestmentadvice.TheeconomicandmarketviewspresentedhereinreflectNinetyOne’sjudgmentasatthe dateshownandaresubjecttochangewithoutnotice.Thereisnoguaranteethatviewsandopinionsexpressedwillbe correctandmaynotreflectthoseofNinetyOneasawhole,differentviewsmaybeexpressedbasedondifferent investmentobjectives.Althoughwebelieveanyinformationobtainedfromexternalsourcestobereliable,wehavenot independentlyverifiedit,andwecannotguaranteeitsaccuracyorcompleteness(ESG-relateddataisstillatanearlystage withconsiderablevariationinestimatesanddisclosureacrosscompanies.Doublecountingisinherentinallaggregate carbondata).NinetyOne’sinternaldatamaynotbeaudited.NinetyOnedoesnotprovidelegalortaxadvice.Prospective investorsshouldconsulttheirtaxadvisorsbeforemakingtax-relatedinvestmentdecisions.
Nothinghereinshouldbeconstruedasanoffertoenterintoanycontract,investmentadvice,arecommendationofany kind,asolicitationofclients,oranoffertoinvestinanyparticularfund,product,investmentvehicleorderivative. Investmentinvolvesrisks.Pastperformanceisnotindicativeoffutureperformance.Anydecisiontoinvestinstrategies describedhereinshouldbemadeafterreviewingtheofferingdocumentandconductingsuchinvestigationasaninvestor deemsnecessaryandconsultingitsownlegal,accountingandtaxadvisorsinordertomakeanindependentdetermination ofsuitabilityandconsequencesofsuchaninvestment.Thismaterialdoesnotpurporttobeacompletesummaryofallthe risksassociatedwiththisStrategy.AdescriptionofrisksassociatedwiththisStrategycanbefoundintheofferingorother disclosuredocuments.Copiesofsuchdocumentsareavailablefreeofchargeuponrequest.
IntheUS,thiscommunicationshouldonlybereadbyInstitutionalInvestors(AccreditedInvestorsandQualified Purchasers),FinancialAdvisors(FINRA-registeredBrokerDealers)and,attheirexclusivediscretion,theireligibleclients.It mustnotbedistributedtoUSPersonsapartfromtheaforementionedrecipients.THISINVESTMENTISNOTFORSALETO USPERSONSEXCEPTACCREDITEDINVESTORSANDQUALIFIEDPURCHASERS.Notethatreturnswillbereducedby managementfeesandthatinvestmentadvisoryfeescanbefoundinFormADVPart2A.
InAustralia,thisdocumentisprovidedforgeneralinformationonlytowholesaleclients(asdefinedintheCorporationsAct 2001).
NinetyOneBotswana(Pty)Ltd,Unit5,Plot64511,Fairgrounds,Gaborone,Botswana,isregulatedbytheNon-Bank FinancialInstitutionsRegulatoryAuthority.InNamibia,NinetyOneNamibia(Pty)LtdisregulatedbytheNamibiaFinancial InstitutionsSupervisoryAuthority.InSouthAfrica,NinetyOneisanauthorisedfinancialservicesprovider.
Exceptasotherwiseauthorised,thisinformationmaynotbeshown,copied,transmitted,orotherwisegiventoanythird partywithoutNinetyOne’spriorwrittenconsent.©2021NinetyOne.Allrightsreserved.IssuedbyNinetyOne,October 2021.
Additionalinformationonourinvestmentstrategiescanbeprovidedonrequest.
InvestmentTeam
ThereisnoassurancethatthepersonsreferencedhereinwillcontinuetobeinvolvedwithinvestingforthisStrategyor Fund,orthatotherpersonsnotidentifiedhereinwillbecomeinvolvedwithinvestingassetsfortheManagerorassetsof theStrategyortheFundatanytimewithoutnotice.Referencestospecificandperiodicteammeetingsarenotguaranteed tobeheldorfullyattendedduetoreasonableprioritydrivencircumstancesandholidays.
InvestmentProcess
Anydescriptionorinformationregardinginvestmentprocessorstrategiesisprovidedforillustrativepurposesonly,may notbefullyindicativeofanypresentorfutureinvestmentsandmaybechangedatthediscretionofthemanagerwithout notice.Referencestospecificinvestments,strategiesorinvestmentvehiclesareforillustrativepurposesonlyandshould notberelieduponasarecommendationtopurchaseorsellsuchinvestmentsortoengageinanyparticularStrategy. Portfoliodataisexpectedtochangeandthereisnoassurancethattheactualportfoliowillremainasdescribedherein. Thereisnoassurancethattheinvestmentspresentedwillbeavailableinthefutureatthelevelspresented,withthesame characteristicsorbeavailableatall.Pastperformanceisnoguaranteeoffutureresultsandhasnobearingupontheability ofManagertoconstructtheillustrativeportfolioandimplementitsinvestmentstrategyorinvestmentobjective.
PerformanceTarget
ThetargetisbasedonManager’sgoodfaithestimateofthelikelihoodoftheperformanceoftheassetclassundercurrent marketconditions.TherecanbenoassurancesthatanyStrategyorFundwillgeneratesuchreturns,thatanyclientor investorwillachievecomparableresultsorthatthemanagerwillbeabletoimplementitsinvestmentstrategy.Actual performanceofFundinvestmentsandtheFundoverallmaybeadverselyaffectedbyavarietyoffactors,beyondthe manager’scontrol,suchas,politicalandsocio-economicevents,adversechangesintheinterestrateenvironment, changestoinvestmentexpenses,andalackofsuitableinvestmentopportunities.Accordingly,targetreturnsmaybe expectedtochangeovertimeandmaydifferfrompreviousreports.
SpecificPortfolioNames
Referencestoparticularinvestmentsorstrategiesareforillustrativepurposesonlyandshouldnotbeseenasabuy,sellor holdrecommendation.Unlessstatedotherwise,thespecificcompanieslistedordiscussedareincludedasrepresentative oftheStrategyorStrategies.Suchreferencesarenotacompletelistandotherpositions,strategies,orvehiclesmay experienceresultswhichdiffer,perhapsmaterially,fromthosepresentedhereinduetodifferentinvestmentobjectives, guidelinesormarketconditions.Thesecuritiesorinvestmentproductsmentionedinthisdocumentmaynothavebeen registeredinanyjurisdiction.Moreinformationisavailableuponrequest.
Indices
Indicesareshownforillustrativepurposesonly,areunmanagedanddonottakeintoaccountmarketconditionsorthe costsassociatedwithinvesting.Further,themanager’sstrategymaydeployinvestmenttechniquesandinstrumentsnot usedtogenerateIndexperformance.Forthisreason,theperformanceofthemanagerandtheIndicesarenotdirectly comparable.
MSCIdataissourcedfromMSCIInc.MSCImakesnoexpressorimpliedwarrantiesorrepresentationsandshallhaveno liabilitywhatsoeverwithrespecttoanyMSCIdatacontainedherein.TheMSCIdatamaynotbefurtherredistributedor usedasabasisforotherindicesoranysecuritiesorfinancialproducts.Thisreportisnotapproved,endorsed,reviewedor producedbyMSCI.NoneoftheMSCIdataisintendedtoconstituteinvestmentadviceorarecommendationtomake(or refrainfrommaking)anykindofinvestmentdecisionandmaynotbereliedonassuch.
FTSEdataissourcedfromFTSEInternationalLimited(‘FTSE’)©FTSE2021.PleasenoteadisclaimerappliestoFTSEdata andcanbefoundatwww.ftse.com/products/downloads/FTSE_Wholly_Owned_Non-Partner.pdf
Importantinformation(continued)
This page intentionally left blank
Orbis Investments
November 2021
Unless otherwise stated, the information below covers the period October 1, 2020 to September 30, 2021
Firm summary including firm’s inception date, AUM and number of investment professionals. Tell us if there have been any significant events in the firm during Fiscal 2021 (i.e., significant personnel changes, changes in firm structure, etc.)
Orbis was founded in 1989 to provide clients with performance-oriented global investment management based on the principles of fundamental, long term and contrarian thinking. The firm manages $37.1bn in AUM. The investment team includes 34 equity analysts across 5 investment offices in San Francisco, London, Hong Kong, Tokyo and Bermuda.
The key investment personnel involved in the management of the Orbis Global Equity Strategy included William Gray and the five stockpickers who direct client capital:
Name Title Tenure with firm (years)
William Gray Head of Investment Team 32
Adam Karr US Equity Analyst 19
Benjamin Preston Global Sector Equity Analyst 21
Brett Moshal Japan Equity Analyst 18
Stefan Magnusson Emerging Markets Equity Analyst 17
Edward Blain Europe Equity Analyst 10
Organizational changes
Will Gray will hand over the leadership of Orbis to Adam Karr and Darren Johnston, effective December 31, 2021. Adam will take on the role of President of Orbis and will lead the investment team while continuing in his role as US Equity Analyst for the Orbis Global Equity Strategy. Darren will serve as Chief Operating Officer and lead our business teams. Will will remain closely involved as Chair of the Orbis Board. Please see Adam Karr and Darren Johnston’s bios below.
Adam Karr, Bachelor of Arts in Economics (Northwestern University), Master of Business Administration (Harvard University). Adam joined Orbis in 2002. Based in San Francisco, he currently leads the US investment team and is one of the stockpickers who directs client capital in the Orbis Global Equity Strategy. He is the Managing Partner of Orbis US, and is a Director of Orbis Holdings Limited and Orbis Allan Gray Limited. He previously worked as a partner at Palladium Equity Partners and as a financial analyst at Donaldson, Lufkin & Jenrette. He is a trustee at Northwestern University and a board member of SEO.
Darren Johnston, Bachelor of Commerce (Mount Allison University), Chartered Accountant, FCA, FCPA, Chartered Financial Analyst. Darren joined Orbis in 2017. His primary responsibility is to provide leadership support to the business and operations sides of the firm with a particular focus on markets and clients. He is a Director of Orbis Holdings Limited and is responsible for the Bermuda office. Darren previously was the CEO of PricewaterhouseCoopers Caribbean Region Ltd and has over 30 years of experience in the financial services industry.
Changes to the Board of Orbis Holdings Limited (OHL)
Renée Oliveira stepped down from the Board of Orbis Holdings Limited in December 2020 for personal reasons.
Brief description of the investment process
For a stock to end up in Orbis Global, one of the five stockpickers who direct client capital must recommend it. All of these individuals have demonstrated stockpicking ability within our paper portfolio system. Four of them have a regional focus (US, Japan, Europe and Emerging Markets), while one invests across all sectors globally.
The head of the investment team has final accountability for the strategy, including selecting and monitoring those who direct client capital. Shifts in capital between the ideas of the five stockpickers typically take place organically, driven by where we see the best bottom up opportunities, rather than top down considerations. The incentives the stockpickers operate under encourage them to act in the best interest of the strategy as a whole. William Gray is currently the head of the investment team and is ultimately responsible for such decisions. As noted above, Adam Karr will take over this role from December 31, 2021.
The following is a description of the general end to end process from idea generation to stock selection in the Global Equity Strategy.
1. Idea generation
Our equity analysts use a highly structured research process to filter out unattractive ideas in the early stages and focus their time on only the most promising ideas.
Analysts typically begin their search for investment ideas by using a variety of qualitative and quantitative tools to identify stocks that are potentially trading well below intrinsic value. We view quantitative analysis as an enabling technology that harnesses our investment philosophy in a systematic and scalable way. Such tools include our internally developed models and flexible screening tools that each analyst can tailor to their specific needs.
2. Independent fundamental research
Once the decision has been made to pursue an investment idea, the research process will typically proceed through three phases of increasingly in depth research. Less experienced analysts may receive some direction or input from more experienced analysts on their team, but for the most part, research is highly independent. As a rule of thumb, analysts should expect to reject about two thirds of their ideas at each phase with only the most promising proceeding through all three phases of research.
In valuing a company, our analysts look at the same metrics that a prudent businessperson would use to assess the value of the business in question. These depend on the specific business and different methodologies are typically considered. Some of the metrics used include going concern value such as discounted future cash flows, earnings based measures and breakup values. Central to our contrarian investment approach is the recognition that share prices may take years to return to intrinsic value, often falling further before doing so, and we therefore usually analyse companies using a three to five year investment horizon. Given our long term focus, we must develop a high level of conviction before buying a stock, and, as a result, the end to end research process can take up to three months, if not longer.
When the final phase of research is completed, culminating in a Phase Three research report, an analyst can decide whether to buy the stock in their paper portfolio and they will be held accountable for that decision.
Paper portfolios: In the early years of their careers, analysts communicate their recommendations through the use of a paper portfolio, which simulates investment decisions in the actual stock market. This is a concentrated list of approximately 10 stock recommendations that are weighted to reflect the analyst’s degree of conviction in each idea. Our analysts' paper portfolios enable them to express unequivocally their best investment ideas. The performance of each analyst’s paper portfolio, relative to a relevant benchmark, provides the most significant input to their remuneration. Analysts are therefore assessed on the basis of their own decisions, not those of others, nor how well they “sell” or “pitch” their ideas. This reinforces the principle of individual accountability, which underpins the entire investment process. Our paper portfolio system therefore enables us to assess objectively the quality of their investment decisions, thus reducing the role of politics, while also acting as a learning tool for analysts to hone their skill.
3. Thesis defense
If a stock is considered a promising candidate for the strategy, the idea will be “sponsored” for a Policy Group Meeting (PGM) by a senior member of the investment team, including any one of the five stockpickers who direct client capital. Importantly, a PGM is not a decision making body, but rather a forum for rigorous peer review through which we seek to leverage the institutional knowledge of the firm. As such, the aim of the PGM is to raise the probability as high as reasonably possible that our analysts make the right investment decisions.
Who attends a PGM will vary depending on the stock being discussed. In all cases, individuals with relevant expertise will attend at the invitation of the sponsoring stockpicker who will also attend. The five stockpickers will typically attend all PGMs for stocks in their area of focus. They may also be asked to attend PGMs outside of their area of focus where they are able to offer useful insight. Prior to the PGM, each attendee will have read the Phase Three research report and will have submitted a vote indicating whether they believe the idea is a buy and if so, to what position size. The attendees will also submit questions to the PGM moderator who is responsible for guiding the discussion.
At the end of the PGM, attendees are given the opportunity to change their vote before a final vote is taken. Voting records are tracked for the entire investment team, but are not a factor as to whether a stock is bought in the portfolio. This decision is up to the five stockpickers individually.
4. Stock selection taking into account a broader portfolio level perspective
The five stockpickers are responsible for directing client capital into the highest risk adjusted return ideas, with positions sized based on each stockpicker’s assessment of return, risk and liquidity. The four stockpickers with a regional focus typically only recommend stocks in their region, whereas the stockpicker with a global sector focus has a global remit. For a stock to end up in the strategy, it must be recommended by one of the five stockpickers who direct client capital and there is nothing to prevent more than one of the stockpickers from recommending the same stock.
In managing the Global Equity Strategy, it is critical that the stockpickers maintain a broad perspective of the portfolio and the global opportunity set. This broad perspective is informed by various inputs, including, but not limited to, proprietary portfolio management tools, portfolio risk analysis from our London based Risk team (e.g., a Portfolio Risk Report
distributed each quarter), recommendations from our Currency team, and discussions during Global Strategy meetings that take place every three weeks. The attendees for these meetings include: the five stockpickers; William Gray; Nick Purser, who manages the Global Equity Strategy’s currency exposure; and Graeme Forster, who manages the International Equity and Optimal Strategies.
Recommendations from the five stockpickers are sent to a portfolio implementer in Bermuda who is responsible for issuing actual fund-level instructions and for allocating positions in the funds to the recommending stockpicker(s) so that they can be held accountable for them. Trading is managed by the Trading team in Bermuda.
Importantly, compensation for these individuals primarily takes the form of cash flows tied to the profits of the firm. This mitigates the risks that individual stockpickers hoard capital and/or allow the portfolio to become too diversified.
Brief overview of the investment objective of the strategy managed for the Army
The Orbis Global Equity Strategy is designed to remain invested in a portfolio of selected global equities through our fundamental, bottom up stockpicking approach. Orbis’ approach is to buy and hold shares when they are trading substantially below our assessment of the company’s long term intrinsic value. We believe that finding contrarian businesses to hold for the long term is the best way to generate wealth for our clients.
Orbis defines risk as the permanent loss of capital rather than short term price volatility or the risk of underperforming its benchmarks. In many cases, the risk of permanent capital loss results from overpaying for shares, which leads naturally to disappointing long term returns. The firm’s investment process seeks to identify undervalued companies with a significant margin of safety, thereby providing an important first line of defense against both the risk of loss and the risk of relative underperformance over the long term. Inception date with the Southern Territory, initial investment, and history of subsequent sizeable cash inflows or outflows from the account (over $1 million)
Subscription Date Fund Initial Investment Amount Closing Market Value 9/30/2021 9/7/ 2017 Orbis Institutional Global Equity LP, Core RRF S 17 $56,000,000 $76,600,423 RRF
Reserve Fee share class Apart from the initial subscription, there
cash inflows
Starting market value (as of 10/1/20) and the ending market value (as of 9/30/21) for each strategy Date Orbis Global Equity Strategy AUM (US$, M) Orbis Institutional Global Equity LP AUM (US$, M) 9/30/2020 21,024 2,541 9/30/2021 24,251 2,744 We’ve included the market values
Equity Strategy in
to
vehicle
invested.
refers to the Refundable
have been no
or outflows during this period.
for the Global
addition
the Institutional Global Equity LP which is the
in which Salvation Army is
Bullet points of key factors that influenced performance in Fiscal 2021
In the fiscal year 10/1/20 to 9/30/21, the Orbis Global Equity Strategy outperformed the MSCI World Index by 0.5% before fees Attribution is shown in the below table
Attribution analysis at September 30, 2021 (% return, gross):
Since Strategy Inception (Jan 1, 1990) 1 year
Relative return (annualised) 6 0 0.5
From: (Geometric return)
Stock Selection (vs MSCI World Index) 5.0 (1.1)
Stock Selection (vs Local Index) 4.7 2.9
Market Contribution (vs MSCI World Index) 0.2 (3.9)
Currency Selection (vs MSCI World Index) 0.6 1.9
Other† 0.4 (0.3)
Attribution information since Strategy Inception is based on a representative account for the Strategy. Attribution information for other periods is for the Fund in which The Salvation Army is currently invested.
† Includes the impact of different FX rates used to convert holdings to base currency between the Fund and its relevant index, residuals arising from cross product effects and non management fees and expenses.
Over the past 12 months the Orbis Global Equity Strategy performed essentially in line with the MSCI World Index before fees.
The key performance drivers for the period, as highlighted by our attribution analysis, were as follows:
• Although around 60% of our stock picks were winners, with a similar portion of capital deployed in winning stocks, there were more big losers than big winners. Six stocks detracted 1 percentage point or more from relative returns, while only two winners contributed to that extent.
• Our stock selections in the US contributed around 5.5 percentage points to relative returns in aggregate. Three US stocks were leading winners at the individual stock level: XPO Logistics, a provider of transportation logistics services; Howmet Aerospace, a producer of engineered solutions (chiefly for the aerospace industry); and MGM Resorts International, an owner and operator of integrated casino, hotel and entertainment resorts. After initially underperforming in the market sell off at the onset of the Covid 19 pandemic, all three companies’ fundamentals were resilient in the economic downturn and benefitted from the recovery following positive vaccine developments. While we trimmed the positions following their outperformance, they continued to be leading holdings at September 30, 2021. GXO Logistics was also a leading contributor after its spin off from XPO Logistics
• Two Chinese internet stocks (Alibaba Group Holding and NetEase) and a stock that derives most of its value from a Chinese internet stock (Naspers, a global technology investor listed in South Africa whose largest underlying asset is a 29% stake in Chinese internet giant Tencent) were among the biggest losers. In aggregate, these stocks detracted slightly more than 5 percentage points, net of a positive contribution resulting from appreciation in the South African rand. While we reduced the portfolio’s aggregate exposure to these shares, NetEase and Naspers continued to be top 10 holdings at September 30, 2021.
• Our stock selections in Continental Europe and Japan, which were concentrated in the more cyclical areas of the market, contributed just over 2.5 percentage points in aggregate. ING
Groep, a Dutch bank, contributed around 0.5 percentage points after its share price and fundamentals rebounded as the economic environment improved. ING continued to be a top 10 holding on September 30, 2021
• British American Tobacco (BAT), a UK listed tobacco company, detracted around 1.5 percentage points despite reporting largely solid results throughout the period. Sentiment towards tobacco stocks has been weak for some time amid ongoing concerns related to regulatory developments, the impact on competitive dynamics of the shift to “next generation” products, and investors’ growing focus on environmental, social and governance considerations. More recently, BAT announced reduced earnings guidance for 2021 as management appeared to take a conservative approach in the face of ongoing Covid 19 uncertainty. Additionally, the shares underperformed in April 2021 on news that the FDA was considering legislation to reduce nicotine in cigarettes and ban menthol products. We retain conviction in our thesis, and BAT continued to be the largest position in the portfolio at September 30, 2021, but we modestly trimmed the position in recent months to reallocate some incremental capital to other ideas.
• Newcrest Mining, an Australia listed gold miner with substantial EM operations, was also a big loser. It detracted around 1.5 percentage points, driven by the falling gold price and ongoing operational challenges. We also trimmed this position slightly, but Newcrest continued to be a significant position at September 30, 2021 in the belief that these issues were temporary and that the stock traded well below our estimate of intrinsic value.
Performance summary for Fiscal 2021 with comparison against the assigned benchmark(s), prior fiscal year comparison (if applicable), 3 year (if applicable) and 5 year (if applicable). Additionally, please provide the performance since inception, displayed by year on an annualized basis
Orbis Global Equity Strategy trailing returns (%, annualized):
As
Since inception (Jan 1, 1990) 13.7 11.8 7.3
Latest 5 years 10.9 11.3 13.7
Latest 3 years 9.1 9.8 13.1 Latest year 29.2 28.8 28.8
2020 16.8 16.3 15.9 2019 22.5 23.5 27.7 2018 (19.2) (16.9) (8.7) 2017 31.1 28.6 22.4 2016 20.7 16.9 7.5 2015 (1.5) (1.6) (0.9) 2014 (2.7) (1.1) 4.9 2013 46.1 40.6 26.7 2012 17.7 16.9 15.8 2011 (7.5) (7.3) (5.5)
at September 30, 2020 Orbis Global Equity Strategy, gross of fees Orbis Global Equity Strategy, net of fees (Core RRF) MSCI World Index*
Orbis Global Equity Strategy calendar year returns (%): Year Orbis Global Equity Strategy, gross of fees Orbis Global Equity Strategy, net of fees (Core RRF) MSCI World Index*
2010 8.1 8.7 11.8 2009 44.7 40.5 30.0 2008 (34.6) (36.3) (40.7) 2007 15.3 13.4 9.0 2006 21.7 20.9 20.1 2005 24.8 20.5 9.5 2004 19.5 18.0 14.7 2003 49.4 44.8 33.1 2002 (8.0) (11.4) (19.9) 2001 21.2 10.3 (16.8) 2000 8.6 2.6 (13.2) 1999 30.9 29.0 24.9 1998 23.2 23.2 24.3 1997 7.0 8.9 15.8 1996 16.5 15.4 13.5 1995 39.5 34.1 20.7 1994 0.2 1.1 5.1 1993 20.4 20.6 22.5 1992 14.4 9.0 (5.2) 1991 38.1 32.4 18.3 1990 (5.6) (8.7) (17.0)
RRF - Core Refundable Reserve Fee
Orbis Core RRF class returns are based on an investment of US$20 million in the class at the inception of the Strategy with no subsequent transactions. The returns of an actual Member may vary depending on the timing and value of a Member’s subscriptions and redemptions.
*net of withholding taxes
Strategy gross returns are combined asset weighted actual gross returns of all the funds following the same investment objective. Strategy net returns are based on the specified fee structure applied to the Strategy gross returns and do not represent actual net returns experienced by investors in the relevant Orbis Funds.
Past performance is not a reliable indicator of future results. Orbis Funds' share prices fluctuate and are not guaranteed. When making an investment in the Funds, an investor's capital is at risk. Returns may decrease or increase as a result of currency fluctuations. While we have endeavoured to ensure the accuracy of the information herein, such information is not guaranteed as to accuracy or completeness. Returns for Orbis Funds are calculated gross of all income and assume reinvestment of distributions/dividends. Gross returns are net of all expenses (i.e. before the deduction of all management and performance fees). Net returns are net of all fees and expenses. Returns for periods of less than 12 months are not annualised.
MSCI: The MSCI information may only be used for your internal use, may not be reproduced or redisseminated in any form and may not be used as a basis for or a component of any financial instruments or products or indices. None of the MSCI information is intended to constitute investment advice or a recommendation to make (or refrain from making) any kind of investment decision and may not be relied on as such. Historical data and analysis should not be taken as an indication or guarantee of any future performance analysis, forecast or prediction. The MSCI information is provided on an "as is" basis and the user of this information assumes the entire risk of any use made of this information. MSCI, each of its affiliates and each other person involved in or related to compiling, computing or creating any MSCI information (collectively, the "MSCI Parties") expressly disclaims all warranties (including, without limitation, any warranties of originality, accuracy, completeness, timeliness, non infringement, merchantability and fitness for a particular purpose) with respect to this information. Without limiting any of the foregoing, in no event shall any MSCI Party have any liability for any direct, indirect, special, incidental, punitive, consequential (including, without limitation, lost profits) or any other damages. http://www.msci.com
CorePresentation to:
PRIVATE & CONFIDENTIAL
NOTICE:

This Presentation (“Presentation”) is confidential and may not be reproduced or distributed without the prior written consent of Portfolio Advisors, LLC This Presentation has been provided to you per your specific request This Presentation has not been reviewed by any third party for reasonableness and Portfolio Advisors does not undertake any obligation to update the information herein Past Performance is not indicative of future results This Presentation has been provided to you on the understanding that, as a sophisticated investor, you will understand and accept the inherent limitations of the information herein, and will not rely on the Presentation in making any investment decisions, and will use the information contained herein only for the purpose of discussions with Portfolio Advisors Portfolio Advisors is not acting as your advisor or in a fiduciary capacity for you regarding alternative investments


November 2021
As
assets
is measured as adjusted reported value plus
commitment.
Advisors Overview
Funds
and administration and reporting services Voting Members of PAPEF VI, VII, and VIII Investment Committees
Statistics 1994 ~$30.6 Billion Year Founded Assets Under Management(1) 120+ 300+ Professionals GP Relationships ~250 >2,300 Advisory Board Seats Funds tracked in proprietary database
Title Years at Firm Years of Experience Prior Experience
Managing Director 25 32 Morris Anderson, Chemical Bank
Managing Director 11 36 New York Life, Manufacturers Hanover Trust Company
Managing
26 28 Landmark Partners, United Technologies
Managing
13 15 CIBC, Morgan Stanley
Managing
11 20 Adams
Partners,
Consulting
1.
of December 31, 2020,
under management
unfunded
Portfolio
Independent, employee owned investment firm
SEC registered investment advisor; qualified professional asset manager
Focus on private markets investing: private equity, private real estate and private credit Over $21 billion of limited partner commitments to commingled funds Average of $2.9 billion invested in private markets per year (2015 2020)
management, advisory,
Key
Team
Brian Murphy
Adam Clemens
William Indelicato
Director
Ken Binick
Director
Greg Garrett
Director
Street
Boston
Group, United States Air Force
25 27 Mitchell
12 24 Citigroup
23 23 Deloitte
Touche
19 28 PrivateTrade,
made commitments
Equity Funds
Todd Hughes Managing Director
Madison, Morris Anderson, Chemical Bank John Kyles Managing Director
Hugh Perloff Managing Director
&
Kenneth Wisdom Managing Director
UC Regents, Mass PRIM
The Salvation Army Southern Territory has
to the Portfolio Advisors Private
VI, VII, and VIII (PAPEF VI, VII, and VIII)
In 2021, PA hired three new Managing Directors: Briac Houtteville (European Secondaries), Brian Schwartz (Marketing), and Brian Mooney (Co Head of GP led Secondaries).
The Southern Territory committed $10 million on November 19, 2010 and an additional $15 million on March 31, 2011.
As of October 1, 2021, the Southern Territory has contributed $16,666,379 of its $20,200,000 commitment (after release1), or 82.5%. At the fund level, 91.4% has been drawn. The difference is largely due to the netting of capital calls & distributions to manage cash flow.
As of October 1, 2021, the Southern Territory has received distributions of $23,514,429 or 141.1% of called capital; 6.7% was distributed during 2021 YTD.
FY 2020 performance for TSA ST (from 10/1/19 9/30/20) was 11.4% and outperformed the MSCI by 330bps and underperformed the S&P 500 by 120bps.
Partial FY 2021 performance for TSA ST (from 10/1/20 – 3/31/21) was 59.3% and outperformed the MSCI by 550bps and S&P 500 by 860bps. The total value as of September 30, 2020 was $33,050,260 and as of March 31, 2021 was $35,952,846.
1. PA released $3 6 mm of TSA ST’s original $25 0 mm commitment to PAPEF VI on April 30, 2019, and an additional $1 2 mm on April 30, 2021 Capital Drawn from Investor is based on the current commitment amount of each respective Fund PAPEF VI Notes: (i) Fund performance numbers for March 31, 2021 are draft and subject to change, performance is estimated and unaudited and based on adjusted reported value (ii) TV equals adjusted reported value plus inception to date distributions (iii) Please see the “Endnotes & Disclosure Statement” for additional information
Advisors Private Equity Fund VI Portfolio Advisors’ sixth diversified private equity commingled fund Primary fund and secondary investments across buyouts, venture capital, and special situations strategies across the globe Commenced July 2008; final closing March 2011; fund term is one year from full liquidation Fund capital was committed between 2008 2013 Fund and Investment Information Fund Vintage Year Total Fund Size (millions) TSA ST Original Commitment (millions) Allocation %: BO/SS/VC TSA ST Closing Date TSA ST Chosen Fee Series PAPEF VI 2009 $1,103.0 $25.0 40/40/20 November 2010 & March 2011 Series II As of October 1, 2021 As of March 31, 2021 Sector TSA ST Commitment After Release1 (millions) Capital Drawn from Fund (% fund) Capital Drawn from TSA ST (% committed) Capital Distributed (% drawn) Net Multiple Net IRR MSCI World Benchmark Comparison S&P 500 Benchmark Comparison Diversified Buyout $1.90 90.7% 81.5% 151.9% 2.40 x 15.2% +420bps +110bps International Buyout $3.19 92.2% 75.0% 102.8% 1.85 x 9.9% 30 320 U.S. Middle Mkt Buyout $3.19 88.4% 77.8% 193.0% 2.59 x 18.2% +700 +370 Special Situations $5.63
Distressed
Venture Capital
ST Investment
Portfolio
89.6% 82.8% 117.8% 1.62 x 8.6% 210 510
Debt $2.18 93.2% 83.0% 114.4% 1.52 x 7.9% 300 580
$4.13 95.6% 91.8% 168.2% 2.75 x 15.9% +470 +160 Total $20.20 91.4% 82.5% 141.1% 2.08 x 12.6% +190bps 110bps TSA
Statistics and Performance Since Inception
As of October 1, 2021, the Southern Territory has contributed $16,813,288 of its $22,200,000 (after release1) commitment, or 75.7%. At the fund level, 88.3% has been drawn. The difference is largely due to the netting of capital calls & distributions to manage cash flow.
As of October 1, 2021, the Southern Territory has received distributions of $20,915,734 or 124.4% of called capital; 10.6% was distributed during 2021 YTD.
FY 2020 performance for TSA ST (from 10/1/19 9/30/20) was 49.3% and outperformed the MSCI by 3,850bps and S&P 500 by 3,230bps.
Partial FY 2021 performance for TSA ST (from 10/1/20 – 3/31/21) was 30.1% and underperformed the MSCI by 2,290bps and S&P 500 by 2,060bps. The total value as of September 30, 2020 was $40,652,735 and as of March 31, 2021 was $43,124,326.
PA released $2 8 mm of TSA ST’s original $25 0 mm commitment to PAPEF VII on April 30, 2021 Capital Drawn from Investor is based on the current commitment amount of each respective Fund PAPEF VII Notes: (i) Fund performance numbers for March 31, 2021 are draft and subject to change, performance is estimated and unaudited and based on adjusted reported value (ii) TV equals adjusted reported value plus inception to date distributions (iii) Please
the “Endnotes & Disclosure
for additional information Portfolio Advisors Private Equity Fund VII Portfolio Advisors’ seventh diversified private equity commingled fund Primary fund and secondary investments across buyouts, venture capital, and special situations strategies across the globe Commenced April 2011; final closing in March 2013; fund term is one year from full liquidation Fund capital was committed between 2011 2015 Fund and Investment Information Fund Vintage Year Total Fund Size (millions) TSA ST Commitment (millions) Allocation %: BO/SS/VC TSA ST Closing Date TSA ST Chosen Fee Series PAPEF VII 2011 $1,085.0 $25.0 40/40/20 July 2012 Series II As of October 1, 2021 As of March 31, 2021 Sector TSA ST Commitment After Release1 (millions) Capital Drawn from Fund (% fund) Capital Drawn from TSA ST (% committed) Capital Distributed (% drawn) Net Multiple Net IRR MSCI World Benchmark Comparison S&P 500 Benchmark Comparison Diversified Buyout $9.00 86.5% 68.4% 89.5% 2.21 x 15.8% +420bps +150bps Special Situations $8.80 85.0% 77.6% 91.6% 1.58 x 9.6% 100 360 Venture Capital $4.40 94.7% 87.0% 239.0% 4.73 x 26.4% +1,420 +1,120 Total $22.20 88.3% 75.7% 124.4% 2.53 x 17.7% +620bps +340bps TSA ST Investment
$25,000,000
1.
see
Statement”
Statistics and Performance Since Inception
The Southern Territory committed
on July 2, 2012.
1, 2014
As of October 1, 2021, the Southern Territory has contributed $17,673,325 of its $25,000,000 commitment, or 70.7%. At the fund level, 85.2% has been drawn. The difference is largely due to the netting of capital calls & distributions to manage cash flow.
As of October 1, 2021, the Southern Territory has received distributions of $7,917,920 or 44.8% of called capital; 24.3% was distributed during 2021 YTD.
FY 2020 performance for TSA ST (from 10/1/19 9/30/20) was 22.9% and outperformed the MSCI by 1,230bps and S&P 500 by 740bps
Partial FY 2021 performance for TSA ST (from 10/1/20 3/31/21) was 115.2% and outperformed the MSCI by 2,880bps and S&P 500 by 3,220bps. The total value as of September 30, 2020 was $29,833,634 and as of March 31, 2021 was $39,711,204.
PAPEF VIII Notes: (i) Fund performance numbers for March 31, 2021 are draft and subject to change, performance is estimated and unaudited and based on adjusted reported value. (ii) TV equals adjusted reported value plus inception to date distributions. (iii) Please see the “Endnotes & Disclosure Statement” for additional information Portfolio Advisors Private Equity Fund VIII Portfolio Advisors’ eighth diversified private equity commingled fund Primary fund and secondary investments across buyouts, venture capital, and special situations strategies across the globe Commenced February 2013; final closing in March 2016; fund term is one year from full liquidation Primary fund commitments were made between 2013 2017; the investment period for the fund’s secondaries ended March 2019 Fund and Investment Information Fund Vintage Year Total Fund Size (millions) TSA ST Commitment (millions) Allocation %: BO/SS/VC TSA ST Closing Date TSA ST Chosen Fee Series PAPEF VIII 2013 $1,238.8 $25.0 50/30/20 September 2014 Series II As of October 1, 2021 As of March 31, 2021 Sector TSA ST Commitment (millions) Capital Drawn from Fund (% fund) Capital Drawn from TSA ST (% committed) Capital Distributed (% drawn) Net Multiple Net IRR MSCI World Benchmark Comparison S&P 500 Benchmark Comparison Diversified Buyout $12.50 85.9% 69.1% 35.7% 2.05 x 20.2% +720bps +460bps Special Situations $7.50 82.3% 68.6% 38.4% 1.60 x 13.0% +30 210 Venture Capital $5.00 89.3% 77.8% 73.5% 3.51 x 27.4% +1,510 +1,210 Total $25.0 85.2% 70.7% 44.8% 2.25 x 21.1% +840bps +570bps TSA ST Investment Statistics and Performance Since Inception
The Southern Territory committed $25,000,000 on September
period
and unaudited and
reported value (ii) NM
Not Meaningful As a long duration asset class, returns
years of a fund, as the portfolio
built out and rebalancing
PAPEF VI – VIII Investment Objectives Portfolio Advisors employs a disciplined approach to a complex asset class Seeks to generate attractive, risk adjusted returns to investors Diversification Manager Selection Portfolio Construction Manager Strategy Geography Industry Vintage Year Access to high quality fund managers Due diligence Quantitative analysis Qualitative analysis Target premier primary funds Enhance with secondary exposure TSA ST PAPEF VI 1 Year Returns Year Net IRR MSCI World Benchmark Comparison S&P 500 Benchmark Comparison 2011 NM 2012 11.5% 980bps 200bps 2013 19.6% 460bps 1,090bps 2014 15.9% +5,250bps +1,600bps 2015 6.7% +650bps +30bps 2016 10.4% 410bps 810bps 2017 21.2% 580bps 610bps 2018 11.0% +3,050bps +2,700bps 2019 6.4% 2,380bps 2,720bps 2020 17.4% +90bps 50bps TSA ST PAPEF VII 1 Year Returns Year Net IRR MSCI World Benchmark Comparison S&P 500 Benchmark Comparison 2012 NM 2013 NM 2014 10.9% +940bps 580bps 2015 11.9% +1,750bps +1,200bps 2016 11.4% 1,070bps 1,410bps 2017 21.7% 670bps 790bps 2018 20.1% +4,700bps +4,470bps 2019 29.7% 60bps 400bps 2020 43.9% +2,490bps +2,290bps TSA ST PAPEF VIII 1 Year Returns Year Net IRR MSCI World Benchmark Comparison S&P 500 Benchmark Comparison 2014 NM 2015 NM 2016 NM 2017 20.1% 660bps 590bps 2018 18.5% +3,910bps +3,640bps 2019 20.5% 1,150bps 1,500bps 2020 37.5% +1,540bps +1,400bps Investment Objectives The Salvation Army Southern Territory’s Annual Performance by Fund
Performance Note: (i) Fund performance numbers are for the twelve month
ending December 31st of each year, respectively. Performance is estimated
based on
=
are not meaningful during the fundraising period of a fund, and often the first three
is being
between investors occurs
1) IRR Methodology. “IRR” (the internal rate of return) is defined as the implied discount rate that will make the net present value of a stream of cash flows sum to zero. The IRRs shown are weighted based on drawn capital only. The “Net IRR” is calculated based on all of the cash flows between the specified PA sponsored vehicle and the limited partner of such vehicle. The Net IRRs are based on Reported Value as of March 31, 2021. “Reported Value" represents the value of each respective fund’s or sector’s, as applicable, underlying fund investments' net assets, as of March 31, 2021, as reported on the underlying fund's financial statements
2) Certain Defined Terms “Capital Drawn from Fund” represents the total capital contributed from the PAPEF Fund to underlying investments as a percentage of the Fund’s total capital commitments to underlying investments. “Net Multiple” or “Investment Multiple” represents (i) the total distributions received by the limited partner plus the Adjusted Reported Value (as defined above), divided by (ii) the total contributions made by the limited partner.
3) MSCI World performance figures provided with respect to each PAPEF fund correspond to the cash flows of the Sectors of the limited partner’s respective PAPEF fund commitment. The composite performance of the MSCI World Index (a broad global equity benchmark that represents large and mid cap equity performance across 23 developed markets countries), is shown as a general indicator of market health. The MSCI World Index is not subject to any of the fees and expenses to which the PAPEF funds are subject. The PAPEF funds have invested in other market investment vehicles and have not attempted to replicate the performance of the MSCI World Index.
4) S&P 500 performance figures provided with respect to each PAPEF fund are dollar weighted to correspond to the cash flows of the Sectors of the limited partner’s respective PAPEF fund commitment. The composite performance of the S&P 500 Index (the “S&P 500”, a widely recognized, unmanaged index based upon the aggregate performance of a selected portfolio of publicly traded common stocks), is shown as a general indicator of market health despite the lack of similarity of their underlying components to the PAPEF funds. The S&P 500 is not subject to any of the fees and expenses to which the PAPEF funds are subject, and the performance of the S&P 500 shown reflects the reinvestment of dividends and other distributions. The PAPEF funds have invested in other market investment vehicles and have not attempted to replicate the performance of the S&P 500.
GENERAL DISCLAIMER
PAST PERFORMANCE DOES NOT GUARANTEE FUTURE RESULTS THE PAST PERFORMANCE PRESENTED IN THIS DOCUMENT REFLECTS THE PARTICULAR OBJECTIVES AND CONSTRAINTS OF PORTFOLIO ADVISORS’ ADVISORY CLIENTS AND/OR MANAGED FUNDS OF FUNDS AT DIFFERENT POINTS IN TIME AND IS BASED ON THE ACTUAL HISTORICAL PERFORMANCE OF THE PRIVATE EQUITY FUNDS, CO INVESTMENTS OR ANY OTHER INVESTMENTS, AS APPLICABLE (COLLECTIVELY OR INDIVIDUALLY, AS THE CONTEXT REQUIRES, “INVESTMENTS”), COMMITTED TO ON THEIR BEHALF NO REPRESENTATION IS MADE THAT THE INVESTMENTS WOULD HAVE BEEN SELECTED FOR ANY PORTFOLIO ADVISORS SPONSORED FUND DURING THE PERIOD SHOWN OR THAT THE PERFORMANCE OF ANY PORTFOLIO ADVISORS SPONSORED FUND WOULD HAVE BEEN THE SAME OR SIMILAR TO THE PERFORMANCE REFLECTED PORTFOLIO ADVISORS SPONSORED FUNDS MAKE INVESTMENTS IN DIFFERENT ECONOMIC CONDITIONS THAN THOSE PREVAILING IN THE PAST AND IN DIFFERENT INVESTMENTS THAN THOSE REFLECTED IN THE PERFORMANCE RECORD(S) SHOWN HEREIN ADDITIONALLY, THE PERFORMANCE DESCRIBED HEREIN REFLECTS THE PERFORMANCE OF CERTAIN INVESTMENTS OVER A LIMITED PERIOD OF TIME AND DOES NOT NECESSARILY REFLECT ANY SUCH INVESTMENTS’ PERFORMANCE IN DIFFERENT MARKET CYCLES THE PERFORMANCE RECORD(S) SHOWN HEREIN WERE COMPILED, AND REFLECT CERTAIN SUBJECTIVE ASSUMPTIONS AND JUDGMENTS, BY PORTFOLIO ADVISORS IT HAS NOT BEEN AUDITED OR REVIEWED BY ANY INDEPENDENT PARTY FOR ACCURACY OR REASONABLENESS PROSPECTIVE INVESTORS SHOULD UNDERSTAND THAT THE USE OF DIFFERENT UNDERLYING ASSUMPTIONS AND JUDGMENTS, AND COMPARISONS TO DIFFERENT INFORMATION, COULD RESULT IN MATERIAL DIFFERENCES FROM THE PERFORMANCE RECORD(S) HEREIN ADDITIONAL INFORMATION CAN BE PROVIDED BY PORTFOLIO ADVISORS UPON REQUEST
Disclaimer
Endnotes &
Statement
This page intentionally left blank
Silchester International Investors November 2021
History
Silchester International Investors is a private investment management group, established in 1994 to specialise in international equity investment primarily on behalf of US institutional investors. The inception date of Silchester’s International Equity composite was January 1995.
Total Firm Assets under Management (09/30/21): $43.5bn
Personnel:
As of September 30, 2021, there were 25 members of staff at Silchester. Of these 25, 10 are investment analysts.
Stephen Butt reached Silchester’s normal retirement age (70) in February 2021. Stephen was not ready to retire and Silchester’s partnership agreement allows for the retirement age to be extended. However, Stephen recognised that it is time to narrow the scope of his responsibilities and allow his colleagues to take on additional work and responsibilities in different areas. Since April 2021 (the start of Silchester’s financial year), Stephen has been working around 12 days per month or around 3 days per week. His efforts are focused on these areas: chairing the Investment Supervisory Group, Silchester’s collegiate equivalent of a CIO; contributing to company research albeit on a lesser scale than before; participating in and voting at Portfolio Implementation Group (“PIG”) meetings; participating in Silchester’s bi annual investment off sites where Silchester’s investment philosophy and its execution are enhanced and developed. Stephen continues to meet and speak with clients and consultants. Stephen’s decision came from a recognition that Silchester is successfully moving forward with able individuals taking on additional responsibilities and a desire to continue overseeing incremental developments.
In recent years, Silchester has taken several steps in anticipation of a gradual transition. In addition to rotating responsibilities amongst various members of the investment team, Silchester has created a vehicle (Silchester Continuation Limited) for current working partners to buy an equity interest in the investment management business. Together with the investments staff have in Silchester’s commingled funds, this has helped ensure that all Silchester working partners have a high level of financial alignment with clients. Stephen will not be selling any of his shares in Silchester Partners Limited and he will not be selling any of his investments in Silchester’s International Equity programme.
Investment Philosophy and Process
Silchester focuses on maximising the intrinsic value of our investment programme. We define this as the earnings, assets and dividends provided by our companies and aggregated within the portfolio. We implement this by a strong price discipline – lower multiples of earnings, assets and dividends means more earnings, assets and dividends at the outset – and by a quality appraisal which seeks to identify companies capable of increasing earnings, assets and dividends by their own efforts. This approach, our focus on one product, our independence as an investment firm and our commitment to restricting client assets and numbers are important strengths at Silchester.
Our primary interest is in companies selling cheaply relative to assets, earnings, and/or dividends. We carry out database sc reenings every two months to identify companies that meet these criteria. Members of the investment team are then invited to propose companies from these screens as candidates for research. From these companies and others that require a reappraisal, the Research
Salvation Army Southern Territory – November 2021
Priorities Group will select specific companies for further research. Bertrand Le Pan de Ligny, Silchester’s Director of Research, leads the Research Priorities Group.
Our research on each company begins with a restatement of its balance sheet, income and cash flow statements into a standardised template, which also sets out a range of fundamental and valuation ratios. Our reports comprise an overview of the history of the company and its activities; its financial record; a summary of its recent operational performance; and an assessment of quality using three standard criteria that includes: financial information on competitors; an assessment of normalised earnings power; and insights on valuation and valuation history. The policy is to limit reports to 3,000 words.
We assess quality on these three criteria:
o Is the company well capitalised?
o Does it generate attractive free cash flow?
o Is there favourable stewardship?
Under capitalisation, the analysis is substantially quantitative so we have developed a one page checklist . It provides a comprehensive and concise assessment of a company’s balance sheet, plus off balance sheet items and corresponding ratios.
Free Cash Flow Generation is the defining characteristic of a good business. Good cash profits are associated with businesses that make good returns on tangible capital employed. Our analysis focuses on the attributes and factors that might threaten, protect or augment future cash flows. We structure this analysis based on these considerations: ‘Moats/differentiation’, ‘Scale benefits’, ‘Growth opportunities at an attractive return on investment’, ‘Risk of change and regression’, and ‘Other’ factors (such as cyclical issues).
Stewardship addresses the extent to which a company is well run. Our analysis in this regard is based on four considerations: ‘Capital allocation’, ‘Structure and business plan’, ‘Abuse/scope for abuse’ and ‘Operational management’.
In carrying out our appraisals, we typically hold meetings with company representatives. Our investors are all generalists and assess companies across various markets and industries. Existing investments are reappraised on the same basis.
The objective of our research work is to assess the quality of a company – to identify businesses that have the ability to grow its earnings per share, dividends per share and assets per share over time –what we call Intrinsic Value. .
We consider valuation regarding these four principal measures:
o Earnings – historic, consensus and our measure of normalised earnings plus EV/EBIT
o Assets – price/book value and price/tangible book value
o Dividends – dividend yield
o Cash Flow normalised free cash flow yield
Salvation Army Southern Territory – November 2021
Transaction and Performance Activity
Inception Date: February 1, 2007
Market Value as of September 30, 2020: $126,256,579
Market Value as of September 30, 2021: $183,173,318
Contribution Amount $
Initial Contribution
February 1, 2007 10,000,000
Additional Contributions
2007 (Mar Dec) 107,491,322 2013 14,000,000 2020 16,000,000
Redemptions
Apr 09 to Sep 21 (80,000,000)
Income Distributions
Apr 09 to March 14 (11,999,494)
Market Value as at September 30, 2021 $183,173,318
Gross annualised performance for the period ending September 30, 2021:
Salvation Army MSCI EAFE INDEX
1 Year 29.5 25.7 3 Years 5.7 7.6 5 Years 8.4 8.8 Since Inception 7.3 3.5
Salvation Army Southern Territory – November 2021
Performance Commentary
YTD through September 30, 2021, the MSCI EAFE Value Index was up 9.6% and the MSCI EAFE Growth Index was up 6.9%. Silchester’s gross investment return for the same time was up 12.3% ahead of the MSCI EAFE Index, MSCI EAFE Growth Index and MSCI EAFE Value Index.

Our approach is not to panic about equities that historically have proven so resilient. We own companies on average for four five years and our focus is on how the underlying businesses are doing – balance sheet strength, good market positions and franchises, competent management and good governance. If the businesses of the companies that comprise our portfolio are doing fine and delivering economically, a period of share price weakness is not of much concern and may even give us more opportunity to accumulate larger positions at attractive valuations.
Our goal is to fill the portfolio with good, solid businesses with an emphasis on the underlying economic delivery from the overall portfolio. This is calculated by observing the uplift or otherwise of the aggregate earnings, dividends, and book value of all the holdings held in the portfolio over the preceding year. Economic delivery can be enhanced by buying and holding stocks that each achieve a rise in earnings per share, dividends per share, or book value per share or, alternatively, by selling an expensive stock and replacing it with one contributing more earnings, dividends, or book value. We feel market performance will follow this rise in economic delivery and our performance has reflected that.
Salvation
Army Southern Territory
– November 2021
This page intentionally left blank
SVB

Capital November 2021
Firm Summary:
SVB Capital is a global venture capital investment firm. Founded in 1999, SVB Capital is the premier partner for accessing the Innovation Economy, with a particular focus on technology and life sciences. As a division of SVB Financial Group (NASDAQ: SIVB), the firm has differentiated data, insights, sector expertise, and relationships with leading venture capital firms and startups as a result of Silicon Valley Bank’s established position in the venture ecosystem. Since 2000, the team has raised ten fund of funds (Strategic Investors Fund or “SIF”), five direct investment funds (Capital Partners or “CP”) and five opportunistic vehicles (Separately Managed Accounts or “SMAs”), and two credit funds (Innovation Credit Fund or “ICF”) resulting in $6.7 billion in assets under management. Today, SVB Capital is actively fundraising the following funds: SIF Ascension, Arterial, SIF XI, SIF Plus, CP VI, VOF II, Innovation Credit Growth IX, and Innovation Credit Income II. Please see below for a detailed overview of the funds on the SVB Capital platform.
SVB Capital Managed Funds

Strategic Investors Funds - Fund of Funds
Committed Capital1 Year of Initial Close2
Strategic Investors Fund, L.P. $122M 2000
Strategic Investors Fund II, L.P. $175M 2003
Strategic Investors Fund III, L.P. $256M 2005
Strategic Investors Fund IV, L.P. $245M 2008
Strategic Investors Fund V, L.P. $293M 2011
Strategic Investors Fund V A Opportunity Fund, L.P. $51M 2012
Strategic Investors Fund VI, L.P. $324M 2013
Strategic Investors Fund VII, L.P. $332M 2014
Strategic Investors Fund VIII, L.P. $499M 2016
Strategic Investors Fund IX, L.P. $703M 2018
Strategic Investors Fund X, L.P. $1,263M 2020
SIF Ascension Fund I, L.P. $93M 2021
Strategic Investors Fund XI, L.P. TBD TBD
SIF Plus TBD TBD
Venture Capital Direct Funds
CP I, L.P. $56M 2000
CP II, L.P. $90M 2006
Capital Partners III, L.P. $172M 2014
Capital Partners IV, L.P. $229M 2017
Cap.Partners V, L.P. $160M 2020
Arterial Fund TBD TBD
Capital Partners VI, L.P. TBD TBD
Venture Overage Fund
Venture Overage Fund, L.P. $183M 2015
Venture Overage Fund II, L.P. TBD TBD
Private Credit Funds
Innovation Credit Fund VIII, L.P. $607M 2015
Innovation Credit Fund VIII A, L.P. $204M 2021
Innovation Credit Growth IX, L.P. TBD TBD
Innovation Credit Income II, L.P. TBD TBD
Other Fund of Funds
Preferred Return Funds, L.P. and related vehicles $161M 2007
SVB FG Fund Investments
300+ active Limited Partnership investments $80M 1995 2010
1 AUM based on commitments as of 11/1/2021 SIF Ascension is still actively fundraising, so committed capital is expected to increase.
2 Arterial, SIF XI, SIF Plus, CP VI, VOF II, Innovation Credit Growth IX, and Innovation Credit Income II are all expected to hold their first closes in late 2021/early 2022.
SVB Confidential
Leadership:
The Investment Team is led by four Managing Partners with 100+ years of combined investing experience. The Team is further supported by a Managing Director and 12 investment professionals spanning Vice President to Analyst. The Investment Team is organized by area of focus; there are core teams dedicated to each of our investment strategies (fund of funds, direct funds, and credit funds). Over the last several years there has been a concerted effort to add depth to the team and we expect this will continue for the foreseeable future.

Under the leadership of John China, President, SVB Capital has been deliberate in adding experienced professionals to the organization in key areas that will enable us to take the firm to the next level. Most recently, the focus has been on individuals that will drive investor engagement and manage risk and compliance across the platform
Capital Partners Investment Summary: Capital Partners (CP IV and CP V) aims to lead and price second institutional rounds by leveraging the broader Silicon Valley Bank („SVB“) platform to source, proactively engage, finance, and add value to leading founders and entrepreneurs. The Funds are focused on capital-efficient business models, predominantly in the software and services sectors. CP IV and CP V each have a concentrated portfolio of 15 20 core investments, complemented by a number of earlier stage positions including frontier tech, digital health, and consumer. CP IV and CP V both target a 3 5x net return and a 20% net internal rate of return (IRR) to Limited Partners.
For the past 20 years, we have had one specific goal to identify and invest in the next generation of industry-defining companies. With the addition of Sulu Mamdani in 2006 and Beau Laskey in 2013, we had the opportunity to refine our investment strategy and focus on the market segments where the bank and our team have expertise. With the addition of Tilli Kalisky Bannett in 2018, we were able to broaden our network and deepen our expertise, allowing us to successfully execute on the current strategy.
SVB Confidential
Our ability to identify companies early and with high conviction is a result of where we sit within the ecosystem. SVB Capital’s direct funds benefit from being a part of the broader SVB platform, in addition to their alignment, insights, and partnership with our fund of funds program.
• Silicon Valley Bank: SVB is the leading financial institution for the Innovation Economy. Throughout its 30+ year history, the bank has amassed a market share of 50% of all US venture backed technology and life sciences companies, represented by ~35,000 clients. 70% of all US venture capital firms are clients of SVB. 69% of all US VC backed companies with an IPO in 2019 were SVB clients. This deep history within the heart of the technology/investment ecosystem is a leading differentiator for SVB and SVB Capital. Additionally, SVB’s commercial banking teams are organized by sectors. The broad teams break out into six sectors enterprise, fintech, frontier tech, consumer, energy & resource innovation, and Life Sciences healthcare.
• Fund of Funds: Through SIF, SVB Capital has developed partnerships through long standing LP positions with the world’s leading VC managers. GP relationships include Sequoia, Accel, Andreessen Horowitz, Index, Kleiner Perkins, Greylock, Lightspeed, Orbimed, and Frazier. These relationships provide SVB Capital and our direct equity team with unique visibility into the venture capital ecosystem. Our colleagues at the bank and our Investment Team are in constant communication with GPs at the top established and emerging managers in the industry. These conversations help to inform us of macro level trends, company formation/capitalization, and emerging investment opportunities to generate returns for our investors. Our fund of funds program gives us both visibility into high performing companies and conviction to deploy capital through the insights collected from our portfolio GPs.
• Data: The SVB Capital engagement model is anchored by the data that we have and the ways we leverage it for the benefit of our investment activities. The holistic model captures companies off cycle (by using proprietary data), proactively engaging through our network, providing attractive, non competitive financing, and adding value to the company through the SVB platform.
We can then create and structure deals that are optimal for all parties. Because the companies we engage are top performing and highly filtered, insiders typically want to keep or increase their pro rata. SVB Capital can price the deal, leveraging our ability to flex up or down our ownership percentages. It makes us a neutral, non competitive party in an insider’s round. We also utilize Rights to Invest (RTIs) through our banking colleagues to secure contractual options to invest in the highest performing organizations.

SVB Confidential
SVB Capital’s unique ability to structure a deal without disrupting the existing General Partner dynamic is attractive to founders. High performing companies already work with top General Partners and our pre existing relationships to these managers and the lack of necessity for a specific ownership percentage helps us to win deals and preserve existing investor dynamics. Many venture capital firms talk about how they have a network of CEOs that they can tap into, but very few have the network that SVB has in terms of the access to CEOs, General Partners, and the corporate community (through SVB’s corporate innovation arm). Through this corporate innovation arm, we can provide portfolio companies with introductions to potential clients at Fortune 500 companies or, in the cases of certain companies (e.g., Roofstock and Vouch), provide distribution channels through Silicon Valley Bank. Our position at the center of founders, investors, and global investors is thus critical to our differentiation
Performance Update: The Salvation Army, A Georgia Corporation committed $15M to Capital Partners IV, L.P. in April 2017 and $20M to Capital Partners V, L.P. in October 2020 Please find performance figures for this investment as of June 30, 2021 below3: CP IV Performance Summary4: CP V Performance Summary4:
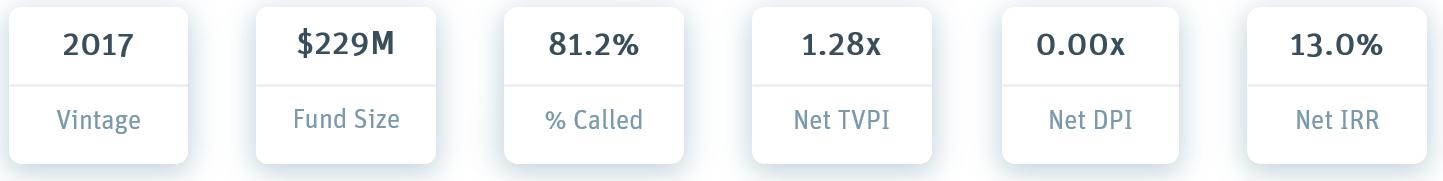
3 Investor level performance may differ from fund level performance. The information contained herein is estimated, unaudited; and therefore, subject to change. N/M denotes non meaningful performance as of the stated date. Past performance is not indicative of future results.
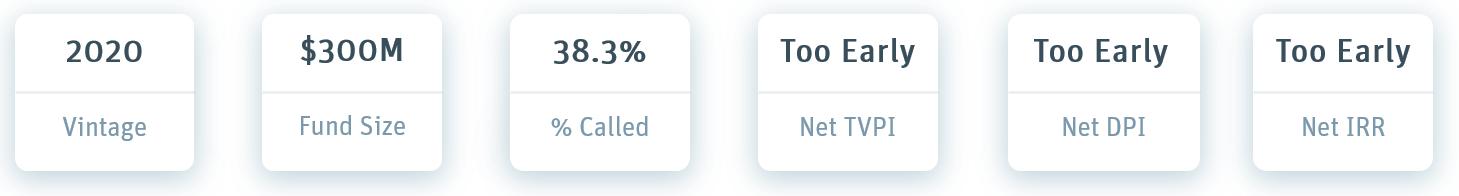
4 Performance is net to Limited Partners. IRR, DPI, and TVPI data as of 6/30/21. Past performance is not indicative of future results

SVB Confidential
SVB Capital Disclosures
Acceptance of this presentation by any person constitutes an agreement to be bound by the following terms and conditions:
This presentation is being made on a confidential basis for the purpose of providing certain information about SVB Capital, Capital Partners IV, Capital Partners V, Capital Partners VI, and CP Opportunity Fund II. An investment in the Fund will entail a high degree of risk and no assurance can be given that the Fund will achieve its investment objectives. The information contained herein is as of the date set forth on the cover page hereto (unless otherwise indicated), is subject to change without notice and may be superseded by subsequent market events or for other reasons. SVB Capital assumes no obligation to update the information herein. Unless otherwise specified, any views reflected herein are those of SVB Capital. Certain information contained herein, particularly in respect of market data and economic and other forecasts, is from third party sources. SVB Capital does not represent that such information is accurate or complete, and SVB Capital has not undertaken any independent review of such information. Historic market trends are not reliable indicators of actual future market behavior or future performance of any particular investment which may differ materially,and should not be relied upon as such
Nothing contained herein constitutes investment, legal, tax or other advice nor is it to be relied on in making an investment or other decision. There can be no assurance that an investment strategy will be successful. No representation or warranty, express or implied, is made or given by or on behalf of SVB Capital or any other person as to the accuracy and completeness or fairness of the information contained in this presentation and no responsibility or liability is accepted for any such information. By accepting this presentation, the Recipient acknowledges its understanding and acceptance of the foregoing statement.
Not an Offer. This report does not constitute an offer to sell or a solicitation of an offer to buy an interest in any fund sponsored by any affiliate of SVB Financial Group. Such an offer can be made solely to accredited investors (or the applicable equivalent thereof) in accordance with all applicable laws by means of the organizational agreements for the specific fund, subject to all of the risks described therein.
Confidential and Proprietary. This presentation is strictly confidential and contains trade secrets. It is subject to non disclosure and confidentiality agreements. It is for the exclusive use of the intended recipient and is not to be disclosed, copied or otherwise communicated to anyone without the prior written consent of SVB Financial Group. Each person who has accessed or accepted the information in this presentation accepts responsibility for any disclosure to or by his or her employees, agents or representatives.
Forward Looking Statements. The information in this presentation contains “forward looking statements” as that term is used in securities laws. All statements regarding the General Partner’s expected or potential financial position, projections, business, and strategies are forward looking statements. Although the General Partner and its management believe that the expectations reflected in these forward looking statements are reasonable and have based those statements on the beliefs of and assumptions made by the General Partner and its management, such expectations may prove to be incorrect.
Historical Performance. The historical returns achieved with respect to any particular investment or with respect to a company or fund to date are not a prediction of future performance or a guarantee of future results, and there can be no assurance that these or comparable returns will be achieved by the investments made by SVB Financial Group or any SVB Financial Group managed fund has a whole.
Fiduciary Rule Not Investment “Advice” Under ERISA. The information contained herein is not “investment advice” as defined under ERISA and the U.S. Tax Code. Further, SVB Financial Group is not being paid for any financial planning or needs analysis services from qualified plan assets and, therefore, is not an “investment advice fiduciary” with respect to any qualified plan under ERISA and the U.S. Tax Code.
Copyrights and Trademarks. All material presented, unless specifically indicated otherwise, is under copyright to SVB Financial Group and its affiliates and is for informational purposes only. All SVB trademarks, service marks and logos used in this material are trademarks or service marks or registered trademarks or service marks of SVB Financial Group or one of its affiliates.
© 2021 SVB Leerink LLC. All Rights Reserved. SVB Leerink LLC is a member of SVB Financial Group. Investment products and/or services offered by SVB Leerink LLC are not insured by the FDIC or any other federal government agency and are not guaranteed by Silicon Valley Bank or its affiliates. SVB Leerink LLC is a member of FINRA and SIPC. SVB Leerink MEDACorp LLC (“MEDACorp”) is a wholly owned subsidiary of SVB Leerink Holdings LLC and an affiliate of SVB Leerink LLC.
Compliance Approval: 1121 0175AD 110422
SVB Confidential
November 2021


Vanguard firm history
Vanguard was founded on a simple but revolutionary idea that a mutual fund company should not have outside owners. From our beginning in 1975, Vanguard has been a very different kind of investment firm. To ensure that our interests are aligned with those of our investors, Vanguard is structured in the U.S. as a “mutual” mutual fund company, owned by the Vanguard funds, which are owned by the investors who put their hard earned money in them. Four decades later, we’re still the only company in the industry structured this way. Throughout our history of serving investors, our unique ownership structure and client first philosophy have driven many distinctive business decisions that set us apart.
Vanguard has grown to become one of the world’s largest investment management companies, with locations in the United States, Australia, the United Kingdom, Europe, Asia, and the Americas. Underlying it all has been our long standing commitment to providing an exceptional value: outstanding performance and service at low costs.
Vanguard’s employees
As of September 30, 2021 Vanguard had 17,300 employees.
Vanguard’s assets under management
As of September 30, 2021 Vanguard’s assets under management totaled over $8.0 trillion.
Vanguard personnel changes
On January 1, 2019, the board of directors of The Vanguard Group and the boards of trustees of the Vanguard Funds elected Tim Buckley as chairman of the boards of Vanguard and the Vanguard Funds. Mr. Buckley succeeded Bill McNabb, who served as chairman since January 2010, making him the fourth chairman in Vanguard’s 43 year history.
Changes in firm structure
Vanguard has not experienced any changes in our corporate/ownership structure.
Vanguard’s Response and Preparedness: COVID 19 July 9, 2020
Vanguard takes business continuity very seriously. We continue to consider and implement new procedures and expand benefits to safeguard the well being of our crew, contingent workers, and business partners, all while balancing the need to serve our global clients during this period of uncertainty.
The Salvation ArmyVanguard Institutional Index Fund Institutional Plus Shares (VIIIX)
Donald M. Butler, CFA, Principal. Portfolio manager; Advised the fund since 2000; Worked in investment management since 1997; B.S., B.A., Shippensburg University.
Michelle Louie, CFA. Portfolio manager; Advised the fund since 2017; Worked in investment management since 2011; B.S., The American University, M.B.A., Georgia Institute of Technology.
Objective Vanguard Institutional Index Fund seeks to track the investment performance of the Standard & Poor’s 500 Index, an unmanaged benchmark representing U.S. large capitalization stocks. Using full replication, the portfolio holds all stocks in the same capitalization weighting as the index.
Performancecommentary
For the 12 month period ended September 30, 2021, the index returned 30.00%. Information technology (+29.5%), financials (+59.2%), and communication services (+38.3%) were the top contributors. Utilities (+10.9%) added the least.
May 2013 - Inception Date Initial Investment $ 6 0,000,000
10/1/2020 Beginning Balance 2 20,994,273 2/26/2021 Buy 1 5,000,000 7/20/2021 Sell 3 9,450,000 9/30/2021 Ending Balance $ 2 63,417,971
Investment performance returns as of September 30, 2021
One yearThree years Five years Institutional Index Fund Institutional Plus Shares 30.00%15.99%16.88% S&P 500 Index 30.00%15.99%16.90%
Institutional Index Fund Institutional Plus Shares
Annual Performance
2020 18.41% 2019 31.48% 2018 -4.41% 2017 21.82% 2016 11.95% 2015 1.39% 2014 13.68% 2013 32.37% 2012 16.00% 2011 2.12% 2010 15.07% 2009 26.66% 2008 -36.94% 2007 5.50% 2006 15.81% 2005 4.93% 2004 10.90% 2003 28.69%
The Salvation Army Vanguard Institutional Index Fund Institutional Plus Shares (VIIIX) - Sizeable Cash FlowMid Cap Index Fund Institutional Shares (VMCIX)
Donald M. Butler, CFA, Principal. Portfolio manager; Advised the fund since 2000. Worked in investment management since 1997; B.S., B.A., Shippensburg University.
Awais Khan, CFA. Portfolio manager; Advised the fund since 2021. Worked in investment management since 2007; B.S., University of North Carolina at Charlotte, B.S.B.A., University of North Carolina at Charlotte.
Objective Vanguard Mid Cap Index Fund seeks to track the investment performance of the CRSP US Mid Cap Index, an unmanaged benchmark representing medium size U.S. firms. Using full replication, the portfolio holds all stocks in the same capitalization weighting as the index.
Performancecommentary
For the 12 month period ended September 30, 2021, the CRSP US Mid Cap Index returned 36.12%. Technology (+43.2%), financials (+60.8%), and industrials (+37.6%) were the top contributors. Consumer staples (+8.2%) contributed the least.
Vanguard Mid-Cap Index Fund Institutional Shares (VMCIX) - Sizeable Cash Flow
June 2018 - Inception DateInitial Investment $ 8 0,000,000
10/1/2020 Beginning Balance 6 3,763,851 7/20/2020 Sell 7 ,900,000 9/30/2021 Ending Balance $ 7 8,066,984
Investment performance returns as of September 30, 2021 One yearThree years Five years
Mid-Cap Index Fund Institutional Shares 36.11%14.75%14.60% CRSP US Mid Cap Index 36.12%14.76%14.61%
Mid-Cap Index Fund Institutional Shares
Annual Performance
2020 18.26% 2019 31.04% 2018 -9.24% 2017 19.29% 2016 11.23% 2015 -1.33% 2014 13.78% 2013 35.17% 2012 16.04% 2011 -1.91% 2010 25.69% 2009 40.49% 2008 -41.80% 2007 6.19% 2006 13.75% 2005 13.94% 2004 20.52% 2003 33.84%
The Salvation ArmyVanguard Growth Index Fund Institutional Shares (VIGIX)
Gerard C. O'Reilly, Principal. Portfolio manager. Advised the fund since 1994. Worked in investment management since 1992. B.S., Villanova University.
Walter Nejman Portfolio manager. Advised the fund since 2016. Worked in investment management since 2008. B.A., Arcadia University. M.B.A., Villanova University.
Objective Vanguard Growth Index Fund seeks to track the performance of the CRSP US Large Cap Growth Index, a broadly diversified index predominantly made up of growth stocks of large U.S. companies. The fund attempts to replicate the target index by investing all, or substantially all, of its assets in the stocks that make up the index, holding each stock in approximately the same proportion as its weighting in the index.
Performancecommentary
For the 12 month period ended September 30, 2021, the CRSP US Large Cap Growth Index returned 28.13%. Technology (37.2%), consumer discretionary (+19.0%) ,and industrials (+19.9%) added the most to results. There were no detractors for the year.
Vanguard Growth Index Fund Institutional Shares (VIGIX) - Sizeable Cash Flow
September 2016 - Inception DateInitial Investment $ 4 1,000,000
10/1/2020 Beginning Balance 3 9,053,060
7/20/2021 Sell (21,000,000) 9/10/2021 Sell $ (29,832,803) 9/30/2021 Ending Balance fully liquidated
Investment performance returns as of September 30, 2021 One yearThree years Five years
Vanguard Growth Index Fund Institutional Shares 28.09%22.78%22.16%
CRSP US Large Cap Growth Index 28.13%22.82%22.19%
Vanguard Growth Index Fund Institutional Shares
Annual Performance
2020 40.20% 2019 37.26% 2018 -3.33% 2017 27.81% 2016 6.13% 2015 3.33% 2014 13.62% 2013 32.41% 2012 17.04% 2011 1.89% 2010 17.17% 2009 36.50% 2008 -38.22% 2007 12.73% 2006 9.20% 2005 5.25% 2004 7.38% 2003 26.10%
The Salvation Army
Vanguard Dividend Appreciation ETF (VIG)
Gerard C. O'Reilly, Principal. Portfolio manager. Advised the fund since 2016. Worked in investment management since 1992. B.S., Villanova University.
Walter Nejman. Portfolio manager. Advised the fund since 2016. Worked in investment management since 2008. B.A., Arcadia University. M.B.A., Villanova University.
Objective Vanguard Dividend Appreciation ETF seeks to track the performance of the NASDAQ US Dividend Achievers Select Index, which includes US common stocks that have a history of increasing dividends for at least ten consecutive years. Vanguard Dividend Appreciation ETF is an exchange traded share class of Vanguard Dividend Appreciation Index Fund. Using full replication, the fund invests in all of the index stocks, holding each stock in approximately the same proportion as its weighting in the index.
Performancecommentary
For the 12 months ended September 30, 2021, the NASDAQ US Dividend Achievers Select Index 21.66%. The largest contributors were industrials (+22.4%), consumer discretionary (+24.2%), and technology (+32.0%). Basic materials (+17.1%) added the least.
October 2012 - Inception Date Initial Investment $ 3 8,348,877
10/1/2019 Beginning Balance 7 9,892,627
7/21/2021 Buy 1 2,951,080 7/22/2021 Buy $ 1 9,193,877
7/27/2021 Buy $ 1 ,998,504 9/30/2021 Ending Balance $ 1 30,536,260
Investment performance returns as of September 30, 2021 One yearThree years Five years
Vanguard Dividend Appreciation ETF 21.42%13.61%15.04%
NASDAQ US Dividend Achievers Select Index 21.48%13.70%15.12%
Vanguard Dividend Appreciation ETF Annual Performance
2020 15.46% 2019 29.71% 2018 -2.02% 2017 22.22% 2016 11.84% 2015 -1.95% 2014 10.06% 2013 28.99% 2012 11.61% 2011 6.21% 2010 14.67% 2009 19.59% 2008 -26.41% 2007 5.81% 2006* 8.92%
* Since inception 04/21/2006
The Salvation Army
Vanguard Dividend Appreciation ETF (VIG)- Sizeable Cash FlowVanguard Real Estate Index Fund Institutional Shares (VGSNX)
Gerard C. O'Reilly, Principal. Portfolio manager. Advised the fund since 2016. Worked in investment management since 1992. B.S., Villanova University.
Walter Nejman. Portfolio manager. Advised the fund since 2016. Worked in investment management since 2008. B.A., Arcadia University. M.B.A., Villanova University.
Objective Vanguard Real Estate Index Fund seeks to track the investment performance of the MSCI US Investable Market Real Estate 25/50 Index. The fund seeks to provide high income and moderate long term capital growth by investing in stocks issued by commercial REITs. Using a full replication process, the fund seeks to hold all stocks in the same capitalization weighting as the index.
Performancecommentary
For the 12 month period ended September 30, 2021, the Real Estate Spliced Index returned 33.64%. The largest contributors were residential REITs (+52.4%), specialized REITs (+18.0%), and retail REITs (+67.7%). Real estate operating companies (+22.1%) contributed the least.
Vanguard Real Estate Institutional Shares (VGSNX)- Sizeable Cash Flow
November 2018 - Inception DateInitial Investment $ 2 3,350,000 10/1/2020 Beginning Balance 3 9,992,113 9/30/2021 Ending Balance $ 5 2,322,815
Investment performance returns as of September 30, 2021 One yearThree years Five years Real Estate Index Fund Institutional Shares 33.48%12.02% 7.56% MSCI US Investable Market Real Estate 25/50 Index 33.64%12.11% 7.64%
Real Estate Index Fund Institutional Shares
Annual Performance
2020 -4.67% 2019 29.02% 2018 -5.93% 2017 4.93% 2016 8.51% 2015 2.45% 2014 30.28% 2013 2.48% 2012 17.65% 2011 8.70% 2010 28.56% 2009 29.76% 2008 -36.95% 2007 -16.38% 2006 35.15% 2005 12.05% 2004 30.93%
The Salvation Army
Vanguard Global ex U.S. Real Estate Index Fund Institutional Shares (VGRNX)
Justin E. Hales, CFA, CFP Portfolio manager. Advised the fund since 2015. Worked in investment management since 2006. B.A., University of Maryland.
Michael Perre, Principal Portfolio manager. Advised the fund since 2015. Worked in investment management since 1990. B.A., Saint Joseph’s University, M.B.A., Villanova University.
Objective Vanguard Global ex U.S. Real Estate Index Fund seeks to track the performance of a benchmark index that measures the investment return of international real estate stocks.
Performancecommentary
For the 12 month period ended September 30, 2021, the S&P Global ex U.S. Property Index returned 18.04%. The largest contributors were the Pacific (+16.9%), Europe (+22.1%), and emerging markets (+2.9%). The Middle East (+89.5%) added the least.
Vanguard Global ex-US Real Estate Indexe Inst Shares (VGRNX)- Sizeable Cash Flow
April 2019 - Inception DateInitial Investment $ 3 2,181,194 10/1/2020 Beginning Balance $ 4 4,520,021 9/30/2021 Ending Balance $ 5 1,926,867
Investment performance returns as of September 30, 2021 One yearThree years Five years
Vanguard Global ex-U.S. Real Estate Index Fund Inst Shares 17.47% 4.09% 4.40% S&P Global ex-U.S. Property Index 18.04% 3.95% 4.20%
Vanguard Global ex-U.S. Real Estate Index Fund Inst Shares
Annual Performance
2020 -6.89% 2 019 21.27% 2018 -9.47% 2017 26.52% 2016 1.76% 2015 -1.30% 2014 2.70% 2013 3.38% 2012 41.73% 2011* -16.49%
* Since inception 04/19/2011
Salvation Army
TheVanguard Equity Investment Group
Launched in 1975, The Vanguard Group, Malvern, Pennsylvania, is among the world’s largest equity and fixed income managers. As chief investment officer, Gregory Davis, CFA, oversees Vanguard’s Equity Index, Quantitative Equity, and Fixed Income Groups. Rodney Comegys, Principal and global head of Vanguard's Equity Index Group, is responsible for all equity index funds. The Equity Index Group (EIG) manages indexed equity portfolios covering U.S. and international markets. It has developed sophisticated portfolio construction methodologies and efficient trading strategies that seek to deliver returns that are highly correlated with target portfolio benchmarks. EIG manages Vanguard equity index funds. As with our fixed income index funds, our equity funds have an investment process that includes:
• Share/compare. Reconciling the day’s portfolio management system holdings to those listed on the funds’ formal accounting records.
• Cash flow projections. Estimating the day’s net cash flow for each portfolio.
• Long-term cash. Depicting the invested position and market valuations of each index fund, as well as estimating stock ex dividend activity and pending trade settlement schedules.
• Index updates. Performing systematic updating from index sponsors to ensure index data is current.
•
Rebalancing index fund portfolios
We rebalance all index funds daily. To avoid any cash drag in a portfolio during this rebalancing, we determine a given day’s net cash flow and invest it that same day. We identify any discrepancies the following morning and make any necessary adjustments to the rebalancing. We net all purchases and redemptions against each other to minimize trading, which helps keep costs low. Vanguard looks at futures contracts before purchasing stocks and may substitute them for direct stock purchases when the futures are trading near or below their theoretical fair value. To avoid leveraging the portfolio when using futures, EIG invests an amount equal to the notional amount of the futures contracts in a diversified pool of short term, high quality money market instruments.
Executing stock transactions for portfolios
EIG executes stock transactions in several ways. First, we cross trades with other Vanguard funds whenever possible. When we cannot cross trades internally, we may:
• Send them to the appropriate exchange’s floor over the Super DOT (Direct Order Transfer) system.
• Distribute them electronically to an agency trader or a market maker, either with specific instructions or pursuant to a prearranged deal.
• Cross them on an electronic communications network, such as POSIT or Liquidnet.
• Trade them with traditional brokers.
Indexing approach
Vanguard aims to provide the tightest tracking error versus each Fund’s target benchmark index, at the lowest cost, all things considered. The decision regarding which approach to employ for each Fund focuses on efficiency, with the goal of producing the tightest tracking error at the lowest costs.
EIG typically uses a complete replication strategy for Vanguard index funds. Conceptually, daily cash flow should be allocated across a small slice of every stock in the benchmark. To prevent the excessive broker commissions and custody fees that trading in smaller dollar amounts can cause our system allows for a minimum trade size.
Another technique EIG uses to reduce trading costs when constructing or rebalancing an index portfolio is an optimized (stratified sampling) approach. Optimization portfolios will hold a representative sample of stocks that will mirror risk and return characteristics of the target benchmark index while limiting the number of stocks in a basket. While this practice can cause the portfolio to have very slight misweightings of stocks, they are typically insignificant in a portfolio with substantial assets. EIG’s software program considers misweightings of stocks, and corrects for them in the subsequent day’s trading.
Both replication and optimization portfolios are subject to the same independent oversight and controls. For example, analysts independent of the portfolio management and trading process monitor constituent imbalances.
The Salvation ArmyThe performance data shown represent past performance, which is not a guarantee of future results. Investment returns and principal value will fluctuate, so investors’ shares, when sold, may be worth more or less than their original cost. For performance data current to the most recent month end, which may be higher or lower than that cited, visit our website at www.vanguard.com.
For more information about Vanguard funds, contact us or visit www.vanguard.com to obtain a prospectus. Investment objectives, risks, charges, expenses, and other important information about a fund are contained in the prospectus; read and consider it carefully before investing.
Confidentiality statement
The Vanguard Group ("Vanguard") asks and expects that Salvation Army, will regard as confidential and retain in strict confidence all knowledge of Vanguard's business or technical information, and any information relating to Vanguard's clients and/or personnel (including but not limited to the identity thereof), products, services, research and development, processes, techniques, designs, financial planning practices, and marketing plans and such information of third parties that Vanguard may be obligated to hold as confidential, whether in tangible or intangible form that may be obtained from any source as a result of this RFP, the RFP process, or any related discussion and/or investigation either designated by Vanguard as proprietary or confidential or which is reasonably or customarily considered to be such (collectively, "Confidential Information"). To that end, Salvation Army shall not use, disclose, or distribute to any person, firm, or entity any Confidential Information, except as strictly necessary to evaluate Vanguard's response and such information in the context of this RFP. Further, neither Salvation Army nor its officers, directors, employees, consultants, representatives, or agents shall make known, divulge, or communicate any Confidential Information to any person, firm, or enterprise.
Vanguard expects that Salvation Army will use reasonable efforts at all times to ensure that Vanguard's expectations regarding confidentiality are met.
The Salvation ArmyFor more information about Vanguard funds, visit institutional.vanguard.com or call 800 523 1036 to obtain a prospectus or, if available, a summary prospectus. Investment objectives, risks, charges, expenses, and other important information about a fund are contained in the prospectus; read and consider it carefully before investing.
All investing is subject to risk, including the possible loss of the money you invest. Funds that concentrate on a relatively narrow market sector face the risk of higher share price volatility. Bond funds are subject to the risk that an issuer will fail to make payments on time, and that bond prices will decline because of rising interest rates or negative perceptions of an issuer's ability to make payments. Prices of mid and small cap stocks often fluctuate more than those of large company stocks. Investments in stocks or bonds issued by non U.S. companies are subject to risks including country/regional risk and currency risk. These risks are especially high in emerging markets. While U.S. Treasury or government agency securities provide substantial protection against credit risk, they do not protect investors against price changes due to changing interest rates.
Investments in Target Retirement Funds or Trusts are subject to the risks of their underlying funds. The year in the fund name refers to the approximate year (the target date) when an investor in the fund or trust would retire and leave the workforce. The fund or trust will gradually shift its emphasis from more aggressive investments to more conservative ones based on its target date. An investment in the Target Retirement Fund or Trust is not guaranteed at any time, including on or after the target date.
Vanguard collective trusts are not mutual funds. They are collective trusts available only to tax qualified plans and their eligible participants. Investment objectives, risks, charges, expenses, and other important information should be considered carefully before investing. The collective trust mandates are managed by Vanguard Fiduciary Trust Company, a wholly owned subsidiary of The Vanguard Group, Inc.
A stable value investment is neither insured nor guaranteed by the U.S. government. There is no assurance that the investment will be able to maintain a stable net asset value, and it is possible to lose money in such an investment.
All purchase or redemption fees are paid directly to the fund(s) to compensate long term shareholders for the costs of trading activity, and therefore are not loads. For all Vanguard funds with adjusted returns, fees are assessed on redemptions made within certain time periods after a purchase to discourage short termtrading.
Admiral, Broker Choice, Explorer, FES, LifeStrategy, MoneyWhys, Morgan, Of Mutual Interest, One Step, One Step Enroll, One Step Invest, One Step Retire, One Step Savings Escalator, PlainTalk, Plan Sponsor Bridge, STAR, Tele Account, The Vanguard Group, Unmatchable value for investors, Vanguard, Vanguard Advantage, Vanguard Brokerage Services, Vanguard Institutional Advisory Services, Vanguard Financial Education Series, Vanguard Plan Sponsor Bridge, Vanguard Portfolio Watch, Vanguard Unmatchable Excellence, Vanguard.com, VBS, VBO, Vanguard ETF, Vanguard ETFs ,Vision, VOICE, VUE, Wellesley, Wellington, Windsor and the ship logo are trademarks of The Vanguard Group, Inc.
Financial Engines is a trademark of Financial Engines, Inc. All rights reserved. Used with permission. The Vanguard Group has partnered with Financial Engines to provide the Vanguard Managed Account Program and Personal Online Advisor, powered by Financial Engines. Financial Engines is an independent, federally registered investment advisor that does not sell investments or receive commission for the investments it recommends.
All advisory services are provided by Vanguard Advisers, Inc. (VAI) a federally registered investment advisor and an affiliate of The Vanguard Group, Inc. (Vanguard). Vanguard is owned by the Vanguard funds, which are distributed by Vanguard Marketing Corporation, a registered broker dealer affiliated with VAI and Vanguard. Neither Vanguard nor Financial Engines guarantees future results.
Disclosure
The Salvation Army
This page intentionally left blank


November 2021 WELLS FARGO ASSET MANAGEMENT Berkeley Street Emerging Markets Equity The Salvation Army Southern Territory Emerging Markets Equity 3c Fund Wells Fargo Asset Management is a trade name used by the asset management businesses of Wells Fargo & Company. FOR PROFESSIONAL INVESTORS ONLY *Represent the 3 year IR and TE
Wells Fargo Asset Management and affiliate
Our specialized teams provide a broad range of differentiated investment solutions to help our diverse range of clients meet their investment objectives.
$587B
1,551
dedicated team members
467 global investment talent2
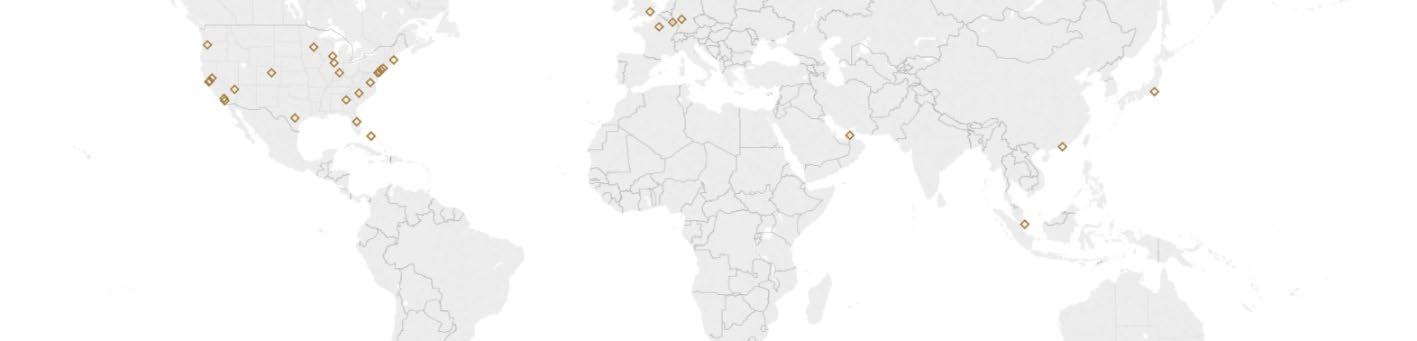
24 offices worldwide 21 average years in industry3
Investment team
Jerry Zhang, PhD, CFA® Managing Director and Senior Portfolio Manager
Jerry Zhang is seniorportfolio manager and head of the Berkeley Street Emerging Marketsteam at Wells Fargo Asset Management (WFAM).Jerry joined the firmin 2004 and became a PM in 2006.
Derrick Irwin, CFA® Portfolio Manager
Derrick Irwin is a portfolio manager with the Berkeley Street Emerging Markets team at WFAM. Derrick joined the firm in 2005 and became a PM in 2011.
Allspring Global Management
Richard Peck, CFA® Portfolio Manager
Richard Peck is a portfolio manager with the Berkeley Street Emerging Markets Equity team at WFAM. Rich joined the firm in 2010 and became a PM in 2015.
We are aligning ourselves with a new partnership that fully supports the ethos of our firm, dedicated solely to providing asset management services to institutional, retirement, and wealth management clients worldwide. With two well respected private equity partners, we will have both the support and autonomy to provide investment solutions to help our clients grow their assets, generate income, and preserve wealth. Clients remain at the center of what we do. We remain steadfast to our core principles of putting our clients first. Our investment process will remain intact. WFAM investment capabilities and strategies are core to the GTCR and Reverence Capitals’ purchase and acquisition, and our investment professionals will remain focused on investing our clients’ capital and driving alpha. Wells Fargo will own a 9.9% equity interest. We are equally excited to maintain Wells Fargo as an important client and distribution partner with confidence we expect to sustain our long term relationship for years to come. New investment is planned. GTCR and Reverence Capital have a track record of growing businesses for the long term, and they are committed to growing our business and providing the resources necessary to better serve our clients and optimize their investment outcomes The board of the new company will have a new executive chairman Joseph A. Sullivan will be executive chairman of the board and CEO of the new company, effective following the closing of the transaction. We will continue to communicate. As we transition to our new ownership structure, we are committed to providing timely transparency of relevant information to clients, stakeholders, and partners
Just the facts
Announced: February 23, 2021
Partnership with: GTCR LLC and Reverence Capital Partners LP
Closing date: November 1, 2021
Transaction details: Acquire all Wells Fargo Asset Management1 (WFAM) legal entities, as well as Wells Fargo Bank N.A.’s business of acting as trustee to its collective investment trusts
Beyond the close: A stand alone asset manager with the autonomy to provide investment solutions to help our clients grow their assets, generate income, and preserve wealth
Source: Wells Fargo Asset Management. All figures as of September 30, 2021 Please note that the assets under management figures provided have been adjusted to eliminate any duplication of reporting among assets directed by multiple investment teams, and includes $92.8B from Galliard Capital Management ($76.1B Stable Value; $16.6B Fixed Income), an affiliated investment advisor that is not part of the WFAM trade name/GIPS firm.2 Global investment talent includes directors and associate level professionals.3 Represents average years of investment industry experience of global investment talent.

WELLS FARGO ASSET MANAGEMENT | 2
Assets under management1 $B Equity (including alternatives) $ 106.4 Fixed income $ 196.6 Money market $ 196.4 Asset allocation $ 12.3 Stable value $ 76.2
Berkeley Street Emerging Markets Equity
Distinguishing characteristics
Exclusive focus of the team
• Dedicated investment team focused exclusively on the Emerging Markets strategy
• 153 cumulative years of industry investment experience
Unique investment approach
• Sequential focus on quality, then valuation
• Differentiated approach to identifying quality companies
Strong firm culture of risk management
• Risk management at the research and portfolio construction levels
• ESG analysis and management engagement
• Risk management oversight at the firm level
Competitive short and long term track record
• Focus on capital preservation in down markets (2008, 2011, 2013, 2015 and 1Q 2020)1
• Good participation in up markets (2007, 2009, 2010, 2012, 2016, 2017, 2019 and 2Q 4Q 2020)1
• Composite outperformed the MSCI Emerging Markets index over all 180 rolling 5 year periods calculated monthly over 15 years to 9/30/211,2
Investment objective, philosophy and approach
Objective
• Seek to outperform the MSCI Emerging Markets Index with managed levels of risk
• Avoid ‘permanent capital loss’
• Core investment strategy with emphasis on bottom up stock selection
Philosophy A strict sequential process that looks for “Quality at a Compelling Price”
• Quality: “Companies that can earn a Return on Capital > Cost of Capital for an extended period of time, for reasons we understand”
• Compelling price: “Discount to our assessment of the long term intrinsic value”
Quality companies create intrinsic value from profitable investment of retained earningsand dividend payout
Quality companies may preserve value in adversity while weak companies face risk of permanentcapital destruction
Quality companies allow for increased conviction in our assessment of long term sustainability and intrinsic value
Market inefficiencies provide opportunities to acquire quality companies at discount prices
Approach
“Quality Pool” — Distill the overall universe into a pool of approximately 300 stocks that best meet our quality criteria
1 Berkeley Street Emerging Markets Equity strategy
Conduct in depth fundamental appraisal and valuation analysis on stocks within the quality pool
Maintain diversified portfolio through disciplined stock selection and monitoring with risk control overlay
2 Gross of fee performance for periods ending September 30, 2021. Source: Wells Fargo Asset Management Note: The GIPS® compliant presentation can be found at the end of this presentation, including information on net returns. Past performance is not a reliable indicator of future results.
WELLS FARGO ASSET MANAGEMENT |
Berkeley Street Emerging Markets Equity
Investment process overview
Fundamental Research Portfolio Management
Quality
• Idea generation
• External insights
• Quality tests
• ESG framework
• Depth of research
Valuation
• Identify long term value
• Valuation techniques
• Scenario analysis
Portfolio construction
• Bottom up stock selection
• Portfolio structure and diversification
Monitoring and sale
• Continuous monitoring of investment thesis
• Management engagement
Emerging Markets Portfolio
90 –130 stocks Based on Quality Pool
• Base case and stress case valuations
• Active risk management
• Analyst/PM conviction
Team overview
Portfolio Management
Jerry Zhang, PhD, CFA® Head of Team, Senior Portfolio Manager
Derrick Irwin, CFA® Portfolio Manager
Richard Peck, CFA® Portfolio Manager
Portfolio Specialists
Bob Hrabchak, CFA® Senior Portfolio Specialist
Aaron Socker Portfolio Specialist
• Portfolio limits
• Adjust exposure as appropriate ~300 companies in quality pool Investment opportunity Bottom-up construction Valuation discipline
Research
Jerry Zhang, PhD, CFA® Head of Team, Senior Portfolio Manager
Derrick Irwin, CFA® Portfolio Manager
Richard Peck, CFA® Portfolio Manager
Prashant Paroda Portfolio Manager
Carolina Pierry Senior Analyst
Lanjiang Guo, CFA® Senior Analyst
Kary Keith, CFA® Analyst
Hanh Nguyen Analyst
Jaime Viteri, CFA® Analyst
WELLS FARGO ASSET MANAGEMENT |
4
As of September 30, 2021 . Note: CFA® and Chartered Financial Analyst® are trademarks owned by CFA Institute
Valuation discipline
Account summary Performance
3Q21 YTD 1 year 3 years 5 years
Since Inception (02/06/2013)
Portfolio Gross (%) 13.52 6.83 13.94 12.01 10.73 6.23
Portfolio Net (%) 13.72 7.49 12.86 10.93 9.65 5.20 MSCI Emerging Markets (Net) Index (%) 8.09 1.25 18.20 8.58 9.23 4.34
Account summary
Beginning Market Value 10/1/2020 $32,534,436 Ending Market Value 09/30/2021 $34,705,136 Ending Number Units 1,832,606.98 Ending Unit Price $18.94 Transaction summary Date
WELLS FARGO ASSET MANAGEMENT |
Inflow/Outflow amount
02/06/2013 Initial Funding $25,000,000 08/15/2013 $9,000,000 01/17/2019 ($7,000,000) 09/03/2020 ($10,000,000) 07/22/2021 ($2,600,000) The information contained in this report represents estimated trade date investment calculations. Certain calculations may not be available for all time periods. Please refer to your custody statement for official portfolio holdings and transactions. Note that certain accounting methods may cause differences between this investment report and your custody statement. All above results include income and returns greater than one year are annualized. In US dollars
Analysis of performance
Emerging Markets performance review
• The MSCI EM (Net) Index rose 18.20% in the one year period as the market recovered from the pandemic, and gained in three of four quarters
• Diverse approaches to Covid 19 restrictions and stimulus, economic recoveries, policy normalization and China’s new regulations were market drivers
• Early signs of economic recovery led to partial withdrawal of aggressive stimulus designed to address the pandemic and recession
• Despite waves of rising Covid 19 cases, the improving economic outlook fueled strong market returns, increasingly led by economically sensitive companies
• Headwinds to EM included the Delta variant, debate over US tapering, China’s slowing economy and regulatory actions, rising inflation, and US China tension
• EM currencies rose 1.3% versus the U.S. dollar. South Africa’s rand rose 12.5% while Turkey’s lira fell 16.1%. Prices of oil and other commodities rose sharply on higher global demand, supply disruption and tighter supplies
• 9 of 11 sectors and 23 of 27 countries rose. Materials and energy were significant outperformers, while only consumer discretionary and real estate declined. Russia, India and Mexico were among leaders, while China was the only large country to fall
Portfolio performance review
• The portfolio underperformed the index return over the one year period
• Stock selection in China, Brazil, India, communication services, consumer discretionary and information technology had a large impact on relative performance
• The portfolio was adversely impacted by China regulatory activity and Brazil’s noisy presidential politics and interest rate hikes
• The portfolio benefitted from the team’s focus on high quality companies with strong and resilient business models
• Leading country contributors included China and Mexico due to strong stock selection, and an overweight position in the outperforming Mexico market
• Leading sector contributors included communication services and real estate due to stock selection in each and an underweight position in the underperforming real estate sector
• Leading country detractors included Brazil and India due to stock selection in each and an underweight position in the outperforming India market
• Leading sector detractors included materials, energy and information technology, due to stock selection in all three and an underweight position in the outperforming sectors
Impact Company
Notable Stock Specific Events in the Quarter
+ Li Ning Strong growth in revenue and market share, higher contribution from online, margin expansion
+ Alibaba Regulatory uncertainty and concerns over the impact of economic growth on consumption; portfolio is underweight
+ Bilibili Growth in users and revenue, improved monetization;new regulations targeted online gaming in Q3
+ HDFC Bank Beneficiary from recovery in business activity, asset quality and loan growth as lockdown relaxed
+ FEMSA
Americanas
New Oriental Education
- Lojas Americanas
Koolearn Technology
- Sun Art Retail
Improved business outlook benefited convenience stores, bottling and other divisions
Increased competition, weak results; merger of B2W (online) with assets of parent Lojas Americanas
New education industry regulations, including a requirement for k 9 after school tutoring to be non profit
Increased competition, interest rate hike, merger of B2W (online) with assets of parent Lojas Americanas
New education industry regulations, including a requirement for k 9 after school tutoring to be non profit
Growth of ecommerce and community group buying services increased competition for hypermarket operators
WELLS FARGO ASSET MANAGEMENT |
1 Year to September 30, 2021
Analysis of performance
Significate relative contributors (%)
1 Year to September 30, 2021
Company Sector Country Relative Contribution
Li Ning Company Limited Cons Disc China 2.40 Alibaba Group Holding Ltd. Cons Disc China 2.08 Bilibili, Inc. Com Svcs China 1.20 HDFC Bank Limited Fin India 0.64 Fomento Economico Mexicano SAB de CV Cons Staples Mexico 0.58
Significate relative detractors (%)
Americanas SA
Cons Disc Brazil 1.72 New Oriental Education & Technology Group, Inc. Cons Disc China 1.23
Lojas Americanas S.A. Cons Disc Brazil 0.76 Koolearn Technology Holding Limited Cons Disc China 0.71 Sun Art Retail Group Limited Cons Staples China -0.66
WELLS FARGO ASSET MANAGEMENT |
indicative of future results. This report is for analytical purposes only and is not a custodial statement. Certain accounting methods may
for official holdings, pricing and transactions.
prices and
transactions based. Benchmark
Significate country
contributors/detractors (%) Com Svcs Real Estate Cons Disc Health Care Cons Staples Util Fin Cash Indus Info Tech Energy Mat -2.00 -1.00 0.00 1.00 2.00 2.14 0.72 -0.01 -0.18 -0.18 -0.32 -0.73 -0.80 -0.87 -1.11 -1.19
China/ Hong Kong Mexico Indonesia South Africa Thailand Korea Russia Taiwan India Brazil -4.00 -2.00 0.00 2.00 2.09 1.25 0.29 0.22 0.17 -0.15 -0.35 -0.71 -1.56
Company Sector Country Relative Contribution Past performance is not
cause differences between this report and your custodial statement so please refer to your custodial statement
Source: FactSet Totals may not represent actual performance for the account or benchmark, as attribution is holdings based using daily end of day
is not
returns are net dividends. ¹Countries listed are the five largest relative contributors and five largest relative detractors for the time period. Sector relative contributors/detractors (%)
relative
-1.56
-3.45
Marketing outlook & positioning
Market outlook & positioning
As of September 30, 2021
• With the U.S. Fed contemplating tapering and China’s economy slowing, markets are understandably nervous about the outlook for EM equities.
• Memories of the 2013 “taper tantrum” are fresh, but substantially better current account positions in nearly all EM country suggests a replay is unlikely.
• China’s slower growth outlook, due to regulatory action, supply chain disruption, and stress in the property and power sectors, increases the likelihood of new stimulus. The PBoC may cut the required reserve ratio, lower interest rates or employ other tools to stimulate growth.
• The wave of China regulatory actions appears to have crested. Many initiatives make sense in the context of China’s economy and goals, but the volume and intensity was a surprise. New regulations and slower growth add uncertainty, but China equities are discounting a fairly negative outcome.
• Volatility may continue as economies normalize post COVID, but EM equities are better prepared to weather such an outcome.
• Return on equity in EM, after declining for much of the last decade is on an uptrend, but the relative valuation gap between EM and DM remains high.
• Corporate and consumer balance sheets are in relatively good shape and many EM countries are just now emerging from the burden of lockdowns.
• We address this outlook with a well diversified portfolio of high quality companies and vigilance to overall portfolio risk. This bottom up, risk adjusted approach is at the heart of our strategy.
Ten largest company weights (%)
Company Sector Country Weight Taiwan Semiconductor Manu... Info Tech Taiwan 7.9 Samsung Electronics Co.,... Info Tech Korea 5.7 Tencent Holdings Ltd. Com Svcs China 4.4 Reliance Industries Limit... Energy India 3.4 HDFC Bank Limited Fin India 3.1 Li Ning Company Limited Cons Disc China 3.1 Alibaba Group Holding Ltd... Cons Disc China 2.9 Bilibili, Inc. Com Svcs China 2.9 Meituan Cons Disc China 2.7 Fomento Economico Mexican... Cons Staples Mexico 2.6
Total 38.8
Past performance is not indicative of future results. This report is for analytical purposes only and is not a custodial statement. Certain accounting methods may cause differences between this report and your custodial statement so please refer to your custodial statement for official holdings, pricing and transactions. Source: FactSet Totals may not represent actual performance for the account or benchmark, as attribution is holdings based using daily end-of-day prices and is not transactions based. Benchmark returns are net dividends. ¹Countries listed are the five largest relative contributors and five largest relative detractors for the time period.
WELLS FARGO ASSET MANAGEMENT |
The Salvation Army Global Fixed Income
November 5, 2021
Presented by Agenda
Firm Overview Investment Process Overview Performance and Cash Flows Attribution Summary
Positioning and Characteristics
©2021, Brandywine Global Investment Management, LLC. All rights reserved. The views expressed herein represent the opinions of Brandywine Global Investment Management, LLC, and are not intended as a forecast or guarantee of future results. This information should not be considered a solicitation or an offer to provide any Brandywine Global service in any jurisdiction where it would be unlawful to do so under the laws of that jurisdiction.

Experience and Stability with a Global Presence
$69.5B Total AUM as of 9/30/2021
Experienced and Tenured
› Founded in 1986 with headquarters in Philadelphia and offices in London1 and Singapore2
Alternatives 3.3
225+ employees worldwide
Signatory of the UN-supported Principles for Responsible Investment (PRI)
By Client Type USD Billions
Subadvisory 28.0
Government 16.1
Pension 15.6
Corporate/Operating 3.2
Endowment/Foundation 3.1


Non-Discretionary 2.8
Individual Investor 0.8
Independent with Global
Support › Structure combines investment autonomy with access to broad global resources
Managed by investors, executive board includes senior portfolio managers averaging over 25 years with the firm and 35+ years in the industry
A specialist investment manager of Franklin Templeton3, we retain full control over investments, hiring, and compensation
Cost efficiencies and scale gained from Franklin Templeton shared corporate services
*Fundamental Equity Non-Discretionary assets of $2.8bn are included n AUM numbers. Non-discretionary assets are reported on a one-month lag.
1Brandywine Global Investment Management (Europe) Limited is authorized and regulated by the Financial Conduct Authority (the “FCA”). (FRN 472774), registered n Eng and and Wales, No. 632417; 2Brandywine Global Investment Management (Asia) Pte. Ltd.
3Franklin Resources, Inc. [NYSE: BEN] s a global investment management organization with subsidiaries operating as Franklin Templeton in over 165 countries. Please refer to Part 2 of our ADV for a discussion of the related specialist investment managers with whom Brandywine Global has a direct business relationship; for example, where we provide advisory services.
›
›
›
›
›
■
■
■
By Asset Class USD Billions
Fixed Income 49.9
Equity* 16.2
■
■
■
■
■
■
■
By Region USD Billions
USA 37.6
EMEA 13.0
Japan 7.3
Australia/New Zealand 4.2
Asia Pacific Ex-Japan 3.8
Canada 2.7
Other 0.8
■
■
■
■
■
■
■
Global Fixed Income Investment Team
As of 9/30/2021
David F. Hoffman, CFA
INVESTMENT STRATEGY COMMITTEE
Francis A. Scotland
Stephen S. Smith
♦ Years at Brandywine Global
◊ Years of investment experience
Richard Lawrence
Portfolio Manager ♦ 26 | ◊ 35+ Dir. Glob. Macro Research ♦ 15 | ◊ 35+ Senior Advisor ♦ 30 | ◊ 35+ EVP Portfolio Management ♦ 16 | ◊ 35+
Jack P. McIntyre, CFA
Anujeet Sareen, CFA
Brian L. Kloss, JD, CPA Tracy Chen, CFA, CAIA
Portfolio Manager ♦ 22 | ◊ 33 Portfolio Manager ♦ 5 | ◊ 27 Portfolio Manager ♦ 11 | ◊ 24 Portfolio Manager ♦ 13 | ◊ 19
PORTFOLIO MANAGEMENT TEAM
David F. Hoffman, CFA Jack P. McIntyre, CFA Anujeet Sareen, CFA Brian L. Kloss, JD, CPA
INVESTMENT RESEARCH & ANALYSIS
Michael Arno, CFA
Associate PM/Sr. Research Analyst
♦ 15 | ◊ 17
Sean Brooks, CFA, FRM MBS Analyst
♦ 7 | ◊ 24
Evan MacAyeal, CFA Research Analyst
♦ <1 | ◊ 7
Min Tian, CFA
Sr. Global Macro Research Specialist
♦ 15 | ◊ 15
Reina Berlien
Head of ESG ♦ 7 | ◊ 17
My Duong
Global Macro Research Specialist ♦ 5 | ◊ 7
John McClain, CFA PM ♦ <1 | ◊ 14
William Vaughan Research Analyst ♦ 6 | ◊ 10
Andrew Bogle Research Analyst
♦ 7 | ◊ 15
Brian L. Giuliano, CFA SVP, Client PM ♦ 13 | ◊ 16
Kevin O'Neil Research Analyst ♦ 18 | ◊ 20
Bill Zox, CFA PM ♦ <1 | ◊ 28
+8 Equity Analysts
Alberto J. Boquin, CFA Sr. Research Analyst ♦ 5 | ◊ 15
Renato Latini, CFA
Associate PM/Sr. Research Analyst ♦ 14 | ◊ 15
Jack Parker, CFA Research Analyst ♦ <1 | ◊ 6
J.Patrick Bradley
SVP, Investment Research ♦ 16 | ◊ 35+
Carol Lye
Associate PM/Sr. Research Analyst ♦ 12 | ◊ 14
Dorothee Rainis
Associate Director, Quantitative & Technical ♦ 5 | ◊ 13
PORTFOLIO COMPLIANCE
Luz E. Carey ♦ 35 | ◊ 35
PORTFOLIO MANAGEMENT IMPLEMENTATION & TRADING
Kerry Van Orden Dennis W. Dow Travis Crumley ♦ 13 | ◊ 33 ♦ 21 | ◊ 29 ♦ 16 | ◊ 18
MODELING & ANALYTICS
Team Size: 13 Team Size: 9 Team Size: 6
Larry Benedetto ♦ 13 | ◊ 28
Tracy Chen, CFA, CAIAInvestment Process Overview
Systematic and Disciplined Macro Economic Research
Valuation Process
Where is the valuation opportunity? Where is the price risk? What is the intrinsic value?
Bonds: We analyze high real yield, inflation expectations, default risk, and our internal valuation models.
Currencies: We analyze PPP, REER, real rates, and our internal valuation models.
Macro Process
Process
Where is the information opportunity? Where is the risk?
•Analyzing macro factors such as:
•Each country’s business and liquidity cycle
•Secular and political factors
•Environmental, social and governance factors
Establish Investment Themes
Portfolio Construction and Market Risk Analysis
Credit DecisionCurrency Decision Country Decision
Global & International Fixed Income Portfolios Duration Decision
LLC, and are not intended as
recommendation, investment advice, forecast or guarantee of future results It should not be assumed that investment in the regions
currencies listed and
decisions
will
profitable International securities and
may be subject to market/currency fluctuations,
may
additional risks associated with international investments International investing may not be suitable for everyone There is
guarantee that the investment
will meet
Macro
The views expressed above are those of Brandywine Global Investment Management,
a
or
account quality ratings or duration ranges were or will prove profitable, or that investment
we make in the future
be
ADRs
investment risks, and other risks involving foreign economic, political, monetary, taxation, auditing and/or legal factors There
be
no
strategy
its objective Past performance is no guarantee of future results. 1782
Performance and Cash Flows
Objective
We strive to capture interest income and additionally generate principal growth through capital appreciation when market conditions permit. Our goal is to outperform the investment benchmark by at least 2%, on an average annual basis, over rolling five-year periods.
Performance Summary
As of September 30, 2021 Inception Date: 6/30/2010
AccountMonthQTDYTD12m3yr5yr10yrSI2014201520162017201820192020
The Salvation Army, A Georgia Corporation (Gross) (1.67%)(2.22%)(3.19%) 4.76%4.60%3.33%3.27%3.96%5.52% (7.76%) 2.73%11.92% (3.07%) 8.41%10.50%
The Salvation Army, A Georgia Corporation (Net) (1.70%)(2.32%)(3.49%) 4.33%4.17%2.91%2.85%3.53%5.09% (8.14%) 2.30%11.46% (3.47%) 7.97%10.05% FTSE WGBI (USD) (2.26%)(1.24%)(5.93%)(3.33%) 3.72%1.35%1.06%2.05% (0.48%)(3.57%) 1.60%7.49% (0.84%) 5.90%10.11%
Funding, Contribution, Withdrawal Summary
Begin Date: 6/30/2010
End Date: 9/30/2021
The Salvation Army, A Georgia CorporationFTSE WGBI (USD)6/30/20 1010,000,000
The Salvation Army, A Georgia CorporationFTSE WGBI (USD)9/7/201 020,000,0000.00
The Salvation Army, A Georgia CorporationFTSE WGBI (USD)5/13/20 113,244,6600.00
The Salvation Army, A Georgia CorporationFTSE WGBI (USD)6/2/201 17,500,000.000.00
The Salvation Army, A Georgia CorporationFTSE WGBI (USD)2/13/20 135,000,000.000.00
The Salvation Army, A Georgia CorporationFTSE WGBI (USD)12/28/2 0150.00(9,000,000.00)
The Salvation Army, A Georgia CorporationFTSE WGBI (USD)9/14/20 200.00(10,000,000.00)
The Salvation Army, A Georgia CorporationFTSE WGBI (USD)5/27/20 217,200,000.000.00
The Salvation Army, A Georgia CorporationFTSE WGBI (USD)7/21/20 2113,150,000.000.00
Market Value & Initial Investment
Initial Investment (6/30/2010): $10,000,000
Market Value as of 9/30/2020: $31,549,385
Market Value as of 9/30/2021: $52,881,262
TheabovearetheviewsofBrandywineGlobalandarenotintendedasaforecastorguaranteeoffutureresults.BrandywineGlobal’sselectionprocessmayproveincorrect,whichmayhaveanegativeimpactonperformance. International securitiesmaybesubjecttomarket/currencyfluctuations,investmentrisks,andotherrisksinvolvingforeigneconomic,political,monetary,taxation,auditingand/orlegalfactors.Theremaybe additionalrisksassociatedwithinternational investments.Internationalinvestingmaynotbesuitableforeveryone.Fixedincomeinstrumentsaresubjecttocreditriskandinvestmentraterisk.Indicesareunmanagedandnotavailablefordirectinvestment.11190
Account Name Benchmark Name Effective DateContributionsWithdrawals
Global Fixed Income
Benchmark: FTSE WGBI (USD)
SUMMARY
PORTFOLIO CONTRIBUTION BENCHMARK CONTRIBUTION ATTRIBUTION - =
Firm Update
9/30/2020 - 9/30/2021
BOND MARKET¹
CURRENCY² RESIDUAL³
8.12 2.44 2.86 (2.18) (1.03) (0.51) (0.11)
4.79 (3.33)
TOTAL⁽¹⁺²⁺³⁾ 4.62 3.89 (0.40)
LARGEST RELATIVE CONTRIBUTORS AND DETRACTORS
+
PORTFOLIO CONTRIBUTION BENCHMARK CONTRIBUTION ATTRIBUTION - =BOND MARKET
United States Tsy-Sov 1.02 (1.15) 2.16
United States Corp 1.58 0.00 1.58
United Kingdom 0.00 (0.41) 0.41
South Africa 0.33 0.00 0.33
South Korea (0.30) 0.00 (0.30)
France 0.00 (0.23) 0.23
Mexico (0.26) (0.03) (0.23)
Germany 0.01 (0.14) 0.15
Canada 0.06 (0.07) 0.13
China 0.13 0.00 0.13
CURRENCY
Mexican Peso 1.42 0.08 0.88Japanese Yen (0.05) (0.93) 0.72
PORTFOLIO CONTRIBUTION BENCHMARK CONTRIBUTION ATTRIBUTION - = 1.34
British Pound Sterling 0.96 0.24 (0.62)
Polish Zloty (0.63) (0.01) (0.47)
Chilean Peso (0.47) 0.00 0.47
Norwegian Krone 0.48 0.01 0.41
Euro (0.17) (0.58) 0.39
Australian Dollar 0.44 0.05 0.24
• Brandywine Global Completed its acquisition of the business of Diamond Hill Capital Management's high yield focused U.S. Corporate credit mutual funds, which will continue under current portfolio managers John McClain, CFA, and Bill Zox, CFA
• Steve Smith stepped away from the day-to-day role of portfolio management, but continues to act as a Senior Advisor and remains on the Investment Strategy Committee
Strategy and Attribution Update
• Our bond and currency positioning have been additive to both the nominal and relative performance of the portfolio of the last year
• The bond performance was primarily driven by our underweight positioning to developed market duration and opportunistic holding of investment grade corporate debt
• Our underweight positioning of the U.S. Dollar, Euro, and Yen was driver of our currency positioing, with the Mexican Peso and UK Sterling being the big winners
Czech Koruna 0.24 0.00 0.24
South Korean Won 0.24 0.00
+ Sorted by absolute value of attribution; Contributors and Detractors do not sum to total excess
1 Bond Market factor includes Yield, Duration, Term Structure, Convexity, Sector and Quality positioning, Mortgage Pre-payments, Corporate Credit curve twists, Euro country positioning versus the German Yield Curve, and Selection
2 Currency factor includes spot and forwards (including carry), implied Hedge Cost, and Interaction
3 Residual factor includes transaction based returns versus a holdings based attribution model
* Performance return is reported gross of fees. Due to methodology differences, the returns calculated by the attribution system may differ from the official portfolio and benchmark returns displayed at the top of the page. This material is intended for the sole use of Brandywine Global clients and their investment consultants. Contents herein should be treated as confidential and proprietary information. This material may not be reproduced or used in any form or medium without express written permission. Data is obtained through Wilshire Axiom and is believed to be accurate. Past performance is no guarantee of future results. For reporting purposes we have grouped both offshore (CNH) and onshore (CNY) Chinese Yuan Renminbi into a single line item.
© 2020, Brandywine Global Investment Management, LLC. All rights reserved.
The Salvation Army
Attribution Report
Global Fixed Income
9/30/20219/30/2020
AllocationPortfolioIndexActivePortfolioChange Country
United States 66.33 38.81 27.52 61.68 4.65
Japan - 16.73 (16.73) - -
Mexico 10.17 0.59 9.57 11.79 (1.62)
France - 8.55 (8.55) 0.61 (0.61)
Italy - 7.73 (7.73) - -
Germany - 6.14 (6.14) 1.57 (1.57)
Spain - 5.02 (5.02) - -
United Kingdom - 4.92 (4.92) - -
Australia 6.26 1.51 4.75 6.49 (0.23)
Malaysia 3.79 0.41 3.38 4.70 (0.91)
New Zealand 3.09 - 3.09 - 3.09
Canada 4.68 1.62 3.06 5.51 (0.82)
Poland 2.95 0.46 2.49 1.80 1.15
South Africa 2.17 - 2.17 3.09 (0.92)
Belgium - 1.90 (1.90) - -
Netherlands - 1.57 (1.57) - -
Brazil 1.29 - 1.29 2.30 (1.01)
Austria - 1.23 (1.23) - -
Ireland - 0.69 (0.69) - -
Finland - 0.50 (0.50) - -
Denmark - 0.43 (0.43) - -
Israel - 0.38 (0.38) -Singapore - 0.36 (0.36) -Sweden - 0.25 (0.25) - -
Norway - 0.21 (0.21) - -
European Union - - - 1.09 (1.09)
Derivative P/L (0.72) - (0.72) (0.62) (0.10)
Total: 100.00 100.00 100.00 --
9/30/2021 9/30/2020
AllocationPortfolioIndexActivePortfolioChange Currency
Euro 1.89 33.32 (31.44) 0.25 1.63
US Dollar 56.51 38.81 17.70 33.40 23.11
Japanese Yen 4.97 16.73 (11.76) 11.78 (6.81)
Polish Zloty 9.53 0.46 9.07 0.19 9.34
Mexican Peso 6.46 0.59 5.87 12.02 (5.56)
Malaysian Ringgit 5.37 0.41 4.96 5.84 (0.47)
British Pound Sterling - 4.92 (4.92) 14.68 (14.68)
Chilean Peso 4.72 - 4.72 5.84 (1.12)
South Korean Won 2.97 - 2.97 7.51 (4.54)
Peruvian Nuevo Sol 1.97 - 1.97 - 1.97
Canadian Dollar - 1.62 (1.62) - -
Australian Dollar 3.13 1.51 1.62 2.22 0.91
Brazilian Real 1.29 - 1.29 2.30 (1.01)
Thai Baht 0.96 - 0.96 - 0.96
Danish Krone - 0.43 (0.43) - -
Israeli Shekel - 0.38 (0.38) - -
Singapore Dollar - 0.36 (0.36) - -
Swedish Krona - 0.25 (0.25) - -
Norwegian Krone - 0.21 (0.21) - -
New Zealand Dollar 0.13 - 0.13 - 0.13
South African Rand 0.11 - 0.11 0.13 (0.02)
Czech Koruna - - - 3.86 (3.86) 100.00 100.00 100.00
Total:
The Salvation Army, A Georgia Corporation
Country & Currency Allocation - 12 Month Look Back September 30, 2021
Global Fixed Income
Portfolio Characteristics
PrimaryPortfolio
Benchmark
Yield to Maturity (%) 1.450.60Yield to Worst (%) 1.898.68Modified Duration 1.908.85Effective Duration 4.669.78Average Maturity 100.19-Average Market Price 1.881.70Average Coupon (%) 1.84-Current Yield (%) 421,098# of Issues
1.450.60
20+ 10-20 7-10 5-7 3-5 1-3 0-1 % of Bonds
7.9 7.3 2.2 0.8 2.5 59.0 20.2
0 10203040506070
Sector Breakdown % Cumulative% Rating Combined
Market Value (%) (in Years) Contribution Duration
Government Sovereign 78.24 1.62
Government Owned - No Guarantee 1.37 0.15
Corporate Bond - Investment Grade 15.34 0.12 Government Regional Agencies 2.45 0.04 Mortgage Backed Securities 0.96 0.02 Cash 2.36 Derivatives (0.72) (0.07)
Total: 100.00 1.89
PRIMARY BENCHMARK is FTSE WGBI (USD)
AAA 63.2 63.2 AA 5.6 68.8 A 12.8 81.6 BBB 13.7 95.2 BB 4.8 100.0
Average Quality: AA
10+ 7-10 5-7 3-5 1-3 0-1
Coupon BB BBB A
Maturity 010203040506070
1.3 11.6 4.6 7.7 5.2 69.6 % of Bonds AAAAA
All Averages are US DOLLAR - weighted by the net market value. Average Market Price includes accrued interest. The "Blended Weighted Average Rating" is determined as follows: in line with the methodology used by Barclays Global indices, the middle rating from the three major NRSROs (S & P, Moody’s, and Fitch) will be assigned to each security. In the event that ratings are provided by only two agencies, the lowest rating will be assigned. If only one agency assigns a rating, that rating will be applied. If the security is not rated by one of the three major agencies, U.S. treasuries and certain U.S. agencies are given the U.S. issuer rating. Sovereign treasuries are given the sovereign issuer rating. All other unrated securities are given a rating equivalent to a defaulted bond. The equivalent numerical rating is assigned to each security based on the Security Level scale. A Portfolio Level scale is applied on the weighted average calculation to round for fractional numerical ratings and then converted to an alpha weighted average rating. Cash is included and received the highest rating.
The Salvation Army, A Georgia Corporation
Portfolio Characteristics September 30, 2021
Portfolio Credit Quality (Blended Weighted Average Rating)
Derivatives market value represents the unrealized profit/loss of all derivatives in the portfolio
Summary review of The SalvationArmy,AGeorgia Corp.
November 2021
Heathcoat House
20 Savile Row
London W1S 3PR
United Kingdom
Tel: + 44 207 292 6920
Suite 1403, Level 14 20 Hunter Place Sydney NSW 2000 Australia
Tel: +61 8599 2132
885 Third Avenue 24th Floor New York, NY 10022
United States of America Tel: (646) 472 1800
#40 02A Six Battery Road 6 Battery Road Singapore 049909
Singapore Tel: + 65 3158 3760
Unit 403 Index Tower DIFC Dubai
United Arab Emirates
Tel: +971 5 0463 5370
Colchester Global Investors Limited is authorized and regulated by the Financial Conduct Authority and registered with the Securities and Exchange Commission. Colchester Global Investors (Singapore) Pte. Ltd. Is authorized and regulated by the Monetary Authority of Singapore.

Firm Summary
Colchester Global Investors Limited is an independent investment management firm offering global and international bond and currency services. Colchester believes in the benefits of specialization and focus: a significant competitive advantage enjoyed by our firm is the greater diversity and added return potential generated by its unique use of high quality smaller country bond markets.
The Firm was founded by Ian Sims in 1999 and is built on the extensive experience of its senior partners who have all enjoyed long and successful careers in the industry. Colchester is majority owned by its employees: we believe self ownership allows constancy of purpose and an alignment of interest with those of the client. There have been no significant changes in ownership or capital structure since inception, and there are no changes anticipated.
Over the last twelve months ending September 30, 2021, Colchester has seen steady growth across the firm. We now have a staff of 82 employees across the London, New York, Singapore, Sydney and Dubai offices. The total firm assets under management was $40.9 billion at the end of the third quarter.

During the 2021 fiscal year, Colchester added a new member to the investment team. Vi Minh Tran joined Colchester as a Senior Investment Officer with over 22 years of experience in the industry. Most recently he was Senior Vice President and Portfolio Manager at Franklin Templeton, responsible for managing and leading global aggregate fixed income portfolios for major institutional clients globally.
Alex Fullarton and Joanna David were promoted to Investment Officers in April. Alex, formerly a Senior Investment Analyst and Joanna, formerly an Investment Analyst, will continue to support the team while also taking on more active oversight of portfolios in their new roles.
Lastly, Edward Sasinowski joins our Marketing and Client Services team in our New York office as Head of Distribution for North America. Ed will lead our marketing efforts, maintain key client and consultant relationships, and manage the marketing and client services team in North America. Prior to joining Colchester, Ed worked at PIMCO as Senior Vice President in the Institutional Client Management group and has 16 years of experience in the industry.
Colchester welcomed The Salvation Army, A GA Corp. as a client into its Global Bond Fund on February 1, 2009. The Salvation Army’s investment in the fund totaled $52.6 million as of September 30, 2021. The Global Bond Fund assets under management was $2.2 billion at the end of the quarter.
Investment Objective
The Salvation Army Market Value Initial Contribution 01 February 2009 $10,000,000 Additional Contributions 01 May 2009 01 July 2009 01 October 2009 01 October 2010 01 June 2011 31 May 2021 31 July 2021
$10,000,000 $ 7,500,000 $ 5,000,000 $20,000,000 $7,500,000 $8,000,000 $13,150,000 Market Value (Start of Fiscal Yr.) 01 October 2020 $32,557,201 Withdrawals 01 January 2016 30 September 2020 $28,000,000 $10,000,000 Ending Market Value (End of Fiscal Yr.) 30 September 2021 $52,593,315
Colchester aims to deliver an excess return of between 150 225 bps p a gross of investment management fees over a full economic cycle While Colchester has historically delivered returns at or above the upper band of this range, Colchester believes in setting an appropriate and realistic target and does not, and cannot, guarantee that these performance targets will be met Percentage Total Returns (Gross)
1.Since inception date of 1 February 2009. 2.To the end of September 2021.
4% 7%
2009 2010 2011 2012 2013 2014 2015 2016 2017 2018 2019 2020 2021 YTD Fiscal Year return Ann.
Since
The Salvation Army
-8% -5% -2% 1%
10%
Rtns
Inc.
FTSE-WGBI (Unhedged)
Percentage Total Returns
2009 1 2010 2011 2012 2013 2014 2015 2016 2017 2018 2019 2020 YTD 2021 2 Fiscal Year 2020 2021 Returns Ann. Rtns Since
1 3yrs Rtns 2 5 yrs Rtns 2 The Salvation Army (gross) 10.84 7.01 7.98 9.47 2.88 0.27 5.52 4.33 8.68 0.47 8.02 11.57 6.24 1.07 4.01 4.61 2.48 FTSE WGBI Index 7.21 5.17 6.35 1.65 4.00 0.48 3.57 1.60 7.49 0.84 5.90 10.11 5.93 3.33 2.30 3.73 1.35 Relative Performance 3.63 1.84 1.63 7.82 1.12 0.75 1.95 2.73 1.19 0.37 2.12 1.46 0.31 2.26 1.71 0.88 1.13
1, 2 2 Investment Performance: Since inception 1st February 2009 to 30th September 2021 Asset
1 158 134 100 110 120 130 140 150 160 Feb-09 Feb-10 Feb-11 Feb-12 Feb-13 Feb-14 Feb-15 Feb-16 Feb-17 Feb-18 Feb-19 Feb-20 Feb-21
(Gross)
Inc.
Growth (Gross)
Portfolio Index
Key
•
Top three bond contributors to relative returns were underweight positions in United States (+0.91%), Europe (+0.43%), and United Kingdom (+0.28%).
• Top three bond detractors from relative returns were the overweight positions in Mexico ( 0.39%), Colombia ( 0.21%), and Singapore ( 0.13%).
•
•
Top three currency contributors to relative returns were the overweight positions in the Mexican Peso (+0.50%), Norwegian Krone (+0.48%), and British Pound (+0.32%).
Top three currency detractors from relative returns were the overweight position in the Japanese Yen ( 0 25%), Indonesian Rupiah ( 0 07%), and Korean Won ( 0 07%)
1. FTSE World Government Bond Index (USD Unhedged), formerly the Citigroup World Government Bond Index (USD Unhedged) Bonds Currency Total GBF 1.45% 0.38% 1.07% FTSE 1 -2.17% -1.16% -3.33% Relative 0.72% 1.54% 2.26% Attribution October 1, 2020 September 30, 2021
Factors of Performance
Investment Process
Colchester is a value oriented global sovereign bond manager. At the heart of Colchester’s philosophy is the belief that investments should be valued in terms of the income they will generate in real terms This singular investment approach, which is the same for all strategies, is based on the analysis of inflation, real interest rates and real exchange rates, supplemented by an assessment of sovereign financial balances fiscal, external, monetary and Environmental, Social and Governance (ESG) factors Portfolios are constructed to benefit from those opportunities with the greatest relative investment potential for a given level of risk. Colchester eschews corporate credit, believing instead that its broader sovereign opportunity set provides attractive diversity and return potential Colchester’s use of sovereign only portfolios ensures that the diversifying integrity of bonds is not compromised.
Colchester’s investment process focuses on identifying “Investment Value” at each important level: country, currency, sector and duration/maturity. Investment Value is the synthesis of what we term “Real Value” and “Financial Stability” and its determination provides the basis on which Colchester takes investment decisions. “Real Value” is composed primarily of traditional real yield and real exchange rate measures, supplemented with an analysis of the term structure of interest rates. The determination of real yields and rates requires forecasts of future inflation, for which we employ robust, time proven quantitatively oriented methodologies. We complement this analysis with qualitative assessments backed up by country visits. “Financial Stability” has as its key determinants economic deficits and surpluses, monetary conditions and policy objectives We appraise these determinants through a combination of rigorous analytical methods and experienced judgment. Special geo political factors may be taken into account in unusual circumstances. This methodology provides an integrated framework within which all fixed income assets we invest in can be appraised on a consistent basis; relative investment value determines portfolio allocations.
Individual security selection is determined within the same framework as the overall allocation process. Colchester’s primary focus is on determining ‘value’ at the individual country, sector and security level. Notional single currency portfolios are constructed for each country using these ‘investment values’ or expected returns of each sector and bond in each market in the opportunity set. These are essentially optimised local market portfolios combining the highest expected return bonds available in each country The reason for doing this is so that “bottom up” opportunities such as attractive maturities, inflation linked securities or attractive foreign currency denominated sovereigns do not get overlooked as might be the case with a traditional “top down” approach
Investment

Colchester applies the same value driven framework to currency management as that used in its assessment of bond value To the extent that the mandate allows fully hedged, partially hedged or unhedged we seek to build the highest value currency portfolio on offer consistent with the mandate. Purchasing power parity has consistently been proven to hold in the medium term and becomes more powerful as an investment tool the more extreme the variation from fair value. Accordingly estimates of the real exchange rate provide the cornerstone of our currency valuation These estimates are adjusted for the influence of financial balance factors and real interest rate differentials to generate Colchester’s estimate of each currency’s value. These currency values are then input into the firm’s optimisation framework to determine final currency allocations We believe that higher returns are achievable over the medium term by being exposed to those currencies with the highest value (i.e. most undervalued) Final portfolio exposures reflect both this philosophy and client risk preferences Once the optimal currency portfolio for the mandate has been determined within this framework Colchester undertakes currency hedging to generate the desired exposures
The amount of risk allocated to country bond market selection is a direct function of the potential forecasted real return on offer All else being equal, a portfolio offering a higher potential real return both in absolute and relative terms to the benchmark will be afforded a greater proportion of the risk budget, while one offering a lower return will be afforded less Similarly, on the currency side (relative to the benchmark) a portfolio of currencies offering a greater valuation opportunity will be afforded greater risk compared to one offering lower potential The final allocation is a function of both the absolute return on offer and that potential return relative to historical norms.


As mentioned above, Colchester uses a team approach to investing and each member of the Investment Team contributes to the investment decision making process through our monthly Investment Management Committee (IMC) meetings At these meetings portfolios are reviewed and monitored and risk is tailored to individual client parameters and benchmarks. Portfolio decisions are implemented as soon as possible after IMC meetings or otherwise to a timescale directed by the IMC. Colchester does not seek to add value through execution and periodic reviews of execution are undertaken by Colchester’s Counterparty Risk Committee as well as its Compliance department to ensure best execution is being achieved Ian Sims, in his capacity as Chief Investment Officer, has the final say over any investment matter.
Process Colchester is a value-oriented global fixed income manager Bonds and currencies are valued according to their expected real return adjusted for the soundness of their underlying financial balance sheet Bond Real Value ⚫ Real Exchange Rate Analysis ⚫ Financial soundness ⚫ Differential in short term real interest rates ⚫ ESG considerations ⚫ Real Yield Analysis ⚫ Financial soundness ⚫ ESG considerations Currency Real Value
Investment Process: Portfolio Construction
The firm’s optimisation model is based on a standard mean variance framework with risk defined as the volatility of excess returns versus the index (i.e. tracking error). The mean variance optimisation techniques are applied to calculate optimal portfolios for a range of tracking errors The level of acceptable risk in building the optimal portfolio is constrained to 1% 5% of ex ante tracking error. We also break down tracking error at the portfolio level between the main alternative strategies: country, currency, sector and duration/maturity Risk is ultimately allocated between these alternative strategies as a direct function of the size of the opportunity available. Colchester’s experienced team oversees the process at each stage applying judgment where appropriate and ensuring that the final portfolio is consistent with the risk tolerance, constraints and objectives of the client. Specifically, Colchester seeks to add value primarily through both its country bond market and currency selection. Smaller, but not insignificant, potential alpha is added through maturity and sector decisions.
BOND CONSTRUCTION
1. Determine sector/maturity allocation for each country
2. Determine relative country weightings (mean-variance optimizer) 3. Determine currency allocations (also mean-variance optimizer)
4. Apply judgement; Choose desired levels of risk
Final PortfolioRisk is carefully managed at all stages of portfolio construction
CURRENCY CONSTRUCTION
BONDS: Real Yields
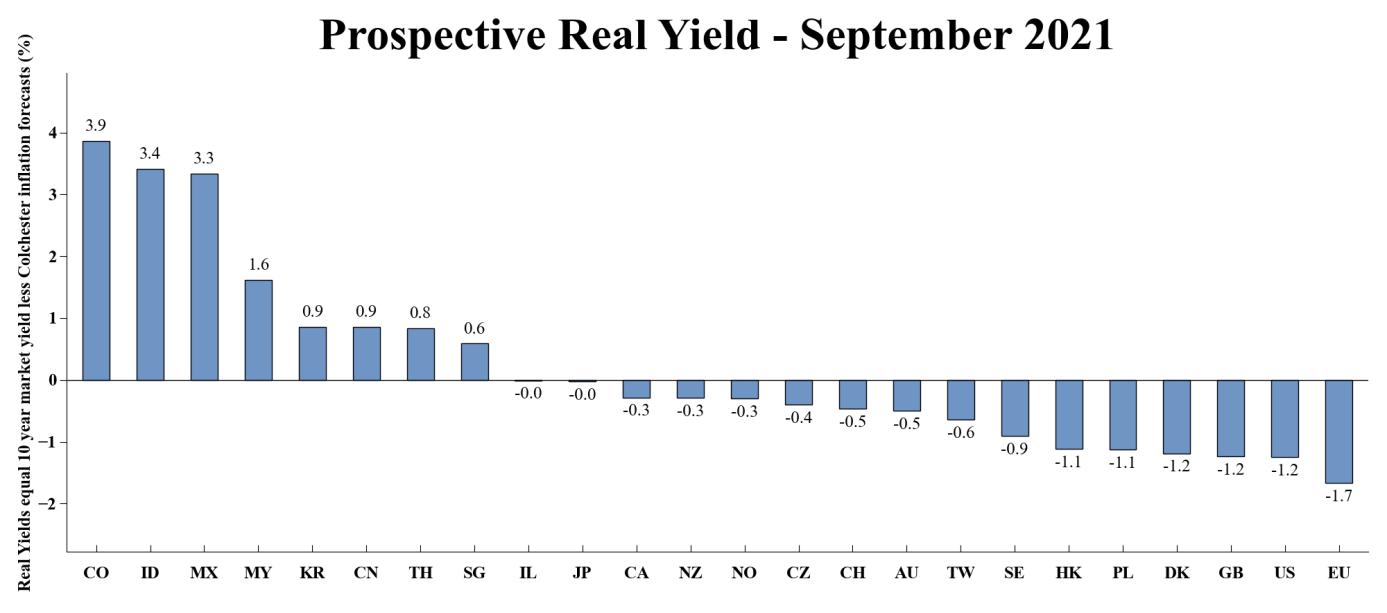
AU Australia CZ Czech Republic ID Indonesia MY Malaysia SG Singapore
CA Canada DK Denmark IL Israel NO Norway TH Thailand
CH Switzerland EU Eurozone JP Japan NZ New Zealand TW Taiwan
CN China GB United Kingdom KR South Korea PL Poland US United States
CO Colombia HK Hong Kong MX Mexico SE Sweden
Notes:
1. The prospective real yield for the 10 year sector is shown here for representational purposes. Colchester values up the 2, 5, 10 and 20 year sectors of the yield curve when valuing a country. The final portfolio reflects the value on offer in these individual yield curve points.
2. The expected real yield for Eurozone is calculated based on the 10 year German Bund yield and the Colchester forecast for inflation in the Eurozone.
3. Source: Colchester Global Investors, individual Central Bank CPI and PPI data, and Bloomberg.
CURRENCY: Real Exchange Estimates
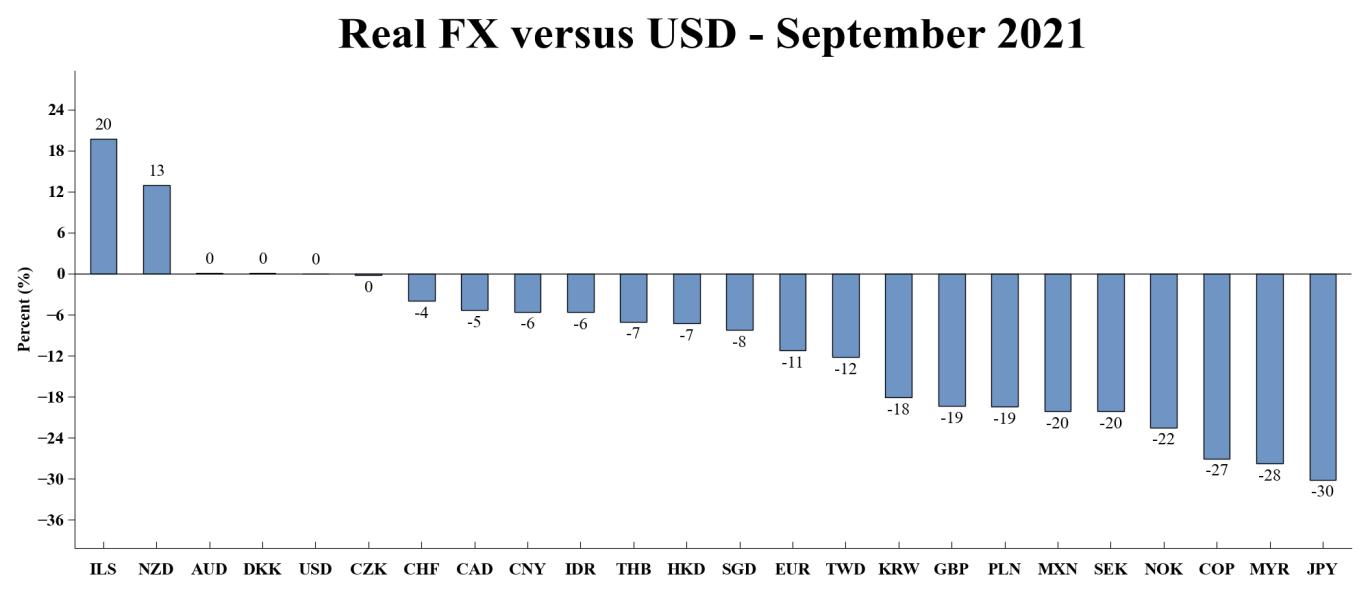
AUD
CAD
CHF Swiss Franc EUR Euro JPY Japanese Yen NZD New Zealand Dollar TWD Taiwan Dollar
CNY Chinese Yuan GBP British Pound KRW Korean Won PLN Polish Złoty USD United States Dollar
COP Colombian Peso HKD Hong Kong Dollar MXN Mexican Peso SEK Swedish Krona
Australian Dollar CZK Czech Koruna IDR Indonesian Rupiah MYR Malaysian Ringgit SGD Singapore Dollar Canadian Dollar DKK Danish Krone ILS Israeli New Shekel NOK Norwegian Krone THB Thai Baht Source: Colchester Global Investors, individual Central Bank CPI and PPI data, Bloomberg, and WMReutersThis page intentionally left blank
The Salvation Army Southern Territory Pinehurst Partners, L.P.
November 2021
0
Corbin Overview and Updates
Organizational Update
Investing since 1984
o Established private, owner operated, woman led firm with stable client base
Firm AUM: $9.2BN o Pinehurst AUM: $2.8BN
50 employees / 10 investment professionals

Ownership Update
Effective October 1, 2021, a newly formed LLC owned and controlled by Tracy Stuart and Craig Bergstrom became Corbin’s general partner
Tracy and Craig also collectively now own a majority interest in Corbin
Corbin’s management team can purchase most of the outstanding minority interests at an agreed price starting December 2023
DEI & ESG Initiatives


UN Principles for Responsible Investing (“PRI”) signatory

Engaging managers on ESG integration
Strengthening DEI remains top priority
Created Racial & Social Justice Task Force to encourage active and peaceful engagement with race and social related problems afflicting our society
AUM is estimated as of October 1, 2021 Staff information as of November 2021 “ESG” stands for Environmental, Social and Governance. “DEI” stands for “Diversity, Equity, and Inclusion.” Please see Corbin endnotes and risk disclosures for important information PAST PERFORMANCE IS NOT NECESSARILY INDICATIVE OF FUTURE RESULTS.
▪
▪
▪
▪
▪
▪
▪
▪
▪
▪
Characteristics 1Highlights (as of 9/30/2021): small funds at times include funds managed by managers with significant assets under management; number of core funds above refers to core managers only (those with allocations greater than 1%); Opportunistic investments include 15 2% in Corbin managed vehicles and investments implemented directly by Pinehurst; early stage investors (within 12 months of inception) exclude Corbin managed vehicles that Pinehurst invests in Figures as presented may include slight rounding error Please see Weighted Average Management Fee and Weighted Average Incentive fee disclosure for important information Please see Corbin endnotes for important information PAST PERFORMANCE AND TARGET RETURNS ARE NOT NECESSARILY INDICATIVE OF, NOR DO THEY GUARANTEE FUTURE RESULTS. Overview Flagship actively managed global multi strategy portfolio Target Net Return T Bills + 7% annualized (Over a full market cycle) Target Volatility 4% 6% Target Beta Generally, not to exceed 0.3 to equity and credit markets Highlights1 ▪ Targeted, specialized manager talent with concentration at the position level ▪ Traffic in strategies with potential for organic returns not leverage dependent ▪ Established and early stage managers o Early stage investors in 19 of 27 core external funds o 31.0% allocation to small funds ▪ Opportunistic investments represent 23.2% ▪ Weighted Average Management Fee: 1.36%; Weighted Average Incentive Fee: 15.03% Overview ▪ Distinct philosophical preferences ▪ Broad tool kit to capture compelling interim opportunities and drive portfolio tilts ▪ Alpha from selective manager roster: many seen, few chosen ▪ Preference for fundamentally driven strategies ▪ Structured to capitalize on market opportunities ▪ Early movers in partnering with managers on co investments and investing directly Asset Allocation Manager Selection Implementation
Pinehurst
Salvation Army Account Overview The performance figures set forth above for Pinehurst Institutional, Ltd are net of a 0 85% per annum management fee and a 5% per annum performance fee (subject to a 5% hurdle) The performance fee is charged on all net profits once the hurdle is reached Performance is presented net of expenses and includes the reinvestment of dividends, gains and other earnings Figures as presented may include slight rounding errors All figures above which take into account the current month’s performance information are estimated and monthly figures are not audited Please see Corbin endnotes and risk disclosures for important information PAST PERFORMANCE IS NOT NECESSARILY INDICATIVE OF FUTURE RESULTS. Estimated Performance Summary: as of September 30, 2021 Fund Profile Fund Name Pinehurst Institutional, Ltd. (Class C) Strategy Global Multi Strategy Investor Inception April 1, 2014 ($40,000,000) Additional Subscriptions ▪ July 1, 2014 ($20,000,000) ▪ January 1, 2016 ($2,000,000) ▪ April 1, 2017 ($10,000,000) Estimated NAV (9/30/2021) $113,343,480.90 Returns (%) Fiscal 2021 (10/20 9/21) Fiscal 2020 (10/19 9/20) Fiscal 2019 (10/18 9/19) Fiscal 2018 (10/17 9/18) Fiscal 2017 (10/16 9/17) Fiscal 2016 (10/15 9/16) Fiscal 2015 (10/14 9/15) The Salvation Army 19.80 8.28 2.28 4.70 9.45 2.17 0.77 HFRI FOF 14.24 5.73 (0.05) 3.05
HFRI HF
4.43
S&P 500
4.25 17.91
MSCI
BBGBarc Agg (0.90) 6.98 10.30
0.07
Annualized Since Inception (April 2014 – September 2021) Return (%) Volatility (%) Sharpe Ratio Beta to Pinehurst Inst. C Correlation to Pinehurst Inst. C The Salvation Army 6.52 6.32 0.91 -HFRI FOF 4.14 5.21 0.66 1.13 0.93 HFRI HF 5.44 6.38 0.74 0.89 0.90 S&P 500 13.96 13.90 0.96 0.33 0.73 MSCI EAFE 5.62 14.07 0.41 0.35 0.78 BBGBarc Agg 3.34 3.09 0.84
The
6.50 0.38 (0.05)
21.65
0.24 3.95 7.11 4.96 (1.68)
30.01 15.15
18.61 15.43 (0.61)
EAFE 26.29 0.93 (0.82) 3.25 19.65 7.06 (8.27)
(1.22)
5.19 2.94
(0.01) (0.00)
Strategic Asset Allocation and Differentiated Implementation Investment allocations and sector classifications are at the sole discretion of Corbin and subject to change at any time Core holdings are those with allocations of 1% or greater. Categorization by implementation type is solely at the discretion of Corbin and is subject to change. Core SMAs/Specialty Funds and Direct/Co Investments include investments made by the Fund in additional Corbin managed vehicles Direct/Co Investments may include investments made by the Fund within fund wrappers Generally exclusive to Corbin refers to the waiving of fees by these additional Corbin managed vehicles, as well as funds of one or SMAs with third party managers set up exclusively for Pinehurst. Please see Corbin endnotes and risk disclosures for important information. Quarterly asset allocation meeting results in forward looking strategy preferences and continual assessment of sub-sector opportunities → Global Macro → Relative Value → Asset Backed Securities → Equity Special Situations → Event-Driven/ Distressed Credit → Equity Long/Short 0% 25% 50% 75% 100% Jan-02 Sep-03 May-05 Dec-06 Aug-08 Apr-10 Nov-11 Jul-13 Mar-15 Oct-16 Jun-18 Feb-20 Sep-21 Leverage broad toolkit in an effort to maximize risk-adjusted returns "RegularWay" Hedge Funds, 61.85% Direct/ Co Inv, 7.47% SMAs/ Specialty Funds, 30.68% ▪ Includes thematic investments and single assets with higher turnover of ideas ▪ Generally exclusive to Corbin ▪ Concentrated group of high conviction managers ▪ 18 core “Regular Way” hedge fund investments Differentiated Implementation to Extract Value Historical Allocation Since Pinehurst Inception (Jan 2002 – Sep 2021)
HFRI FoF S&P 500 0% 2% 4% 6% 8% 10% 0% 2% 4% 6% 8% 10% 12% 14% 16% 18% 20% Pinehurst (Net) HFRI HF BBG BarCap Agg MSCI EAFE
from Corbin’s Differentiated Approach Pinehurst performance is presented net of a 1% per annum management fee and a 5% performance fee (subject to a 5% hurdle). The performance fee is charged
net profits
hurdle
reached. Pinehurst’s performance vis a vis the other indices shown here will differ
time
The performance
index
representation
any particular investment, as you cannot invest directly
index. PAST PERFORMANCE
NOT NECESSARILY INDICATIVE OF FUTURE RESULTS. Annualized Return Contribution Since Inception 6.17% 1.55% 1.03% (0.10%) (1.00%) (0.44%) 3.94% 5.88% 9.07% 6.76% 4.38% (2.5%) (0.5%) 1.5% 3.5% 5.5% 7.5% 9.5% Pinehurst HFRI-FOF HFRI-HF S&P 500 Total MSCI EAFE BBGBarCap Agg → Opportunistic/ Co-Investment → Small Funds → Core Funds and Other Annualized Return Contribution Since Inception Return Volatility
Results
on all
once the
is
over other
periods.
of an
is not an exact
of
in an
IS
Pinehurst Historically Not Impacted By Inflation
▪
US annual inflation rate has reached highest level in over a decade ▪
Progress in vaccination efforts has led to a strong and quick economic recovery ▪
The Fed has characterized the inflation spike as "transitory" but has revised its policy guidance:
o Asset purchase tapering to begin by year end
o Interest rates hikes to start as early as late 2023 ▪
Inflation Rate
$6
$5
$4
$3
$2
$1
$-
$(1)
$(2)
Historically, Pinehurst has exhibited zero correlation to investment grade bonds and has not been particularly exposed to volatile long-term inflation, on the upside or downside $(3)
YoY Growth in Headline CPI YoY Growth in Core CPI Pinehurst Growth of $1 (Net)
Source: Bureau of Labor Statistics We believe we can generate solid long-term returns regardless of moves in inflation and long rates
of $1
Opinions expressed are current as of the date the material was prepared and are subject to change depending on market conditions. Pinehurst performance is presented net of a 1% per annum management fee and a 5% performance fee (subject to a 5% hurdle). The performance fee is charged on all net profits once the hurdle is reached. Please see Corbin endnotes and risk disclosures for important information. PAST PERFORMANCE IS NOT NECESSARILY INDICATIVE OF FUTURE RESULTS.
-3% -2% -1% 0% 1% 2% 3% 4% 5% 6% Growth
Pinehurst Historical Net Performance (0.85% & 5% Share Class)
Returns (%) Jan Feb Mar Apr May Jun Jul Aug Sep Oct Nov Dec YE/YTD
2021 (0.91) 3.09 0.01 2.63 1.54 0.42 0.23 0.62 1.97 est. 9.95 est.
2020 0.59 (1.34) (10.05) 3.92 4.58 2.48 2.43 2.42 0.36 (0.28) 4.69 4.63 14.34
2019 2.87 1.29 0.22 1.51 (0.64) 2.08 0.44 (1.86) (0.34) 0.74 0.87 1.83 9.28
2018 1.77 (0.46) 0.18 1.00 0.65 0.34 1.01 (0.19) 0.36 (0.73) (0.82) (1.35) 1.73
2017 1.56 0.77 0.66 0.98 0.28 0.36 1.34 1.13 0.56 (0.16) (0.48) 0.79 8.05
2016 (4.01) (2.21) 1.50 1.38 1.44 (0.31) 2.19 1.32 0.48 0.59 0.26 0.77 3.27
2015 (0.52) 2.27 (0.02) 0.68 1.51 (1.02) 0.82 (1.32) (2.40) 0.82 0.27 (0.31) 0.67
2014 0.27 2.59 (0.12) (0.01) 1.68 0.55 (0.30) 0.70 0.00 (0.12) 1.28 (0.05) 6.64
2013 2.05 0.77 0.98 0.59 1.27 (1.18) 1.27 (0.43) 1.73 1.37 0.75 0.97 10.58
2012 1.51 1.33 0.74 0.42 (0.29) (0.15) 0.83 0.85 1.13 0.28 0.62 1.58 9.21
2011 0.14 0.74 0.26 1.18 0.36 (0.31) 0.40 (1.12) (1.48) 1.05 0.18 (0.07) 1.31
2010 1.11 0.36 1.37 1.40 (1.02) 0.10 (0.26) 0.93 1.23 1.03 0.64 1.23 8.41
2009 2.39 1.21 (0.10) 1.30 3.85 1.59 1.80 1.51 2.63 0.86 1.18 1.66 21.75
2008 (1.93) 1.42 (2.35) 0.70 1.40 (1.06) (2.47) (1.10) (7.47) (6.26) (2.66) (1.46) (21.26)
2007 1.57 0.72 1.82 1.51 2.59 0.79 0.81 (1.92) 1.95 3.17 (0.34) 0.55 13.93
2006 3.03 0.18 1.60 1.59 (1.66) (0.52) 0.07 0.54 0.43 1.75 2.47 1.55 11.52
2005 0.64 1.89 (0.09) (1.27) 1.29 1.92 2.54 1.25 2.59 (1.63) 2.31 2.55 14.78
2004 2.33 1.91 0.62 (0.18) (0.82) 0.42 (0.71) (0.08) 1.30 0.74 2.60 1.74 10.25
2003 (0.01) 0.49 0.77 2.75 1.15 1.16 0.14 0.98 1.29 2.64 1.02 1.51 14.74
2002 0.60 0.40 (0.03) 0.94 1.26 (2.16) (1.31) 0.83 0.69 0.39 1.15 1.04 3.79
The performance figures set forth above for Pinehurst Partners, L.P. are net of a 0.85% per annum management fee and a 5% per annum performance fee (subject to a 5% hurdle). The performance fee is charged on all net profits once the hurdle is reached. Performance is presented net of expenses and includes the reinvestment of dividends, gains and other earnings. Figures as presented may include slight rounding errors. All figures above which take into account the current month’s performance information are estimated and monthly figures are not audited. Please see Corbin endnotes and risk disclosures for important information. PAST PERFORMANCE IS NOT NECESSARILY INDICATIVE OF FUTURE RESULTS.
Corbin Endnotes and Risk Disclosures
1. PAST PERFORMANCE IS NOT NECESSARILY INDICATIVE OF FUTURE RESULTS
2. All Sharpe Ratios are calculated using the 3 month U S Treasury Bill for the risk free rate
3. Indices referenced herein are passive, and do not reflect any fees or expenses unless otherwise stated While the performance of the Corbin funds discussed herein have been compared here with the performance of well known and widely recognized indices, the various indices may not represent an appropriate benchmark for the Corbin funds The holdings of the Corbin funds discussed herein may differ significantly from the securities that comprise the various indices Also, the performance and volatility of the indices may be materially different from that of the Corbin funds Investors cannot invest directly in an index (although one can invest in an index fund designed to closely track such index) The S&P 500 Index consists of 500 stocks chosen for market size, liquidity and industry group representation It is a market value weighted index (stock price times number of shares outstanding), with each stock's weight in the Index proportionate to its market value This Index does not reflect any fees or expenses The MSCI EAFE Index has been designed by Morgan Stanley Capital International Inc (‘‘MSCI’’) as an equity benchmark for international stock performance The Index includes stocks from Europe, Australia and the Far East This Index does not reflect any fees or expenses The Barclays US Aggregate Bond Index (“BBG BarCap Agg”) represents securities that are US domestic, taxable and dollar denominated The index covers the US investment grade fixed rate bond market, with index components for government and corporate securities, mortgage pass through securities and asset backed securities These major sectors are subdivided into more specific indices that are calculated and reported on a regular basis This Index does not reflect any fees or expenses The HFRI Monthly Indices (“HFRI”) are provided by Hedge Fund Research, Inc (“HFR”) HFRI Indices are equally weighted performance indexes, utilized by numerous hedge fund managers as a benchmark for their own hedge funds Due to mutual agreements with the hedge fund managers listed in the HFR Database, HFR is not at liberty to disclose the particular funds behind any index to non database subscribers HFRI Indices are updated by HFR at various points during each month HFRI data included in this letter may not be the most current data issued by HFR Additionally, HFR reserves the right to modify previously issued data Please visit https://www hedgefundresearch com/hfr hedge fund strategy classification system for more information regarding HFRI Indices contained herein
4. Pinehurst Partners, L P (the “Fund”) launched on January 1 2002 with a 1 5% management fee and a 5% performance fee (subject to a 5% hurdle) The performance figures shown herein are net of a 1% per annum management fee and a 5% per annum performance fee (subject to a 5% hurdle) The performance fee is charged on all net profits once the hurdle is reached This lower fee structure has been available since June 1 2005 The actual net returns of the Fund from inception until the first investor invested in the 1% fee class were based on the higher management fees then in place and thus were lower than the figures shown throughout Performance figures presented net of these higher management fees are shown below Performance is presented net of expenses and includes new issue income, the reinvestment of dividends, gains and other earnings Figures as presented may include slight rounding errors All figures above which take into account the current month’s performance information are estimated and monthly figures are not audited Each investor's rate of return may vary from this performance due to the timing of capital transactions as well as their new issues status PAST PERFORMANCE IS NOT NECESSARILY INDICATIVE OF FUTURE RESULTS
Returns
2005 0.58 1.84 0.15 1.32 1.23 2.17
2004 2.27 1.86 0.58 0.26 0.87 0.37 0.76 0.14 1.25 0.72 2.56 1.70 9.60
2003 0.07 0.44 0.72 2.69 1.36 1.16 0.09 0.63 1.24 2.60 0.98 1.47 14.11
2002 0.54 0.36 0.08 0.88 1.20 2.21 1.36 0.77 0.64 0.33 1.09 0.99 3.12
5. Corbin manages funds not disclosed in this presentation
6. Over the life of the Fund, the Fund’s performance will vary greatly in comparison to the indices herein The Fund may be down when one or more of the indices are down, the Fund may be up less than one or more of the indices A chart evidencing this variation is available over the life of the Fund upon request
7. Similar performance for all core managers’ is shown in the accompanying performance report and performance for all positions owned by the Fund during the previous 12 months is available upon request
8. This presentation is for informational purposes only and does not constitute investment advice This presentation does not constitute an offer to sell, or a solicitation of an offer to buy, any interest in any investment vehicle, and should not be relied on as such Nor does this presentation disclose the risks or terms of an investment in any investment vehicle managed by Corbin Capital Partners, L P or any of its affiliates Solicitations can be made only with a Confidential Memorandum and only to qualified persons Targets, ranges and expectations set forth in this presentation are approximations; actual results may differ
9. With respect to the investment vehicles advised by Corbin Capital Partners, L P and the funds in which they invest (“underlying funds”): Funds are speculative and involve a high degree of risk; the funds may be leveraged; the funds’ performance can be volatile; an investor could lose all or a substantial amount of his or her investment; the fund managers have total trading authority over the funds; the use of a single advisor applying generally similar trading programs could mean lack of diversification and, consequently, higher risk; there is no secondary market for an investor’s interest in the funds and none is expected to develop; there may be restrictions on transferring interests in the funds; the funds’ high fees and expenses may offset the funds’ trading profits The underlying funds trade a myriad of instruments Changes in exchange rates may cause the value of an investment to increase or decrease Some investments may be restricted or illiquid, there may be no readily available market and there may be difficulty in obtaining reliable information about their value and the extent of the risks to which such investments are exposed Certain investments, including warrants and similar securities, often involve a high degree of gearing or leverage so that a relatively small movement in price of the underlying security or benchmark may result in a disproportionately large movement, unfavorable as well as favorable, in the price of the warrant or similar security In addition, certain investments, including futures, swaps, forwards, certain options and derivatives, whether on or off exchange, may involve contingent liability resulting in a need for the investor to pay more than the amount originally invested and may possibly result in further loss exceeding the amount invested Transactions in over the counter derivatives involve additional risks as there is no market on which to close out an open position; it may be impossible to liquidate an existing position, to assess the value of a position or to assess the exposure to risk Investors should carefully consider whether such investments are suitable for them in light of their experience, circumstances and financial resources
10. This communication contains proprietary information for purposes of Section 101(k) of the United States Employee Retirement Income Security Act of 1974, as amended No information or communication provided herein or otherwise is intended to be, or should be construed as, a recommendation within the meaning of the U S Department of Labor’s final regulation defining “investment advice ” Further, it is not intended for any such information or communication to be, and should not be construed as, providing impartial investment advice There is no guarantee that the investment objectives of any investment vehicle managed by Corbin Capital Partners, L P will be met Past performance is not necessarily indicative of future results, and the value of investments and the income they might generate can fluctuate
11. Corbin's ESG integration process involves an attempt to influence and monitor the ESG practices of managers we work with Corbin’s engagement approach may vary based on the specific engagement plan for each manager and may include in person meetings with management and investment personnel, conference calls and questionnaires Corbin seeks to incorporate ESG analysis into its manager evaluation process to ensure that all portfolios benefit from a detailed review of significant non financial factors and risks that have the potential to impact long term manager and investment performance The objective is that this analysis will help inform Corbin and have a positive impact on its manager selection and engagement activities Looking ahead, we will continue to engage with managers to encourage ongoing improvements in their sustainability and social impact analysis and we will continue to encourage managers to improve the quality and scope of their ESG programs ESG integration across managers will vary and Corbin will rely heavily on information provided by such managers to assess any progress, which information may not be verifiable Signatories to the PRI pay an annual fee They are required to report annually on their responsible investment activities and they receive ratings based on their reported data Corbin signed on as a signatory in April 2021 and has not yet received ratings Full details of PRI reporting and assessment methodology are available at www unpri org/signatories/signatory accountability/about pri reporting Principles for Responsible Investment (PRI) is the world’s leading advocate for responsible investment The PRI encourages adopting environmental, social and governance (ESG) factors into investment and ownership decisions, and creating a sustainable financial system The PRI is an independent organisation, funded and managed by its signatories, and backed by the United Nations Environment Programme Finance Initiative and United Nations Global Compact For further information please visit: https://www unpri org/
(%) Jan Feb Mar Apr May Jun Jul Aug Sep Oct Nov Dec YE/YTD
This page intentionally left blank
Key takeaways
Competitive performance AGG has outperformed 43% of the funds in the Intermediate Core Bond Morningstar category, which includes 331 funds, over the last 5 years, based on total return.2
Low cost AGG is over 94% less expensive than the average funds in its Morningstar category (0.04% vs. 0.60%).3
Tax efficient AGG did not distribute capital gains in 2020 or in any of the past 5 years.4
Use as ballast in a portfolio


Investment grade bonds have outperformed when there is a flight to quality, especially during periods of equity market volatility. The five largest declines in the S&P 500 Index since the global financial crisis all saw AGG post better returns.5
1 BlackRock as of 9/30/21. Past performance does not guarantee future results. 2 Morningstar, as of 9/30/21. Comparison universe includes ETFs and mutual funds and uses total return which represents changes to the NAV and accounts for distributions from the funds (excluding any applicable sales charges). AGG outperformed 30% and 40% of peers on a 1 and 10 year basis which included 409 and 247 funds, respectively. Performance may be different for other time periods. Past performance does not guarantee future results. 3 Morningstar. AGG fee as of most current prospectus. Measured against the Morningstar Intermediate Core Bond category, inclusive of mutual funds and ETFs, as of 9/30/21 4 BlackRock , Morningstar, as of 12/31/20. See www.iShares.com/tax for a complete list of funds that distributed capital gains in 2020. Past distributions not indicative of future distributions. 5 Morningstar, as of 9/30/20. ETF performance uses NAV returns. Financial Crisis measured 10/10/07 3/9/09, US Credit Rating Downgrade measured 7/25/11 10/3/11, Energy and EM Downturn measured 7/21/15 2/11/16, Fed Policy Reaction measured 1/29/18 2/8/18, Coronavirus Selloff measured 2/19/20 3/23/20.
DIVERSIFY EQUITY RISK WITH AGG As stock market volatility increases, portfolio diversification with core fixed income may be more important than ever. iShares.com/AGG AGG AGG historically had better returns during stock market selloffs. Financial Crisis (2007 2009) US Credit Rating Downgrade (2011) Energy and EM Downturn (2015 2016) Fed Policy Reaction (2018) Coronavirus Selloff (Q1 2020) iShares Core U.S. Aggregate Bond ETF S&P 500 Index iShares Core U.S. Aggregate Bond ETF1 Expense Ratio: 0.04% 30 Day SEC Yield: 1.35% Effective Duration: 6.56 years Performance data represents past performance and does not guarantee future results. Investment return and principal value will fluctuate with market conditions and may be lower or higher when you sell your shares. Current performance may differ from the performance shown. For most recent month end performance see www.iShares.com. For standardized performance, see the next page. Index returns are for illustrative purposes only. Indexes are unmanaged and one cannot invest directly in an index. 55.3% 17.9% -13.0% 19.2% 33.8% 7.6% 3.4% 2.9% 1.3% 1.1% iCRMH1121U/S-1903056-1/2
How do investment grade core bonds diversify against equity risk?
With over 7,000 bonds covering five broad fixed income sectors, AGG allows investors comprehensive access to the U.S. investment grade bond market. Nearly 70% of the fund is allocated to high quality, government backed securities including U.S. Treasuries and agency mortgage backed securities (MBS). The remaining 30% is spread among corporate bonds, non corporate credit, and municipal securities, offering access to potentially higher yielding bonds.
Credit quality breakdown
Treasuries, 38.2%
Securitized, 29.4%
Sector breakdown
Corporates, 26.9%
Government Related, 4.5%
Cash Securities, 1.0%
Rating and sector breakdown sourced from BlackRock Solutions, as of 9/30/21. Subject to change. Credit quality ratings on underlying securities of the fund are received from S&P, Moody’s and Fitch and converted to the equivalent S&P major rating category. This breakdown is provided by BlackRock and takes the median rating of the three agencies when all three agencies rate a security, the lower of the two ratings if only two agencies rate a security, and one rating if that is all that is provided. Unrated securities do not necessarily indicate low quality. Below investment grade is represented by a rating of BB and below. Ratings and portfolio credit quality may change over time. Fees as of current prospectus. All other data as of 9/30/21.
Performance data represents past performance and does not guarantee future results. Investment return and principal value will fluctuate with market conditions and may be lower or higher when you sell your shares. Current performance may differ from the performance shown. For most recent month end performance see www.iShares.com.
Shares of ETFs are bought and sold at market price (not NAV) and are not individually redeemed from the fund. Any applicable brokerage commissions will reduce returns. Beginning August 10, 2020, market price returns for BlackRock and iShares ETFs are calculated using the closing price and account for distributions from the fund. Prior to August 10, 2020, market price returns for BlackRock and iShares ETFs were calculated using the midpoint price and accounted for distributions from the fund. The midpoint is the average of the bid/ask prices at 4:00 PM ET (when NAV is normally determined for most ETFs). The returns shown do not represent the returns you would receive if you traded shares at other times. Performance shown reflects fee waivers and/or expense reimbursements by the investment advisor to the fund for some or all of the periods shown. Performance would have been lower without such waivers.
Carefully consider the Funds’ investment objectives, risk factors, and charges and expenses before investing. This and other information can be found in the Funds’ prospectuses and, if available, summary prospectuses, which may be obtained by visiting www.iShares.com or www.BlackRock.com. Read the prospectus carefully before investing.
Investing involves risk, including possible loss of principal.
Fixed income risks include interest rate and credit risk. Typically, when interest rates rise, there is a corresponding decline in bond values. Credit risk refers to the possibility that the bond issuer will not be able to make principal and interest payments. Diversification may not protect against market risk or loss of principal. Transactions in shares of ETFs will result in brokerage commissions and will generate tax consequences. All regulated investment companies are obliged to distribute portfolio gains to shareholders. This information should not be relied upon as research, investment advice, or a recommendation regarding any products, strategies, or any security in particular. This material is strictly for illustrative, educational, or informational purposes and is subject to change.
Prepared by BlackRock Investments, LLC.
This information should not be relied upon as research, investment advice, or a recommendation regarding any products, strategies, or any security in particular. This material is strictly for illustrative, educational, or informational purposes and is subject to change.
©2021 BlackRock, Inc. All rights reserved. iSHARES and BLACKROCK are trademarks of BlackRock, Inc., or its subsidiaries in the United States and elsewhere. All other marks are the property of their respective owners. GELM 398806 OCT21 Q US

Fund Name Fund Inception Date Gross Expense Ratio (%) 30 Day SEC Yield (%)
Contractual Fee Waiver Expiration
1 Year Returns (%) 5 Year Returns (%) 10 Year Returns (%) Since Inception (%) NAV Mkt Price NAV Mkt Price NAV Mkt Price NAV Mkt Price iShares Core U.S. Aggregate Bond ETF
0.04% 1.31% / 1.30% June 30,
0.93% 0.96% 2.90% 2.86% 2.95% 2.92% 3.97% 3.96% 70.0% 2.7% 11.3% 14.8% 1.1% AAA AA A BBB Cash/Other iCRMH1121U/S-1903056-2/2
(With/ Without Waiver)
(If Applicable)
9/22/2003
2026


The Salvation Army, A Georgia Corporation November 2021 www.loomissayles.com | One Financial Center Boston, MA 02111 617 482 2450 | BOSTON CHICAGO DETROIT SAN FRANCISCO LONDON SINGAPORE UTRECHT For Client Use Only. Not For Further Distribution
loomis sayles update
• In November, Loomis Sayles welcomed an eight person Euro Credit Team based in the new Netherlands office. The team includes co heads and portfolio managers Rik den Hartogand Pim van Mourik Broekman, portfolio managers Luke Cummins, SipkeMoes, Quirijn Landman, Marco Zanotto and Ronald Schep, and product manager Jeroen Potma. All eight members of the team were previously at Kempen Capital Management
• Marques Benton joined Loomis Sayles in December as chief diversity, equity and inclusion officer
• Elise Carner joined Loomis Sayles in January as an investment director for the Relative Return Team, focusing on core plus
• John Gallagher, executive vice president and director of institutional services, retired in March
• Paul Sherba, executive vice president and chief financial officer, retired in March. He will be succeeded by Susan Sieker, executive vice president and the chief financial officer
• Jae Park, executive vice president and chief investment officer, retired in March
• David Waldman was promoted to chief investment officer in March. He was previously the deputy chief investment officer
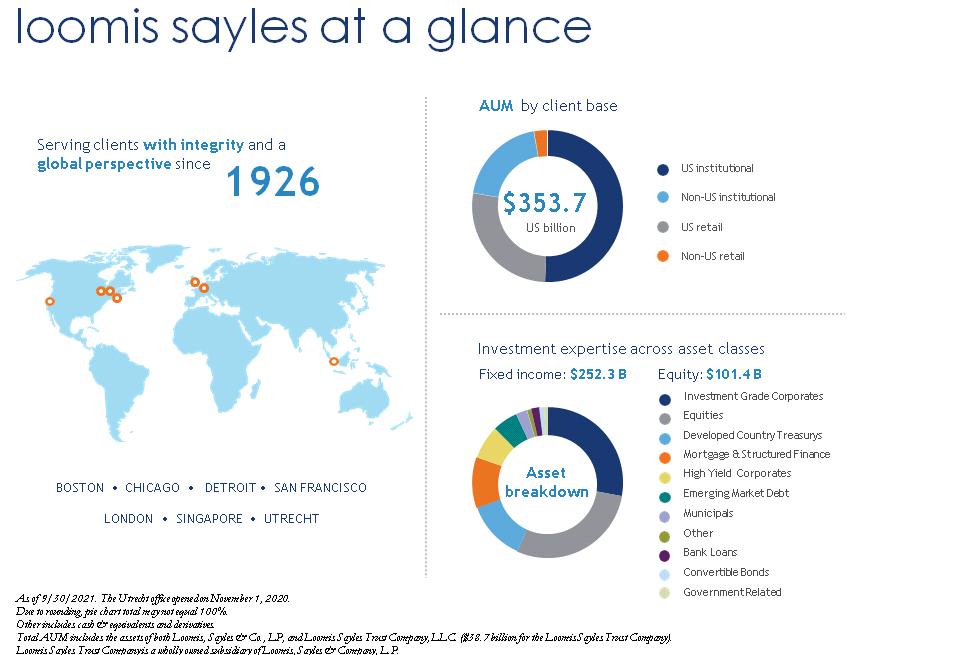
• Kyra Fecteau, a portfolio manager and investment strategist on the mortgage and structured finance team, departed Loomis Sayles in May to pursue another opportunity
• Jennifer Thomas was promoted to co portfolio manager on the mortgage and structured finance team for the investment grade securitized credit and high yield securitized credit strategies in May
• Stephen LaPlante was promoted to co portfolio manager on the mortgage and structured finance team for the investment grade securitized credit and high yield securitized credit strategies in May
• Kathleen Bochman, director of environmental, social and governance (ESG), departed Loomis Sayles in September to pursue another opportunity
The
A Georgia Corporation 791
Salvation Army,
employees as of September 30, 2021
TEAM BIOGRAPHIES
Richard G. Raczkowski
Rick Raczkowski is a vice president of Loomis, Sayles & Company, portfolio manager for the Loomis Sayles fixed income group and co head of the relative return team. He co manages the Loomis Sayles Core Plus Bond strategy, which includes the Loomis Sayles Core Plus Fixed Income Fund and Corporate Bond strategy. Rick has 32 years of investment industry experience and joined Loomis Sayles in 2001. Prior to Loomis Sayles, he served as vice president for Back Bay Advisors and was a senior consultant at both Hagler Bailly Consulting and EDS Management Consulting/A.T. Kearney. Rick also worked as an economist and industry analyst for DRI McGraw Hill. Rick earned a BA from the University of Massachusetts and an MBA from Northeastern University.

Peter W. Palfrey, CFA
Peter Palfrey is a vice president of Loomis, Sayles & Company and portfolio manager for the Loomis Sayles fixed income group. With 38 years of investment industry experience, Peter co manages the Loomis Sayles Core Plus strategy, which includes the Loomis Sayles Core Plus Bond Fund. Prior to joining Loomis Sayles in 2001, he worked for Back Bay Advisors as senior vice president and portfolio manager, and for MONY Capital Management as investment vice president and portfolio manager. Peter earned a BA from Colgate University.
A Georgia Corporation Core Plus Fixed Income
The Salvation Army,
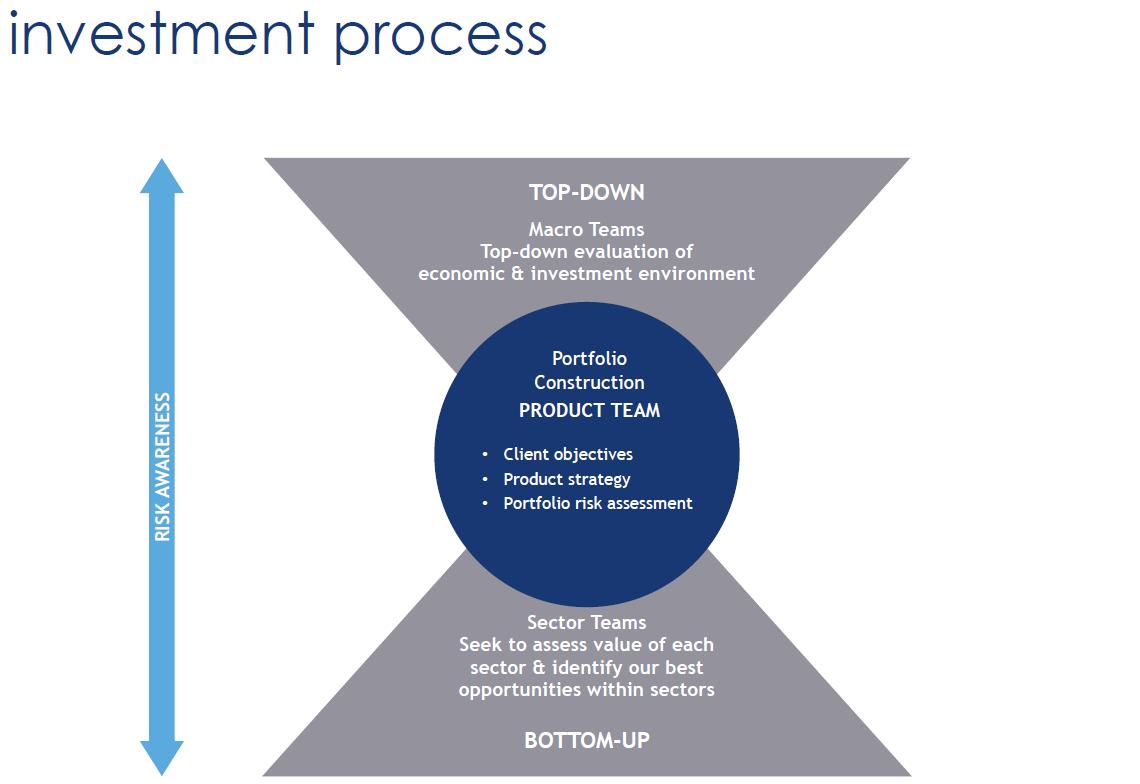
 The Salvation Army, A Georgia Corporation
 The Salvation Army, A Georgia Corporation


The
Corporation RETURNS (%) AS OF 9/30/2021
Salvation Army, A Georgia
0.88 1.00 9.16 9.00 6.31 3.57 1.55 0.90 6.98 10.30 5.36 2.88 Portfolio (Net) Benchmark YTD FY 2021 FY 2020 FY 2019 Three Year 1/29/15 - 9/30/21 Annualized Portfolio (Net) -0.88 1.00 9.16 9.00 6.31 3.57 Benchmark -1.55 -0.90 6.98 10.30 5.36 2.88 Excess Return 0.67 1.89 2.18 -1.30 0.96 0.69
portfolio summary
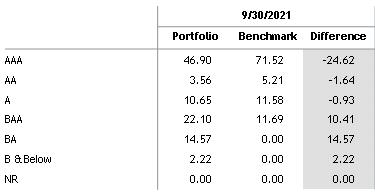
CHARACTERISTICS AS OF 9/30/2021
Initial Investment 01/29/2015 $45,000,000 Market Value 10/01/2020 $87,090,258
Capital Additions FY 2021 $40,029,203 Market Value 09/30/2021 $128,400,401
QUALITY DISTRIBUTION
(%) AS OF 9/30/2021
OAS is option adjusted spread.

Client Guideline Quality Methodology presented.
Maturity distribution is calculated using the years to effective maturity, which takes into account the bonds call date.
The current benchmark is Bloomberg U.S. Aggregate. Index. Information on this page reflects fund data.
The Salvation Army, A Georgia Corporation
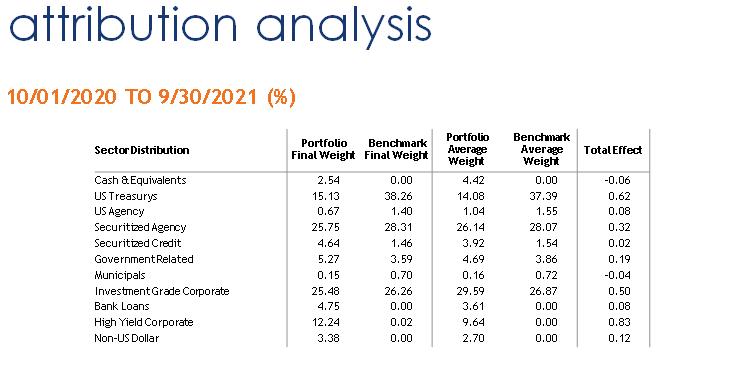
 The Salvation Army, A Georgia Corporation
core plus strategy
october 2020 september 2021
• Our nominal duration was shorter than the benchmark during the fiscal year, which hampered performance Overall, allocation and security selection effects were the primary sources of outperformance
• USD corporate positions bolstered returns Industrials were the leading source of excess returns, followed by financials and utilities.
• Overall, securitized assets provided strong returns during the fiscal year The allocation to Agency Pass Thrus and CMBS in particular aided outperformance Agency CMO issues weakened returns during the period
• Our significant underweight allocation to US Treasurys was beneficial to returns as higher yielding assets outperformed during the period.
• We maintained a small allocation to bank loans, which was additive towards relative performance
 The Salvation Army, A Georgia
Corporation
This report is a service provided to customers of Loomis Sayles for informational purposes and is not a recommendation to purchase or sell securities. Unless otherwise noted, the performance shown is gross of management fees. Past performance is not a guarantee of future results. Loomis Sayles believes the information contained in this report is reliable but we do not guarantee its accuracy. Additional information on portfolio holdings, portfolio attribution and portfolio transactions are available to all investors upon request.

The Salvation Army, A Georgia
Corporation
The Salvation Army Southern Territory
November 2021
Magnitude Capital, LLC www.magnitudecapital.com
Prepared by Magnitude; presented by the Army’s Office of Investments.

MAGNITUDE OVERVIEW
Senior practitioners focused on achieving differentiated investment outcomes
Expert Team, Aligned with Investors
Flagship fund launched in 2002 by James Hall and Benjamin Appen
Run today by six partners, all required to hold meaningful personal investments in Magnitude funds
Company of 37 people with deep and varied hedge-fund experience
Focused Objective, Broad Capabilities
Funds of hedge funds and similar vehicles
Continuously broadening investment scope over 19 years
Diverse, Institutional Investor Base

~$5.3 billion of assets under management (AUM)
84% of firm AUM from institutions
78% North America, 22% ex North America
All data is as of September 30, 2021, unless otherwise indicated. See the separate document entitled Endnotes provided along with this presentation for important disclosures.
SALVATION ARMY INVESTMENT
Fund Name Magnitude International
Share Class Class A Strategy Multi-strategy fund of hedge funds Investment Objective Magnitude International aims to (i) earn about 5% over LIBOR net of fees, and (ii) achieve 5% annual volatility, over an extended market cycle. Magnitude believes passive equity, fixed income, and credit market exposures can be sourced more cheaply and with better liquidity outside of hedge fund vehicles (e.g., via ETFs). As a result, Magnitude International’s portfolio is designed to deliver attractive riskadjusted returns with limited exposure to such passiverisks. Initial Investment Amount
*Balance
$26,000,000 | June 1, 2021 Follow On Amount $14,000,000 | August 1, 2021 Current Investment Amount* $41,629,875 | September 30, 2021 Account Overview
based on 9/30/21 net asset value statement. Please see the separate document entitled Endnotes provided along with this presentation for important disclosures. .
2021 PERFORMANCE
Magnitude International Class A
NET LIFETIME STATISTICS
Annualized Net Return 6.4% Best Month 4.2% Equity
Correlation 0.49 Beta 0.15
Annualized Standard Deviation 4.4% Worst Month 6.8% Fixed Income 0.26 0.21 Sharpe Ratio 1.1 Largest Drawdown 22.7% Credit 0.64 0.31
Autocorrelation 0.5 Drawdown Period 7 Months Volatility 0.29 0.02
% Positive Months 79% Recovery Period 21 Months HFRI FOF 0.80 0.67
NET PERFORMANCE SUMMARY
2002 Jan Feb Mar Apr May Jun Jul Aug Sep Oct 0.1% Nov 0.3% Dec 1.3% YTD 1.5% 2003 0.8% 1.1% 0.7% 1.6% 1.6% 1.2% 0.1% 0.8% 2.2% 1.1% 0.7% 0.7% 11.5%
2004 1.3% 0.5% 0.7% 0.6% 0.7% 0.2% 0.4% 0.5% 1.2% 0.9% 2.4% 1.3% 8.4%
2005 1.1% 1.1% 0.6% 0.1% 0.6% 1.2% 0.8% 1.0% 1.5% 0.1% 1.4% 1.2% 8.8%
2006 2.7% 1.0% 1.8% 1.3% 0.3% 0.2% 0.2% 0.7% 1.3% 1.1% 2.1% 1.8% 14.3%
2007 1.4% 0.4% 1.2% 1.3% 2.5% 1.2% 0.0% 1.2% 1.5% 2.9% 0.3% 1.2% 13.5%
2008 1.0% 1.0% 2.3% 2.1% 1.7% 0.4% 1.7% 1.9% 6.3% 6.8% 6.0% 1.9% 21.6%
2009 1.6% 0.9% 0.6% 2.4% 4.2% 1.9% 3.0% 2.3% 2.6% 1.8% 0.3% 1.7% 25.7%
2010 0.3% 0.3% 1.0% 1.2% 1.2% 0.4% 0.5% 0.9% 1.2% 1.1% 0.1% 1.6% 6.9%
2011 1.3% 1.0% 0.7% 1.3% 0.5% 0.2% 0.5% 0.9% 0.6% 0.6% 0.2% 0.2% 4.6%
2012 1.4% 1.1% 0.3% 0.2% 0.2% 0.1% 0.5% 1.2% 1.0% 0.5% 0.7% 0.8% 7.8%
2013 1.4% 0.7% 0.0% 0.2% 0.9% 0.7% 0.3% 0.3% 0.7% 1.3% 0.6% 0.2% 4.7%
2014 0.9% 0.9% 0.0% 0.5% 1.2% 0.3% 0.7% 0.6% 0.7% 0.1% 1.4% 1.6% 8.2%
2015 0.8% 1.0% 0.7% 0.2% 0.9% 0.3% 1.0% 0.1% 0.0% 0.8% 1.0% 0.0% 6.0%
2016 1.6% 0.6% 0.2% 0.4% 0.1% 1.6% 0.7% 0.6% 0.3% 0.6% 0.9% 0.7% 2.8%
2017 1.0% 0.3% 1.3% 0.3% 0.5% 0.4% 0.7% 0.9% 0.6% 1.4% 0.5% 0.1% 7.4%
2018 1.4% 0.1% 1.2% 0.3% 1.1% 0.3% 0.6% 1.5% 0.0% 1.6% 1.6% 0.9% 1.7%
2019 1.0% 0.5% 1.3% 0.8% 1.0% 0.6% 0.3% 0.2% 0.8% 0.2% 0.6% 0.4% 6.3%
2020 0.2% 0.4% 3.6% 2.3% 1.2% 1.3% 1.8% 1.2% 0.5% 0.9% 0.8% 2.5% 9.1%
2021 1.1% 2.4% 0.3% 0.9% 0.0% 1.1% 0.7% 1.0% 1.8% 7.2%
PORTFOLIO PROFIT ATTRIBUTION
All data is as of September 30, 2021, unless otherwise indicated. Data above represents the performance of Magnitude International; not the performance of Salvation Army’s investment therein. Past performance is not indicative of future results. Please see the separate document entitled Endnotes provided along with this presentation for important disclosures. and Returns of Managed Accounts Notes for additional details.
Allocation
Month End
Portfolio MTD Portfolio YTD % Portfolio % Risk Return Contribution Return Contribution
Value
Value
Statistical Arbitrage 19% 17% 1.3% 0.25% 6.3% 1.27% Equity Volatility Relative
12% 9% 1.3% 0.16% 8.5% 0.80% Fixed Income Arbitrage 12% 8% 1.0% 0.12% 3.9% 0.49% Credit Relative
8% 6% 0.8% 0.06% 7.9% 0.69% Commodities Relative Value 7% 11% 15.1% 1.01% 65.1% 2.97% Long/Short Equity* 25% 33% 1.1% 0.29% 3.3% 0.80% Distressed 2% 2% 1.2% 0.02% 13.2% 0.27% Trading 15% 14% 0.9% 0.14% 8.0% 1.08%
COMMENTARY
Q3 Performance
Magnitude International, Class A (the “Fund”) returned 3.6% in the third quarter, bringing its year-to-date return to 7.2%. By comparison, the HFRI Fund of Funds Index (“FOF Index”) returned 0.8% for the quarter, bringing its yearto date return to 5.8%.
The Fund benefitted from gains across all eight strategies. Commodities relative value was the largest contributor, benefiting from strong performance in European energy trading. Long/short equity and statistical arbitrage also contributed meaningfully.
During the third quarter, the Fund produced a positive return each month. Notably, the Fund returned 1.8% in September, a month in which the S&P 500 Total Return Index returned -4.7% and the U.S. Barclays Aggregate Bond Index returned 0.9%.
Magnitude Capital
Magnitude hired three new employees during the third quarter. Most notably, the firm welcomed Bala Balasubramaniam as a Managing Director on the investment team. In his role, Bala will be responsible for supporting the Investment Committee in all aspects of the investment process. Prior to joining Magnitude, Bala was a quantitative researcher at Stevens Capital where he ran a global futures strategy and worked on various aspects of the U.S. statistical arbitrage portfolio. Bala earned a Ph.D. in Theoretical and Applied Mechanics and an M.S. in Mechanical Engineering from the University of Illinois, UrbanaChampaign. He also holds an M.S. in Statistics from Stanford University and a B.S. from the Indian Institute of Technology at Madras.
During the quarter we also welcomed two associates, one on our legal team and another in operations. As of the end of the September, Magnitude had thirty-seven employees.
All data is as of September 30, 2021, unless otherwise indicated. Data above represents the performance of Magnitude International; not the performance of Salvation Army’s investment therein. Past performance is not indicative of future results. Please see the separate document entitled Endnotes provided along with this presentation for important disclosures.
INVESTMENT APPROACH
We focus on areas where we believe opportunity set is attractive, manager edge is tangible, and risk management is comprehensive and effective.
Past performance is not indicative of future results. Please see the separate document entitled Endnotes provided along with this presentation for important disclosures.
.
Magnitude’s approach has generated superior results by balancing analytical discipline with investment innovation.
MANAGER SELECTION
Manager evaluation relies on a consistent analytical framework
Attractive Opportunity Set
Inefficient markets offer excess return capability
Complexity, opacity, and regulation can reduce efficiency
Tangible ManagerEdge
Superior analytical tools and infrastructure
Deep sector expertise
Creative application of unusual domain expertise
Disciplined Risk Management
Market risk
Operational risk
risk
Liquidity
Please see the separate document entitled Endnotes provided along with this presentation for important disclosures. .
MANAGER SELECTION
Examples of how the framework is applied
Attractive Opportunity Set China A Shares Market
A relatively immature market characterized by high retail participation, variable sophistication of institutional investors, obstacles to efficient short sales, and inconsistent trading liquidity.
Tangible ManagerEdge Statistical Arbitrage and Trading Manager
A statistical arbitrage manager, with more than 19 years of infrastructure development, employs a team of more than 200 PhDs in research and development.
While most managers execute equity trades using third-party broker algorithms, this manager developed proprietary algorithms to optimize its trading costs and increase its investment capacity.
Disciplined Risk Management
Fixed Income Arbitrage and Trading Manager
Fixed-income arbitrage requires large derivatives positions and prime broker financing, leading to more dependence on counterparties than is typical.
Manager has built a state of the art treasury function to manage risks relating to counterparties and financing.
Please see the separate document entitled Endnotes provided along with this presentation for important disclosures. .
Investment Portfolio Annual Review Meeting


PIMCO
PIMCO Headquarters: 650 Newport Center Drive Newport Beach, CA 92660
November 2021
Firm Summary
Pacific Investment Management Company LLC (“PIMCO”)1 was founded in Newport Beach, California in 1971 and is a global investment solutions provider. As of September 30, 2021, PIMCO managed $2.20 trillion in assets under management with more than 3,110 dedicated professionals in 12 countries.2 While primarily known as one of the world’s largest fixed income managers, PIMCO also manages a broad range of strategies across different asset classes including alternatives, equities, and real assets.
There have been no significant changes to the strategies the Salvation Army Southern Territory has been invested in over the past fiscal year ending September 30, 2021. Please refer below for announcements regarding significant organizational and personnel changes
1 Includes PIMCO’s global affiliates, as appropriate. PIMCO directly owns and controls PIMCO Investments LLC and may directly or indirectly own and control certain other global PIMCO entities.

2 AUM and dedicated professionals include those that relate to PIMCO’s acquisition of Gurtin Fixed Income Management, LLC in January 2019.

Acquisitions, Partnerships and Joint Ventures
In January 2021, PIMCO announced its intention to form a new technology led company, HUB, to build a cloud based operating platform aimed at transforming asset managers’ operations technology. The platform will be designed and built in collaboration with PIMCO, Man Group, IHS Markit, State Street, Microsoft and McKinsey. The HUB platform is expected to enhance PIMCO’s client experience over time, as the firm modernizes the middle and back office infrastructure. Examples of future client experience enhancements include improved and faster reporting of data, improved resiliency against errors, simplified connectivity challenges to vendors, and minimized client change costs through delivering solutions as part of an integrated product ecosystem. Data within the HUB system will also be used by PIMCO’s trading and analytics teams, which also benefits the firm’s clients indirectly.
In October 2020, PIMCO announced that it has reached a preliminary agreement with GE Capital Aviation Services (GECAS), a world leading lessor and business unit of General Electric (NYSE: GE), to develop an aviation leasing platform to support up to $3 billion in aircraft asset financings. This strategic investment platform will enable GECAS and PIMCO to acquire new and young fuel efficient aircraft to meet the needs of a diverse set of global airlines over many years. PIMCO is already one of the world’s largest investors in aviation backed debt and its presence in aviation financing markets combined with GECAS’ leadership role in the aircraft leasing segment will provide this joint platform enormous flexibility to provide funding to the global airline industry. The transaction is subject to customary closing conditions and required regulatory approvals.
Significant Personnel Changes
No significant personnel changes related to the strategies we manage on behalf of Salvation Army.
PIMCO’s Investment Process
PIMCO’s investment process includes both top down and bottom up decision making. The first and most important step in the process is to get the long run right. PIMCO believes analyzing secular economic and political influences is fundamental to sound portfolio decisions. Holding a definitive, long term view helps guard against becoming caught up in periodic bouts of euphoria and depression that often characterize financial markets. PIMCO is much more optimistic about its skill in identifying long run value through fundamental economic and credit analysis than its ability to time short term market movements.
PIMCO considers secular analysis so important that it devotes three days each year to what is called the “Secular Forum,” at which the firm formulates its outlook for global bond markets over the next three to five years. Selected members of the investment staff are assigned secular topics to monitor, including monetary and fiscal policy, inflation, demographics, technology, productivity trends, and global trade. Secular researchers tackle their subjects on a global basis and approach them over a multi year horizon. At the Secular Forum the secular researchers summarize their findings for all the firm’s investment professionals. In addition, the firm invites external analysts and scholars to share their expertise on financial and economic issues that are germane to the outlook. These external presentations combined with the firm’s internal research serve as background for further discussion and debate by the group. The investment process as a whole including the role of the secular outlook is illustrated in the graphic below:
The next step in PIMCO’s process is the analysis of cyclical or business cycle trends. PIMCO investment professionals meet three times a year in “Cyclical Forums” to evaluate growth and inflation over the business cycle horizon of the next 6 12 months. PIMCO evaluates, from a bottom up perspective, the research and economic data from presentations by the firm's four regional portfolio committees [Asia Pacific Portfolio Committee (“APC”), the Europe Portfolio Committee (“EPC”), the Americas Portfolio Committee (“AmPC”) and the Emerging Markets Portfolio Committee (“EMPC”)]. These presentations are followed by discussion and debate, the purpose of which is to develop an outlook for each region over the cyclical horizon. The conclusions help refine and update PIMCO’s forecasts for shorter term economic trends.
Following the Secular and Cyclical Forums, the Investment Committee, comprised of senior portfolio managers and headed by PIMCO’s Group Chief Investment Officer and CIOs, works on a consensus basis to develop major strategies that serve as a model for all portfolios. The Investment Committee makes use of the top down outlook provided by the Forums, PIMCO’s economists and senior advisors, and generalist portfolio managers as well as bottom up input from the CIOs and specialists who each focus on their respective asset classes. The five portfolio risk characteristics for which the Investment Committee sets targets are duration, yield curve positioning, credit risk exposure, FX positioning and convexity and ensures themes are consistently applied across all portfolios.
The Portfolio Management group, through the incorporation of the Investment Committee’s model portfolio characteristics, will then construct individual portfolios. The structure of this group resembles a hub and spoke system, with senior generalist portfolio managers comprising the hub and a group of sector specialists the spokes. PIMCO assigns a generalist portfolio manager to each account. It is the generalist’s responsibility to see that the portfolio is structured to reflect the model portfolio risk targets defined by the Investment Committee. Generalists are required to keep broad portfolio characteristics within a pre defined range around model targets but can decide which securities to buy in order to meet the model targets as long as permitted per investment guidelines. Generalists receive input and strategic ideas from sector specialist teams that cover every pocket of the global fixed income universe, including government, mortgage, corporate, non dollar, emerging market, convertible and inflation protected markets. These sector teams are led by seasoned portfolio managers who typically have a decade or more of experience in their sector. Generalists are ultimately responsible for all purchases and sales in their assigned portfolios, but they may direct sector specialist portfolio managers to assist with execution.

Bottom up security selection is an important aspect of portfolio construction. Sector specialists are charged with determining relative value within their sectors and play a key role in security selection. An important resource for the sector specialists is PIMCO’s staff of highly seasoned analysts who conduct independent security analysis. PIMCO also utilizes an extensive library of proprietary analytical software to help quantify risks and relative value in different securities.
Investment Objectives of Managed Strategies
PIMCO Short Asset Investment Fund (SAIF)
The Short Asset Investment Fund is part of the short term suite at PIMCO Yields remain compressed, making it difficult for investors to obtain high quality income without moving beyond their risk tolerance. The fund seeks higher income potential than traditional cash investments, with less volatility than typical short term bond strategies. It uses a risk factor approach to manage specific and overall portfolio risk as well as tactical allocations within guideline limits.
SAIF is an actively managed enhanced cash strategy that seeks to dynamically manage risk and liquidity. The fund invests in both high quality money market instruments and a wide range of non money market securities such as U.S. Treasury and Agency securities, investment grade credit and high quality structured credit. The fund’s conservative investment guidelines prohibit investing in high yield securities and limits exposure to other fixed income sectors, which may increase volatility in periods of financial stress. In an effort to minimize total portfolio volatility, the fund’s mandate allows for limited use of derivatives.
PIMCO BRAVO Fund II
In the aftermath of the financial crisis and in the face of regulatory reform, the global financial system has remained on a multi year path of deleveraging.
Despite significant stabilization in fundamentals since 2009, higher capital burdens and increased compliance/legal costs due to the changed regulatory environment continue to fuel bank retrenchment from “non core” businesses As an example, U.S. mortgage finance has been perhaps the most fractured market due to a number of regulatory and legislative frictions post GFC. At the same time, policy makers continue to provide ongoing support to housing and credit assets through liquidity and stimulus provisions. For these principal reasons, PIMCO launched the BRAVO II Fund (the “Fund”) in 2013. This Fund seeks to capitalize on non economic asset sale decisions by global financial institutions with the flexibility to acquire attractively discounted loans or structured credit tied to residential or commercial real estate markets.
Inception Date, Initial Investment, History of Sizeable Cash Inflows/Outflows, & FY 21 Market Values Short Asset Investment Fund BRAVO Fund II Inception Date 2/27/2019 3/14/2014 Initial Investment * $20,000,000** *PIMCO does not have transparency for this information as it is invested through a third party platform **Capital Committed
PIMCO Short Asset Investment Fund
Trade Date Cash Inflows Trade Date Cash Outflows
8/15/2019 $20,000,000.00 12/16/2019 ($8,000,000.00) 2/7/2020 $10,000,000.00 3/16/2020 ($30,000,000.00) 6/10/2020 $30,000,000.00 3/24/2020 ($3,548,793.30) 7/29/2020 $30,000,000.00 9/17/2020 ($2,500,000.00)
1/20/2021 $10,000,000.00 9/24/2020 ($4,000,000.00) 1/27/2021 $13,000,000.00 10/5/2020 ($5,000,000.00) 2/2/2021 $10,000,000.00 12/11/2020 ($10,000,000.00) 3/11/2021 $20,000,000.00 5/25/2021 ($52,000,000.00) 4/1/2021 $10,000,000.00 6/14/2021 ($10,000,000.00) 4/19/2021 $10,000,000.00 8/4/2021 ($20,000,000.00) 4/28/2021 $10,000,000.00 8/17/2021 ($20,000,000.00) 7/23/2021 $10,500,000.00 8/24/2021 ($8,000,000.00)
3/31/2014 $3,500,000.00 9/29/2017 $1,025,847.36 6/30/2014 $1,000,000.00 3/19/2018 $1,233,165.52
9/30/2014 $2,000,000.00 8/15/2018 $1,101,147.46 12/31/2014 $2,000,000.00 11/13/2018 $1,193,499.87 3/31/2015 $2,000,000.00 2/12/2019 $1,219,332.01 6/30/2015 $2,000,000.00 12/31/2015 $3,500,000.00 3/31/2017 $1,500,000.00
BRAVO Fund II Trade Date Capital Calls Trade Date Distributions
PIMCO
Short Asset Investment Fund (MM) BRAVO Fund II (MM) Starting Market Value (10/1/20) $53.86 $7.11 Ending Market Value (9/30/21) $22.54 $6.31
Fiscal
Year 2021 Performance and Attribution
PIMCO Short Asset Investment Fund
Period Net Perf Benchmark* Net Alpha
FY 2021 0.29 0.06 0.23
FY 2020 1.46 1.02 0.44 2021 YTD 0.08 0.03 0.05 2020 1.21 0.58 0.63 2019** 1.99 1.86 0.13 SI** 1.26 0.95 0.31 *FTSE 3 Month Treasury Bill Index **Since Account Inception as of 2/27/19
PIMCO Short Asset Investment Fund (SAIF)
Holdings of investment grade corporate credit contributed to performance
U.S. interest rate positioning contributed to performance
Select holdings of securitized credit contributed to performance
Fund
PIMCO BRAVO Fund II
Performance drivers were broad based, with notable contributions from both commercial real estate, as sales indications exceeded expectations, and publicly held securities, as valuations charged higher.
Within commercial real estate, master planned communities, multifamily, and office assets across Southeastern U.S. markets and California drove positive performance.
Listed exposures in commercial REITs and financials also contributed to performance, as positions rallied in line with public equity markets amid positive vaccine developments.
While we are pleased to furnish the information requested, we are also doing so on the basis that you understand and agree that we do not and are not providing impartial investment advice (as we have a financial interest in being hired) and are not giving any advice in a fiduciary capacity in our response or related interactions, and that we will not receive a fee or other compensation in connection with the response and related interactions, unless, of course, we are retained to provide discretionary investment management services. Further, you agree that you will not rely on the information we have furnished in response to your request as a recommendation or fiduciary investment advice in connection with any investment decision that you make. Our responses are designed to highlight the quality of our investment management services without regard to any specific investment strategy.
PIMCO BRAVO
II SI* Net IRR SI* Net Multiple QoQ Q3 Net Time Weighted Return 7.6% 1.4x 3.8% *Since Fund Inception as of 4/5/2013
This page intentionally left blank
November 2021

Firm summary & updates
• A top-10 global real estate manager1
• Almost 550 clients from 29 different countries2 place their trust in our expertise
• Over 60 years of real estate investment experience3
• More than $103 billion in real estate debt and equity transactions over the past decade
• Over 425 employees across 11 countries

• A team of more than 275 investment professionals on the ground in major markets across 10 countries4
Four quadrant real estate platform
Scott
R.
Smith Managing Director, Portfolio Management
Scott is a managing director of portfolio management at Principal Real Estate Investors, the dedicated real estate unit of Principal Global Investors. Scott oversees Principal Real Estate Investors' efforts and client programs in the High Yield debt space. In addition to portfolio manager duties with other client programs, Scott's primary responsibilities include being the lead portfolio manager for the Principal Real Estate Investors' "Debt Fund Series". Scott joined the firm in 1983. He received a bachelor's degree in finance and business management from University of Northern Iowa.
Troy W. Kort, CFA Portfolio Manager

Troy is a Portfolio Manager at Principal Real Estate Investors, the dedicated real estate group of Principal Global Investors. Troy’s focus is on structured debt investments for the firm and its high yield investor clients. Other prior experience includes CMBS, CRE subordinate debt, bridge loans, special servicing, and core mortgages. Troy has been part of Principal Real Estate Investors and its predecessors for over 23 years. Troy received an MBA with a concentration in finance and a bachelor's degree in mathematics from the University of Nebraska. He has earned the right to use the Chartered Financial Analyst designation and is a member of the CFA Institute.

November 2021
As of 30 September 2021. 1Managers ranked by total worldwide assets (net of leverage, including contributions committed or received, but not yet invested, REIT securities are excluded), as of 30 June 2021. “The Largest Real Estate Investment Managers,” Pensions & Investments, 4 October 2021. 2Includes clients of, and assets managed by, Principal Real Estate Europe Limited and its affiliates. 3Principal Real Estate Investors became registered with the SEC in November 1999. Activities noted prior to this date were conducted beginning with the real estate investment management area of Principal Life Insurance Company and later Principal Capital Real Estate Investors, LLC, the predecessor firm to Principal Real Estate Investors. 4Includes investment professionals of Principal Real Estate Europe Limited and its affiliates.
Private Equity Core, Value add and Opportunistic Strategies $39.4 billion Public Equity Real Estate Investment Trust Securities $24.8 billion Public Debt Commercial Mortgage Backed Securities $9.3 billion Private Debt Commercial Mortgages, Bridge and Mezzanine Loans $24.7 billion
Principal Real Estate Debt Fund, LP Performance summary
The Fund originally targeted a return range of 8% 10% (annualized, levered and net of fees). Returns steadily moved in over the first 1 2 years of the Fund as LIBOR remained persistently low and spreads contracted. By early 2015 the Manager recommended keeping risk level and investing at below target investment levels, and the Advisory Committee agreed unanimously. In years 2 3 of the investment period market volatility and a rising LIBOR allowed the Fund to return to investing at target level returns. Throughout the entire investment period the Manager has endeavored to hold risk steady in accordance with the defensively positioned nature of the Fund.
Principal Real Estate Debt Fund, LP Returns
Year ended 09/30/21
Year ended 9/30/20
Year ended 9/30/19
Year ended 9/30/18
Year ended 9/30/17
Year ended 9/30/16
Year ended 9/30/15 Since Inception
Income 8.34% 7.83% 8.63% 8.25% 8.33% 7.86% 9.31% 8.33%
Unrealized gain .20% 2.00% 0.67% 1.13% 0.03% 0.36% 0.18% 0.01%
Total 8.54% 5.85% 7.97% 7.14% 8.30% 8.21% 9.18% 8.33%
Returns above reflect a cash basis. As the Fund distributes all borrower paid origination fees to the limited partners, returns are expected to be somewhat accelerated during the investment period. After the investment period ends, returns will revert to primarily deriving from the portfolio’s loan coupons. It is management’s current projection that over the life of the Fund, total returns will be in the 8.0% 8.5% range. This projection assumes that investments currently in the portfolio perform according to current assumptions, and is modeled on the currently available forward LIBOR curve.
Investment objectives
Principal Real Estate Debt Fund, LP is a 2013 vintage 7 year closed end fund sponsored and managed by the Principal Real Estate Investors. The Fund's objective is to provide investors with current and attractive long term risk adjusted returns relative to core real estate equity investments and high yield corporate bonds. The Fund seeks to accomplish this objective through a defensively positioned commercial real estate strategy featuring investments in first mortgages utilizing a moderate amount of leverage and subordinate debt.
Inception Date: 6/13/2014 The Salvation Army Southern Territory Commitment: $25,000,000 Metric Prior year end Prior quarter Current quarter # of Active Loans 2 1 1 Loan Balance $14,711,013 $6,300,000 $6,300,000 Coupon Rate 8.66%
LTV 74%
Debt Yield 8.90%
DSCR
Occupancy Rate 84.2%
78.3% Active portfolio measures PREDF Capital calls and distributions – PREDF I Capital call date The Salvation Army
Distribution date
Salvation Army
*Capital call includes recalled capital pursuant to Sections 3.01 and 5.02 of the Limited Partnership Agreement Name Loan balance Percent City Property type 1625 K Street NW $6,300,000 100% Washington, DC Office Fund portfolio holdings – PREDF I Loan name Funding date Loan balance Payoff date Debt yield* Mirmar Parkway 08/31/2015 $8,411,013 04/20/2021 8.00% *Yields reflect actual returns net of estimated Management & Financing costs • Loans realized: 1 sub debt investment for $8.4 million (10/01/20- 9/30/21)Key influencers of 2020
9.00% 11.00%
77% 77%
8.10% 8.13%
1.75 1.22 1.21
84.2%
2014 $5,037,691 2015 $11,435,559 2016 $7,858,798 2017 $123,652 2018 $155,710 Total $24,611,411
The
2014 $54,794 2015 $2,676,795 2016 $2,893,312 2017 $8,602,885 2018 $11,122,395 2019 $3,276,330 2020 $74,882 2021 $421,907 Total $29,123,300
Principal Real Estate Debt Fund II, LP
Performance summary
Fund II originally targeted a return range of 7% 9% (annualized, levered and net of fees). The lower return target reflects a recognition of where the market was at the start of the Fund and moving down on the risk spectrum toward slightly more conservative loans. Similar to the first fund, Fund two invests in sub debt and senior mortgages which are levered, but also can invest up to 20% of the Fund in participating construction permanent loans. This last strategy is a result of increased banking regulation which has greatly limited the amount of development capital that is available. The overall Fund leverage level was increased in Fund II to allow for the origination of more levered senior mortgages, which gives the Manager greater control over the investment. Maximum leverage at the loan level was reduced.
Year ended 09/30/21
Year ended 9/30/20
Year ended 9/30/19
Year ended 9/30/18 Since Inception
Income 9.98% 6.10% 7.20% 10.42% 8.15%
Unrealized gain 0.32% 1.21% 1.69% 0.83% 0.19%
Total 9.67% 4.89% 8.90% 11.27% 8.31%
Principal Real Estate Debt Fund II, LP
Investment objectives & holdings
Principal Real Estate Debt Fund II, LP is a 2017 vintage 7 year closed end fund sponsored and managed by the Principal Real Estate Investors which looks to build upon the success of the previous Fund. The Fund's objective is to provide investors with current and attractive long term risk adjusted returns relative to core real estate equity investments and high yield corporate bonds. The Fund seeks to accomplish this objective through a defensively positioned commercial real estate strategy featuring investments in first mortgages utilizing a moderate amount of leverage, subordinate debt and a maximum investment of 20% of the fund in participating construction permanent loans.
capital
Capital calls and distributions – PREDF II • 7 loan realizations for $254.9 million Key influencers of 2020
Distribution date The Salvation Army
Capital call date The Salvation Army
$4,208,985
Property Name Loan Balance Loan Type Funding Date Payoff Date Yield BX Industrial $41,820,000 Mezz 6/20/18 11/9/20 5.60% Preston Ridge $13,862,707 Senior Mort 2/15/18 4/26/21 8.40% Dartmoor Apts. $53,075,586 Part Constr 1/24/18 6/24/21 9.02% Sugar Hill $14,200,000 Senior Mort 6/29/18 7/1/21 10.46% Parkway Flats $31,500,000 Senior Mort 3/26/19 8/13/21 11.94% Langtree Village $59,600,000 Part Constr 1/30/19 9/10/21 18.68% Fountain Square $40,798,663 Senior Mort 12/21/17 9/30/21 9.47% Realizations
Inception Date: 12/15/2016 The Salvation Army Southern Territory Commitment: $25,000,000 Capital call includes recalled
pursuant to Sections 3.01 and 5.02 of the Limited Partnership Agreement. *Metrics are at time of origination.
(10/01/20 9/30/21)
2017 $148,968 2018 $3,169,930 2019 $4,904,559 2020 $4,266,704 2021 $5,750,270 Total $18,240,432
2017
2018 $10,604,091 2019 $7,307,805 2020 $1,382,263 2021 $292,312 Total $23,795,456
# of Active Loans 21 19 15 Loan Balance $701,923,843 $618,428,804 $473,995,068 Coupon Rate 5.00% 5.10% 4.99% LTV 74% 72% 72% Debt Yield 7.15% 7.26% 7.06% DSCR 2.07 1.95 2.06 Occupancy Rate 78.0% 77.8% 76.4%
300 South Wacker $12,428,260 3% Chicago, IL Office
Live Oak Square $37,650,000 8% Atlanta, GA Office Urban Centre $16,080,850 3% Tampa, FL Office
Project Bull $21,607,853 5% Various Office Project Kensington $36,487,248 8% Various Office Mohawk Business Park $37,800,000 8% Portland, OR Office 55 West $23,054,867 5% Portland, OR Office
Shirlington Gateway $30,921,293 7% Washington, DC Office The View $46,600,000 10% Los Angeles, CA Multifamily
Market Center $21,800,000 5% Denver, CO Office Ridgedale Mall $50,100,000 11% Minneapolis, MN Retail Regalia Bella Terra $27,250,000 6% Houston, TX Multifamily 31 Penn Plaza $57,582,609 12% New York, NY Office
Property Loan Balance Percent
Property type
City
BRE Select Service $24,140,883 5% Various Lodging The Standard $30,491,207 6% New York, NY Multifamily
Fund portfolio holdings – PREDF II Metric Prior year end Prior quarter Current quarter
Active portfolio measures PREDF II
Principal Real Estate Debt Fund III, LP
Performance summary
Fund III is targeted to a return range of 7% 9% (annualized, levered and net of fees), similar to the previous Fund in this series. Similar to Fund II, Fund III invests in sub debt and senior mortgages which are levered but can invest up to 25% of the Fund in participating construction permanent loans. The overall Fund leverage is consistent with Fund II.
Investment objectives & holdings
Principal Real Estate Debt Fund III, LP is a 2020 vintage 7 year closed end fund sponsored and managed by the Principal Real Estate Investors which looks to continue to build on the success of the previous Fund.The Fund’s objective is to provide investors with current and attractive long term risk adjusted returns relative to core real estate equity investments and high yield corporate debt.The Fund seeks to accomplish this objective through a defensively positioned commercial real estate strategy featuring investments in first mortgages utilizing a moderate amount of leverage, subordinate debt and maximum investment of 25% of the fund in participating construction permanent loans.
Metric Prior year end Prior quarter Current quarter # of Active Loans 7 14 14 Loan Balance $252,250,306 $467,074,625 $414,034,820 Coupon Rate 5.95% 4.87% 5.03% LTV 76% 68% 67% Debt Yield 6.35% 7.36% 7.80% DSCR 1.76 2.09 2.24 Occupancy Rate 55.1% 83.6% 83.6%
• Final investor close on 12/11/20 • Fund equity raise of $578.6 million • The Salvation Army Southern Territory upsized the commitment from $15.0 million to $25.0 million
Active portfolio measures PREDF III
influencers of 2020
Key
The Salvation Army Southern Territory Commitment: $25,000,000 Capital call date The Salvation Army 5/28/20 $2,178,834 7/29/20 $1,114,837 8/26/20 $998,632 $4,292,303 (10/01/20 9/30/21)
Name Loan Balance Funding Date Maturity Date Spread
(bp) Occupancy DSCR Debt Yield
Main Street Portfolio $32,000,000 1/25/21 2/1/26 375 81% 1.62 6.98%
The Liberty Building $49,028,490 2/23/21 1/9/26 290 100% 3.75 11.58%
The Summit $19,000,000 2/26/21 3/1/26 350 94% 1.94 7.88%
1980 N Milwaukee Ave $24,000,000 3/31/21 4/10/26 300 80% 2.48 7.76%
Hollis Business Center $27,035,029 3/15/21 3/7/26 297 68% 1.58 5.00%
500 Ygnacio $25,500,000 6/14/21 7/1/26 315 76% 2.34 8.06% Food for Less $38,000,000 6/1/21 6/1/26 400 98% 2.81 12.12%
AMLI City Vista $10,500,000 9/17/21 10/1/26 634 97% 1.74 5.01%
Westwood Business Park $26,380,000 9/15/21 10/1/26 310 91% 2.26 7.57%
Fund portfolio holdings PREDF
III
Loan structure
Property Loan Balance Percent City Property type
Campus at Arboretum
$11,075,502 3% Austin, TX Office
Wells Fargo Center $45,300,000 11% Denver, CO Office
Thanksgiving Station $30,652,000 7% Provo, UT Office
2 Cal Plaza Base Case $50,563,799 12% Los Angeles, CA Office
1980 N Milwaukee Ave $24,000,000 6% Chicago, IL Multifamily Hollis Business Center $27,035,029 7% Oakland, CA Life Science 500 Ygnacio $25,500,000 6% Oakland, CA Office
• Loan amount
1812 North Moore St $25,000,000 6% Alexandria, VA Office
• Term
Main Street Portfolio $32,000,000 8% Los Angeles, CA Office
The Liberty Building $49,028,490 12% Washington, DC Office Food for Less $38,000,000 9% Los Angeles, CA Retail
AMLI City Vista $10,500,000 3% Houston, TX Multifamily
Westwood Business Park $26,380,000 6% Dallas, TX Industrial Campus at Arboretum $11,075,502 3% Austin, TX Office
Important information
The performance of PREDF I and II are calculated by aggregating all the appropriate realized and target (unrealized) levered asset level cashflows. The unrealized loans are still active, and their net cash flows are contingent on many factors. Since their performance streams include unrealized cash flows, the actual IRRs of the loans achieved by PREDF I and PREDF II may differ for the assumptions utilized by Principal Real Estate Investors. Actual realized asset level cashflows of the investments depend on, among other factors, future operating results of the properties financed, the market value of the loans and market conditions during the terms of the loans, which may differ from the assumptions used by Principal Real Estate Investors Unless otherwise noted, the information in this document has been derived from sources believed to be accurate as of October 2021. Information derived from sources other than Principal Global Investors or its affiliates is believed to be reliable; however, we do not independently verify or guarantee its accuracy or validity. Past performance is not necessarily indicative or a guarantee of future performance and should not be relied upon to make an investment decision. All figures shown in this document are in U.S. dollars unless otherwise noted. All assets under management figures shown in this document are gross figures and may include leverage, unless otherwise noted. Assets under management may include model only assets managed by the firm, where the firm has no control as to whether investment recommendations are accepted, or the firm does not have trading authority over the assets. This document is issued in the United States by Principal Real Investors, LLC, which is regulated by the U.S. Securities and Exchange Commission.
Principal Real Estate Investors is committed to operating practices that are environmentally responsible. The “Member” logo is a trademark owned by the U.S. Green Building Council and is used with permission.


30%
portfolio
PREDF III Capital call date The Salvation Army
$2,592,621
Distribution date The Salvation Army
Fund
fundings
05/28/20
07/29/20 $1,326,558 08/26/20 $1,188,285 01/19/21 $3,307,753 06/23/21 $1,672,241 Total $10,087,458
12/31/20 $323,693 03/31/21 $155,320 06/30/21 $215,653 09/30/21 $539,692 Total $1,234,357
This page intentionally left blank
STRICTLY CONFIDENTIAL. NOT FOR DISTRIBUTION. TUDOR INVESTMENT CORPORATION 2021 PRESENTATION MATERIALS FOR THE SALVATION ARMY (TSA) SOUTHERN TERRITORY INVESTMENT PORTFOLIO ANNUAL REVIEW NOVEMBER 2021
FIRM AND INVESTMENT VEHICLE SUMMARY
FIRM SUMMARY
Firm Inception Date: 1980
AUM: $11.7BN
Number of Investment Professionals: 153
Total Number of Employees: 312
Firm updates for fiscal 2021 period: David Kelly joined Tudor in September 2021 as Chief Technology Officer and is based in the Stamford office.
Stamford, CT Corporate Headquarters; Global Macro, Systems Trading and Execution
New York, NY Global Macro, Systems Trading, Quantitative Trading Research & Development, Data Driven Equity and Research
Boston, MA Event Driven, Systems Trading
Palm Beach, FL Global Macro
London, UK Global Macro, Systems Trading, Execution and Research
Singapore Global Macro, Systems Trading and Quantitative Trading Research & Development
OBJECTIVES
INVESTMENT VEHICLE SUMMARY
Tudor Riverbend Crossing Partners Portfolio Ltd. (“Tudor Riverbend Crossing Partners”, “TRCP” or the “Fund”) searches corporate events for pricing inefficiencies then uses a rigorous proprietary methodology to try to capture alpha opportunities.
• Tudor Riverbend Crossing Partners, an event driven fund, seeks to provide consistent, non correlated returns
• Monthly realized market beta of 0.011
• Low net exposures
• A focus on dynamic risk management and low beta has allowed the Fund to deliver alpha in periods of market stress
1. Calculated in relation to the S&P 500 Total Return Index. Beta is a measure of a portfolio’s volatility and the covariance of the portfolio in relation to the market.
THE FUND/STRATEGY
• The Fund is managed by Emil Dabora, PhD
• Emil has a distinguished career at premier firms, including as the PM managing substantial portfolios at Harvard Management Company and Caxton
• Philosophy of acting as a liquidity provider to capture opportunities during changes in ownership base
• The strategy encompasses hard and soft catalysts including mergers, spinoffs, restructurings, structural and management changes, principally in equities
• Investment approach identifies mispricing utilizing proprietary processes for in depth bottom up fundamental research on corporate events layered with quantitative modeling and statistical analysis
• Uses a rigorous process to determine how to best isolate and structure investments to mitigate unwanted risk factors
• Emil also trades the same portfolio for Tudor’s flagship strategy (subject to certain, potentially different weights or positions)
STRICTLY CONFIDENTIAL. NOT FOR DISTRIBUTION. |TUDOR INVESTMENT CORPORATION
TUDOR’S PRINCIPAL BUSINESSES ARE LOCATED IN THE US, UK AND SINGAPORE, WITH PRIMARY INVESTMENT FUNCTIONS BY LOCATION NOTED BELOW:
INVESTMENT UNIVERSE
Tudor Riverbend Crossing Partners evaluates a broad spectrum of corporate catalysts to seek high conviction opportunities over diverse market cycles.
HARD TO SOFT CATALYSTS
STRUCTURAL CHANGES MANAGEMENT CHANGES SOFT CATALYSTSMERGERS
Agreed In Play
SPIN-OFFS
RESTRUCTURINGS
Time Horizon 3MOS. 1YR. 2 3YRS. 1 3YRS. 1 3YRS. 2 3YRS. 1 3YRS.
Economic Cycle Activity
Historical Opportunistic Alignment
Trough and early recovery Early and mid recovery Throughout ThroughoutMid recovery and froth Recovery and froth
Strong M&A environment Low growth plus corporate cash makes trend likely to continue
Numerous spin outs Companies seeking to unlock value
Struggling high yield markets
Low recent bankruptcies
Expected near term increase in restructurings
Macro / Business disruptors force strategic shifts
Different economic cycles bring about changing needs for optimal management
Potential change for legal, regulatory and tax regimes Market forces may change business prospects
STRICTLY CONFIDENTIAL. NOT FOR DISTRIBUTION. |TUDOR INVESTMENT CORPORATION
Financial Strategic Company Level Industry Level Growth Value Legal/Tax Regulatory changes Growth Value Categories
TSA SOUTHERN TERRITORY INVESTMENT SCHEDULE
TUDOR RIVERBEND CROSSING PARTNERS CALENDAR YEAR PERFORMANCE2
Year
TUDOR RIVERBEND CROSSING PARTNERS PERFORMANCE FOR TSA SOUTHERN TERRITORY FISCAL YEAR
1. These shares were originally Sub Class C and switched to Sub Class IN effective May 01, 2021. Fees for each class are as follows: Sub Class C Management Fee 1.0%, Performance Allocation 10%, Sub Class IN Management Fee 0.75% Performance Allocation 10%.
2. Source: The Tudor Group. All data are unaudited.
3. Actual net performance shown for Tudor Riverbend Crossing Partners L.P. Sub Class C is representative of the performance of an initial investor in the FINRA Non Restricted sub class (with New Issues).
4. The difference in performance between Tudor Riverbend Crossing Partners L.P. and Tudor Riverbend Crossing Partners Ltd. is de miminimis. Net performance for each investor may differ based on the timing of capital transactions. Net performance among classes varies as a result of New Issue trading and differing management fee and performance allocation rates.
5. This is a blended performance that takes into account the switch from Sub Class C to Sub Class IN, effective May 01, 2021. For the period Oct 1, 2020 through May 31, 2021, the monthly Rate of Return (RORs) represent the performance of the initial tranche. For the period June 1, 2021 through Sept. 31, 2021, the monthly RORs represent a weighted average of the returns for the initial tranche and the additional $26m investment that occurred June 1 2021.
THIS DOCUMENT CONTAINS PAST PERFORMANCE DATA. PAST PERFORMANCE IS NOT A RELIABLE INDICATOR OF FUTURE PERFORMANCE. PAST PERFORMANCE IS NOT NECESSARILY INDICATIVE OF FUTURE RESULTS.
STRICTLY CONFIDENTIAL. NOT FOR DISTRIBUTION. |TUDOR INVESTMENT CORPORATION
SOUTHERN TERRITORY INVESTMENT
SUMMARY
TSA
AND PERFORMANCE
Date Amount Share Class 01/06/2019 $18,000,000 IN1 01/06/2021 $26,000,000 IN Total $44,000,000 Oct20 Nov20 Dec20 Jan21 Feb21 Mar21 Apr21 May21 Jun21 Jul21 Aug21 Sep -21 Total Return Sub Class C/IN5 1.13 1.03 1.40 0.42 0.62 0.60 1.37 0.30 0.37 0.30 0.82 0.56 4.17%
20215
Sub-Class C Actual (Jan 1, 2018 Onwards)3,4 2020 7.36 2019 6.48 2018 5.61
The chart below shows the 3 month rolling beta and inception to date (“ITD”) beta of Tudor Riverbend Crossing Partners as measured against the S&P 500 Total Return Index (“SPXT”)2 calculated using Tudor Riverbend Crossing Partners‘ daily gross returns3. As such, the rolling realized beta chart starts three months after inception. The table at the top of the chart shows ITD beta analysis using both daily, weekly and monthly data data.
Inception to Date Beta Analysis3
Tudor Riverbend Crossing Partners
Rolling Realized Beta to SPXT
Daily Realized Beta 0.02 Weekly Realized Beta 0.02 Monthly Realized Beta 0.01 (1.00) (0.80) (0.60) (0.40) (0.20) -
June 1, 2016 - September 30, 2021 0 TRCP 3m ITD
0.20 0.40 0.60 0.80 1.00 1-Sep-16 1-Dec-16 1-Mar-17 1-Jun-17 1-Sep-17 1-Dec-17 1-Mar-18 1-Jun-18 1-Sep-18 1-Dec-18 1-Mar-19 1-Jun-19 1-Sep-19 1-Dec-19 1-Mar-20 1-Jun-20 1-Sep-20 1-Dec-20 1-Mar-21 1-Jun-21 1-Sep-21
1. Beta is a measure of a portfolio’s volatility and the covariance of the portfolio in relation to the market.
2. Please see Important Information regarding indices in the Appendix.
3. Calculated using daily returns for TRCP L.P. Sub Class T. Sub Class T interests are not subject to any management fees or performance allocations
THIS DOCUMENT CONTAINS ACTUAL AND PRO FORMA PAST PERFORMANCE DATA. PAST PERFORMANCE IS NOT A RELIABLE INDICATOR OF FUTURE PERFORMANCE. PAST PERFORMANCE IS NOT NECESSARILY INDICATIVE OF FUTURE RESULTS.
STRICTLY CONFIDENTIAL. NOT FOR DISTRIBUTION. |TUDOR INVESTMENT CORPORATION
Source: The Tudor Group
BETA ANALYSIS 1
The chart below shows 10 day annualized rolling volatility for TRCP1 and SPXT2 for the period June 1, 2016 through September 30, 2021.
140%
120%
100%
80%
60%
40%
20%
0%
1-Jun-16 1-Jul-16 1-Aug-161-Sep-161-Oct-16 1-Nov-16 1-Dec-16 1-Jan-17 1-Feb-17 1-Mar-17 1-Apr-171-May-171-Jun-17 1-Jul-17 1-Aug-171-Sep-171-Oct-17 1-Nov-17 1-Dec-17 1-Jan-18 1-Feb-181-Mar-18 1-Apr-181-May-181-Jun-18 1-Jul-18 1-Aug-181-Sep-181-Oct-18 1-Nov-18 1-Dec-18 1-Jan-19 1-Feb-191-Mar-19 1-Apr-191-May-191-Jun-19 1-Jul-19 1-Aug-191-Sep-191-Oct-19 1-Nov-19 1-Dec-19 1-Jan-20 1-Feb-20 1-Mar-20 1-Apr-201-May-201-Jun-20 1-Jul-20 1-Aug-201-Sep-201-Oct-20 1-Nov-20 1-Dec-20 1-Jan-21 1-Feb-211-Mar-21 1-Apr-211-May-211-Jun-21 1-Jul-21 1-Aug-211-Sep-21
TRCP 10 Day Annualized SPXT 10 Day Annualized
1. Calculated using daily returns for TRCP L.P. Sub Class T. Sub Class T interests are not subject to any management fees or performance allocations.
2. Please see Important Information regarding indices in the Appendix.
THIS DOCUMENT CONTAINS ACTUAL AND PRO FORMA PAST PERFORMANCE DATA. PAST PERFORMANCE IS NOT A RELIABLE INDICATOR OF FUTURE PERFORMANCE. PAST PERFORMANCE IS NOT NECESSARILY INDICATIVE OF FUTURE RESULTS.
STRICTLY CONFIDENTIAL. NOT FOR DISTRIBUTION. |TUDOR INVESTMENT CORPORATION
VOLATILITY ANALYSIS 1,2
SPXT 1 DOWN MONTHS & DAYS
Bottom
TRCP
Dec 18 9.03% 1.40% 0.96%
Feb 20 8.23% 0.54% 0.34%
Oct 18 6.84% 0.04% 0.08%
May 19 6.35% 0.07% 0.18%
Aug 15 6.03% 0.43%
Jan 16 4.96% 0.99% Sep 21 4.65% 0.68% 0.47%
Sep 20 3.80% 0.32% 0.17%
Largest 10 SPXT1 negative days compared to the Fund2 for the period June 1, 2016 through September 30, 2021.
Bottom SPXT Days SPXT % Return TRCP % Return (Gross)
12 Mar 20 9.49% 0.25%
9 Mar 20 7.59% 0.09%
11 Jun 20 5.88% 0.01%
18 Mar 20 5.18% 0.07%
11 Mar 20 4.88% 0.03%
1 Apr 20 4.41% 0.11%
27 Feb 20 4.40% 0.07%
20 Mar 20 4.32% 0.52%
5 Feb 18 4.10% 0.03%
IMPORTANT DATES
On April 20, 2015, Emil Dabora commenced trading an event driven strategy, the “Tudor BVI Event Driven Strategy”, within the Tudor BVI Strategy. The Tudor BVI Strategy consists of The Tudor BVI Global Portfolio L.P. (“Tudor BVI”) and Tudor Global Fund L.P. (“TGF”), a Tudor Group proprietary vehicle which trades and invests on a parallel, “side by side” and levered basis (utilizing a lower funding level) with Tudor BVI.
1 Please see Important Information regarding indices in the Appendix
2 TRCP commenced trading on June 1, 2016 Sub Class T interests are not subject to any management fees or performance allocations
3 Tudor BVI Event Driven Strategy % Return (Gross) is based on actual gross performance of the event driven strategy traded in Tudor BVI for the period shown above with no adjustments for leverage, management fees and performance allocations The full monthly Tudor BVI Event Driven Strategy gross performance is on slide 25 of the full TRCP presentation (available on Tudor’s password protected website, www tudorfunds com) There will be material differences between certain aspects of Tudor Riverbend Crossing Partners as it is traded as part of Tudor BVI and how it is traded as a stand alone strategy, including, without limitation, the following:
• The notional trading amount of Tudor Riverbend Crossing Partners as a stand alone strategy has been levered at approximately 1x to 2x which results in higher volatility than the event driven strategy in Tudor BVI Leverage is subject to change without notice to investors
• Prior to August 2017, Tudor Riverbend Crossing Partners had a broader investment mandate as a stand alone strategy than it did as part of Tudor BVI Corporate credit instruments (and any such related investments) were previously restricted from the event driven strategy component of Tudor BVI whereas, as a stand alone strategy, Tudor Riverbend Crossing Partners has been able to invest in corporate credit instruments and make certain other related investments (including investments designed to hedge credit risk and investments that are related to or form part of the same investment thesis as an investment in a credit instrument) since its inception
• Tudor Riverbend Crossing Partners as a stand alone strategy is not subject to the draw down plan pre established for the strategy as a component of Tudor BVI
THIS DOCUMENT CONTAINS ACTUAL AND PRO FORMA PAST PERFORMANCE DATA. PAST PERFORMANCE IS NOT A RELIABLE INDICATOR OF FUTURE PERFORMANCE. PAST PERFORMANCE IS NOT NECESSARILY INDICATIVE OF FUTURE RESULTS.
STRICTLY CONFIDENTIAL. NOT FOR DISTRIBUTION. |TUDOR INVESTMENT CORPORATION
Largest 10 SPXT1 negative months compared to Emil Dabora’s trading within the Fund2 and Tudor BVI3 for the period April 20, 2015 through September 30, 2021.
SPXT Months SPXT % Return
L.P. Sub Class T % Return
TRCP commenced trading on June 1, 2016. BVI Event Driven Strategy % Return (Gross)
Tudor
Mar 20 12.35% 0.90% 0.45%
Feb 18 3.69% 2.44% 1.90%
16 Mar 20 11.98% 0.34%
NOTES TO PERFORMANCE
This performance section has been prepared solely to assist interested parties in making their own evaluation of Tudor Riverbend Crossing Partners and does not purport to be complete or to contain all of the information that a prospective investor may consider material, or desirable, in making a decision to become an investor The information and data contained herein are not a substitute for the recipient’s independent evaluation and analysis The information presented herein, including the assumptions and adjustments described below involves estimates, assumptions, facts and circumstances that are believed to be accurate and appropriate as of the date indicated in this presentation any of which may change without notice
IMPORTANT DATES
On April 20, 2015, Emil Dabora commenced trading an event driven strategy, the “Tudor BVI Event Driven Strategy”, within the Tudor BVI Strategy The Tudor BVI Strategy consists of The Tudor BVI Global Portfolio L P (“Tudor BVI”) and Tudor Global Fund L P (“TGF”), a Tudor Group proprietary vehicle which trades and invests on a parallel, “side by side” and levered basis (utilizing a lower funding level) with Tudor BVI
TRCP commenced trading on June 1, 2016
USE OF INDICES GENERALLY
The indices referenced herein are widely recognized benchmarks used for gauging the performance of various segments of the securities, commodities and alternative investment markets, and they are referenced herein solely for informational purposes The indices and the nature and composition of their reference assets generally differ substantially from TRCP L P and Tudor Riverbend Crossing Partners and their underlying investment portfolio and trading activities Consequently, the performance of an index is unlikely to be an appropriate benchmark to compare against the performance of Tudor Riverbend Crossing Partners, and no inference should be drawn that any index or its performance is similar to the TRCP L P and Tudor Riverbend Crossing Partners or their performance In particular, certain indices that reflect the performance of trading programs or investment funds may reference trading programs or investment funds that are subject to investment programs, risks, terms, fees and expenses that differ substantially from those to which the TRCP L P and Tudor Riverbend Crossing Partners are subject In addition, the performance of such indices may be skewed because they do not reflect performance data for trading programs or investment funds that no longer meet the criteria of the relevant index Data for the indices was obtained from eVestment as of the dates indicated
S&P 500® TOTAL RETURN INDEX
The S&P 500® Total Return Index reflects the aggregate equity performance of 500 large cap companies representing a broad range of industries in the US economy The equities comprising the index are selected based on various criteria relating to market capitalization, industry representation, liquidity, stability and other factors, and do not necessarily represent the 500 largest companies in the US economy The index returns reflect the reinvestment of the gross cash dividend amount of the stocks included in the index
COUNTRY DISCLAIMER
United States
The Interests have not been and will not be registered with the U S Securities and Exchange Commission under the Securities Act of 1933, as amended (the “Securities Act”), or any state or other securities laws The Interests will be offered and sold for investment only to qualifying investors pursuant to the exemption from the registration requirements of the Securities Act provided by section 4(a)(2) thereof and Regulation D or Regulation S promulgated thereunder and in compliance with the applicable securities laws of the states where the offering will be made
There is no market, and there will be no market, for the Interests, and there is no obligation on the part of any person to register the Interests under the Securities Act The Interests may not be transferred or resold except as permitted under the Securities Act and the applicable state securities laws, pursuant to registration or an exemption therefrom The transferability of the Interests is and will continue to be further restricted by the terms of the Tudor Fund’s governing documents Investors should be aware that they may be required to bear the financial risks of an investment in the Tudor Fund for an indefinite period of time In making an investment decision, investors must rely on their own examination of the issuer and the terms of the offering, including the merits and risks involved The Interests have not been recommended by any federal or state securities commission or regulatory authority Furthermore, the foregoing authorities have not confirmed the accuracy or determined the adequacy of this document Any representation to the contrary is a criminal offense
The Tudor Fund will not be registered as an investment company under the U S Investment Company Act of 1940, as amended (the “Investment Company Act”) The Interests will be offered and sold for investment only to investors that are “qualified purchasers” within the meaning of section 2(a)(51) of the Investment Company Act, or who are otherwise eligible to participate in the Tudor Fund
Country Disclaimer Date: August 2021
STRICTLY CONFIDENTIAL. NOT FOR DISTRIBUTION. |TUDOR INVESTMENT CORPORATION
THIS DOCUMENT CONTAINS ACTUAL AND PRO FORMA PAST PERFORMANCE DATA. PAST PERFORMANCE IS NOT A RELIABLE INDICATOR OF FUTURE PERFORMANCE.
APPENDIX
PAST PERFORMANCE IS NOT NECESSARILY INDICATIVE OF FUTURE RESULTS
November 2021
Firm Summary
Aether Investment Partners, LLC (“Aether”) is a specialist investment management firm formed in 2008 to focus on private investments in real assets Aether’s funds invest globally across natural resources, infrastructure, and opportunistic real assets As of September 30, 2021, Aether managed approximately $1.6 billion in committed capital across eight investment vehicles and employed fifteen professionals, including ten investment professionals and five non investment professionals.
Fiscal Year Organizational Update
In response to COVID 19, Aether employees continued to work remotely through the first half of 2021. In July of 2021, Aether’s team began a partial return to the office, in accordance with local guidelines. Selective business travel resumed at the same time
During the fiscal year, Lewis Aynesworth, Investment Analyst, departed the firm. Matthew Sherlock and Viraj Suri joined as Investment Analysts and will be responsible for supporting the firm’s investment activities. Amy Alcott joined Aether as Controller and will be responsible for supporting the firm’s accounting, tax, and financial operations. Ms. Alcott replaces Meagan Nokes, who departed the firm during the fiscal year Chris Anderson, Investor Relations Analyst, also departed the firm. Madeleine Stockton replaced Mr. Anderson as an Investor Relations Associate and is focused on supporting investor relations and fundraising.
Investment Strategy & Investment Objective
Aether’s funds seek to generate attractive absolute and relative returns, while also providing diversification relative to other asset classes, a hedge against inflation, and a store of value in times of crisis. The firm focuses on private investments primarily within natural resources and infrastructure, with opportunistic consideration of other related sectors (excluding commercial and residential real estate) Aether’s strategy considers investments in any geography and is implemented through a variety of investment types, including: seed investments, co investments, primaries, secondaries, and direct investments.
Aether targets a 12 15% return over the life of the fund, net of all fees and expenses, in a flat commodity price environment. In addition to this absolute return target, Aether’s funds should exhibit a positive correlation with commodity prices. Generally, Aether believes the Bloomberg Commodity Index Total Return (“BCOMTR”) (formerly known as the Dow Jones UBS Commodity Index) represents the most appropriate liquid commodities index, as the BCOMTR is based on a broad basket of commodities similar to Aether’s funds.
Fund Summaries
ARA IV and ARA V are private real assets funds focused on private investments in natural resources and infrastructure The funds’ primary sectors include energy, mining, and agriculture, with opportunistic consideration of other related sectors such as power, water, etc.
ARA IV ARA V
Vintage Year: 2016 2018
Commitments: $257,171,250 $267,720,700
Commitment Period: 3 years 3 years
Anticipated Fund Term: 12 years 12 years
Aether Investment Partners, LLC

Confidential
Salvation Army Cash Flow Summary
As of September 30, 20211
ARA IV ARA V
Inception Date: July 31, 2016 January 1, 2019
Commitment amount: $35,000,000 $25,000,000
Fiscal year cash contributions: $3,267,927 $3,803,797
Fiscal year cash distributions: $82,180 $174,854
Since inception cash contributions: $32,039,525 $11,232,087
Since inception cash distributions: $2,493,038 $630,617
Fund Performance Metrics as of June 30, 20211
Distributions / Paid in Capital (net) Total Value / Paid in Capital (net) Internal Rate of Return (net)2 BCOMTR PME3
ARA IV 0.08x 1.25x 8.3% 5.8% ARA V 0.06x 1.33x 25.4% 14.9%
PAST PERFORMANCE IS NOT NECESSARILY INDICATIVE OF FUTURE RESULTS AND INVESTMENTS MAY LOSE VALUE.
See Disclosures and Definitions & Calculations sections for additional important information.
1As multi manager funds, Aether’s funds are subject to a quarterly reporting lag. Aether’s third quarter fund reporting through September 30 typically becomes available in mid December.
2IRRs are calculated from the due date of the initial capital call for the respective Fund through the date applicable herein (additional information for each Fund, including First Close Date, can be found in the Definitions & Calculations section). Net IRRs reflect the deduction of fees and expenses attributable to underlying investments. Net IRR reflects the deduction of fees, expenses and carried interest attributable to the respective Fund. Not all Funds are subject to the same fees and carried interest, which will affect net returns. Carried interest and/or management fees may be discounted in certain cases, which in most cases will result in higher net IRRs compared to returns for only full fee paying investors. Net IRR representative of full fee paying investors is available upon request. The respective Fund may enter into a credit facility to bridge capital calls. The use of such credit facilities has the effect of shortening the time that an investor’s capital is deployed. As a result, such facilities can potentially cause the general partner to be paid carried interest sooner than it would have been paid had no such credit facility been used. The fees and expenses associated with the use of such credit facility are borne by the respective Fund.
3Modified public market equivalent performance for the Bloomberg Commodity Index Total Return (“BCOMTR”) is provided for informational purposes only. The comparison does not mean that there will necessarily be any correlation between the returns of the respectiveFundandthe respectiveindex. Theuseof either index as abenchmark fortheperformanceof theFunds is subjecttosignificant limitations. The PME is intended to illustrate what returns would have been achieved had the dollars invested in the applicable Fund instead been invested in the respective index. Because an actual investment cannot be made directly in the index, the PME is subject to substantial limitations with respect to its usefulness as an accurate measure of comparison. Given the hypothetical nature of the PME and the difficulty of accounting for all variables that may impact the calculation of meaningful comparison data, the use of the PME may result in misleading comparisons. Prospective investors should consider such limitations when comparing the applicable Fund performance metrics to the PME performance. See Disclosures and Definitions & Calculations sections for additional important information regarding the BCOMTR and PME. The PME is a private to public comparison that seeks to replicate the private investment performance of the applicable Fund under public market conditions. In general, a public market equivalent comparison is designed to compare dollar weighted returns of private investments to the performance of public investments or indices, in order to quantify their relative performance. The PME is intended to illustrate what returns would have been achieved had the dollars invested in the applicable Fund instead been invested in the applicable index (i.e., BCOMTR). In calculating PME, each contribution to the applicable Fund is matched by an equal hypothetical contribution to the index on the respective date. Hypothetical shares of the index are purchased and sold according to the applicable Fund’s cash flow schedule. With regard to distributions, the weight of each applicable Fund distribution is computed as a percentage of the Fund’s net asset value and the corresponding weight is then removed from the index net asset value. The PME attempts to evaluate what return would have been earned had the dollars been deployed in the index instead of in the applicable Fund. Because an actual investment cannot be made directly in the index, the PME’s use of a hypothetical investment in the index is for illustrative purposes only and is subject to substantial limitations with respect its usefulness as an accurate measure of comparison. Given the hypothetical nature of the PME and the difficulty of accounting for all variables that may impact thecalculation of meaningful comparison data, the use of the PME may result in misleading comparisons. Accordingly, prospective investors should consider such limitations when comparing the applicable Fund performance metrics to the PME performance. See Disclosures and Definitions & Calculations sections for additional important information regarding the BCOMTR
Aether Investment Partners,
Confidential
LLC
ARA IV Portfolio as of September 30, 2021
Fund Overview:
First Close Date: January 1, 2016 % Committed to Underlying Investments: 98.0%
Final Close Date December 31, 2016 % of Aggregate Commitments Called: 91.5%


Current Portfolio:
Investment Reference Investment Type Initial Investment Commitment Percent Funded Primary Sector Primary Geography

Scout III Fund 3/31/2016 30,000,000 100.0% Energy North America Pacific Ag II Fund 4/29/2016 25,000,000 70.0% Agriculture North America
AMED III Fund 12/2/2016 25,000,000 90.0% Mining Africa
CCRP I Company 1/10/2017 35,000,000 97.7% Energy North America
Bayswater III Fund 1/20/2017 35,000,000 100.0% Energy North America Leiden II Fund 3/17/2017 21,000,000 72.3% Agriculture South America
Ibaera I Fund 8/31/2017 30,000,000 87.9% Mining Global Rockland III Fund 4/17/2018 21,000,000 80.5% Energy North America
CEMF III Fund 4/27/2018 30,000,000 99.2% Mining Global
Portfolio Characteristics by Commitment:
See Disclosures and Definitions & Calculations sections for additional important information.
Confidential Aether Investment Partners, LLC
ARA V Portfolio as of September 30, 2021
Fund Overview:
First Close Date: July 20, 2018 % Committed to Underlying Investments: 94.7%
Final Close Date July 19, 2019 % of Aggregate Commitments Called: 44.9%
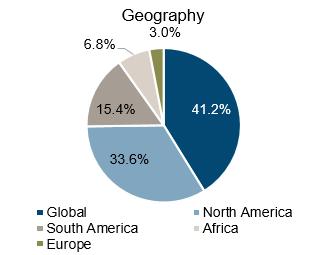

Current Portfolio:
Investment Reference Investment Type Initial Investment Commitment Percent Funded Primary Sector Primary Geography
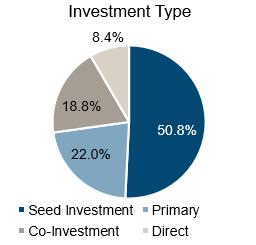
NewAge Co Investment 8/13/2018 9,100,000 99.8% Energy Africa Rockies Resources Direct 10/9/2018 21,000,000 38.7% Energy North America
Bayswater IV Primary 2/25/2019 30,000,000 81.3% Energy North America
Inka Gold Co Investment 5/24/2019 15,850,376 100.0% Agriculture South America
Whitechapel Co Investment 11/5/2019 7,963,801 100.0% Mining Africa Euston Co Investment 12/2/2019 7,500,000 66.7% Mining Europe
Ore I Seed Investment 2/3/2020 24,000,000 5.9% Mining South America
Farmers Gate Seed Investment 5/6/2020 26,500,000 26.8% Agriculture Global
Tembo III Primary 7/1/2020 25,000,000 18.4% Mining Global Arizona Sonoran Co Investment 7/1/2020 10,069,132 96.7% Mining North America
Ibaera II Seed Investment 4/22/2021 26,500,000 17.9% Mining Global GDEV I Seed Investment 6/4/2021 25,000,000 84.6% Energy North America Tanjun I Seed Investment 6/30/2021 25,000,000 1.6% Mining Global
Portfolio Characteristics by Commitment:
Confidential Aether Investment Partners, LLC
Disclosures
PAST PERFORMANCE IS NOT NECESSARILY INDICATIVE OF FUTURE RESULTS AND INVESTMENTS MAY LOSE VALUE. The information contained herein has been prepared solely for informational purposes and is not an offer to sell or a solicitation of an offer to purchase any interests in the referenced Aether managed investment funds (the “Fund”). Views and opinions expressed herein are as of the date noted on page 1 and may change based on market and other conditions. The following is confidential, is intended for the person to whom it has been delivered and may not be reproduced or distributed. Aether Investment Partners, LLC (“Aether”) does not guarantee timeliness, sequence, accuracy or completeness of information included herein. Any offer with respect to interests in the Fund will be made only pursuant to an offering memorandum and the documents relating thereto describing such securities (the “Offering Documents”) and to which prospective investors are referred. The Offering Documents contain additional information about the investment objectives, terms and conditions of an investment in the Fund and also contain important risk disclosures and tax information that must be considered prior to any investment decision regarding the Fund. These materials are subject to and qualified in their entirety by reference to the Offering Documents. The returns of the Fund and underlying investments have been and will be affected by various market, economic and other changes including, without limitation, changes in commodity, equity, credit, interest rate and currency markets. Certain market and economic events having a positive impact on performance may not repeat themselves. Further, underlying investments may be leveraged, which may increase the risk of loss. Returns will also be affected by the investment decisions of the general partner of the Fund and the general partners, sponsors and/or management teams of underlying investments. The returns of the Fund and underlying investments contained in the Fund Performance Metrics section for the first three quarters of the calendar year are unaudited and are subject to change. Returns include reinvestment of certain investment proceeds. If such proceeds were not reinvested, the returns could be materially different. No representation, warranty or undertaking, express or implied, is given as to the accuracy or completeness of the information provided by underlying investments and no liability is accepted by Aether for the accuracy of completeness of any such information. Any information disclosed herein or otherwise by the Fund, the general partner of the Fund, Aether, their respective affiliates and their respective directors, officers, employees, agents and advisers is provided on a no reliance basis. In making an investment decision, the recipients of such information must rely on their own examination of the Fund and the terms of the offering and their own advisors. You should not construe the contents of this presentation as legal, tax, investment or other advice.
There can be no assurance that the returns generated by the Fund will equal or exceed those of existing Funds. The nature of, and risks associated with, the Fund and the investments to be made by it may differ substantially from the investment activities undertaken by predecessor funds. Each investment is subject to its own unique risks and the financial performance of investments will vary from investment to investment and such variances may be material.
With respect to unrealized values provided herein, while the estimated unrealized value of Fund investments are based on assumptions that Aether believes are reasonable under the circumstances, and information provided by general partners, sponsors and/or management teams of underlying investments that Aether believes is reliable, the actual realized returns on unrealized investments will depend on, among other factors, future operating results, the value of the assets and market conditions at the time of disposition, any related transaction costs and the timing and manner of sale, all of which may differ from the assumptions on which the valuations used in the prior performance data contained herein are based. No representation or warranty is made as to the reasonableness of the assumptions made with respect to determining estimated unrealized values or that all assumptions used in determining estimated unrealized values have been stated or fully considered. Actual events and circumstances are difficult or impossible to determine. Accordingly, the realized returns on these unrealized investments and actual returns of the Fund may differ materially and negatively from the returns indicated herein. The estimated unrealized values of the Fund and its underlying investments do not reflect the expected future payment of management fees, expenses and unaccrued carried interest which will reduce returns to investors and which are expected to be substantial. Such estimated unrealized values are provided for illustrative purposes only and are not intended to serve as, and must not be relied upon by any prospective investor as, a guaranty, an assurance, a prediction of a definitive statement of fact or a probability. As a sophisticated investor, each prospective investor accepts and agrees to use such information only for the purpose of discussing with Aether such prospective investor’s preliminary interest in investing in a Fund.
Hypothetical performance results have many inherent limitations and no representation is being made that any investment will or is likely to achieve profits or losses similar to those shown. In fact, there are frequently sharp differences between hypothetical performance results and the actual results subsequently achieved by any particular trading or investment program. The use of hypothetical performance is subject to inherent limitations derived from the reliance on historical data and the benefit of hindsight. The analysis includes certain assumptions where actual performance could be different from the hypothetical performance presented.
One of the limitations of hypothetical performance results is that they are generally prepared with the benefit of hindsight. In addition, hypothetical scenarios do not involve financial risk, and no hypothetical record can completely account for the impact of actual financial risk. There are numerous other factors related to the markets in general or to the implementation of any specific investment which cannot be fully accounted for in the preparation of hypothetical performance results and all of which can adversely affect actual results
Certain information contained herein constitutes “forward looking statements” which can be identified by the use of forward looking terminology such as “may,” “will,” “should,”“expect,”“anticipate,” “target,” “intend,” “continue,” “seek,” or “believe,” or the negativesthereof or othervariations thereon or comparable terminology. Due to various risks and uncertainties, actual events or results or the actual performance of the Fund may differ materially from those reflected or contemplated in such forward looking statements. The information contained herein is proprietary and confidential. If this information is provided to an entity or agency that has, or is subject to, open records or open meeting laws or similar or related laws, rules, regulations or policies that do or may permit disclosure of any portion of this information to any person or entity other than the entity to which it was provided by Aether, the general partner of the Fund, their employees or their representatives (collectively, “Sunshine Laws”), Aether and the general partner of the Fund hereby assert any and all available exemption, exception, procedures, rights to prior consultation or other protection from disclosure which may be available to them under the applicable Sunshine Laws.
This presentation and information contained in this presentation is subject to the confidentiality provisions contained in the limited partnership agreement of the applicable Fund.
Definitions & Calculations
ARA IV: Aether Real Assets IV, L.P. (“ARA IV”) held its first close January 1, 2016 and is a 2016 vintage year fund with $257,171,250 in aggregate commitments.
Confidential
LLC
Aether Investment Partners,
ARA V: Aether Real Assets V, L.P. (“ARA V”) is a commingled fund which held its first close on July 20, 2018 and is a 2018 vintage year fund with $267,720,700 in aggregate commitments.
Commitments: Aggregate subscriptions to the Fund, including non Related Limited Partner, Related Limited Partner and General Partner subscriptions.
Paid in Capital: The cumulative amount contributed or deemed to have been contributed to the Fund.
Distributions: The cumulative amount distributed or deemed to have been distributed from the Fund.
Total Value: The sum of Distributions and the Fund’s capital account balance as reported in the Fund’s financial statements. Interests in underlying investments are carried at fair value as reasonably determined by Aether in accordance with U.S. generally accepted accounting principles. In calculating the fair values of the Fund’s underlying investments, Aether generally relies on information reported by the general partners, sponsors and/or management teams of underlying investments. Aether expects that the capital account balances reported by the general partners, sponsors and/or management teams of underlying investments will normally reflect fair value. However, the capital account balances reported by the general partners, sponsors and/or management teams of underlying investments may be adjusted in the event Aether determines in itsreasonable discretion thatsuch values are not representative of fair value. The generalpartners,sponsors and/ormanagement teams of underlying investments do not prepare, review or approve such adjustments or Aether’s calculations of performance metrics.
Distributions / Paid in Capital (DPI): Distributions / Paid in Capital (net) equals non Related Limited Partner Distributions expressed as a multiple of non Related Limited Partner Paid in Capital. If provided, Distributions / Paid in Capital (gross) equals aggregate distributions received or deemed to have been received by the Fund from underlying investments since inception expressed as a multiple of aggregate contributions made or deemed to have been made by the Fund to underlying investments since inception. This multiple is intended to display cash on cash returns or realized results. In Aether’s opinion, Distributions / Paid in Capital multiples in early years are not relevant performance metrics due to a mismatch between the timing of expenses and investments. Accordingly, Aether reports neither the gross Distributions / Paid in Capital multiple nor the net Distributions / Paid in Capital multiple until the Final Close Date and the earlier of: (i) total Fund Paid in Capital equals or exceeds 33.3% of total Fund Commitments, or (ii) three years from the First Close Date. Until this time, Distributions / Paid in Capital multiples are reported as “N/A”. Such early year multiples are available upon request.
Total Value / Paid in Capital (TVPI): Total Value / Paid in Capital (net) equals non Related Limited Partner Total Value expressed as a multiple of non Related Limited Partner Paid in Capital. If provided, Total Value / Paid in Capital (gross) equals aggregate distributions received or deemed to have been received by the Fund from underlying investments since inception plus the aggregate fair value of the Fund’s underlying vehicle interests expressed as amultiple of aggregate contributions made or deemed to have beenmade by the Fund to underlying investments since inception. This multiple is intended to display total value relative to each dollar contributed. In Aether’s opinion, Total Value / Paid in Capital multiples in early years are not relevant performance metrics due to a mismatch between the timing of expenses and investments. Accordingly, Aether reports neither the gross Total Value / Paid in Capital multiple nor the net Total Value / Paid in Capital multiple until the Final Close Date and the earlier of: (i) total Fund Paid in Capital equals or exceeds 33.3% of total Fund Commitments, or (ii) three years from the First Close Date. Until this time, Total Value / Paid in Capital multiples are reported as “N/A”. Such early year multiples are available upon request.
Internal Rate of Return (IRR): The Internal Rate of Return (net) is calculated including cash flows and capital account balances for all non Related Limited Partners (excluding Related Limited Partners and the General Partner). The net IRR is calculated after the deduction of all management fees, carried interest and partnership expenses incurred directly by the Fund and all similar fees and expenses incurred directly by underlying investments. If provided, the gross IRR is calculated prior to the deduction of all management fees, carried interest and partnership expenses incurred directly by the Fund but after the payment of all similar fees and expenses incurred directly by underlying investments. Carried interest and/or management fees may be discounted or waived in certain cases, which in most cases will result in higher net IRRs compared to returns for only full fee paying investors. Net IRR representative of full fee paying investors is available upon request. The respective Fund may enter into a credit facility to bridge capital calls. The use of such credit facilities has the effect of shortening the time that an investor’s capital is deployed. As a result, such facilities can potentially cause the general partner to be paid carried interest sooner than it would have been paid had no such credit facility been used.
The fees and expenses associated with the use of such credit facility are borne by the respective Fund. Net IRRs do not account for investor taxes and investor specific expenses and do not represent the returns to any particular Fund investor. In Aether’s opinion, IRRs in early years are not relevant performance metrics due to a mismatch between the timing of expenses and investments. Accordingly, Aether reports neither the gross IRR nor the net IRR until the Final Close Date and the earlier of: (i) total Fund Paid in Capital equals or exceeds 33.3% of total Fund Commitments, or (ii) three years from the First Close Date. Until this time, IRRs are reported as “N/A”. Such early year IRRs are available upon request.
BCOMTR: The Bloomberg Commodity Index Total Return (“BCOMTR”, formerly known as the Dow Jones UBS Commodity Index). Generally, Aether believes the BCOMTR represents the most appropriate commodity index for use because it is based on a broad basket of liquid commodities. The weighted components of the BCOMTR are Energy, Grains, Industrial Metals, Precious Metals, Softs and Livestock. The target weights are determined in accordance with the rules described in the Bloomberg Commodity Index Methodology. The index rules generally account for liquidity and production data in a 2:1 ratio and are subject to the following requirements for diversification and minimum weightings: (i) no single commodity may constitute over 15% of the BCOMTR, (ii) no single commodity, together with its derivatives (e.g., WTI Crude Oil and Brent Crude Oil, together with ULS diesel and unleaded gas) may constitute more than 25% of the BCOMTR, (iii) no group (e.g., Energy, Precious Metals) may constitute more than 33% of the BCOMTR and (iv) no single commodity (e.g., natural gas or silver) may constitute less than 2% of the index, as liquidity allows. Please see “Disclosures” at the front of this presentation for important information regarding the inherent limitations of the BCOMTR as a meaningful measure of comparison to Fund performance.
First Close Date: The date on which the General Partner first accepted subscriptions from Fund investors.
Final Close Date: The date after which the General Partner accepts no new or additional subscriptions for the Fund, excluding any transfers of interests. This date is reported as “Not Yet Determined” until the final closing has occurred.
Confidential Aether
LLC
Investment Partners,
% Committed to Underlying Investments: Aggregate commitments made by the Fund to underlying investments plus amounts reserved by the Fund for potential follow on investments, expressed as a percentage of Fund Commitments (as defined in Fund Performance Metrics). Until the Fund has conducted its final close, the target Fund size is used in lieu of the actual Fund size. Prior to the date of the final underlying commitment, commitments made to underlying investments denominated in foreign currency are translated to U.S. Dollars at the spot rate at the end of the quarter. Following the final underlying commitment, commitments made to underlying investments denominated in foreign currency are translated to U.S.Dollars at the spot rate on the date Aether executes subscription documents for the final underlying commitment.
% of Aggregate Commitments Called: Paid in Capital expressed as a percentage of Fund Commitments (as defined in Fund Performance Metrics). The inclusion of recalled prior distributions in Paid in Capital could cause the percentage to exceed 100%. Until the Fund has conducted its final close, the target Fund size is used in lieu of the actual Fund size.
Commitment: The commitment made by the Fund to the investment. Amounts are measured in the currency in which commitments are denominated. The Commitment includes the amounts reserved by the Fund for potential follow on investments.
Percent Funded: The aggregate amount contributed to the investment since inception, excluding any make up interest payments, expressed as a percentage of the aggregate amount contributed to the investment plus amounts reserved by the Fund for contractually obligated follow on investments. Both contributions and amounts reserved by the Fund for contractually obligated follow on investments are measured in the currency in which investments are denominated. The inclusion of recalled prior distributions in the aggregate amount contributed to the investment since inception could cause the percentage to exceed 100%.
Confidential Aether Investment Partners, LLC
Please refer to the Bain Capital Real Estate Fund II pitchbook for disclaimers, endnotes, and other important information.

• • • • • • • • • • • • •


│
• • • • •
• • • 1

THIS
NEW YORK | MIAMI | SAN FRANCISCO The Salvation Army November 2021
PRESENTATION IS TRADE SECRET AND STRICTLY CONFIDENTIAL
Overview of DRA
DRA’s track record includes 35 years of value add investing through our Growth & Income Funds with more than $34.5 billion of acquisitions since inception; ▪
Based in New York City with offices in San Francisco and Miami ▪
Stable team of 78 associates, including 14 partners averaging 22 year tenure at DRA ▪
$11.4 billion in gross assets under management as of 6/30/21
Focused on value-added investments through DRA Growth & Income Funds and potential co-investment vehicles
▪
The Salvation Army / DRA relationship began through a $20 million commitment to DRA Growth & Income Fund X in 2019 ▪
Fund investors include public and corporate pension funds, university endowments, foundations, insurance companies and sovereign wealth funds ▪
Diversified portfolios of office, retail, multi family and industrial properties across
Notable News & Events at DRA
▪
Final closing of Fund X in February 2020 at the hard cap of $1.9 billion of commitments with over 92% from existing DRA relationships ▪
DRA’s NYC office relocated to 575 Fifth Avenue in November of 2020 ▪
Multi year winner of Best Place to Work by Pension & Investments; again in 2020 ▪
DRAW (DRA Women) in its third year / Established CUNY Internship Program in 2019 ▪
NYC office remained open through pandemic with 100% of employees back in the office as of November 2021
35 years of investing experience
78 associates | 14 partners
$34.5 billion of acquisitions $11.4 billion in AUM


Strategic
capital markets
and trusted acquisition
performance over multiple cycles
property
asset management
DRA
Advantages Wide reach across the U.S. in all major product types Extensive
expertise Disciplined
approach Consistent
Active
level
focus
Organizational stability
DRA Properties


Sold Since Inception
structure.
–
< $70 million $70 $180 million $180 $300 million > $300 million * As of 6/30/2021 net return estimated using Fund X fee/promote
821 fund assets sold (plus 462 cars) $28.5 billion gross sales proceeds 15.9% average gross IRR (~ 12.8% net)*
▪ Always protect capital
Acquire income producing assets, capitalizing on strategic or financial seller motivation
Focus on cash flow for current return and as a downside buffer
More than 60% of returns have been generated from cash flow
Buy below replacement cost
Build in downside protection in underwriting
Diversify portfolios
Joint ventures with public and private operators to enhance deal flow
Over 80% of DRA’s acquisitions have been JVs
Drive value creation at asset level
Asset & Portfolio Management Group of 42 associates and 5 partners execute the investment’s value add plan
Operators at heart with a hands on approach
Align debt with investment strategy and continually seek to reduce financing costs
Adapt investment strategies to the current market
Opportunistic sales to unlock value (4 7 year holding period)
Recognize impact of changing economic and real estate market conditions
Respond to changing capital market flows
▪
▪
23% Retail 19% Multifamily Market Value by Property Type 29% Office 15% NNN Retail 14% Industrial Market Value by Region 38% South 19% West 21% Midwest Diversification of DRA’s acquisitions since inception through 6/30/21; based on purchase price 22% East
DRA Investment Philosophy
▪
▪
▪
▪
▪
▪
▪
▪
▪
▪
▪
▪
▪
▪
▪
Final Fund closing was held on February 28, 2020, at the hard cap of $1.9 billion, first capital call was in March 2020
▪ 92% of commitments from existing DRA relationships ▪
The Fund’s acquisition period ends on February 28, 2023, and the Fund’s term expires December 31, 2029 ▪ The Salvation Army committed $20 million in December 2019 ▪
The Fund’s acquisition period ends on February 28, 2023, and the Fund’s term expires December 31, 2029 ▪
As of June 30, 2021, the Fund owns 108 properties with a Gross Market Value of $2.1 billion (Gross Cost of $2.0 billion) including joint venture interests ▪ Capital Calls to date total $663.5 million and $39.9 of capital has been returned; $150 million capital call projected during November 2020 ▪
Acquisitions to date require 46% of Fund capital; pipeline of nine properties for $642.6 million require 13% of Fund capital ▪
The Fund’s investment objective is a 12 15% net IRR target with 65% portfolio leverage *MTM
1,296.6 Fund Level Debt 288.0 288.0 Accrued Carried Interest n/a FUND EQUITY * $472.5 $492.6
Fund X – Overview
Geographic Diversification Property Type Diversification * Based on equity required in closed and pipeline acquisitions as of 11/1/21 8% East North Central 11% West North Central 7% Northeast 17% Southwest 35% Southeast 8% Pacific 6% Mideast 8% Mountain 31% 15 Multifamily properties 6,234 units 36% 7 Industrial acquitisitions 19.5 million sq. ft. 32% 11 Office Properties 4.5 million sq. ft. <2% 3 Retail Properties 726,000 sq. ft. * Based on equity required in closed and pipeline acquisitions as of 11/1/21
of debt increases equity market value $6.6 million Fund Share Capitalization 6/30/2020 Cost ($ millions) Market Value ($ millions) Property $2,057.6 $2,077.2 Property Level Debt 1,297.1

The Forestland Group LLC The Salvation Army Southern Territory Annual Manager Meeting November 2021
Office Box 9162 • Chapel Hill, NC • Phone: (919) 929-2497 • Fax:
929-8265 Website: www.forestlandgroup.com
Post
(919)
The Forestland Group, LLC History
•Timberlandinvestmentmanagementorganizationformedin1995.
•Focusonnaturallyregeneratinghardwoodandpineforests.Controlsthe largestportfolioofUShardwoods–Top5largestprivatelandownerinUS basedonacreage.
•StilltheonlyTIMOdedicatedtohardwoodtimberland.
•FSCCertifiedResourceManager—firstTIMOtocertifyitsentire portfoliowiththisformofgreencertification.Thisindependentthird-party certificationcontinuestoensureallstakeholdersthatTFGismanagingits forestlandinaccordancewithrigorousenvironmental,social,and economicprinciples.
•TenPooledFundsandoneSeparateAccountclosedtodatewith$2.4 billionincapitalcommittedfrom125institutionsandfamilyoffices.
•30employees.
•Approximately4,460,455acreshavebeenacquiredand2,496,831acres soldacrossallpooledFundsasof6/30/21.
•ThreeofthetenPooledFundshavebeenliquidated.
•Currently,1,936,624acresremainacrossthepooledFunds.Havealso soldmorethan137,295acresofsurfaceonATCOproperties,buthave retainedlong-termcuttingrights.
•CompositeIRRsasof06/30/21–allTFGinvestmentvehicles:5.09% (GrossofFees);4.13%(NetofFeesandAllExpenses).
•Benchmarkasof06/30/21:
–NCREIF-TimberlandReflectingAllocationsofQuarterlyRegional ReportedValues(Northeast/South)ofTFGFunds:4.09%(Grossof FeesandAdministrativeExpenses).
TFG Investment Strategy
•Overweightnaturalhardwoods.
•Averageannualharvestwillbeless thanaverageannualbiologicalgrowth.
•Diversifyportfoliosbylocation,foresttype&speciesmix.
•Overweighttimberstandscapableofmovingintohigher-valuedsawtimber products(in-growth).
•Emphasizeproblem-solvingroleduringacquisitionsinordertoaddvalueto seller—andreduceprice.
•Addvaluethroughactivemanagement,timbermarketingandrealizationof non-timberrevenues.
•Monetizeecosystemservicesviasaleofworking-forestconservationeasements andforest-carbonoffsets.
•Sellpropertiesthroughaproactiveandopportunisticdispositionsprogram.
Financial Assessment Process
•Screenoutproperties-focusonforestproductivityandtimbermarket characteristics.
•Inventory-specialfocusontree-sizedistributionandgrade.
•Growthandgradeprojections.
•Developtentativeharvestschedule.
•Estimatevolumeofresidualtimber.
•Assesstimberandlandmarkets.
•Assessecosystemservices’attributes.
•Establishfinancialassumptions.
•Prepareproformacashflowstatements.
•EstimateIRR,DCFvalue;sensitivityanalysis.
•Attributionanalysis-sourcesofreturn.
The Salvation Army Southern Territory Investment History
Through June 30, 2020
Committed Capital
Fund V Side II Fund VI Fund VII
Committed Capital$6,000,000$3,318,809 $15,000,000$10,000,000 Funded Capital$6,000,000$3,318,809$15,000,000$10,000,000
Unfunded Capital$0$0$0$0
Capital Contributions
Year Fund V Side II Fund VI Fund VII
2004$300,000$0$0$0 2005$2,115,385$0$0$0 2006$3,276,923$1,180,021$0$0 2007$307,692$2,138,788$5,577,273$0 2008$0$0$5,038,636$0 2009$0$0$3,750,000$0 2010$0$0$218,182$2,523,552 2011$0$0$415,909$1,614,355 2012$0$0$0$5,364,996 2013$0$0$0$497,097
Total$6,000,000$3,318,809$15,000,000$10,000,000
Distributions
Year Fund V Side II Fund VI Fund VII
2007$374,677$0$0$0 2008$204,092$0$0$0 2009$76,154$0$0$0
2010$753,923$625,832$0$0 2011$152,308$0$0$0 2012$30,462$0$243,000$0
2013$499,569$324,506$409,091$0 2014$213,231$46,358$136,364$0 2015$685,384$139,074$0$0 2016$68,538$301,317$0$783,641
2017$45,692$324,506$1,499,999$659,631 2018$557,446$231,790$1,221,818$0 2019$865,108$0$109,091$87,950 2020- 370,863 - 2,119,612 2021152,307 625,832 903,841 252,858
Total$4,678,891$2,990,078$4,523,204$3,903,692
Heartwood Forestland Fund V, LP
Acquisition
AcresCost BasisReported Value% of Portfolio PropertyDateLocation6/30/20216/30/20216/30/20216/30/2021
ATCO *Mar 06MS, AR, LA, TN126,545 $87,690,644$108,537,70860.26%
FordyceAug 05AR34,205 $25,491,812$63,984,99035.52%
Jelly RollMar 06AR2,658 $3,835,159$4,170,7282.32%
B&B LumberSept 05NY2,767 $3,363,776$3,420,6381.90%
* Acres reflect 60% pro-rata ownership of 210,909 acres, including fee acerage and cutting rights. Heartwood Forestland Fund V, LP Totals Fund II Fund III Fund IV Fund V SF I SF II
166,175 $120,381,391$180,114,064100.00%
IRR (Gross) – Since Inception
IRR (Gross) 8.44%7.15%5.64%3.52%1.68%2.89%5.20%3.60%3.98%5.09%
NCREIF – N/S Weighted *7.34%5.23%3.90%5.03%5.52%3.70%1.72%2.55%1.32%4.09%
* NCREIF- Timberland indices reflecting allocations of quarterly regional Reported Values (Northeast/South) (Gross Dollar-Weighted Return—not reflective of management fees or administrative expenses)
Operational Trends and Explanations
ExitTimelines:
ATCO:Weexpecttocontinuetofocusonrecreationaltransactions.2021hasbeenanotherslowyearwith COVID-19impactsandyearsofhistoricallyhighriverlevels,whichhavepreventedmanyofthehuntclubsfrom fulluseoftheirleasedlands.Weexpectthismarkettoimprovein2022.For thefinalexitoftheATCO Property,weexpecttosellapproximatelyone-halfoftheacreageinthecontinuedretailprocessmentioned above,andtheremainingone-halftoacombinationofregionalindustrial buyers(similartothelargedealin 2019)andconservation-orientedbuyers.Givencurrentmarketconditions,weexpectthisprocesstocontinue throughthefinalextensiontermofthefund-2024.TwoyearsisthequickesttheGeneralPartnercouldpossibly imagineexitingATCO.Weneedacontinuedtimbermarketrecoveryandmoreactiveretailsalestomakethis viable.ThistimelinecouldbeshortenediflargertransactionscloseonATCO.
Fordyce:$8.2millionconservationtransactionclosedinDecember2020. Expecttodisposeoftheremaining propertythroughaseriesofrecreationalretailandpotentialcarbon-credittransactionspriortotheendofthefinal termoftheFund-2024.
JellyRoll:PortionofthepropertyundercontractandclosedinQ32021withtheremainderbeingpushedinto 2022.Theclosedportionispartofalargerconservationtransactionthat includesaportionoftheFordyce acreagementionedabove.
B&BLumber:Propertyislistedwitharegionalbroker.Weexpecttosellthe remainingtractsin2022.
Fund VI Fund VII Fund VIII Composite
Heartwood Forestland Fund V Side Fund II, LP
Acquisition AcresCost BasisReported Value% of Portfolio PropertyDateLocation6/30/20216/30/20216/30/20216/30/2021
Caribbean TimberlandsFeb 07Costa Rica8,691 $16,587,520$15,009,77474.63%
Yalbac *Jan 08Belize87 $2,418,334$3,048,58615.16% GreenlakeMar 07AR1,315 $1,800,085$2,053,83610.21% 10,093 $20,805,939$20,112,196100.00%
* Acres
IRR (Gross) – Since Inception
IRR (Gross) 8.44%7.15%5.64%3.52%1.68%2.89%5.20%3.60%3.98%5.09%
NCREIF – N/S Weighted *7.34%5.23%3.90%5.03%5.52%3.70%1.72%2.55%1.32%4.09%
* NCREIF- Timberland indices reflecting allocations of quarterly regional Reported Values (Northeast/South) (Gross Dollar-Weighted Return—not reflective of management fees or administrative expenses)
Operational Trends and Explanations
• With a 1Q 2021 distribution of $13.5M from the Yalbacoutsale, 90% of invested capital has been returned.
• Timber pricing has been a drag on returns over the past several years.
• Exit Timelines:
Caribbean Timberlands
The property is listed with a broker in Costa Rica. We expect to sell the property in 2022, likely in several transactions.
Greenlake
A small portion of the property (about $500k) closed in Q3 2021 The remaining acreage is expected to be sold in 2022.
Yalbac
A disposition of the entire timberland property closed in Q4 2020. A conservation consortium led by The Nature Conservancy consummated the transaction. The remaining mill campus acreage is being marketed.
reflect 100.0% of the remaining Mill acerage owned by Yalbac Texas Corporation Heartwood Forestland Fund V Side Fund II, LP Totals Fund II Fund III Fund IV Fund V SF I SF II Fund VI Fund VII Fund VIII Composite
Heartwood Forestland Fund VI, LP
Acquisition AcresCost BasisReported Value% of Portfolio PropertyDateLocation6/30/20216/30/20216/30/20216/30/2021
Appalachian Timber HoldingsNov 07KY, VA, WV536,176 $123,053,978$364,267,67341.69%
Allegheny Forestland HoldingsOct 09NC, VA, WV116,780 $94,904,682$137,336,32915.72%
Badger TimberlandsDec 07WI81,459 $58,005,967$67,272,4617.70%
Louisiana Forestland HoldingsApr 08LA69,677 $37,922,311$65,181,1077.46%
CT LakesJan 09NH146,392 $27,263,485$51,300,0005.87%
Chateaugay Woodlands, LLCOct 09NY79,580 $24,289,710$33,722,2073.86%
Dragon RunJan 10VA13,313 $11,387,975$26,390,4443.02%
Great Lakes NMTC Forestlands Sept 10MI, WI34,370 $17,683,151$23,403,0102.68%
Chicago MillMar 08MS, AR12,220 $11,106,835$19,438,3772.22%
Ohio River ValleySept 11KY, WV18,451 $8,074,571$17,854,8322.04%
Lumber RiverSept 10NC, SC8,290 $8,033,472$14,446,6331.65%
BDCSep 08AR9,105 $9,537,033$12,963,0091.48%
Lock 8 TimberlandsDec 07AR6,992 $7,011,192$8,966,5581.03%
Oak Hill NMTC, LLCMar 15WV10,123 $8,747,537$8,924,2161.02%
WolverineDec 08MI12,857 $6,384,067$8,179,8520.94%
Black LakeOct 11LA4,348 $5,362,501$7,078,9820.81%
Derriseaux CreekDec 09AR1,383 $975,398$2,209,8330.25%
BaileyAug 11AR1,423 $1,312,779$1,810,1610.21%
CoulsonMay 10WV1,726 $994,009$1,681,9570.19%
DenisonDec 07AR1,070 $756,087$1,317,1650.15%
Heartwood Forestland Fund VI, LP Totals
IRR (Gross) – Since Inception
1,165,735 $462,806,740$873,744,806100.00%
Fund II Fund III Fund IV Fund V SF I SF II Fund VI Fund VII Fund VIII Composite
IRR (Gross) 8.44%7.15%5.64%3.52%1.68%2.89%5.20%3.60%3.98%5.09%
NCREIF – N/S Weighted *7.34%5.23%3.90%5.03%5.52%3.70%1.72%2.55%1.32%4.09%
* NCREIF- Timberland indices reflecting allocations of quarterly regional Reported Values (Northeast/South) (Gross Dollar-Weighted Return—not reflective of management fees or administrative expenses)
Operational Trends and Explanations
• HFFVIhasconsistentlyoutperformed itsregionalNCREIFbenchmark.Fund performancehasbeennegatively impactedbyweakRedOakmarketsthelastseveralyears.
• 2020and2021focusedoncarbonprojectdevelopmentandcreditsalesasthe institutionalmarketforcarbon offeringscontinuedtogrow.
• TheGeneralPartnerexpectstogenerateover$180MinrevenuefromcarboncreditsalesinHFFVIbetween 2020and2025.
• InQ32021,theGeneralPartnerrecommendedthesecondfundextension,whichwasapprovedbyaSuperMajorityLPvote.Theextensionwillprovidevaluabletimetofurtherdevelopcarbonprojectsthatcangenerate cashyieldandaddvalueatexit.TFGplanstosellthemajorityoftheremainingpropertiesduringthe2nd extension.
Heartwood Forestland Fund VII, LP
Acquisition
AcresCost BasisReported Value% of Portfolio PropertyDateLocation6/30/20216/30/20216/30/20216/30/2021
Hurricane CreekSep-21AR20,106 $23,796,639$38,465,64817.46%
BooneJan-21KY46,724 $18,563,992$37,174,77216.88% ChippewaSep-21WI33,881 $22,293,911$26,511,89712.03%
CumberlandNov-21KY21,596 $20,592,140$26,113,50411.85%
Wisconsin Northern HighlandsSep-21WI32,042 $22,199,756$24,622,67711.18%
Wabikon-Iron RiverDec-21MI, WI15,890 $17,350,805$17,671,4198.02%
Elk ForestDec-21KY16,776 $9,298,722$13,688,6896.21%
New River ValleyDec-21WV20,635 $15,332,919$13,632,9706.19%
ImperialNov-21WV15,102 $4,398,430$9,162,5734.16%
SheridanFeb-21AR3,793 $3,652,525$7,047,3983.20%
Wisconsin River ValleyDec-21WI3,525 $2,694,512$4,252,0891.93%
Muskingum RiverAug-21OH, WV1,379 $1,379,199$1,950,1980.89% 231,449 $161,553,550$220,293,834100.00%
IRR (Gross) – Since Inception
Fund II Fund III Fund IV Fund V SF I SF II Fund VI Fund VII Fund VIII Composite
IRR (Gross) 8.44%7.15%5.64%3.52%1.68%2.89%5.20%3.60%3.98%5.09% NCREIF – N/S Weighted *7.34%5.23%3.90%5.03%5.52%3.70%1.72%2.55%1.32%4.09%
* NCREIF- Timberland indices reflecting allocations of quarterly regional Reported Values (Northeast/South) (Gross Dollar-Weighted Return—not reflective of management fees or administrative expenses)
Operational Trends and Explanations
• HFF VII quarterly returns have outperformed the NCREIF regional benchmark.
• Timber pricing has been a drag on returns the last several years.
• If voluntary carbon markets improve as anticipated, the Fund’s carbon properties look to generate $7M-$15M in revenue over the next four years depending on market pricing.
• Exit Timelines:
• A sale of Laguna Secaand the adjacent Yalbac property occurred in Q4 2020. The Nature Conservancy led the conservation consortium transaction.
• Hurricane Creek–Regional retail-sized blocks.
• Chippewa–Fragmented ownership across Wisconsin–retail program with large block sales.
• MuskinghamRiver has substantial retail interest.
• New River Valley–Retail packages for local markets.
• Wisconsin Northern Highlands–Eased and carbon-encumbered property. Market to ESG investors.
• Elk and Boone–Voluntary carbon projects in development.
• Sheridan –Scattered tracts–recreational and retail area.
• Wisconsin River Valley–HBU and retail tracts.
• Cumberland–Recreation and local industry.
• Wabikon-Iron River–High quality, eased property. Value proposition forthcoming from a qualified broker.
• Imperial –Industrial Appalachian tract being considered for voluntary or compliance carbon markets.
Heartwood Forestland Fund VII, LP TotalsNovember 2021
www.hancocktimber.com
Hancock Timber Resource Group1 Firm Summary
Founded in 1985, independent subsidiary of Manulife Investment Management Company
As of June 30, 2021, HTRG global portfolio: USD10.8 billion / 5.4 million acres (2.2 million hectares)
Investments in U.S. South, North, and West; Australia, Brazil, Canada, Chile and New Zealand
71 investment professionals
Recent Acquisitions:
2020 USD428 million
YTD 2021 USD654 million
2020 Dispositions: USD457 million
HTRG Composite Before-Fee Performance as of December 31, 2020 1 Year 4.9% 3 Year 5.5% 5-Year 5.9% 10-Year 6.8% 20 Year 7.2% Since Inception (1985) 11.4%
1 Hancock Timber Resource Group (HTRG) is a division of Hancock Natural Resource Group (HNRG)
The Hancock Timberland Farmland Fund completed a fifth closing in July 2021; currently targeting the next close for December 2021
Changes in Staff: Christoph Schumacher, Global Head of Real Assets for Manulife Investment Management, was appointed President and Chief Executive Officer of HNRG in March 2021 following the planned retirement of Bill Peressini. Mr. Schumacher served previously as the Global Head of Real Estate at Credit Suisse.
Rebranding: Effective November 15, 2021 HNRG will adopt the new name of Manulife Investment Management Timberland and Agriculture (MIMTA). Although the HNRG brand is changing, the people, management of our portfolios and operations, the products and services we provide, and most importantly our values, remain the same.
Diversification As of June 30, 2021
Current investment regions Targeted investment regions
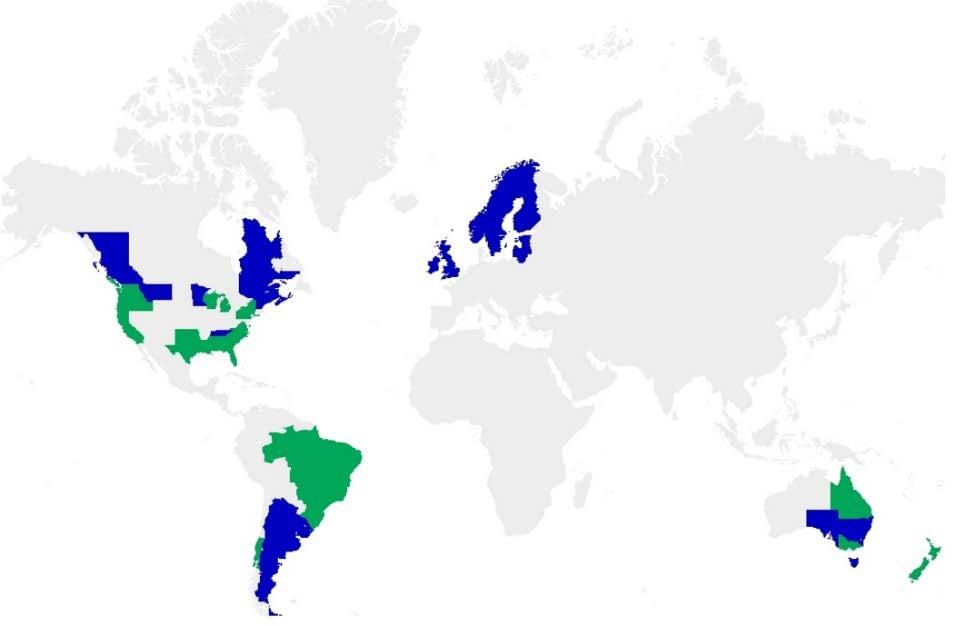
United States 54% New Zealand 23% Australia 19% Canada 0.9% South America 3% Geographic
Hancock Timber Resource Group Investment Strategy Firm Strategy Hancock Timberland VIII Objective Preserve capital base, realize profits from long term appreciation, and provide current income Performance Guidelines Maximize total return Portfolio Diversification Investments in no less than two domestic regions with up to 25% of market value outside the U.S. Consideration given to diversification by geography, tree species/product and maturity/merchantability Develop timberland investment portfolios consistent with client objectives and risk tolerance with respect to geography, species and markets. Globally diversify to reduce return volatility and increase investment opportunities Seek acquisition of large properties at attractive prices to add flexibility and create value Perform intensive forest management at low cost to enhance returns. Actively manage each property to maximize returns, including careful timing of timber sales and prudent investment in activities such as fertilization and reforestation using genetically improved seedlings Realize returns through active portfolio management and value adding dispositions. Utilize proprietary timberland investment research to support management decisions Provide Current Income Preserve Investment Capital Profit from Long-Term Appreciation Total Return Australia / Chile Timberland New Zealand Timberland Brazil Timberland Uruguay Timberland U.S. Timberland 6% 7% 8% 9% 10% 11% 12% 4% 6% 8% 10% 12% 14% 16% Standard Deviation (%/year) Expected Capital Market Line Annualized Nominal Return (%/year)
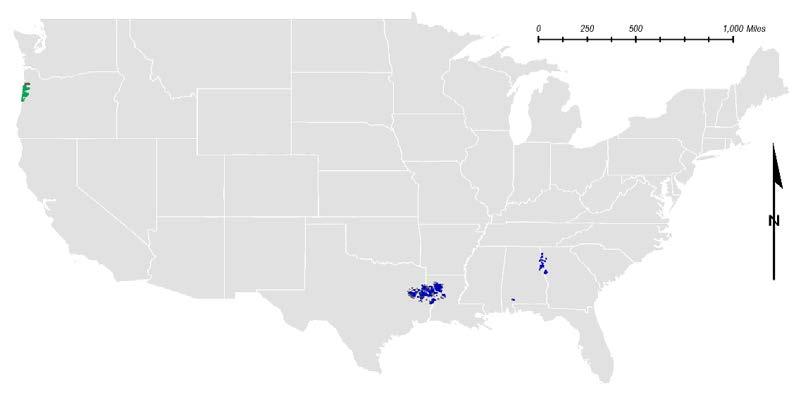
The Salvation Army – Southern Territory Holdings as of June 30, 2021 Alabama & Georgia Chattahoochee Alabama Butterfork SOLD (JUNE 2020) Louisiana and Texas Bienville Timberlands Company Oregon Nestucca Forests, LLC SOLD (November 2020) Client Ownership Fund Region Investment Fund VIII Ownership Investment Area (acres) Net Market Value (USD millions) 1.81% Hancock Timberland VIII U.S. South Chattahoochee 100% 31,767 63.2 Bienville Timberlands Co. 72.4% 238,710 185.5 Sub Total 270,477 248.7 U.S. Northwest Nestucca Forests, LLC1 45.2% 19.5 Fund VIII Total 270,477 268.2 Salvation Army - Southern Territory Pro-rata - 4.9 U.S. South 93% U.S. West 7% Hancock Timberland VIII2 Geographic Diversification as of June 30, 2021 1 Nestucca Forests LLC was sold in Q4 2020. The remaining capital is a standard indemnity and will be paid by the buyer in Q4 2021 2 The U.S. West portion represents an indemnity holdback held by the buyer of the Nestucca Forests LLC asset, which will be paid 12 months from the closing of the sale (i.e. November 2021)
December 31, 2007 2.8%
December 31, 2008 5.1%
December 31, 2009 21.1%
December 31, 2010 1.2%
December 31, 2011 6.4%
December 31, 2012 14.6%
December 31, 2013 7.8%
December 31, 2014 6.2%
December 31, 2015 1.8%
December 31, 2016 0.2%
December 31, 2017 2.4%
December 31, 2018 6.5%
December 31, 2019 8.9%
December 31, 2020 5.3% 7.5%
The Salvation Army – Southern Territory Historical Performance Shareholder Number 17 % Ownership
Commitment 10/2/2006 $10,000,000 Capital Called
Net Asset Value (NAV) as of June 30, 2021 $4,879,959 Net Asset Value (NAV) as of September 30, 2020
Paid LTM
Dividends Paid
Weighted After Fee Return 1 Year
Weighted After-Fee Return
Internal Rate
Return
Internal
2020 distributions equaled $179.7 million primarily due to the sale of Nestucca and Buttefork
Projected distributions through fund term based on wind up estimates,
change
Dollar weighted
projected cash flows through fund
Hancock Timberland VIII1
1.81% HTVIII
100%
$7,892,129 Dividends
$3,150,000 Since Inception
$5,241,500 Time
5.4% Time
Since Inception 1.2% Since Inception
of
(Nominal) -0.1% Since Inception
Rate of Return (Real) 1.7% 1 As of 6/30/2021,
2
subject to
3
IRR, using 2021
term (2022), nominal, before fee, assuming annual rate of inflation of 2.25%
Calendar Year Return HT VIII
0 5 10 15 20 25 30 35 40 45 50 2009 2010 2011 2012 2013 2014 2015 2016 2017 2018 2019 2020 2021 2022 Cash Flow (Nominal; USD
Distributions1,2
after fee,
Distributions Projected Distributions
Projected to term3
millions) Portfolio
(levered,
USD millions)
Key Factors Influencing Performance
Fromanoperationalperspective,property cash flow during thestart of2021remained well aheadof budget,drivenbyhigherthan planned timberandnon timber income on both Bienville and the Chattahoocheeproperty. Forthe year, cash flow for Bienville andChattahoochee is expected to finish above budget due to a combinationofhighermiscellaneousincome, unplanned small tract land sales, carry overstumpagevolume from 2020and lower thanexpectedoperating costs.
HTVIII entered itstwo-year wind-up period on December 31, 2020 andmadesignificantprogresson assetdispositions in 2021 with the successful sale oftheButterforkproperty in Juneand Nestucca ForestsLLC in November Thelatterachieved a premium to theappraisedvalueofapproximately 7% and was the main driverofperformanceforthe trailing 1-yearperiod
As ofJune 30, 2021, HTVIII has tworemaining timberlandinvestments:a 100% directownership of Chattahoocheeand a 72.4% interest inBienville TimberlandsCompany. HNRGis preparing to bring the Bienville investment to market later in 2021 to be followed by Chattahoochee in 2022. Both salesare expected to close in 2022.
Salvation Army – Southern Territory Benchmark Performance
Date:
The
fee
1 NCREIF
data
2 NCREIF
metric
0.00 0.50 1.00 1.50 2.00 2.50 Q1 Q4 Q3 Q2 Q1 Q4 Q3 Q2 Q1 Q4 Q3 Q2 Q1 Q4 Q3 Q2 Q1 Q4 Q3 2007 2008 2009 2010 2011 2012 2013 2014 2015 2016 2017 2018 2019 2020 HT8 Indexed Return (NCREIF Methodology) HT8 NCREIF 2.0% 0.0% 1.4% 2.5% 2.1% 2.5% 2.8% 4.9% -1% 0% 1% 2% 3% 4% 5% 6% 1 Yr 3 Yrs 5 Yrs Since Inception Annualized Returns (NCREIF Methodology) HT VIII NCREIF Hancock Timberland VIII1
The
Hancock Timberland VIII, Inc. Inception
October 2, 2006
NCREIF Timberland Index is a U.S. only, unlevered, before
index
Timberland Index
as of December 31, 2020
Timberland Index reflects timberland performance within the U.S. alone through Q4 20220; this
excludes the performance of Tasman Bay Forest (New Zealand)
The Salvation Army
Southern Territory Summary
Timber & Timberland Markets
The U S economy maintained strong forward momentum in the second quarter, growing at an estimated annual rate of 6 5%, supported by the lifting of pandemic-related restrictions and a major recovery in hard-hit sectors such as restaurants, recreation, and travel In the second quarter, the pace of residential construction eased from the cyclical peaks reached in the first quarter due to limits on availability of building materials and labor Housing starts in the second quarter slipped to a seasonally adjusted annual rate (“SAAR”) of 1 568 million units down from 1 599 million units in the first quarter of 2021 0 200 400 600 800 1,000 1,200 1,400 1,600 1,800 2011 Q2 2013 Q2
Supported by strong residential construction, U.S. production of softwood lumber increased over 10% in the first half of 2021 compared to the same period a year earlier. After setting all time highs in the first quarter, softwood lumber prices, as measured by the Random Lengths Framing Lumber Composite, reversed direction in June and price declines accelerated in July and early August, with forest product prices approaching more normal historical levels. The steep fall in wood product prices resulted from home centers, who sell wood products to consumers, reducing their mill order files in early June proactively, to avoid being left with any late season unsold inventories. This pullback in buying by home centers has allowed finished product inventories at mills to rebalance.
Q2
Lumber index ($/mbf), plywood and osb index ($/msf)
2000
1500
1000
Q2 2019 Q2 2021 Q2 Housing Starts (SAAR) thousands 0
500
2016 2017 2018 2019 2020 2021
Plywood OSB Lumber Originally, most of the gains resulting from the explosion in forest product prices over the past year had been captured by the forest product companies, but timberland owners are also seeing positive impacts in 2021. U.S. timberland performance, as reported by NCREIF Timberland Property Index, registered gains in both capital appreciation and income. Year to date the U.S. Timberland Property Index, as of June 30, 2021 reported a total return of 2.47%. The positive impacts on U.S. timber prices varied by geographic region. Douglas fir sawtimber prices in the U.S. West increased 4.4% in the second quarter, the region’s fourth consecutive quarterly price rise. In the U S South, softwood sawtimber prices were mixed In the western gulf sub-region, wet weather hindered harvesting operations In the mid-Atlantic, increased production at new and existing mills pushed sawtimber prices higher Constraints on labor and transportation, both in the woods and at mills are continuing to disrupt supply chains and contribute to market volatility Pulpwood markets remained generally soft in the U S South due to increased competition from the expanded supplies of manufacturing residuals generated by the region’s sawmills
–
2015
2017
2015
Appendix Notes and Disclosures
Hancock Timber Resource Group is a division of Hancock Natural Resource Group, Inc., a registered investment adviser and wholly owned subsidiary of Manulife Financial Corporation.
Projected Performance
Projected performance figures are based on a model containing certain assumptions, including but not limited to assumptions as to growth rates, harvest levels, timber prices, production costs and liquidity. They should not be construed as guarantees of future returns, nor should they be interpreted as implications of future profitability. Potential for profit as well as for loss exists. The impact of future economic, market and weather factors may adversely affect model results. Performance objectives and projections are based on information available to us at this time and are not meant to be interpreted as guarantees or commitments to future results. The economic outlook is developed by HTRG’s economic and asset class professionals. Our outlook is based on the information available to us at this time and our analysis of same. While we are confident in our projections, one should not interpret them as a guarantee of performance.
Before Fees Performance
Performance figures do not reflect the deduction of investment advisory fees. The client’s return will be reduced by advisory fees and any other expenses it may incur in the management of its investment advisory account. Investment advisory fees of Hancock Natural Resource Group are described in Part II of Advisors Form ADV.
Effect of Advisory Fees Over 10-Year Period
If, for example, the gross total annualized return of a $10 million investment over a 10 year period were 8% real (net of inflation), deducting an annual investment management fee of 95 basis points on the invested capital over a 10 year period would produce a total value of $20.5 million after fees, versus $21. 6 million before fees.
November 2021
Firm Summary
Real Estate Solutions for Logistics Challenges
Longpoint invests in the infrastructure (MCDS)1 of the knowledge economy, which has been accelerated by COVID, technological adoption, and demographic trends.
Who we are and what we value, coupled with our knowledge, our vast network, and our operational framework, make us a strong and efficient team.
Longpoint is a Boston-based vertically integrated real estate operator with deep domain experience in logistics real estate
• Founded in 2015 and led by principals who average over 20 years of industry experience including 15+ years working together
• Invested approximately $4.7 billion in over 150 transactions and managed $9+ billion of real estate through multiple cycles
• Completed 70+ repositioning and redevelopment projects
• AUM as of 9/30/2021 is $1.6 billion2
• Proactive operations process executed by “boots on the ground”, with 39 team members across six offices including 19 investment professionals. Stable investment platform with no significant personnel changes or changes in firm structure.
• Southern Territory commitment of $15M to Fund II effective November 30, 2020
• $665M of investor capital committed to Longpoint Realty Fund II L.P.
Thesis-driven investment approach to infill logistics properties

• Highly disciplined investment strategy: Two core complementary verticals: infill logistics warehouses and grocery logistics centers
Data driven market selection approach 14 U.S. primary markets with high growth, knowledge based economies
High Growth (target 20%+ NOI growth)
Target inefficient, fragmented ownership segment ($17M avg. deal size)
• Value creation consists of physical repositioning, adaptive reuse, development, and portfolio aggregation3
• Target gross IRR of 15% 17% (12% 14% net) utilizing target leverage of 65% of cost (and after the Investment Period, value) at the portfolio level4
1. Longpoint Realty Partners defines the “Modern Consumer Delivery System” as modern retailers’ array of offerings, including diverse in store experiences, food and grocery products, and delivery channels ranging from curbside pickup to home delivery.
2. Includes uncalled capital for Longpoint Realty Fund II.
3. There can be no assurance that any value creation will ultimately be realized.
4. Target returns are not a reliable indicator of future performance and no guarantee or assurance is given that such target returns will be achieved or that an investment in the Fund will not result in a loss. Target returns are based on Longpoint’s assumptions, which it believes to be reasonable and sound under the current circumstances, but which may differ from actual events or conditions, take into account anticipated use of leverage, and assume the reinvestment of proceeds from asset liquidations, and income. Target gross returns are before the deduction of asset management fees, incentive fees and other fund level expenses. Target net returns reflect the deduction of asset management fees, incentive fees and other fund level expenses.
Experienced Team
Longpoint is a vertically integrated owner operator with regional teams led by a dedicated partner.
Dwight Angelini* Managing & Founding Partner
Firm Strategy & RE Ops Southeast/Northeast 21 years’ experience
Nilesh Bubna* Founding Partner & CFO
RE Ops DC & Portfolio Manager 21 years’ experience
Acquisitions & Operations
Peter Gardner Partner, Southeast 25 years’ experience
Michael Corso Director, Mid Atlantic 13 years’ experience
Dan Frank Managing Director, Northeast 25 years’ experience
Kathy Mulkern Director, Southeast 28 years’ experience
Aaron Herter
Reid Parker* Founding Partner & CCO
RE Ops Southwest 30 years’ experience
Robert Provost III* Founding Partner
RE Ops Mid Atlantic & Boston 31 years’ experience
Portfolio Management & Finance
Managing Director, Southwest 14 years’ experience
Lisa Betz Vice President, Northeast 15 years’ experience
Thomas Flinn Director, Fund Controller 18 years’ experience
Helen Marks Vice President 16 years’ experience
Gretta Sonkin Vice President, Northeast 31 years’ experience
Vicki Salvesen Vice President 8 years’ experience
Rich Greer Vice President, Southeast 8 years’ experience
Tom Stipanov Vice President, West Coast 4 years’ experience
Joshua Kay Vice President, Mid Atlantic 10 years’ experience
Zach Zanolli Vice President, West Coast 15 years’ experience
Alex Sanchez Vice President, Southeast 10 years’ experience
Matt Levine Senior Associate 3 years’ experience
Ilona Ozem Vice President 9 years’ experience
Alex Desrouleaux Property Accountant 3 years’ experience
Jenna Vargas Accounting Manager 6 year’s experience
Yvonne Brown Property Accountant 1 years’ experience
McCoy Berger Associate
2 year’s experience
James Dyer
Senior PM, Southwest 35 years’ experience
Martin Kaminski
Chief Engineer
28 years’ experience
James De La Cruz Associate 5 years’ experience
Blake Ezell Senior PM, Southwest 11 years’ experience
Chris Donato Associate 8 years’ experience
Luis Hernandez Property Manager
20 years’ experience
Tiffany Azud Property Accountant 2 years’ experience
Alex Toledo Property Accountant 11 years’ experience
Zaida Subirana Property Accountant 3 years’ experience
Odalmis Gonzalez AR/AP Specialist 8 years’ experience
Enrique Gutierrez Engineer 11 years’ experience
*Member of the Investment Committee
William McCombs Engineer
10 years’ experience
Dan Trulli Analyst 2 years’ experience
Erin Schwartz Analyst
1 year’s experience
Densely Populated, High-Growth Markets
Secondary Market
Primary Market Longpoint Office
Washington D.C.
Boston +
Northern California San Antonio Austin
Denver
Nashville
Southern California
New York/ N.New Jersey Atlanta
+ +
Longpoint employs a research based market-selection process, which has resulted in 14 high-potential target markets served by a dedicated acquisitions and operations team consisting of 39 employees spread across 6 regional offices. +
Dallas Houston Miami
Orlando
The firm is minority owned with an overall representation of 51% from women and minority groups.
+ +
Modern Consumer Delivery System 1. Ford, Morgan, 3 charts show online grocery fulfillment evolution, Grocery Dive (February 2020). 2. Dolan, Shelagh. “The Challenges of Last Mile Logistics & Delivery Technology Solutions.” Business Insider, 10 May 2018, In today’s competitive marketplace, successful retailers must have multiple logistic nodes near the end-consumer to shorten delivery times and streamline the omnichannel network. Consumer Behavior Challenges E-Commerce Cloud Computing AI & Big Data Anticipatory Shipping Robotics Warehouse Automation Delivery @ Home Buy Online, Pick up In Store Shop @ Store Neighborhood Shopping Centers Modernized Industrial Warehouses “MCDS” Technology Millennial / Baby Boomer Preferences Demographics Need: Experience Cost Quality Delivery Costs (by part of journey)2 53%37% 6% 4% Whenever, wherever, and at my price point 92% of U.S. consumers prefer same day delivery or pickup1 Collection Last Mile Delivery Line Haul Sorting Retailers and 3PLs are addressing the four key fulfillment challenges: Rising delivery speed requirements Labor shortages Aging infrastructure Shortage of well located delivery nodes 1 2 3 4 Reurbanization Trends Increasing Ethnically Diverse Populations Mobile Devices Big Data Mining E-commerce
Our Approach & Proactive Sourcing Framework


In 2015, Longpoint set out to address the systemic supply demand imbalance by creating modern logistics infrastructure through physical repositioning, adaptive reuse, and development of real estate assets. Longpoint’s combination of

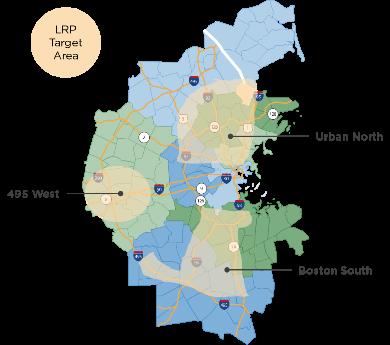


Longpoint regional offices Miami • New Jersey • DC/Baltimore California • Dallas Unsolicited Offers Lasting Relationships Deal Tracking Software Local Network Focused Strategy Proactive Process + + Data Driven + Target Inventory Lists
local networks and analytical tools results in a significant competitive advantage in creating attractive investment opportunities.
Targeted Physical Improvements
Longpoint adds value at the asset level in conjunction with on-the-ground operators and local network members with customized business plans that optimize the value of each logistics asset.1
Interior Functionality
• Upgrading LED lighting, electrical, and floor slab for enhanced warehouse operations
• Replacing, upgrading or adding new dock packages facilitates loading and unloading of delivery vehicles
• Reduction of the office percentage by converting administrative space to logistics space
• Converting manufacturing space to logistics by increasing the column spacing, removing equipment, and white boxing the interior
Optionality of Use
• Exterior renovations to the façade lighting, painting, and signage
• Enhanced curb appeal through upgrades to landscaping and fencing
• Truck court revitalization through new sealcoating and striping as well as adding trailer storage
• Exterior renovations improve overall safety and security for logistics tenants
• Reducing the floor area ratio and increasing the ceiling height increases the truck circulation while maintaining warehousing capacity

“MCDS” Infrastructure
• Addition of click and collect stations to facilitate online grocery operations

• Redevelopment of anchor grocer unit to meet current requirements for image and logistical capabilities
• Conversion of existing retail spaces to grocery retail
• Upgrades to parking field and directional signage to improve customer and delivery vehicle circulation
• Renovations to grocer unit’s exterior and interior for enhanced visibility and appeal
1. There can be no assurance that any investment will experience the value creation described above. Past trends in pricing premiums do not necessarily translate to future investment returns.
Fund II Key Terms
Fund Longpoint Realty Fund II, LP, a Delaware limited partnership
Southern Territory Commitment
$15 million
Total LP Commitments $665 million
GP Commitment 1% up to $4.5 million
Investment Period Three years from the October 2021 with a one year extension option in the General Partner’s sole discretion.
Term Eight years from October 2021 with (i) a one year extension option in the General Partner’s sole discretion, (ii) an additional one year extension with the consent of the Advisory Committee, and (iii) thereafter, extension with the affirmative vote of 2/3 in interest of the Limited Partners.
Capital Calls
First capital call expected December 2021

Mission Statement
We strive to invest with wisdom and insight, to understand the needs of consumers, to develop locally relevant properties, and to implement environmentally sustainable practices.
We are committed to operating with integrity, discipline, and enthusiasm in service of our investors and community members.
Longpoint takes its name from Long Point Wildlife Refuge, a 600 acre nature preserve on Martha’s Vineyard. Like this unique preserve, our firm is designed to flourish in varied conditions, capitalizing on opportunities in an ever changing marketplace.

November 2021
Firm Summary
Founded in 1993, Noble Investment Group (“Noble”) is a minority owned, industry leading real estate investment firm that specializes in making income and value add investments in upscale select service and extended stay hotels throughout the United States. Through its private equity real estate funds, Noble has invested nearly $4.0 billion in communities throughout the country, creating thousands of jobs. As an institutional fiduciary to foremost pensions plans, university endowments, and foundations, Noble’s endeavors help to preserve and grow our limited partners’ capital, which assists in providing retirement benefits for our country’s teachers, law enforcement, firefighters as well as financial resources for students to attend college.
Noble’s team of lodging specialists have been together multiple decades providing broad expertise in real estate and capital markets. They identify accretive investment opportunities, complex development acumen to maximize the income production of lodging real estate, and asset management proficiency to drive financial performance. Noble has expanded its team over the past year, which includes 7 investment professionals. Noble currently employs 35 team members, of which one half represent gender and/or racial diversity.
Noble has made 127 lodging investments and has fully realized all investments from 1993 through early 2015. The firm has achieved a track record of 19.5% gross IRR and 1.9x gross MOIC on these investments and a 32.1% gross IRR and 2.1x gross MOIC on all select service and extended stay hotel investments made across multiple cycles Noble currently has gross AUM of $1.13 billion under management.
The Firm has a long term succession plan for identifying and developing Noble leaders and planning for future retirements. Rodney Williams retired as Chief Investment Officer in December 2020 and currently serves as an advisor to the Firm. In addition, Mr. Williams serves on the Fund’s Investment Committee. Ben Brunt was promoted to the role of Chief Investment Officer. After a sixteen year career at Noble and a multi year transition of responsibilities, Jim Conley will be retiring in late 2022. In January 2021, George Dabney joined the firm as Chief Financial Officer and Mr. Conley was appointed Chief Compliance Officer.
Investment Vehicles
The Salvation Army committed capital to Noble’s two recent funds.
Noble Hospitality Fund IV – Income, L.P. (“Income Fund”)
Fund Summary
The Income Fund was formed on September 20, 2017, concluded its fund raising on September 20, 2018 with $243.0 million of commitments and terminated its investment period on June 30, 2020. The term of the Income Fund may continue until tenth anniversary of the final closing plus any Investment Period extension unless sooner terminated; however Noble may continue the term of the Income Fund for one year in its sole discretion and a second year upon approval from the Investor Advisory Committee.
The Income Fund has committed and called $211.0 million to six investments representing nine hotels (87% of committed capital before reserves). Inception to date distributions total $3.0 million The Salvation Army has committed $20.0 million to the Income Fund.
The Income Fund has invested in nine hotels representing select service and extended stay brands within the Hilton and Hyatt brand families. The hotels are in five urban markets which will attract the vast majority of their room night demand from “transient” guests, meaning individuals traveling for both business and leisure Due to daily revenue management flexibility and price elasticity, guests frequenting select service hotels pay higher average daily rates than large groups, and the nature of this demand is also much less volatile, resulting in more durable performance across cycles.
Business Plan Update
Noble Fund IV – Income has invested $211.0 million of equity capital in nine high quality hotels in target markets which we believe have substantial long term value. Eight of the nine assets were acquired in the fourth quarter of 2019 and in January and February of 2020. As a result of the historical impact of the Global Health Crisis, the assets incurred operating cash flow deficits during 2020 and had a reduction in valuation, which impacted the Fund's current net IRR and current net MOIC.
In 2021, increasing hotel demand combined with Noble's scale and resources as a hospitality sector specialist helped generate positive asset level cash flow during the second quarter. Due to stronger than expected operating results throughout the portfolio, Noble Fund IV – Income's second quarter financial statements reflect an increase of $39.0 million or 9.8 percent in the fair
value of its real estate assets compared to the first quarter of 2021. Year to date through June 30, 2021, real estate asset valuations have increased $49.7 million or 13 percent.
While the Fund's Current net MOIC is 0.8x, and current net IRR is 17.0% as of June 30, 2021, Noble Fund IV – Income is projected to achieve its targeted net 2.2x MOIC and 11% IRR as its hotels have become cash flow positive, and valuations, which are currently 98% of pre crisis levels as of September 30, 2021, are expected to be at or exceed basis by the end of 2021.
Noble Hospitality Fund IV – Value Add, L.P. (“Value Add Fund”)
Fund Summary
The Value Add Fund was formed on September 20, 2017, concluded its fund raising on August 22, 2018 with $207.0 million of commitments and its investment period was extended until September 19, 2021 to coincide with the establishment of NF IV VA SSCI, LLC, the Special Situations Co-Investment Venture (the “Co Investment Venture”) that the Value Add Fund has committed $115.0 million. Subsequently, the Fund investment period was extended for both the Value Add Fund and Special Situations Co Investment Venture to March 31, 2022. The term of the Value Add Fund may continue until fifth anniversary of the final closing plus any Investment Period extension unless sooner terminated; however, Noble may continue the term of the Value Add Fund for one year in its sole discretion and a second year upon approval from the Investor Advisory Committee.
The Value Add Fund has committed $115.0 million to the Special Situations Co-Investment venture which closed on an additional $200.0 million of capital from existing Value Add Fund LPs (including those sharing a common advisor/affiliates).
As of November 5, 2021, the Value Add Fund has made three wholly owned investments representing four hotels (approximately 38% of committed capital before reserves) The wholly owned investments include:
• Hilton Garden Inn Atlanta | Perimeter Center has completed an extensive renovation,
• Element by Westin Nashville West End | Vanderbilt opened in February 2021, and
• Dual brand Courtyard by Marriott | Element by Westin Atlanta Midtown opened in October 2021.
In addition, the Value Add Fund owns joint venture interests in five hotels in the Co Investment Venture as of the date of this letter with another seven hotels under definitive agreement to be acquired before the end of 2021. These hotels are being acquired at 8 10% cap rates on 2019 NOI in high growth Noble target markets on an off market basis. These hotels are being acquired at a
20% discount to Pre-COVID value and replacement cost with significant operational and physical value add opportunities.
The Value Add Fund has called $128.0 million of capital has been called to date and we expect to call an additional $32.0 million in the fourth quarter of 2021 and $3.0 million in the first quarter of 2021. The Salvation Army has committed $10.0 million to the Value Add Fund.
Investment Opportunity & Strategy
As a result of the Global Health Crisis, U.S. Revenue per Available Room ("RevPAR") fell 51.8% during 2020, by far the most significant decline in history. As the recovery begins, real GDP growth appears to be accelerating. For more than thirty years, growth in real GDP and hotel demand has been 98% correlated. This connection is projected to revert to the mean. However, Noble continues to forecast a "butterfly" recovery for travel. The year to date growth in hotel demand and performance reflects accelerating economic growth combined with rising confidence in travel; however, a return to nominal 2019 RevPAR and EBITDA is expected to take until late 2023 or 2024.
Despite a strong multi year recovery and CAGR for hotel owners, a structural crisis is looming. A record $236 billion in lodging loans, originated between 2017 and 2019, are starting to mature. The majority of these loans were underwritten at peak asset values and EBITDA, and most were financed with at least 75% leverage. Select service and extended stay hotels recently developed by private owner/operators face impending maturities on high leverage construction loans supported by personal guarantees. During the Global Health Crisis, many of these hotels received interest forbearance (further raising debt levels at a time when value declined) and utilized FF&E reserve funding to cover operating costs.
With income recovery projected to be years away, owner/operators are now beginning to face the difficult challenge of addressing significantly insufficient debt yields for refinancing alongside the capital required for brand mandated property upgrades. This same scenario took place after the Great Financial Crisis, where between 2010 and 2012, Noble invested in distressed opportunities throughout the U.S., which were realized well above target returns,
Out of the more than 60,000 hotels in the United States, Noble's target investment market is approximately 5,000 select service and extended stay hotels in high growth markets, representing a $150 billion market opportunity for Noble.
Noble believes this historical crisis in the lodging sector will provide a generational buying opportunity to acquire distressed assets at 8 10% cap rates on 2019 performance and at significant discounts to pre crisis valuations and replacement costs.
Through the Co-Investment Venture, we expect the Value Add Fund to invest in approximately 15 hotels in 2021 through the strength of Noble’s three decades of relationships with over a thousand owner operators. This fragmented community owns 80% of Noble’s target universe and has been the primary source of Noble’s direct investments over twenty eight decades.
Business Plan Update
Noble Fund IV Value Add committed approximately 38% of its capital in late 2018 and 2019 in four hotels (three new developments and one major renovation). The Element by Westin Nashville at Vanderbilt University opened in February of 2021 and has been immediately cash flow positive. The Element by Westin and Courtyard by Marriott Atlanta | Midtown will open in October of 2021. Noble Fund IV – Value Add is investing its substantial remaining capital alongside the Noble Fund IV – Value Add co investment, Noble SSCIV.
Noble's cycle tested approach and specialist execution are yielding meaningful investment results for Noble Fund IV – Value Add, and its strategic developments in high barrier to entry markets are showing significant embedded value. With a net cost basis of $86.0 million, Noble Fund IV –Value Add has entered into a definitive agreement to sell its Courtyard by Marriott and Element by Westin Atlanta | Midtown to an allocator investor for $117.0 million ($414,000 per room). The sale would represent a 36% premium over the Fund's development basis and would exceed our proforma 2024 sales price. The sale is expected to close in Q4 2021 and would yield a projected gross 37% IRR and a 2.0x MOIC. Upon closing, we would return approximately $60.0 million to investors from the sale, reflecting approximately 80% of the Fund’s invested equity in the four investments made in 2018 and 2019.
As a result, the Fund's second quarter financial statements reflect an increase of $45.4 million or 26% in the fair value of its real estate assets compared to the first quarter of 2021. Year to date June 30, 2021, real estate asset valuations have increased $75.4 million or 52%. The Fund's Net Current MOIC and Net Current IRR have increased from 0.82x and 10.0% on March 31, 2021, to 1.22x and 16.5% as of June 30, 2021.
Based on the forgoing and our substantial investment pipeline, Noble Fund IV – Value Add remains on target to achieve and potentially exceed its targeted net 1.8x MOIC and a 15% IRR.
November 2021
Oaktree Overview
• Founded April 1995
• Invests in less efficient and alternative markets
• $156 billion1 in assets under management across highly synergistic investment platforms
• Five senior executives and over 1,000 staff members; more than a quarter ofcurrentemployees areequityowners
• Offices in 19 cities in 14 countries, with headquarters in Los Angeles
• Significant Events:
• In June 2021, Jerilyn Castillo McAniff was appointed as Oaktree's Head of Diversity and Inclusion. Prior to this appointment, Ms. McAniff spent 13 years on our U.S. High Yield Bond investment team, including a period as Co-Director of Research. She has served as co-head of Oaktree's Diversity & Inclusion Council since 2017.
• In April 2021, Lindsay DeLarme assumed the role of Managing Director and Head of Corporate Communications & Branding, transitioning responsibilities from Andrea Williams, who departed from Oaktree to pursue other endeavors. Lindsay DeLarme joined Oaktree in 2013, most recently serving as a senior member of the Corporate Communications & Branding team.
• In February 2021, Oaktree announced the appointment of Priya Prasad Bowe as Oaktree’s first Head of ESG. Ms. Prasad Bowe, who joined the firm in 2019 to work on our credit businesses, has been integrally involved in the design and implementation of the ESG framework for our Global Credit strategy, including authoring the beginnings of its climate change management strategy. Going forward, she will work with all of Oaktree’s investment teams to make certain they are all fully aware and educated regarding emerging ESG risks and to assist them in bolstering their ESG integration, documentation and engagement practices globally.
As of June 30, 2021
1 Includes Oaktree’s proportionate amount of DoubleLine Capital AUM resulting from its 20% minority interest therein
OAKTREE REAL ESTATE OPPORTUNITIES FUND VII, L.P. Confidential
Portfolio Manager Overview
• Real Estate Opportunities Portfolio Managers Biographies:
John Brady (Portfolio Manager & Global Head of Real Estate): Mr. Brady joined Oaktree in 2007 as a managing director and head of the global Real Estate group. He serves as the portfolio manager for Oaktree’s Real Estate Opportunities, Income and Debt strategies. Prior thereto, Mr. Brady was a Principal at Colony Capital, which he initially joined in 1991. He began his career working in various capacities in the investment banking division of Merrill Lynch. Mr. Brady holds a B.A. degree in English from Dartmouth College and an M.B.A. with concentrations in corporate finance and real estate from the University of California, Los Angeles. He previously served on the Board of Directors of Taylor Morrison Home Corporation and is Chairman of the Board of Directors of Homeboy Industries
Ambrose Fisher (Managing Director & Co Portfolio Manager): Mr. Fisher joined Oaktree in 1995. He is a managing director and co portfolio manager of Oaktree’s Real Estate Opportunities strategy. Mr. Fisher has been involved in the investment, management and fund raising of its real estate funds and predominantly focuses on West Coast opportunities. His responsibilities include acquisitions, dispositions, financings/re financings, asset management, development and redevelopment of all property types, including office, multi family, hotels, retail, residential, industrial, land and other miscellaneous property types. Prior to joining Oaktree in 1995, Mr. Fisher was an assistant vice president in the Special Credits Real Estate Group at TCW. Before that, he managed a portfolio of non performing and performing loans and real estate for the J.E. Robert Companies. Prior thereto, Mr. Fisher was a real estate loan workout specialist with Bank of America. He holds a B.S. degree in business administration from the School of Business Administration at Georgetown University.
Todd Liker (Managing Director & Co Portfolio Manager): Mr. Liker joined Oaktree in 2008. He is a managing director and co portfolio manager of Oaktree’s Real Estate Opportunities strategy and leads the Real Estate team in New York. Mr. Liker has investment experience across all major real estate asset types with a particular focus on Oaktree’s investment activities in the Southeastern and Midwestern regions of the United States. He also oversees the group’s focus in corporate real estate-related platforms and companies. Prior to joining Oaktree, Mr. Liker was an executive director with J.P. Morgan Securities’ Real Estate, Lodging & Gaming Investment Banking group in New York and London. Prior to joining J.P. Morgan, he spent four years at ABN AMRO in Chicago and Singapore. Mr. Liker received a B.S. degree in business administration from the John M. Olin School of Business at Washington University and an M.B.A. from the Tuck School of Business at Dartmouth. Mr. Liker is currently a member of the M.B.A. Advisory Council at the Tuck School of Business
OAKTREE REAL ESTATE OPPORTUNITIES FUND VII, L.P. Confidential
As of June 30, 2021
Oaktree’s Investment Philosophy
OAKTREE REAL ESTATE OPPORTUNITIES FUND VII, L.P. Confidential
of
strategies
the primacy of risk control “If we
the losers, the
emphasis on consistency Asuperior record is best built on
years
importance of market inefficiencies It is only in less efficient markets that
skill
to produce superior returns benefits of specialization Our team members’experience and expertise give us
advantage macro forecasting not critical to investing Superior knowledge of companies and their securities
foundation for consistently excellent performance disavowal of market timing The ability to correctly time markets is
invested
attractive investments
All
Oaktree’s
operate pursuant to an investment philosophy that has remained unchanged since our founding in 1995
avoid
winners take care of themselves”
a high batting average rather than the hope that great
will outweigh dismal ones
hard work and
are likely
a substantial
is the best
limited at best; we are fully
wherever we can find
Executive Summary – Real Estate Opportunities Fund VII
integrated global platform
• $13.9 billion AUM in Real Estate Opportunities, Real Estate Debt and Real Estate Income strategies
• Opportunities within the equity and debt strategies approached with a risk controlled investment philosophy
• Highly collaborative process, sharing intellectual capital gathered across products and regions
• Enhanced by Oaktree’s multi disciplinary capabilities and global reach
consistent results
• 25 year history of consistent, positive returns for 30 organized real estate vehicles1
• Track record of allocating capital to value and growth opportunities
• Average net multiple of 1.7x on equity fund2 All funds greater than 1.5x net2
• Proven capabilities throughout market cycles flexible strategy investing throughout the economic cycle
• Early down cycle: Acquire deeply discounted mark to market securities with strong fundamentals
• Mid down cycle: Seek quality assets and companies with broken capital structures (save good operators; replace bad ones) bid non performing loan pools
• Late down cycle to early recovery: Pursue direct investments at bargain prices, develop programmatic joint ventures, and launch growth platforms in response to market evolution and disruption
• Recovery: Build up successful growth platforms, access high yielding assets in stable markets with strong long term growth fundamentals or quality assets in cyclical markets poised for growth
• Late recovery: Invest with caution and focus on opportunistic exits regional
• ~$61 billion of total transaction volume since 20083
• Active in top 50 U.S. real estate markets as well as major European and Asian markets
• One of the most prominent investors in our target markets
• Repeat business on 64% of our equity deals with over 125 operating partners
experienced team with a reputation of trust and integrity
As of June 30, 2021
• 58 professionals directed by portfolio manager, John Brady
• Led by 23 managing directors averaging more than 26 years of industry experience
• Characterized by a strong reputation for reliability and integrity leading to significant repeat business and referrals
1 Data that predates Oaktree Capital Management’s inception relates activities carried out by the Real Estate Group while at TCW Group from 1994 through the first quarter of 1995.
2 Net fund level figures are after management fees, expenses and actual or potential incentive allocation and reflect the multiple of the unaffiliated limited partners. Fund level multiple of capital is calculated as (NAV + distributions) divided by paid in capital. The weighted average of net fund level multiple of capital is calculated from the historical Real Estate Opportunities Funds that are substantially realized (SCF VI, ROF A, ROF B, ROF II, ROF III/IIIA, ROF IV, ROF V) and excludes performance results for trusts and separate accounts; however, the returns for each associated entity are similar to the results for the fund to which it is related.
3 The total investment figure shown includes all real estate transactions in Real Estate Opportunities, Real Estate Debt, and Real Estate Income strategies since 2008, including real estate led transactions from other Oaktree managed funds.
OAKTREE REAL ESTATE OPPORTUNITIES FUND VII, L.P. Confidential
and
coverage
local expertise
Portfolio Information
administrative facts
Commencement of operations 8/27/15
Investment period start date 1/1/16
Investment period end date 1/1/20
Fund term 10 years
First close 4/1/15
Final close 10/12/16
Fund type Closed end Total committed capital ($mm) $2,921
Currency USD % Drawn 100%
% Distributed 67%
GP and affiliates % of fund 2.8%
Credit facility balance ($mm) $228
Management fee 1.5%
GP carried interest 20%
Preferred return 8%
Catch up 60% / 40%
purchase/sale history
Current quarter return 8.1% 7.8% 6.8% Year to date return 14.1% 13.4% 11.5% Since inception IRR 25.9% n/a 16.4% Multiple of capital 1.5x 1.4x 1.3x Fund net asset value n/a $2,113 $1,828
OAKTREE REAL ESTATE OPPORTUNITIES FUND VII, L.P. Confidential
($ in millions)
asset
Net/Net
As of June 30, 2021 Note: Please see the following slide for related footnotes. *Net invested capital is defined as total invested capital less any financing proceeds received within the first year of acquisition. performance/net
value1 Gross Net
investment profile
(invested capital by category)
Investment Category # of Investments Net Invested Capital* Dollar Return Multiple of Invested CapitalTotal % of Total
42
61.3% $1,142.0
21
23.3
4
0 400 800 1200 1600 2000 2400 2800 $3200 2Q15 2Q16 2Q17 2Q18 2Q19 2Q20 2Q21 Cumulative Purchases Cumulative Sales
historical
2
($ in millions)
Commercial
$1,855.7
1.6x Global ex U.S.
705.0
238.1 1.3 Corporate Platforms
354.6 11.7 113.2 1.3 Opportunistic Credit 2 23.3 0.8 13.9 1.6 Residential 4 89.1 2.9 29.0 1.3 73 $3,027.7 100.0% $1,536.2 1.5x
2
1
Total Number of Holdings: 73
Holding Asset Type
Investment Category
Property Type
Thomas James Homes Equity Corporate Platforms Residential $311.8 13.5%
Plainvim International Equity Global ex U.S. Industrial 137.5 6.0
Westin Maui Equity Commercial Hotel/Gaming/Leisure 114.1 5.0
Bank of America Plaza Equity Commercial Office 100.4 4.4
BHMS 2018 ATLS MZC (Atlantis) Debt Global ex U.S. Hotel/Gaming/Leisure 100.1 4.3
Health Net/Centene Equity Commercial Office 80.8 3.5
Renaissance Square Equity Commercial Office 79.7 3.5
Santa Clara Towers Equity Commercial Office 75.5 3.3 30 S. Colonnade Equity Global ex U.S. Office 70.0 3.0
Trinity JV Equity Commercial Hotel/Gaming/Leisure 62.6 2.7
$1,132.5 49.1%
Account Statement Information
Commitment date 4/1/15
Commitment amount $15,000,000
Commitment in the Fund as % of total Fund commitments 0.51%
Ending unfunded commitment $4,364,999
As of June 30, 2021
PERFORMANCE/NET ASSET VALUE
Quarter and Year to Date performance metrics represent the time weighted return for the period.
Multiple of Capital is calculated as (Net Asset Value + Distributions) ÷ Paid In Capital; also referred to as Investment Multiple.
Since Inception Internal Rate of Return (“IRR”) represents the annualized implied discount rate calculated from the fund level cash flows.
Gross figures represent returns/multiples of the partnership before giving effect to management fees, expenses and potential incentive allocation.
Net figures are after management fees and expenses, but before potential incentive allocation and reflect the returns/multiples of the partnership.
Net/Net figures are after management fees, expenses and potential incentive allocation and reflect the returns and multiples of the non affiliated limited partners.
HISTORICAL INVESTMENT PROFILE
This section does not take into account the effect of foreign currency forward contracts utilized by the Fund to manage currency risks, as such hedging activities are typically performed at the fund level.
3 CURRENT HOLDINGS INFORMATION
Investment Category: represents an Oaktree derived classification of investments by investing silo/expertise.
Property Type: NCREIF property type classifications have been used where appropriate. The categories “Residential” and “Multifamily” have been created in place of the NCREIF “Apartment” classification to encompass all residential related properties.
OAKTREE REAL ESTATE OPPORTUNITIES FUND VII, L.P. Confidential
in
current holdings information (top 10 holdings based on market value)3
Account balance end of period, after potential incentive allocation $9,827,077 Portfolio Information (continued) ($
millions)
the salvation army, a georgia corporation
Market Value % of Total Market Value
Real Estate Team Organization Chart
united states
Matthew Deatley Senior Vice President
Jimmy Zhan Senior Vice President
Adam Goldberg Vice President
Katy Mao Senior Vice President
As of October 30, 2021 (unless otherwise noted)
Note: Years of investment and Oaktree experience shown above are as of June 30, 2021. 1 Represents member of the Real Estate Leadership Team. 2 Third party service provider
OAKTREE REAL ESTATE OPPORTUNITIES FUND VII, L.P. Confidential
Alex Silverman Vice President new york Amy Johannes Managing Director
los angeles
Austin Jacoby Associate Lauren Broser Vice President Chris Ahn Associate Andrew Loeb Senior Vice President
Aaron Greenberg Managing Director Kimberly May Vice President
Bryan Sather, CFA Managing Director Cary Kleinman Managing Director Jared Lazarus Managing Director Warren Min Managing Director london Stuart Keith Senior Vice President Jeffrey Chalmers Senior Vice President Mark Hulbert Managing Director europe asia pacific hong kong Sici Cheng Vice President Jenny Li Managing Director seoul Rachel Park, CPA Senior Vice President Andrew Lee Senior Vice President Andie Shin Vice President Hideya Takahashi Senior Vice President tokyo Benjamin Coughlin Managing Director sydney Julian Busch Associate
u.s. senior loans 17 professionals global convertibles 8
opportunities
u.s. high yield bonds 22
additional resources legal 18 attorneys bellwether asset
2 82
product
Javier
Taejo Kim Managing Director Raymond Gong Managing Director Kevin Sciarillo Vice President KC Testwuide Vice President
professionals
60 professionals
professionals
management
professionals
management Derek Rich Managing Director Ainslee Burns Vice President Amy Gall Vice President Harvey Byun Vice President
Muelas Giron Associate Minjoo Kim Associate
Steve
1 Head
Benjamin
1 Head
25 years / 14 years 22 years / 8 years Investment Experience: 33 years Oaktree Experience: 14 years
Mark Seager Vice President
Choi
of Asia
Bianchi
of Europe
Co-Portfolio
Real
Co-Portfolio
Real
Real
Co-Portfolio
Real
31 years /
26
/
23
/
28
20
/
John Brady
Portfolio Manager Global Head of Real Estate William
Beischer
Associate Kenya Williams Managing Director Product Specialist, Real Estate (LA) Alexis Harmon Assistant Vice President Product Specialist, Real Estate (LA) Maxim Rozhdov Associate Ambrose Fisher 1
Manager
Estate Opportunities Mark Jacobs 1
Manager
Estate Income Justin Guichard 1 Co-Portfolio Manager
Estate Debt Todd Liker1
Manager
Estate Opportunities
26 years
years
13 years
years
14 years
years / 21 years Jason Keller 1 Head of Residential Derek Smith 1 Head of Operations Ryan Delaney 1 Head of Asset Management
years
9 years 25 years / 14 years 30 years / 11 years
Olivia Peniston Associate
Camille Kelleher Associate
Anniqa Karmali Analyst Bradley Lucas Vice President Product Specialist, Real Estate (LA)
Charles Baxter Vice President
Amiyr Jackson Associate Matthew Kucharski Associate Bri Ossman Associate
Stephen Breedon Vice President David Wong Analyst
($ in millions)
Substantially Realized
Committed Capital $505.5 $303.7 $285.5 $463.5 $707.3 $450.4 $256.3 $1,283.0 $2,677.2 $2,920.9 $4,572.1
Paid in Capital 505.5 303.7 285.5 440.3 707.3 450.4 256.3 1,283.0 2,677.2 2,920.9 434.3
Net Invested Capital5 671.5 554.7 828.7 866.9 1,371.6 793.7 338.4 1,598.3 3,597.9 3,027.7 1,561.1
Gross Investment level Profit6 684.8 267.6 189.3 293.0 656.5 462.7 218.1 1,099.6 1,541.6 1,542.8 352.9
Gross Investment level IRR 23.2% 11.8% 9.2% 17.3% 18.0% 17.8% 16.8% 18.5% 13.2% 15.9% 65.2%
Gross Fund level
IRR 21.1% 10.5% 8.2% 15.2% 15.3% 15.6% 14.4% 16.7% 12.2% 25.9% 350.4%
Gross Fund level
Multiple of Capital7 2.4x 1.9x 1.7x 1.7x 2.0x 2.0x 1.8x 1.9x 1.6x 1.5x 1.7x
Net Fund level IRR 17.4% 8.4% 7.1% 11.1% 11.3% 10.6% 12.4% 12.3% 8.4% 16.4% 250.6%
Net Fund level
Multiple of Capital7 2.1x 1.7x 1.6x 1.5x 1.7x 1.7x 1.7x 1.6x 1.4x 1.3x 1.5x
Distributed Capital as a Percentage of Paid in Capital 208.1% 165.6% 160.4% 148.4% 169.1% 167.4% 170.6% 155.3% 105.8% 66.6% 100.0%
As of June 30, 2021
Note: This table excludes performance results for Opportunities funds’ related trusts and separate accounts; which are similar to the results for the fund to which it is related. The Opportunities’ investment level track record is available upon request. Gross fund level figures are before management fees, expenses and actual or potential incentive allocation and reflect the returns/multiples of the partnership. Net fund level figures are after management fees, expenses and actual or potential incentive allocation and reflect the returns/multiples of the unaffiliated limited partners.
1 Data that predates Oaktree Capital Management’s inception relates to activities carried out by the Real Estate Group while at TCW Group from 1994 through the first quarter of 1995.
2 ROF V, ROF VI , ROF VII, and ROF VIII employ subscription financing to manage cash flows, including the drawdown on committed capital from limited partners. See the Subscription Line disclosure in the Appendix for more detailed information regarding the use and impact of such financing on the IRR of the Funds.
3 ROF VI figures include two parallel funds. ROF VII figures include three parallel funds. ROF VIII figures include eight parallel funds.
4 Total invested capital may exceed paid in capital of the fund because the fund has the ability to (i) reinvest proceeds from realized investments during its investment period and (ii) make follow on investments after its investment period with proceeds from realized investments.
5 Gross investment level profit represents all realized and unrealized gains/(losses) and the impact of forward contract hedges applied at the fund level.
6 Fund level multiple of capital is calculated as (NAV + distributions) divided by paid in capital
OAKTREE REAL ESTATE OPPORTUNITIES FUND VII, L.P. Confidential
Appendix: Oaktree’s Real Estate Track Record
SCF VI1 ROF A ROF B ROF II ROF III/IIIA ROF IV Remington ROF V2,4 ROF VI2,3 ROF VII2,4 ROF VIII2,3
Investing
August 1994 February 1996 March 1997 December 1998 October 2002 June 2008 February 2010 February 2011 September 2012 August 2015 December 2019
Commencement of Operations
Appendix: Performance Disclosures
The performance information contained herein is provided for informational purposes only. Oaktree makes no representation, and it should not be assumed, that past performance is an indication of future results. There can be no assurance that the Oaktree’s Real Estate Opportunities Fund VII, L.P. will be able to earn the rates of return indicated herein. Indeed, wherever there is the potential for profit, there is also the possibility of loss. In reviewing the performance information included herein, please note the following:
investment valuations
U.S. GAAP establishes a hierarchal disclosure framework, which prioritizes the inputs used in measuring financial instruments at fair value into three levels based on their market observability. Market price observability is affected by a number of factors, including the type of instrument and the characteristics specific to the instrument. Financial instruments with readily available quoted prices from an active market or for which fair value can be measured based on actively quoted prices generally will have a higher degree of market price observability and a lesser degree of judgment inherent in measuring fair value. Financial assets and liabilities measured and reported at fair value are classified as follows:
• Level I Quoted unadjusted prices for identical instruments in active markets to which the applicablefund has access at the date of measurement. The types of investments in Level I include exchange tradedequities, debt and derivatives with quoted prices.
• Level II Quoted prices for similar instruments in active markets; quoted prices for identical or similar instruments in markets that are not active; and model derived valuations in which all significant inputs are directly or indirectly observable. Level II inputs includeinterest rates, yield curves, volatilities, prepayment risks, loss severities, credit risks and default rates. The types of investments in Level II generally includecorporate bonds and loans, government and agency securities, less liquid and restricted equity investments, over the counter traded derivatives and other investments where the fair value is based on observable inputs.
• Level III Valuations for which one or more significant inputs are unobservable. These inputs reflect the applicablegeneral partner’s assessment of the assumptions that market participants use to value the investment based on the best available information. Level III inputs include prices of quoted securities in markets for which there are few transactions, less public information exists or prices vary among brokered market makers. The types of investments in Level III include non publicly traded equity, debt, real estate and derivatives.
In some instances,an instrument may fall into different levels of the fair value hierarchy. In such instances,the instrument’s level within the fair value hierarchy is based on the lowest of the three levels (with Level III being the lowest) that is significant to the value measurement. The assessment of the significanceof an input requires judgment and considers factors specific to the instrument. Transfers of assets into or out of each fair value hierarchy level as a result of changes in the observability of the inputs used in measuring fair value are accountedfor as of the beginning of the reporting period. Transfers resulting from a specific event, such as a reorganization or restructuring, are accounted for as of the date of the event that caused the transfer.
In the absenceof observable market prices, the applicablegeneral partner values Level III investments using valuation methodologies applied on a consistent basis. The quarterly valuation process for Level III investments begins with each portfolio company, property or security being initially valued by the investment or valuation teams. The valuations are then reviewed and approved by the valuation team and the valuation committee of each investment strategy, which consists of senior members of the investment team. All Level III investment values are ultimately approved by the valuation committees and designated investment professionals as well as the valuation officer who is independent of the investment teams and reports directly to Oaktree’s Managing Principal. Results of the valuation process are evaluated each quarter, including an
assessment of whether the underlying calculations should be adjusted or recalibrated. In connection with this process, the applicablegeneral partner evaluates changes in fair value measurements from period to period for reasonableness, considering items such as industry trends, general economic and market conditions,and factors specific to the investment.
Certain Level III assets are valued using prices obtained from brokers or pricing vendors. The applicable general partner obtains an average of one to two broker quotes. The applicablegeneral partner seeks to obtain at least one price directly from a broker making a market for the asset and one price from a pricing vendor for the subject or similar securities. These investments are classified as Level III becausethe quoted prices may be indicativein nature for securities that are in an inactivemarket, may be for similar securities, or may require adjustmentfor investment specificfactors or restrictions. Generally, the applicablegeneral partner does not adjust any of the prices received from these sources, and all prices are reviewed by the applicable general partner. The applicablegeneral partner evaluates the prices obtained from brokers or pricing vendors based on available market information, including trading activity of the subject or similar securities, or by performing a comparablesecurity analysis to ensure that fair values are reasonably estimated. The applicablegeneral partner also performs back testing of valuation information obtained from brokers and pricing vendors against actual prices received in transactions. In addition to on going monitoring and back testing, the applicablegeneral partner performs due diligence procedures over pricing vendors to understand their methodology and controls to support their use in the valuation process.
Non publicly traded debt and equity securities and other securities or instruments for which reliable market quotationsare not available, are valued by the applicable general partner using valuation methodologies applied on a consistent basis. These securities may initially be valued at the acquisition price as the best indicator of fair value. The applicablegeneral partner reviews the significant unobservable inputs, valuations of comparableinvestments and other similar transactionsfor investments valued at acquisitionprice to determine whether another valuation methodology should be utilized. Subsequent valuations will depend on facts and circumstances known as of the valuation date and the application of valuation methodologies further described below under “Non Publicly Traded Equity Investments” and “Non Publicly Traded Real Estate Investments.” The fair value may also be based on a pending transaction expected to close after the valuation date. These valuation methodologies involve a significantdegree of management judgment. Accordingly, valuations do not necessarily represent the amounts which may eventually be realized from sales or other dispositions of investments. Fair values may differ from the values that would have been used had a ready market for the investment existed, and the differences could be material to the applicable fund’s financialstatements.
Exchange Traded Investments
Securities listed on one or more national securities exchanges are valued at their last reported sales price on the date of valuation. If no sale occurred on the valuation date, the security is valued at the mean of the last “bid” and “ask” prices on the valuation date. Securities that are not marketable due to legal restrictions that may limit or restrict transferability are generally valued at a discount from quoted market prices. The discountwould reflect the amount market participants would require due to the risk relating to the inability to access a public market for the security for the specified period and would vary depending on the natureand durationof the restriction and the risk and volatility of the underlying securities. Securities with longer duration restrictions or higher volatility are generally valued at a higher discount. Such discounts are generally estimated based on put option models or analysis of market studies. Instances where discounts have been applied to quoted prices of restricted listed securities have been infrequent. The impact of such discounts is not material to the applicable fund’s financial statements.
OAKTREE REAL ESTATE OPPORTUNITIES FUND VII, L.P. Confidential
Appendix: Performance Disclosures (continued)
Credit Oriented Investments (including Real Estate Loan Portfolios)
Investments in corporate and government debt which are not listed or admitted to trading on any securities exchangeare valued at the mean of the last bid and ask prices on the valuation date based on quotations supplied by recognized quotation services or by reputable broker dealers.
The market yield approach is considered in the valuation of non publicly traded debt investments, utilizing expected future cash flows, discounted using estimated current market rates. Discounted cash flow calculations may be adjusted to reflect current market conditions and/or the perceived credit risk of the borrowers. Consideration is also given to a borrower’s ability to meet principal and interest obligations; this may include an evaluation of collateral or the underlying value of the borrower utilizing techniques described below under “Non Publicly Traded Equity Investments” and “Non Publicly Traded Real Estate Investments.”
The valuation of securities may be impacted by expectations of investors’ receptiveness to a public offering of the securities, the size of the holding of the securities and any associated control, information with respect to transactions or offers for the securities (including the transaction pursuant to which the investment was made and the period of time elapsed from the date of the investment to the valuation date) and applicable restrictions on the transferability of the securities.
Non Publicly Traded Equity Investments
The fair values of private equity investments are determined by using a market approach or income approach. A market approachutilizes valuations of comparable public companies or transactions and generally seeks to establish the enterprise value of the portfolio company using a market multiple approach. This approach takes into account a specific financial measure (such as EBITDA, adjusted EBITDA, free cash flow, net operating income, net income, book value or net asset value) believed to be most relevant for the given company. Consideration may also be given to such factors as acquisition price of the security, historicaland projected operational and financial results for the portfolio company, the strengths and weaknesses of the portfolio company relative to its comparable companies, industry trends, general economic and market conditions and other factors deemed relevant. The income approach is typically a discounted cash flow method that incorporates expected timing and level of cash flows.
It incorporates assumptions in determininggrowth rates, income and expense projections, discount rates, capital structure, terminal values and other factors. The applicability and weight assigned to market and income approachesare determined based on the availability of reliable projections and comparable companies and transactions.
Non Publicly Traded Real Estate Investments
The fair values of real estate investments are determined by using a cost approach,market approach or income approach. A cost approachis based upon the current cost of reproducing a real estate investment less deterioration and functionaland economic obsolescence. A market approach utilizes valuations of comparable properties or transactions and generally seeks to establish the enterprise value of investment property using a market multiple approach. This approach takes into accounta specific financial measure (such as free cash flow, net operating income, net income, book value, net asset value, EBITDA or adjusted EBITDA) believed to be most relevant for the given investment property. Consideration may also be given to such factors as acquisition price of investment property, historicaland projected operational and financialresults for the property, the strengths and weaknesses of the investment property relative to comparable properties, industry trends, geographical factors, general economic and market conditionsand other factors deemed relevant. The income approach
is typically a discountedcash flow method that incorporates expected timing and level of cash flows. It incorporates assumptions in determining growth rates, income and expense projections, discount and capitalization rates, capital structure, and other factors. The applicability and weight assigned to market and income approaches are determined based on the availabilityof reliable projections and comparable properties and transactions.
valuation of unrealized investments
The performanceinformation set forth herein containsvaluations of investments in companies that have not been fully realized as of September 30, 2014. There can be no assurancethat any of these valuations will be attained as actual realized returns will depend upon, among other factors, future operating results, the value of the assets and market conditions at the time of disposition, any related transaction costs and the timing and manner of sale, all of which may differ from the assumptions upon which the valuations contained herein are based. Consequently, the actual realized returns may differ materially from the current returns indicated in this presentation. Nothing contained herein should be deemed to be a prediction or projection of future performance.
internal rate of return
The internal rates of return (“IRR”) are the annualized implied discount rate calculated from a series of investment cash flows. It is the return that equates the present value of all capital invested in an investment to the present value of all returns of capital, or the discount rate that will provide a net present value of all cash flows equal to zero. Gross IRRs represent returns before the allocation of management fees, any expenses and any incentivefees or “carried interest” paid, accrued or allocated to the general partner or investment manager of the funds and accounts. Net IRRs represent returns after the allocation of management fees, all expenses of the funds and accounts and any incentivefees or “carried interest” paid, accrued or allocated to the general partner or investment manager of the funds and accounts. Because the “carried interest” allocated to the general partners of the relevant funds is not calculated on an investment by investment basis, but on an aggregate fund by fund basis only, comparableafter fee IRRs on an investment by investment basis are not available. As such, all net IRRs presented herein are on a fund level basis only. The use of other calculation methodologies including different assumptions or methods may result in different and possibly lower IRRs. Furthermore, IRRs for funds or accountsin existence and investments held for less than one year may not be meaningful.
no benchmark
No benchmarksare presented in this presentation, as Oaktree is not aware of any benchmarksthat, in Oaktree’s opinion, provide a basis for measuring the performanceof the relevant funds, particularly in light of the managers’ investment philosophy, strategy and implementation.
OAKTREE REAL ESTATE OPPORTUNITIES FUND VII, L.P. Confidential
This page intentionally left blank
Related Real Estate Fund II & III

November 2021
This material contains confidential and/or privileged information. If you are not the intended recipient, please notify the s ender immediately and destroy the contents. Any unauthorized copying or distribution of this material is strictly prohibited. This material is for informat ional purposes only and it is not an offer to sell or a solicitation of any offer to buy shares or interests in a fund.
Related Companies Overview
Vertically Integrated Investor & Operator
• One of the largest real estate investment and development platforms in t he U.S. with over $60 billion of owned, managed, and under construction real estate
• Founded in 1972, the Related Companies, L.P. (“Related”) has approximately 3,800 employees globally
• Related Fund Management (“RFM”) is the investment management affiliate of Related
• S EC-registered investment adviser
Real Estate Fund Management
• Headquartered in New York; 40+ professionals
• $10.3 billion1 assets under management
• Diversifiedinvestor base ofpublicand private pensionplans, endowments, family offices, andsovereignwealth funds
Operating Portfolio
Property Management
Sales & Marketing
Real Estate Development
• $60+ billion real estate portfolioownedand/ormanaged and under construction comprisedof multifamily, luxuryresidential,affordable and workforce housing, office, mixed-use, retailandhotelproperties
• Continuouslyreinvesting in operatingportfolio in order to createadditional value
• Fullrangeofpropertymanagement services provided to a portfolioofover 78, 500apartmentsandover30 million SF of commercial,retail, and mixed usespace
• In hous e team conducts sales andmarketing activities for all ofRelated’s properties
• Access to real time marketdataacrossRelated’sportfolio
• Innovator in mixed-use development transformative projectsinclude Hudson Yardsand Time WarnerCenter in New York
• Premierdeveloperof luxury & affordableresidential, mixed use, office, retail, andhotelproperties
(1) Includesv alueof existing investmentanduncalledcapital commitments asofSeptember30, 2021
Related Real Estate Fund II & III Investment Strategy
Target New York, Boston, Chicago, Los Angeles, San Francisco and South Florida
Identify markets with supply constraints and access to intellectual capital
Additional focus on certain highly -desirable secondary markets with strong demographics (“18 hour cities)
Vertically integratednationalplatform with experienced construction, developmentacquisitions andasset management staff as well as in-houseleasing, sales, andmarketingteams
− Extensive propertymanagementplatformservicingover78, 500 apartments and over30 million square feet ofcommercial, retail,andmixed use Invest in sectorswhere Related hassubstantial operating expertise: multifamily, condominium, office, retail,mixed use, andhotel
Platform
Sector
Leverage Related
and
Expertise
LeverageRelated’s national platform and relationships
Create Core Product Create i nstitutional quality assets and exit into liquid market
assets
Fix broken
orpoorly executedbusiness plans to create cash flowing,stabilizedinvestmentgrade assets Capitalizeoninvestordemand for core assets in gateway cities
Focus on Select Group of Gateway Cities and Other Markets
assets
Target
in U.S. gateway cities and major urban markets − Focus on cities where Related has a local presence
Related Real Estate Fund II (2015 Vintage)
Overview – as of September 30, 2021
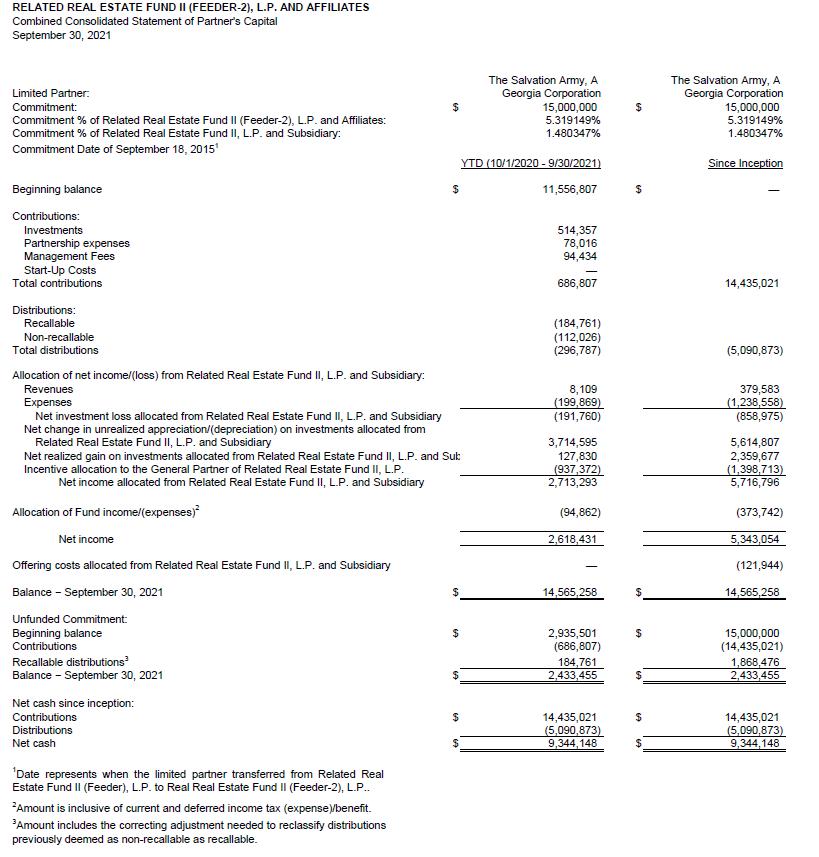
• Fund II is a $1.0 billion Fund raised to invest in opportunistic real estate investments
• The Salvation Army Southern Territory committed $15 million to Related Real Estate Fund II on June 10, 2015
• Please note this Capital Statement was prepared using best estimates
Related Real Estate Fund II
Schedule of Investments – as of September 30, 2021

Related Real Estate Fund III (2019 Vintage)
Overview
– as of September 30,
2021
• Fund III is a $1.9 billion Fund raised to invest in opportunistic real estate investments
• The Salvation Army Southern Territory committed $20 million to Related Real Estate Fund III on August 5, 2019

• Please note this Capital Statement was prepared using best estimates
Related Real Estate Fund III
Schedule of Investments – as of September 30, 2021

This page intentionally left blank
SPDR® Gold Shares GLD Fact Sheet
Total Return (As of 09/30/2021)
Objective
The investment objective of the Trust is for SPDR® Gold Shares (GLD®) to reflect the performance of the price of gold bullion, less the Trust’s expenses.
The Price of Gold
The spot price for gold bullion is determined by market forces in the 24-hour global over-the-counter (OTC) market for gold. The OTC market accounts for most global gold trading, and prices quoted reflect the information available to the market at any given time. The price, holdings, and net asset value of the Gold Shares, as well as market data for the overall gold bullion market, can be tracked daily at spdrgoldshares.com
Cumulative
NAV (%) Market Value (%) LBMA Gold Price PM(%)
QTD -1.25 -0.85 -1.15
YTD -8.12 -7.93 -7.67
Annualized
1 Year -8.01 -7.28 -7.64
3 Year 13.18 13.34 13.64
5 Year 5.25 5.50 5.67 10 Year 0.33 0.38 0.73
Gross Expense Ratio‡ (%) 0.40
Performance quoted represents past performance, which is no guarantee of future results. Investment return and principal value will fluctuate, so you may have a gain or loss when shares are sold. Current performance may be higher or lower than that quoted. Visit ssga.com for most recent month-end performance.
The market price used to calculate the Market Value return is the midpoint between the highest bid and the lowest offer on the exchange on which the shares of the Fund are listed for trading, as of the time that the Fund’s NAV is calculated. If you trade your shares at another time, your return may differ.
Effective March 20, 2015, the SPDR Gold Trust (GLD) adopted the LBMA Gold Price PM as the reference benchmark price of gold in calculating the Net Asset Value (NAV) of the Trust. Prior to that date, the Trust used the London PM Fix as the reference benchmark price in calculating the NAV.
‡The gross expense ratio is the Trust’s annual operating expense ratio. See the Trust’s most recent prospectus for a definition of Trust expenses.
Management
Sponsor
World Gold Trust Services, LLC
Gold Custodian HSBC Bank plc
Trustee
Marketing Agent
BNY Mellon Asset Servicing, a division of The Bank of New York Mellon
State Street Global Advisors Funds Distributors, LLC
09/30/2021
Gold As of
Date 11/18/2004 Intraday NAV Ticker GLDIV Index Ticker N/A Key Facts Ticker Symbol GLD CUSIP 78463V107 Exchange NYSE ARCA EXCHANGE Short Sale Eligible Yes Margin Eligible Yes
Fund Information Inception
Advantages
Easily Accessible
Listed on the NYSE Arca.
Secure The Gold Shares represent fractional, undivided interests in the Trust, the sole assets of which are physical gold bullion and, from time to time, cash.
Transparent There exists a 24-hour global over-the-counter market for gold bullion, which provides readily available market data. The price, holdings and net asset value of the Gold Shares, as well as market data for the overall gold bullion market, can be tracked daily at spdrgoldshares.com
Cost Effective For many investors, the transaction costs related to the Shares are expected to be lower than the costs associated with the purchase, storage and insurance of physical gold.
Liquid Structure allows for baskets to be created and redeemed according to market demand, creating liquidity.
Flexible Gold Shares are listed on the NYSE Arca (Ticker: GLD) and trade the same way ordinary stocks do. It is possible to buy or sell Gold Shares continuously throughout the trading day on the exchange at prices established by the market. Additionally, it is possible to place market, limit and stop-loss orders for Gold Shares.
State Street Global Advisors
One Iron Street, Boston MA 02210 T: +1 866 787 2257
Important risk information
Investing involves risk, and you could lose money on an investment in SPDR ® Gold Trust (“GLD ® ” or “GLD”).
ETFs trade like stocks, are subject to investment risk, fluctuate in market value and may trade at prices above or below the ETFs’ net asset value. Brokerage commissions and ETF expenses will reduce returns.
Commodities and commodity-index linked securities may be affected by changes in overall market movements, changes in interest rates, and other factors such as weather, disease, embargoes, or political and regulatory developments, as well as trading activity of speculators and arbitrageurs in the underlying commodities.
Frequent trading of ETFs could significantly increase commissions and other costs such that they may offset any savings from low fees or costs.
Diversification does not ensure a profit or guarantee against loss.
Investing in commodities entails significant risk and is not appropriate for all investors.
Important Information Relating to GLD: GLD has filed a registration statement (including a prospectus) with the Securities and Exchange Commission (“SEC”) for the offering to which this communication relates. Before you invest, you should read the prospectus in that registration statement and other documents GLD has filed with the SEC for more complete information about GLD and this offering. Please see the GLD prospectus for a detailed discussion of the risks of investing in GLD shares. When distributed electronically, the GLD prospectus is available by clicking here .
You may get these documents for free by visiting EDGAR on the SEC website at sec.gov or by visiting spdrgoldshares. com . Alternatively, GLD or any authorized participant will arrange to send you the prospectus if you request it by calling 866.320.4053.
GLD is not an investment company registered under the Investment Company Act of 1940 (the “1940 Act”) and is not subject to regulation under the Commodity Exchange Act of 1936 (the “CEA”). As a result, shareholders of GLD do not have the protections associated with ownership of shares in an investment company registered under the 1940 Act or the
protections afforded by the CEA. GLD shares trade like stocks, are subject to investment risk and will fluctuate in market value. The value of GLD shares relates directly to the value of the gold held by GLD (less its expenses), and fluctuations in the price of gold could materially and adversely affect an investment in the shares. The price received upon the sale of the shares, which trade at market price, may be more or less than the value of the gold represented by them. GLD does not generate any income, and as GLD regularly sells gold to pay for its ongoing expenses, the amount of gold represented by each Share will decline over time to that extent.
The World Gold Council name and logo are a registered trademark and used with the permission of the World Gold Council pursuant to a license agreement. The World Gold Council is not responsible for the content of, and is not liable for the use of or reliance on, this material. World Gold Council is an affiliate of GLD’s sponsor.
GLD ® is a registered trademark of World Gold Trust Services, LLC used with the permission of World Gold Trust Services, LLC. Standard & Poor’s®, S&P ® and SPDR ® are registered trademarks of Standard & Poor’s Financial Services LLC (S&P); Dow Jones is a registered trademark of Dow Jones Trademark Holdings LLC (Dow Jones); and these trademarks have been licensed for use
by S&P Dow Jones Indices LLC (SPDJI) and sublicensed for certain purposes by State Street Corporation. State Street Corporation’s financial products are not sponsored, endorsed, sold or promoted by SPDJI, Dow Jones, S&P, their respective affiliates and third party licensors and none of such parties make any representation regarding the advisability of investing in such product(s) nor do they have any liability in relation thereto.
Distributor State Street Global Advisors Funds Distributors, LLC, member FINRA SIPC an indirect wholly owned subsidiary of State Street Corporation. References to State Street may include State Street Corporation and its affiliates. Certain State Street affiliates provide services and receive fees from the SPDR ETFs.
For more information, please contact the Marketing Agent for GLD: State Street Global Advisors Funds Distributors, LLC, One Iron Street, Boston, MA, 02210; T: +1 866 320 4053 spdrgoldshares.com
Not FDIC Insured No Bank Guarantee May Lose Value
Tracking Number: 3392215.1.4.AM.RTL Expiration Date: 01/31/2022 ETF-GLD 20211014/09:26
ssga.com/etfs
Information Classification: General