Science reading comprehension Page 6 of 9
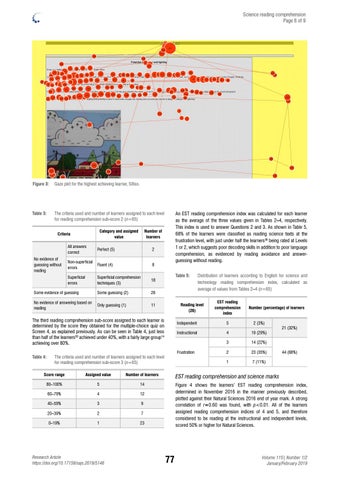
Figure 3: Gaze plot for the highest achieving learner, Sifiso.
Table 3:
An EST reading comprehension index was calculated for each learner as the average of the three values given in Tables 2–4, respectively. This index is used to answer Questions 2 and 3. As shown in Table 5, 68% of the learners were classified as reading science texts at the frustration level, with just under half the learners30 being rated at Levels 1 or 2, which suggests poor decoding skills in addition to poor language comprehension, as evidenced by reading avoidance and answerguessing without reading.
The criteria used and number of learners assigned to each level for reading comprehension sub-score 2 (n=65) Category and assigned value
Criteria
Number of learners
All answers correct
Perfect (5)
2
Non-superficial errors
Fluent (4)
8
Superficial errors
Superficial comprehension techniques (3)
18
Some evidence of guessing
Some guessing (2)
26
No evidence of answering based on reading
Only guessing (1)
11
No evidence of guessing without reading
Table 5:
Reading level (26)
The third reading comprehension sub-score assigned to each learner is determined by the score they obtained for the multiple-choice quiz on Screen 4, as explained previously. As can be seen in Table 4, just less than half of the learners30 achieved under 40%, with a fairly large group14 achieving over 80%. Table 4:
Assigned value
Number of learners
80–100%
5
14
60–79%
4
12
40–59%
3
9
20–39%
2
7
0–19%
1
23
Research Article https://doi.org/10.17159/sajs.2019/5146
EST reading comprehension index
Number (percentage) of learners
Independent
5
2 (3%)
Instructional
4
19 (29%)
3
14 (22%)
2
23 (35%)
1
7 (11%)
Frustration
The criteria used and number of learners assigned to each level for reading comprehension sub-score 3 (n=65)
Score range
Distribution of learners according to English for science and technology reading comprehension index, calculated as average of values from Tables 2–4 (n=65)
21 (32%)
44 (68%)
EST reading comprehension and science marks Figure 4 shows the learners’ EST reading comprehension index, determined in November 2016 in the manner previously described, plotted against their Natural Sciences 2016 end of year mark. A strong correlation of r=0.60 was found, with p<0.01. All of the learners assigned reading comprehension indices of 4 and 5, and therefore considered to be reading at the instructional and independent levels, scored 50% or higher for Natural Sciences.
77
Volume 115| Number 1/2 January/February 2019