A geoscience perspective on the gully erosion problem across the interior of southern Africa Stephen Tooth 22
EDITORIAL ADVISORY BOARD
Saul Dubow
Smuts Professor of Commonwealth History, University of Cambridge, UK
Pumla Gobodo-Madikizela Trauma Studies in Historical Trauma and Transformation, Stellenbosch University, South Africa
David Lokhat
Discipline of Chemical Engineering, University of KwaZulu-Natal, South Africa
Robert Morrell
School of Education, University of Cape Town, South Africa
Pilate Moyo Department of Civil Engineering, University of Cape Town, South Africa
Catherine Ngila African Foundation for Women & Youth in Education, Sciences, Technology and Innovation, Nairobi, Kenya
Daya Reddy
Applied Mathematics, University of Cape Town, South Africa
Linda Richter
DST-NRF Centre of Excellence in Human Development University of the Witwatersrand, South Africa
Brigitte Senut
Natural History Museum, Paris, France
Benjamin Smith Centre for Rock Art Research and Management, University of Western Australia, Perth, Australia
Himla Soodyall
Academy of Science of South Africa, South Africa
Lyn Wadley
School of Geography, Archaeology and Environmental Studies, University of the Witwatersrand, South Africa
Published by the Academy of Science of South Africa (www.assaf.org.za) with financial assistance from the Department of Science, Technology & Innovation
Design and layout
Lumina Datamatics
Correspondence and enquiries sajs@assaf.org.za
Copyright All articles are published under a Creative Commons Attribution Licence. Copyright is retained by the authors.
Disclaimer
The publisher and editors accept no responsibility for statements made by the authors.
Submissions
Submissions should be made at www.sajs.co.za
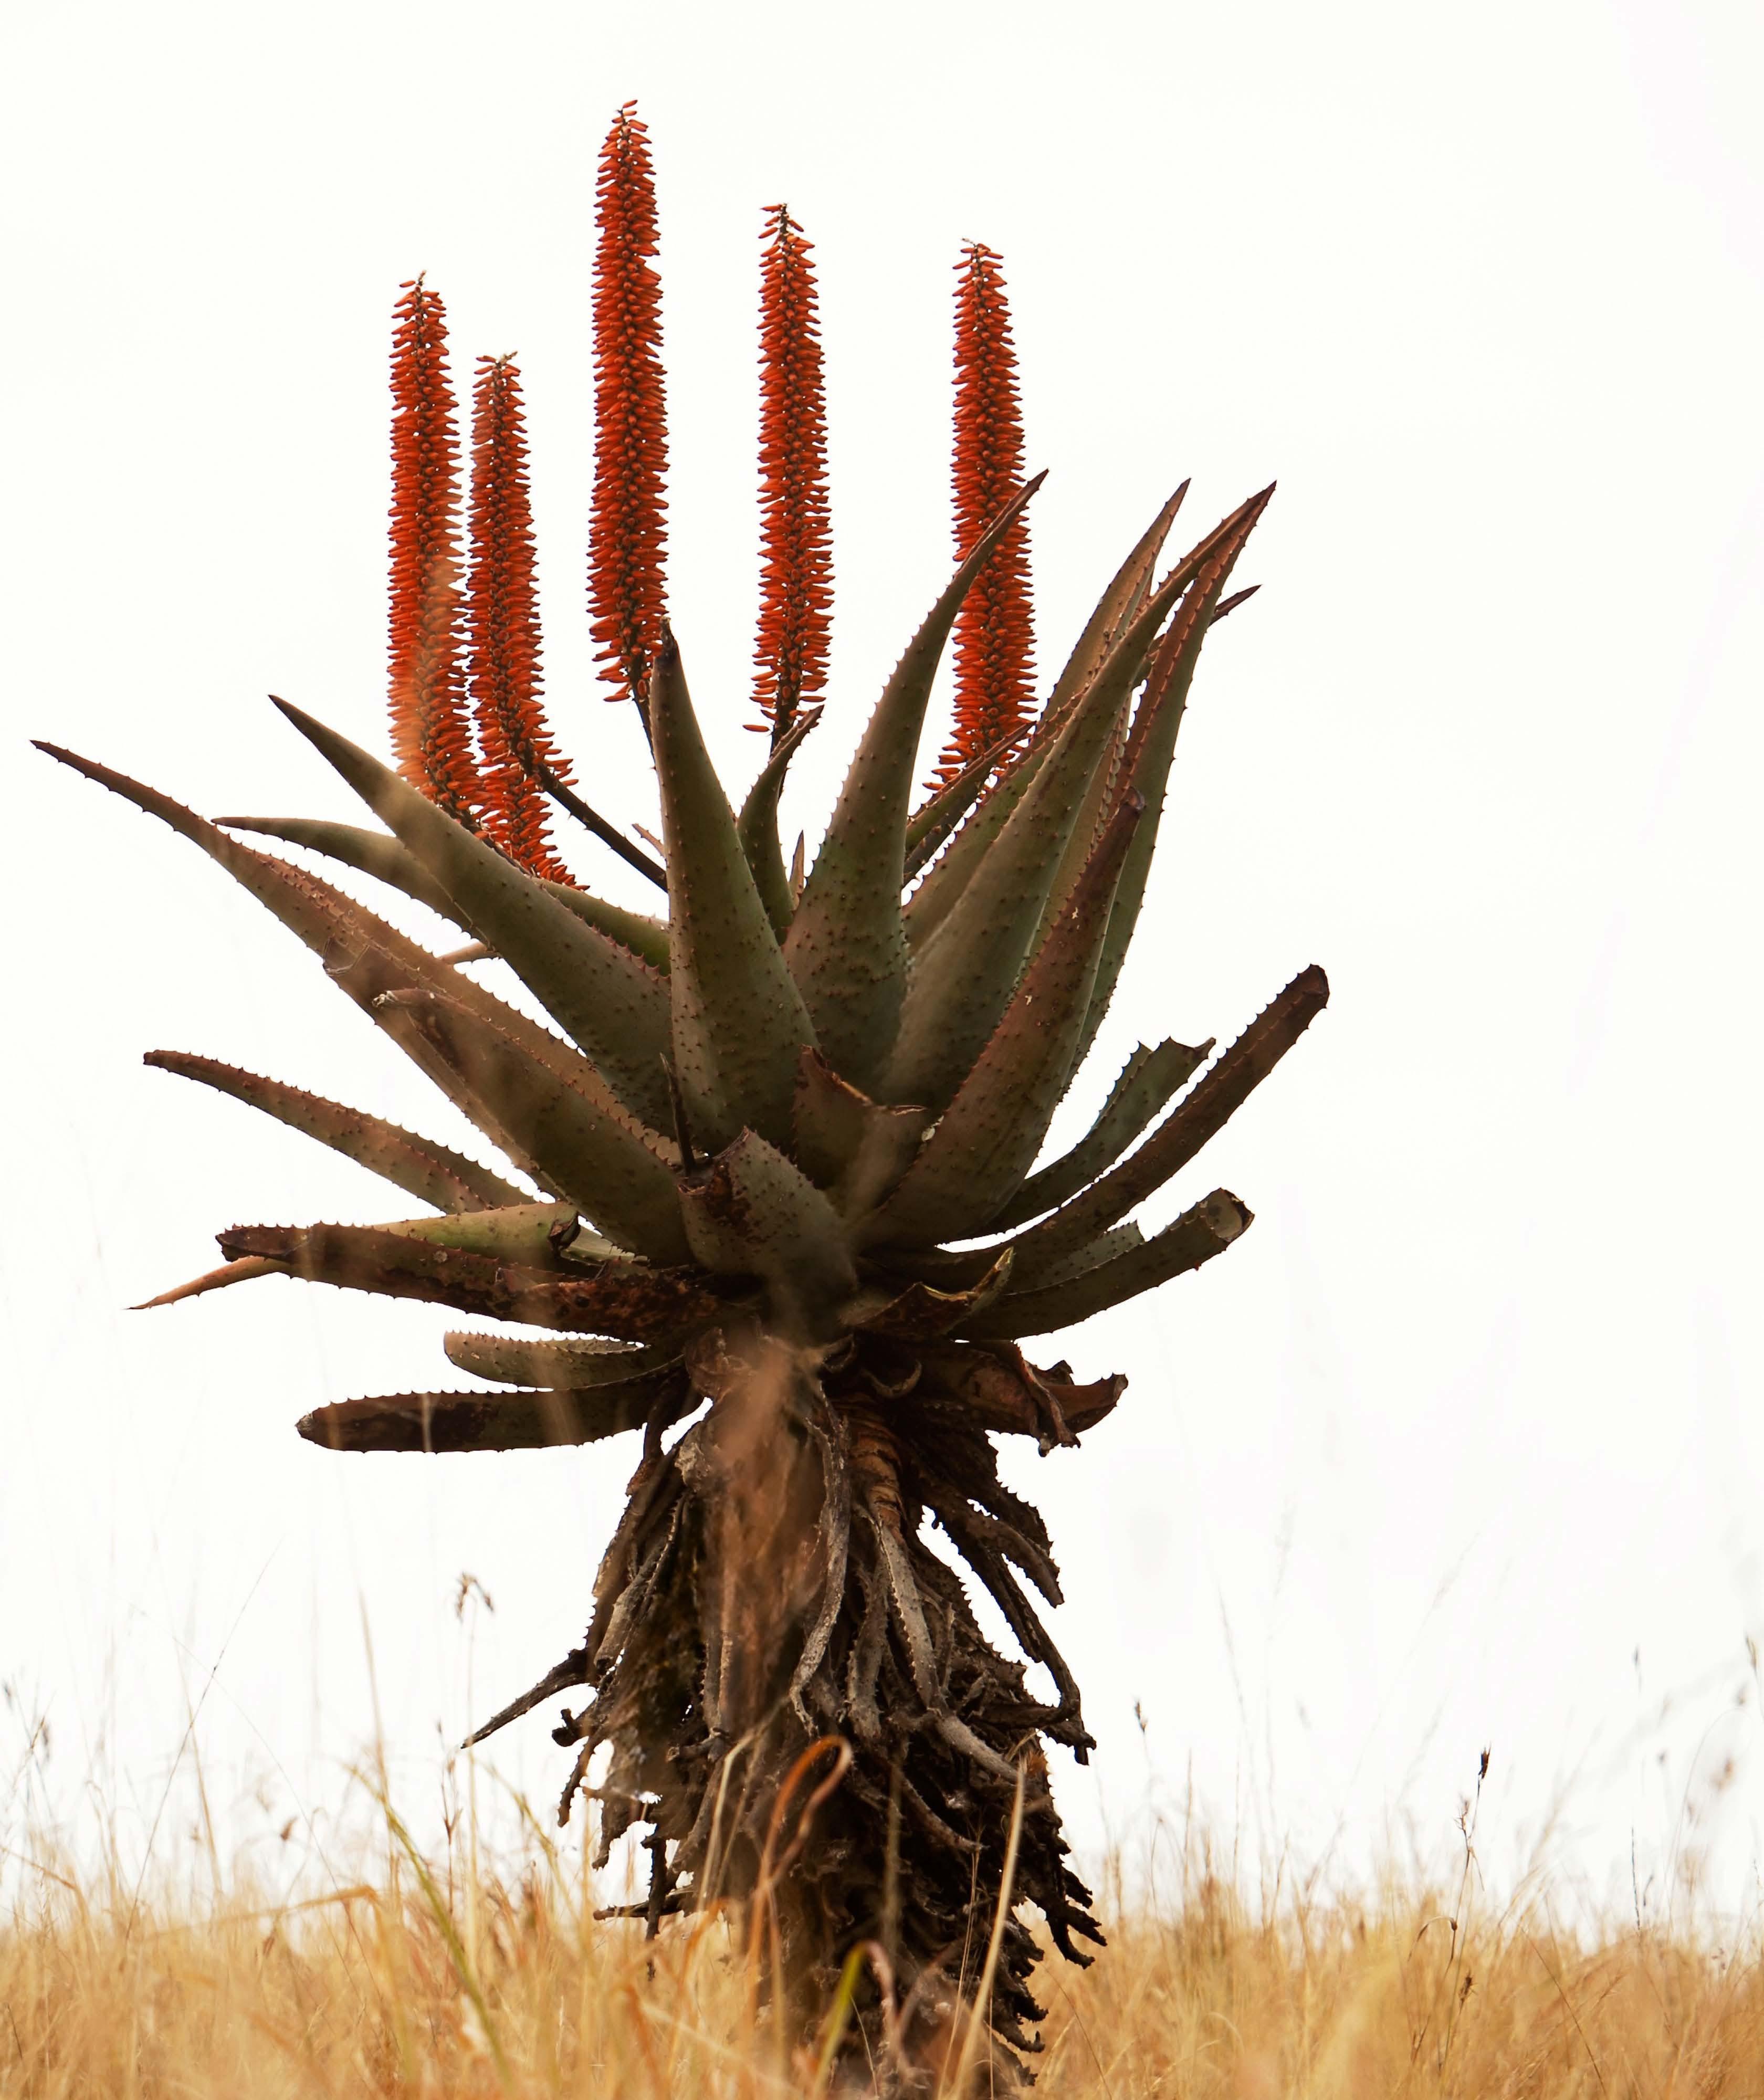
On the cover
Commentaries
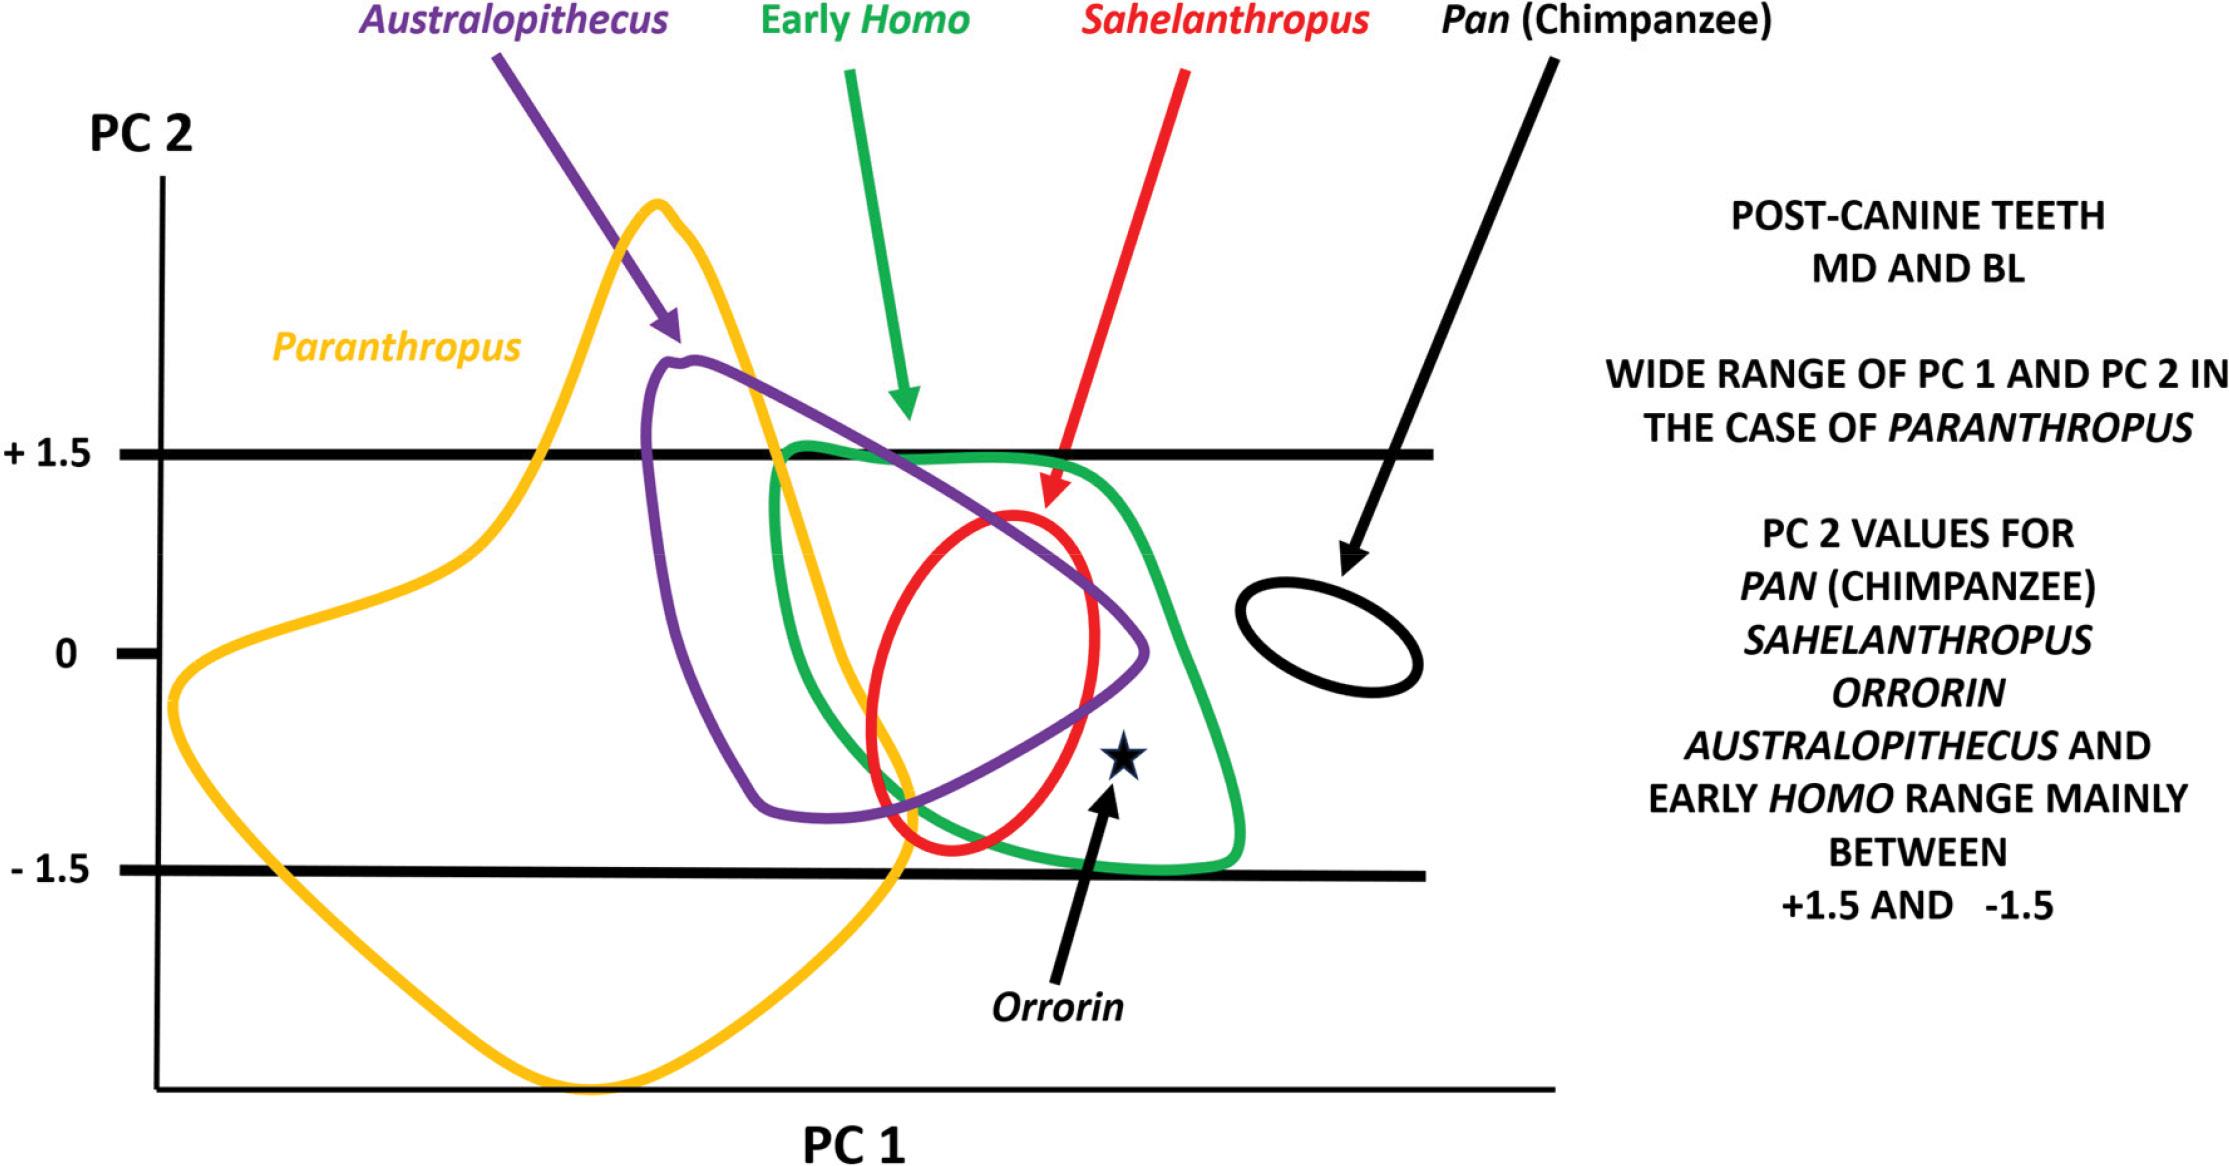
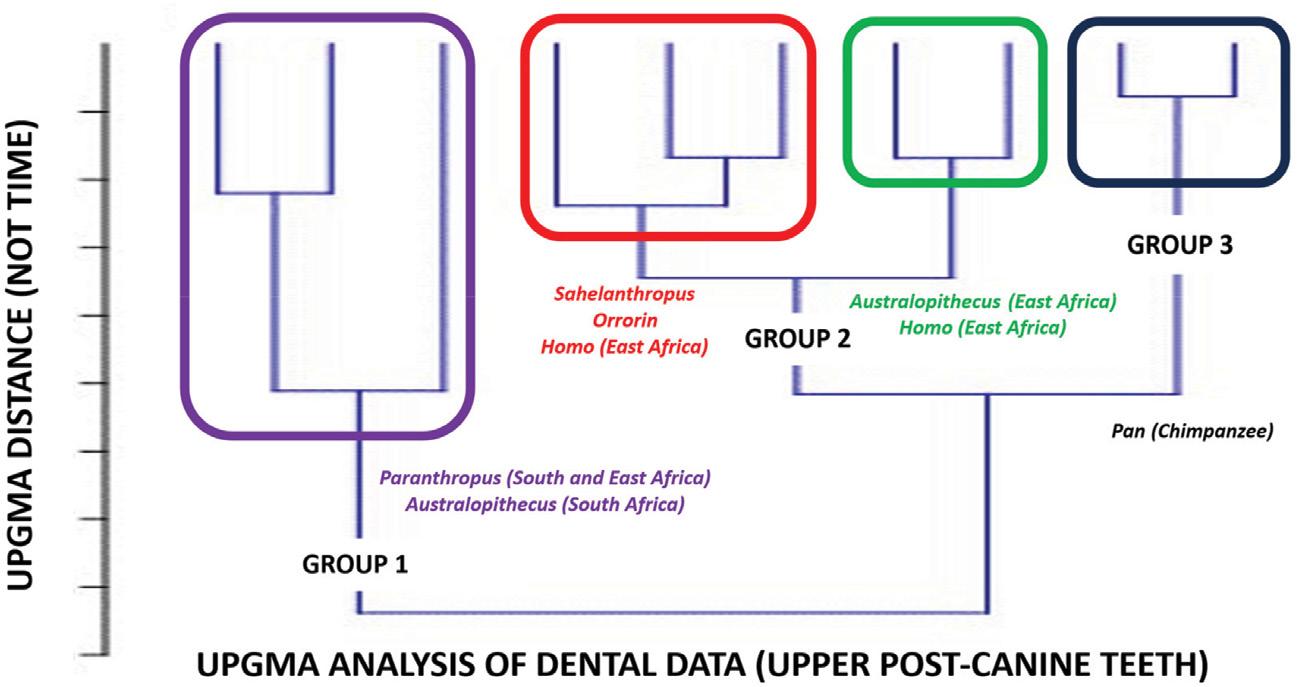
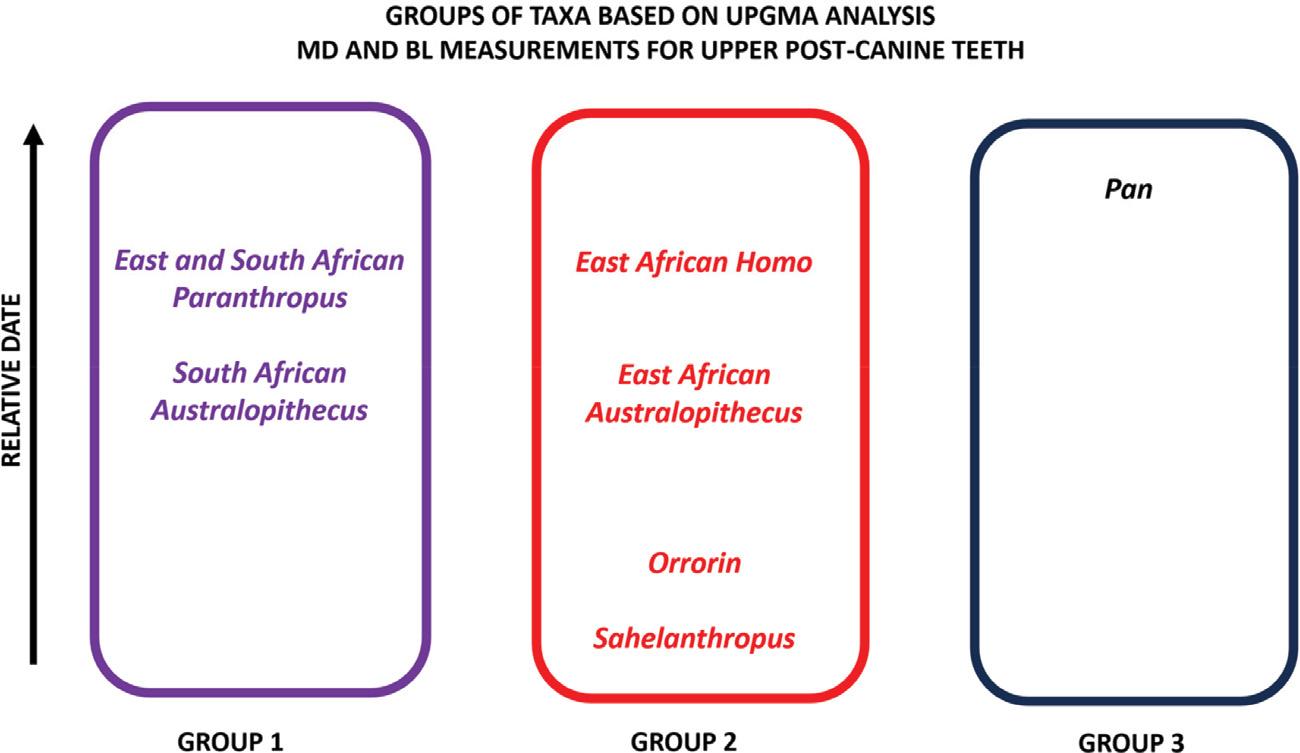
Commentary on Neves et al. (2024): Dental metrics of Sahelanthropus and other hominoids
Francis Thackeray
Reducing the chance of manuscript rejection: Tips from editors
28
Pfananani A. Ramulifho, Jennifer M. Fitchett 31
Supporting innovation to address South Africa’s socio-economic challenges: A strategic framework
Moloko G. Mathipa-Mdakane 34
Structured Conversation
The uses of evidence: Multidisciplinary insights on oppression and empowerment
Emergency abortion in South Africa: Legal access, implementation, and the role of sexual violence
Dhisha Narismulu, Marietjie Botes
Bacterial fruit tree quarantine pathogens – a threat to biosecurity in South Africa
38
44
Teresa A. Coutinho 51
Research Articles
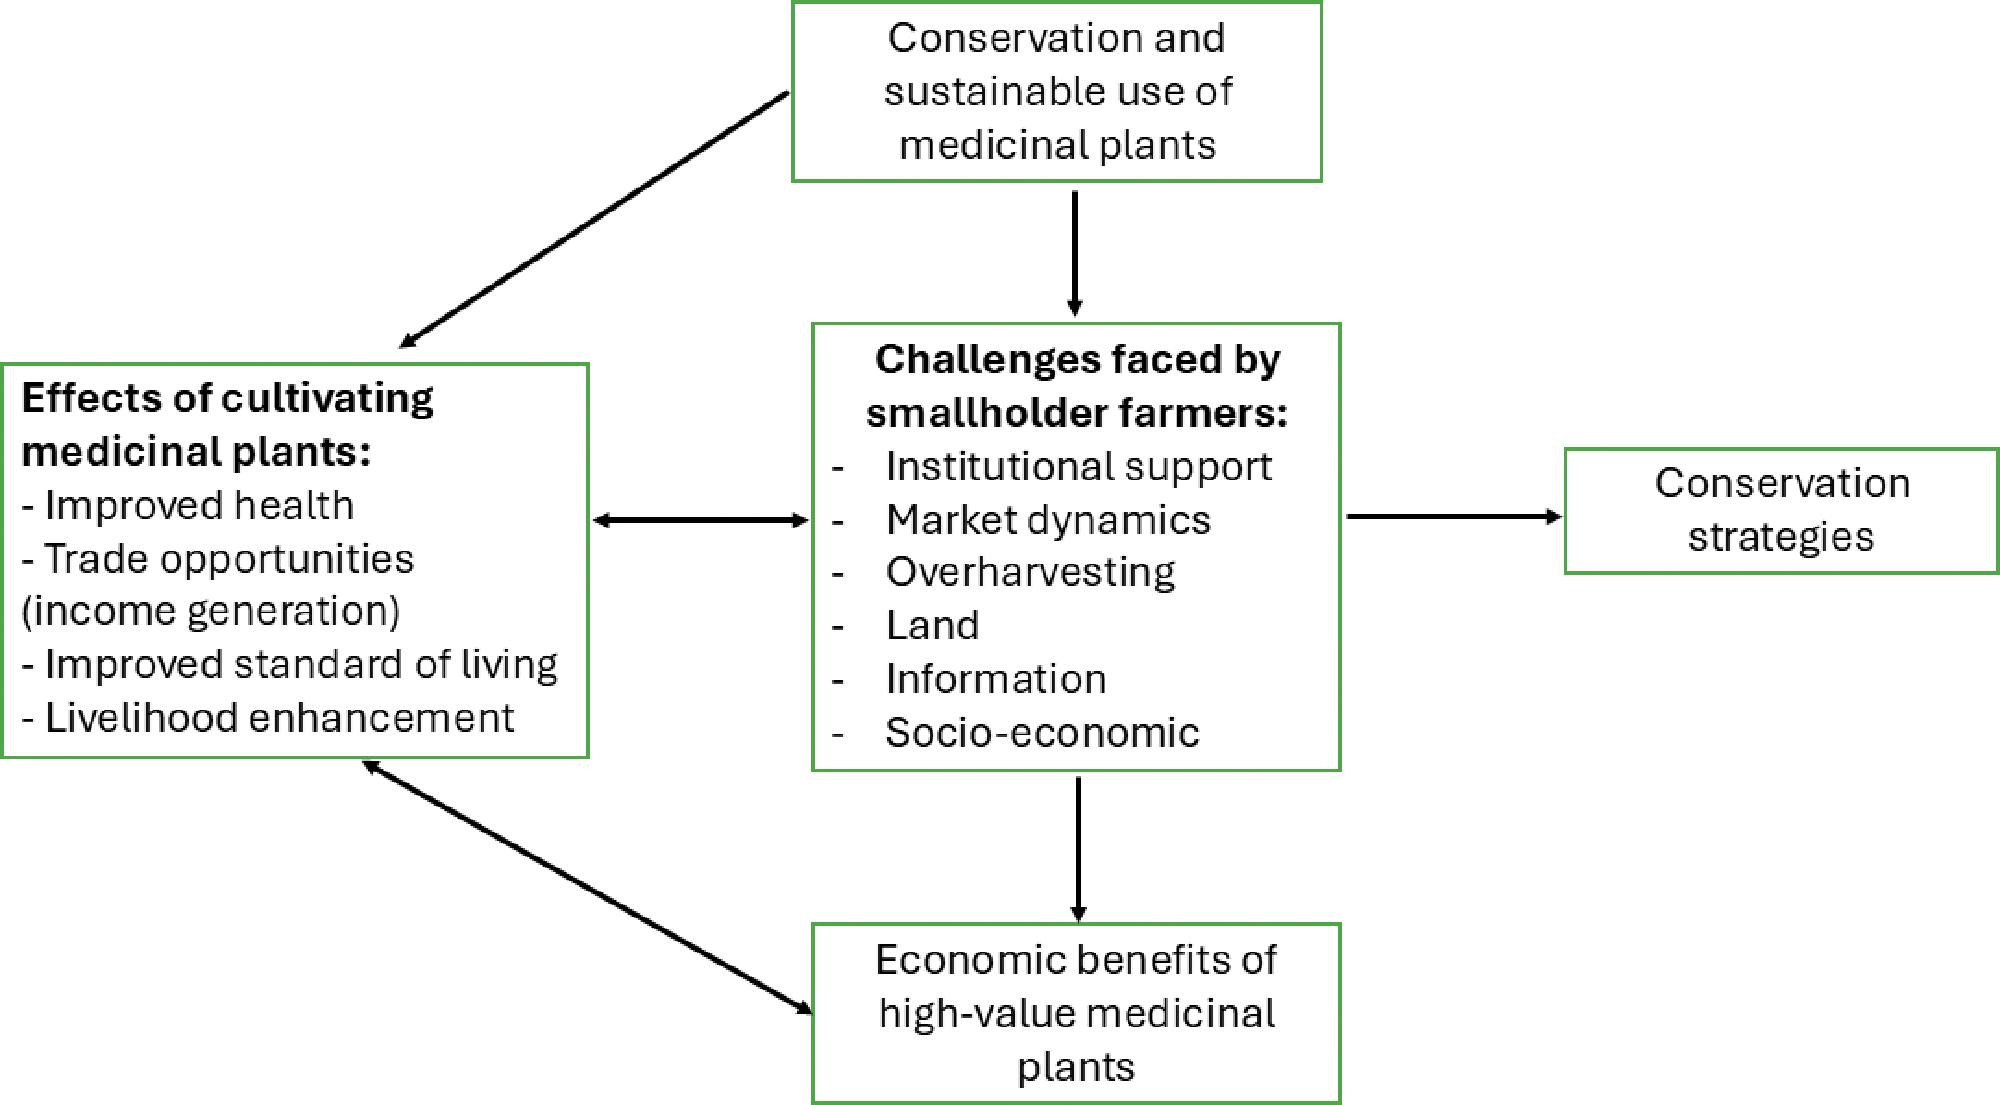
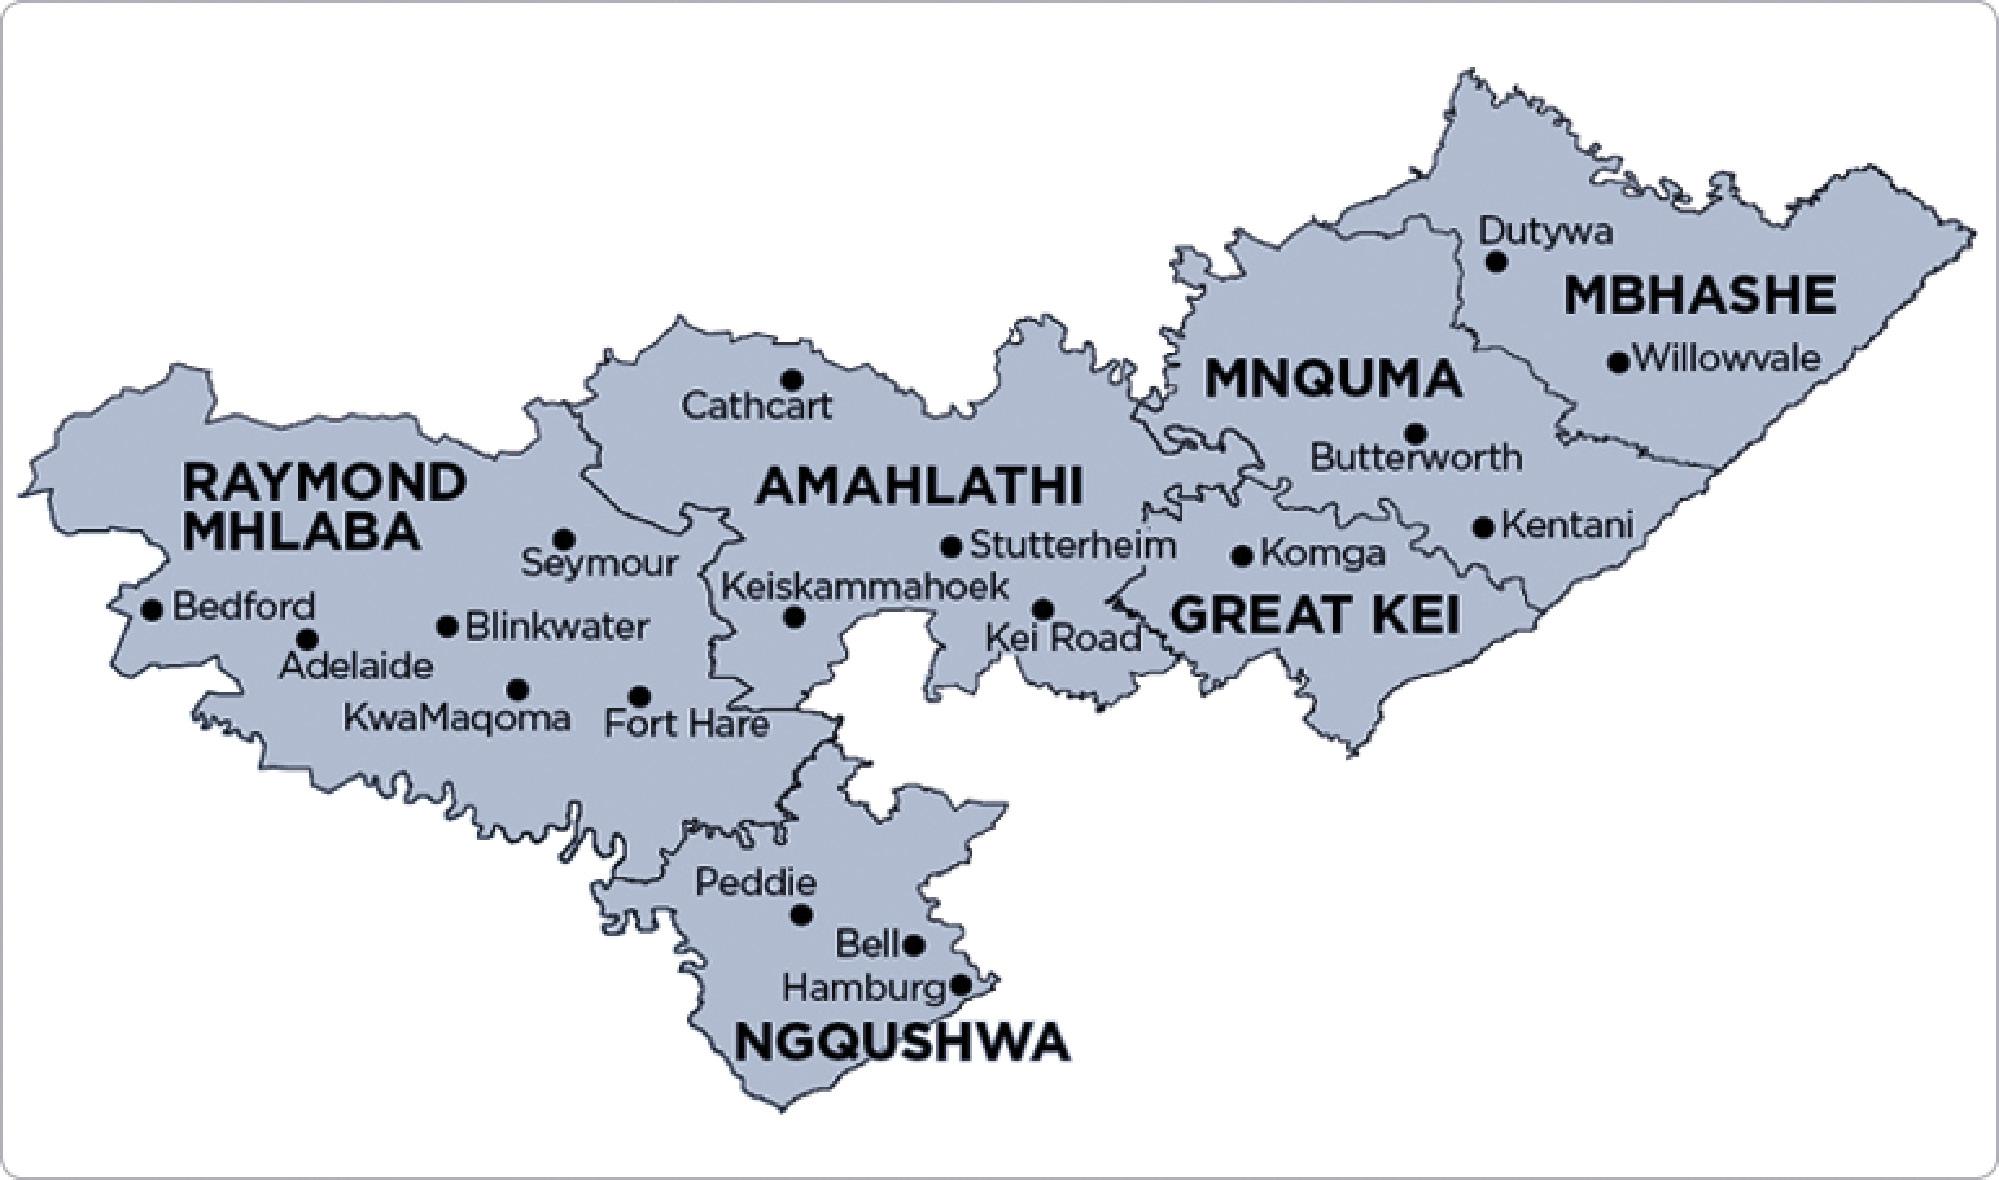
Medicinal plant cultivation and smallholder welfare in Amatole, South Africa: A propensity score analysis
Zusiphe Mbelebele, Lelethu Mdoda, Samuel S. Ntlanga, Nyarai Mujuru, Yanga Nontu 58
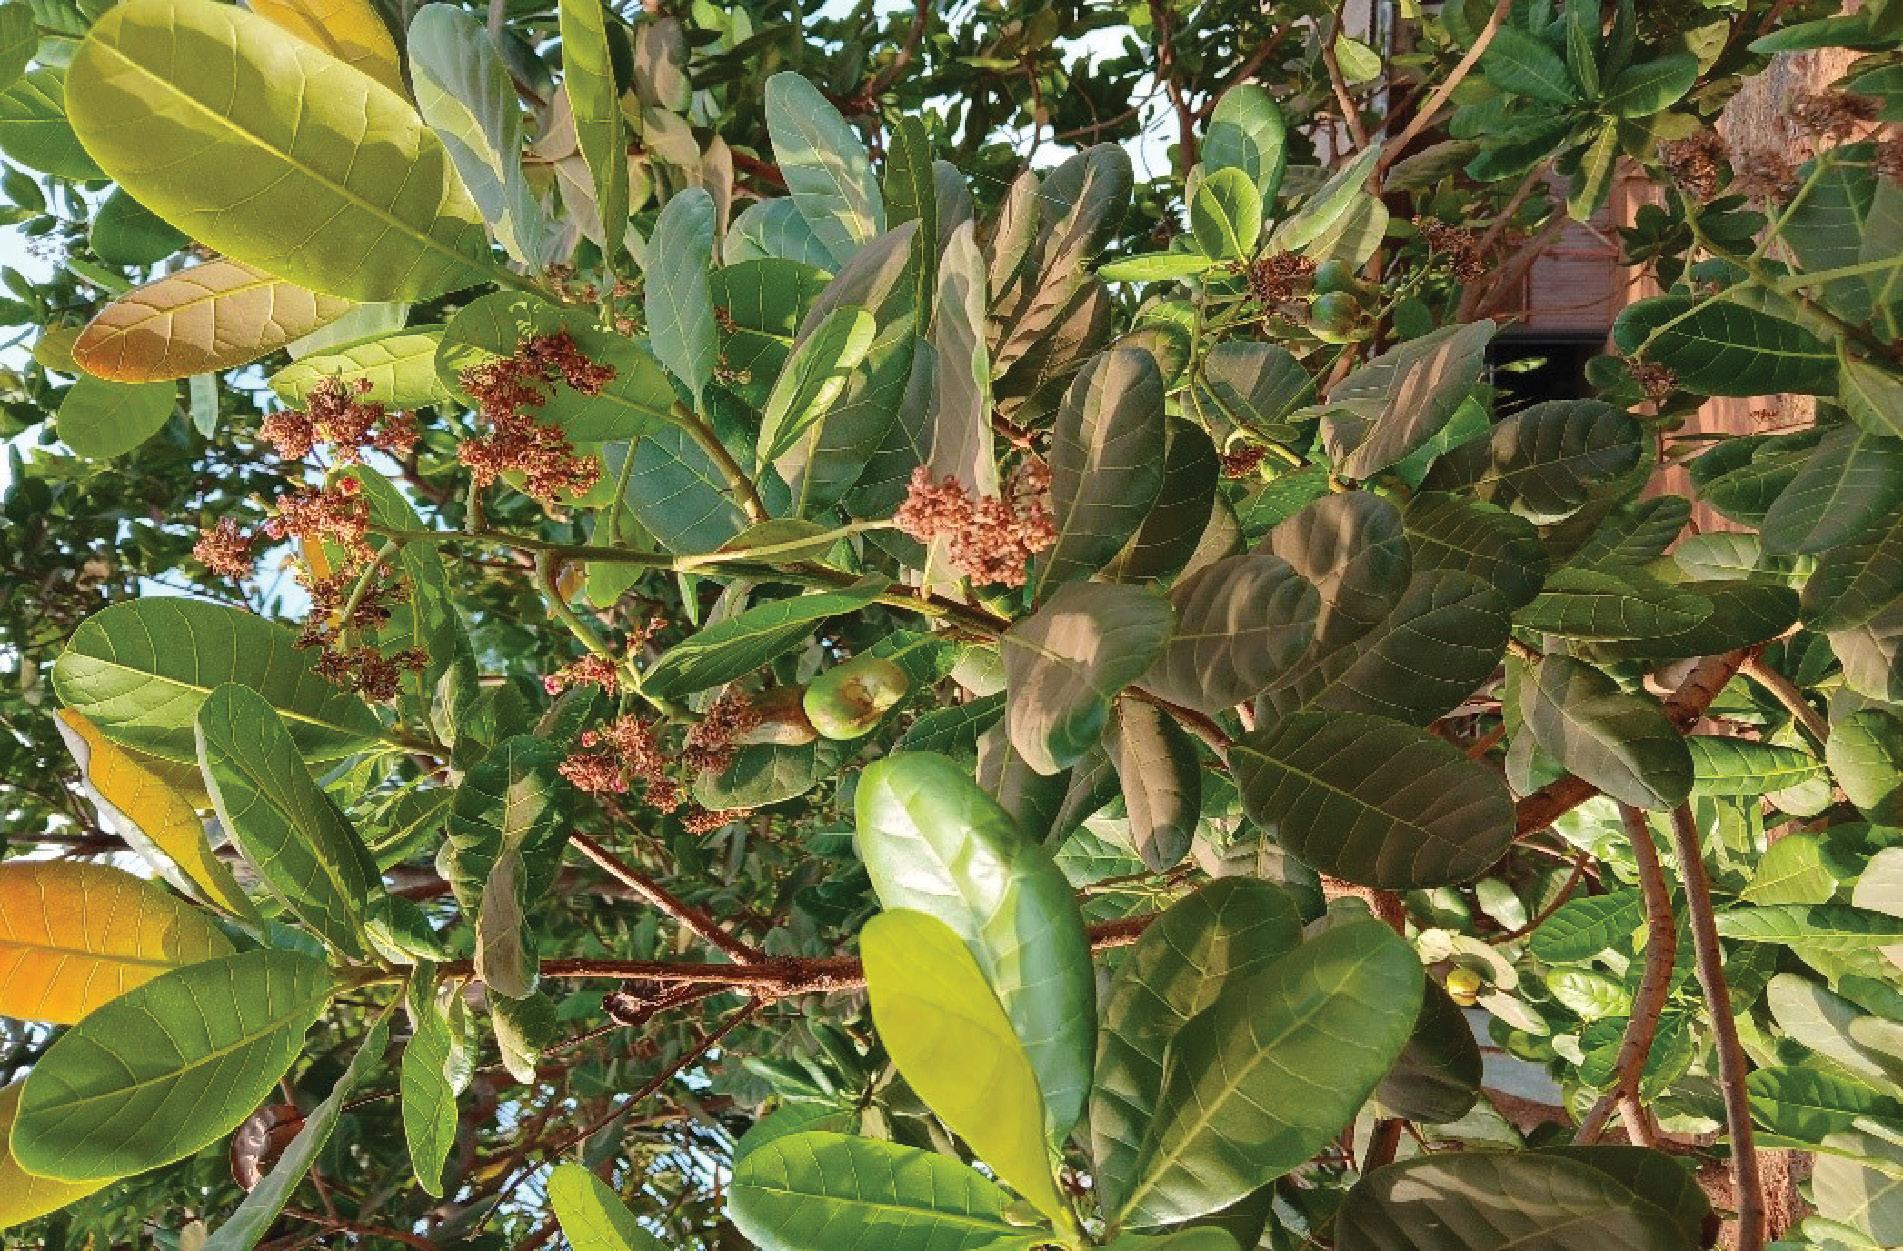
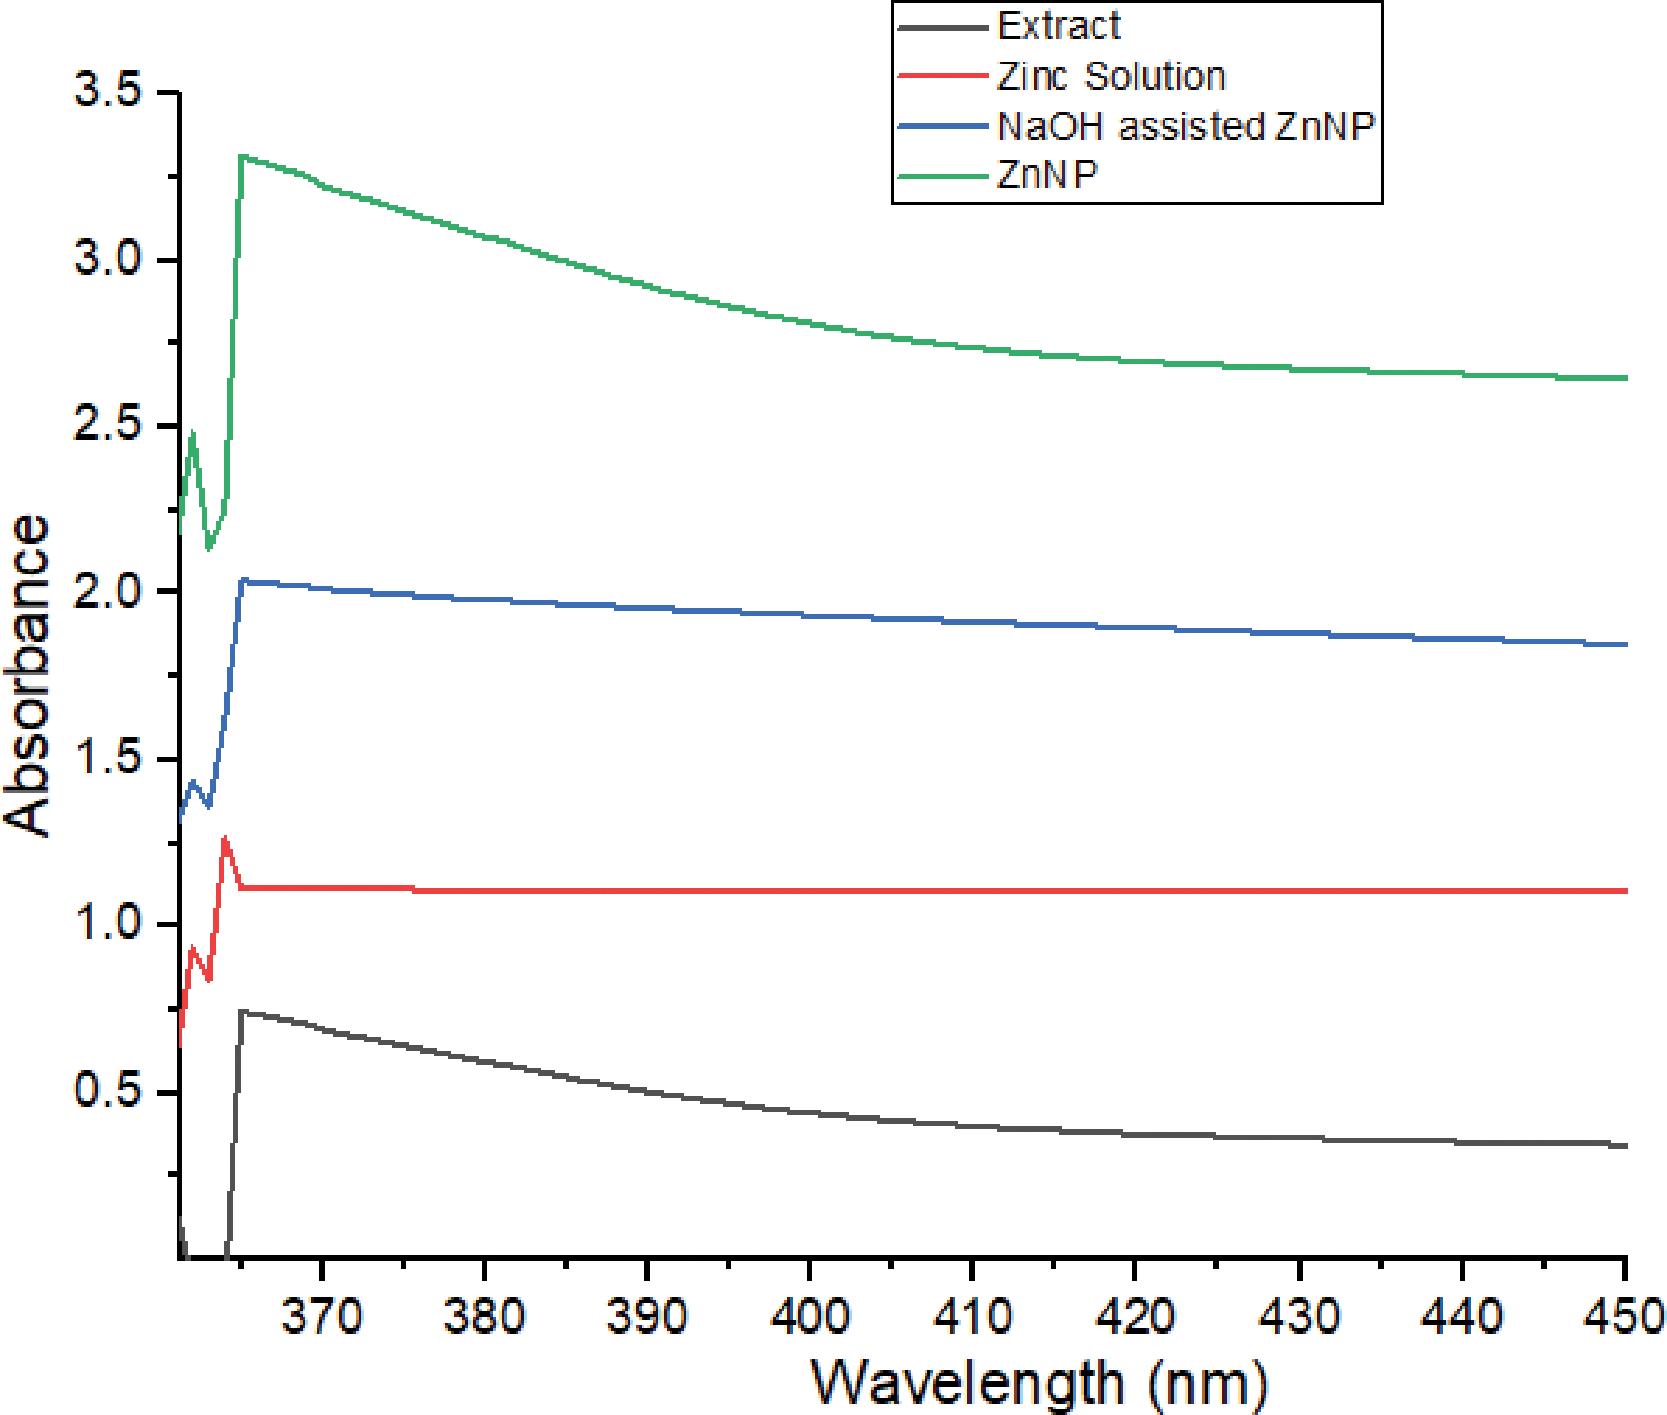
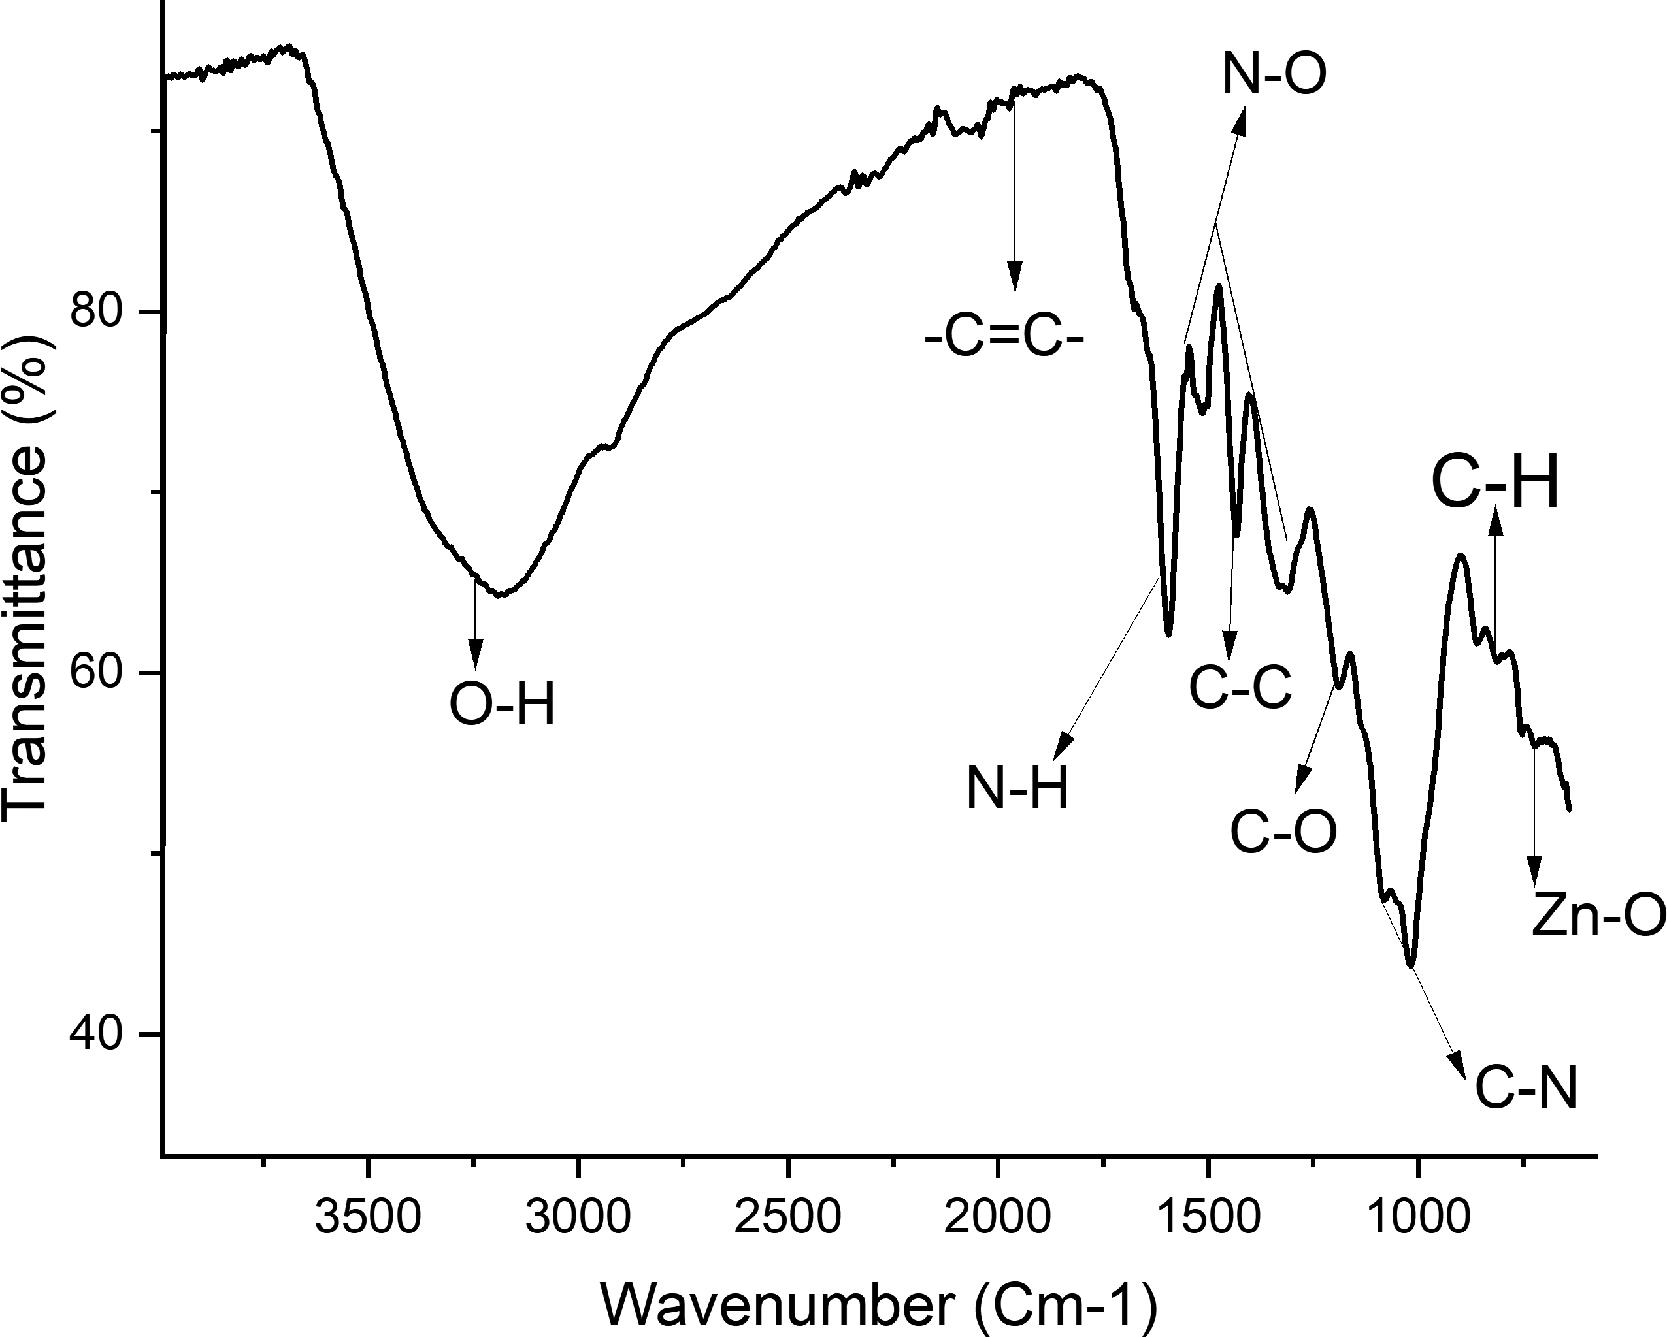
Radical scavenging and antioxidant properties of green zinc oxide nanoparticles from Anacardium occidentale leaves
Florence N. Nworah, Nancy C. Igwebuike, Ifeoma F. Chukwuma, Chigozie P. Odo, Ozoemena E. Eje 68
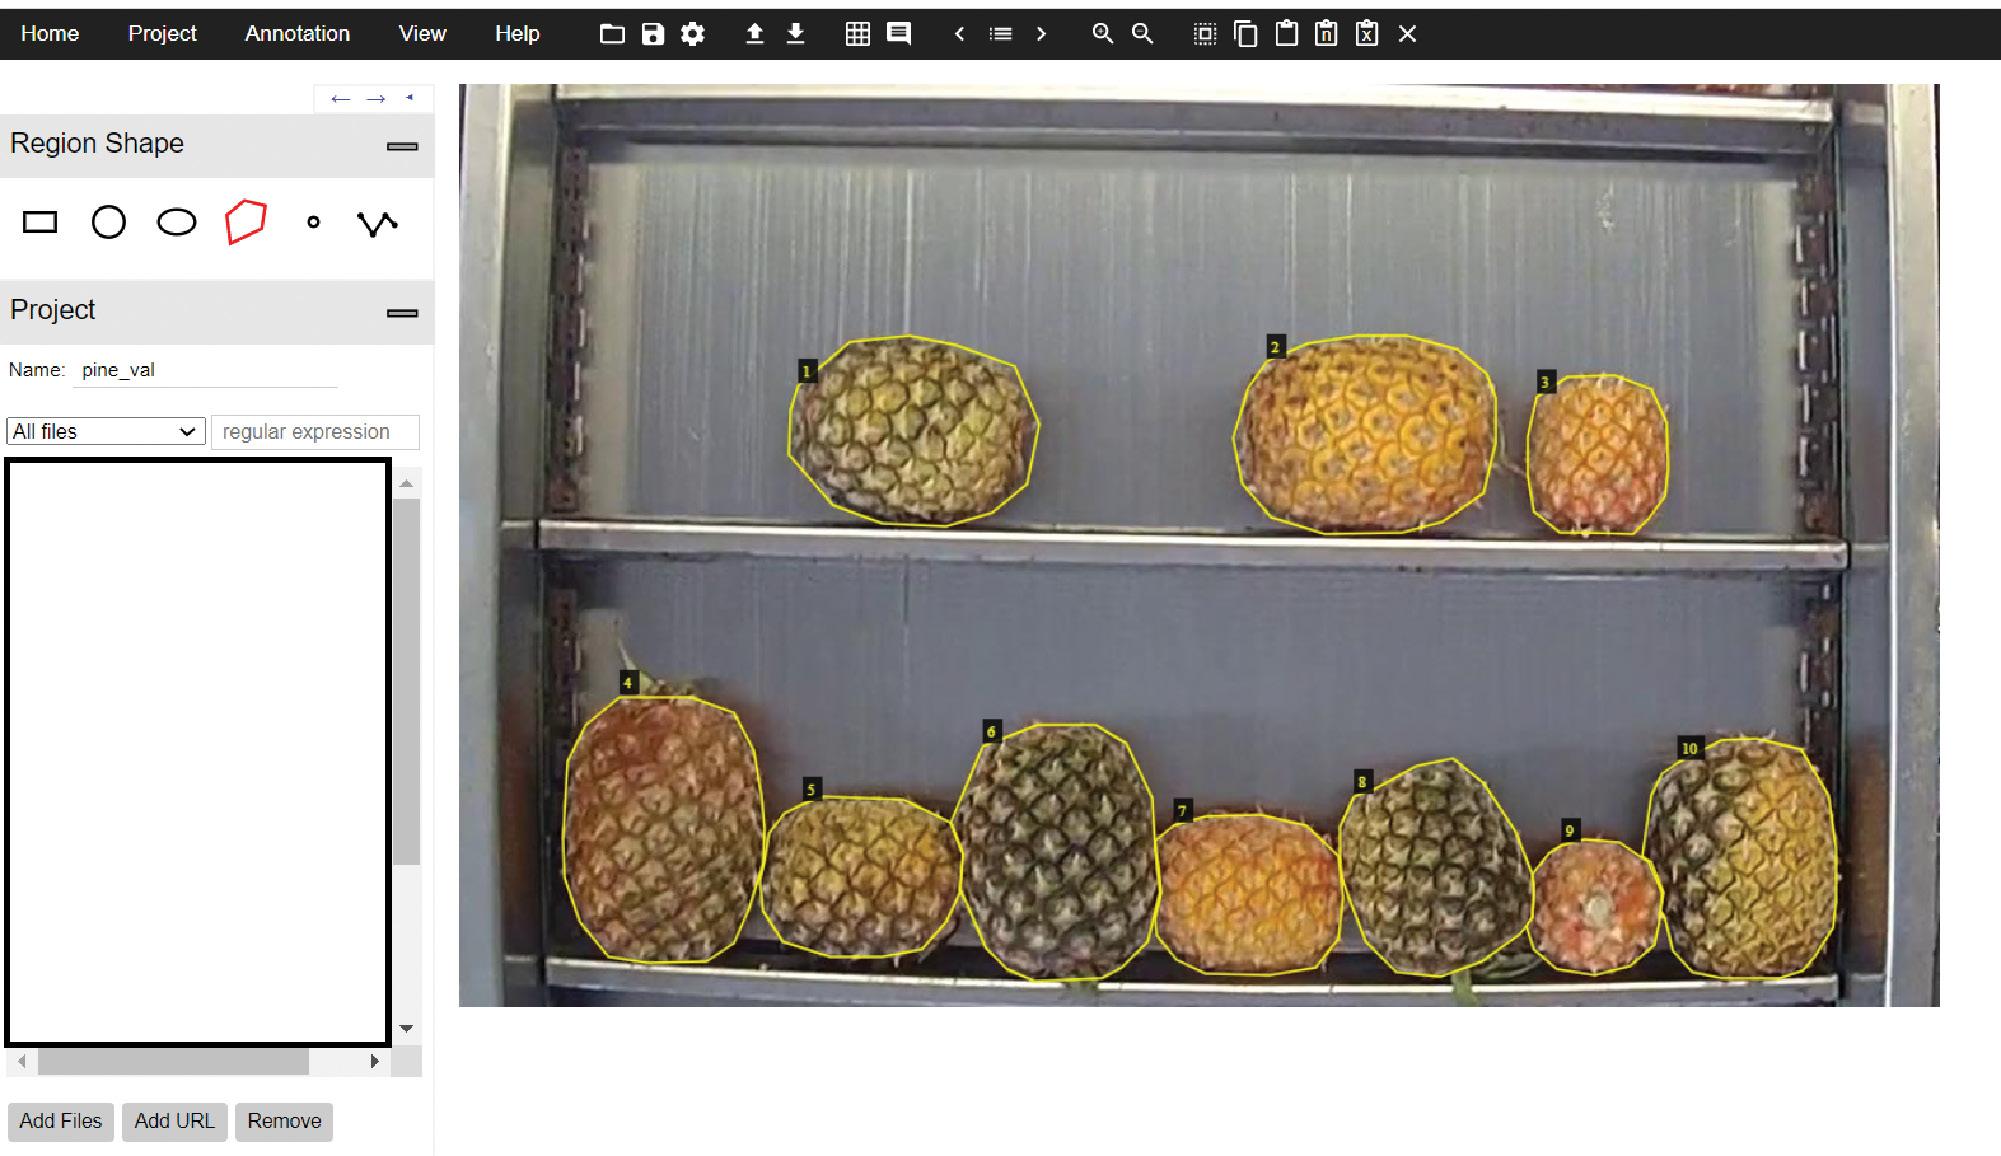
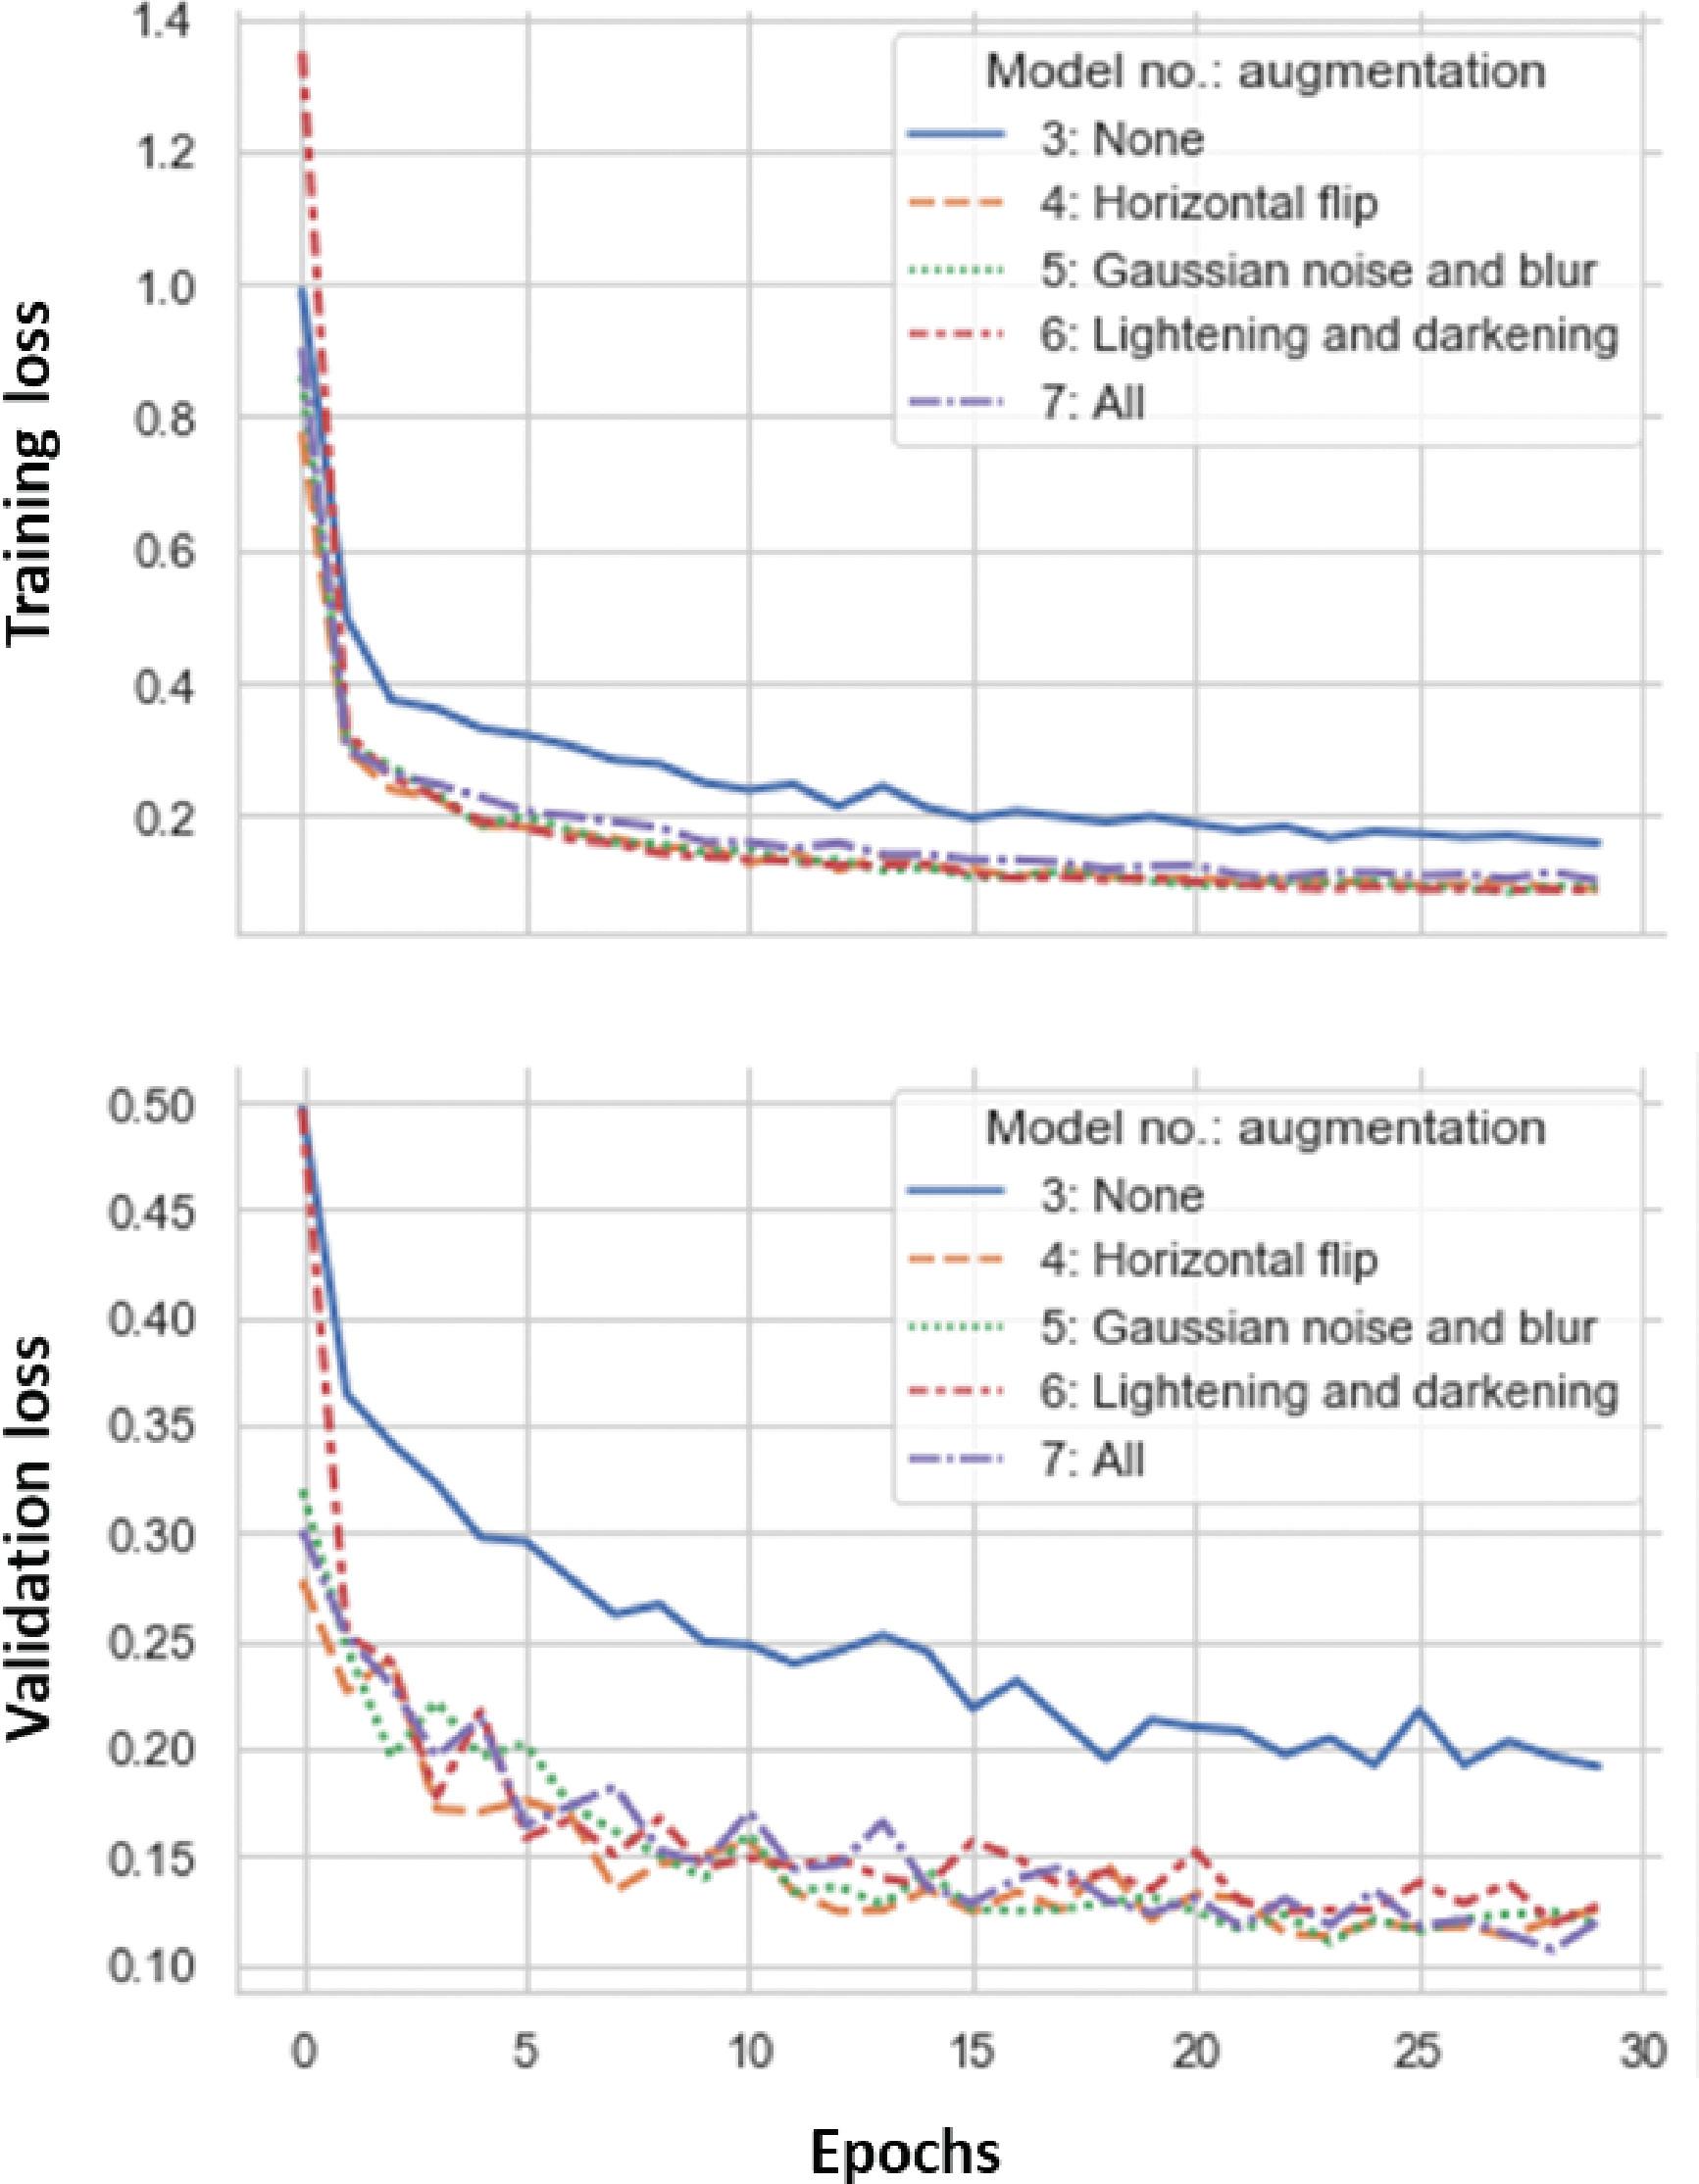
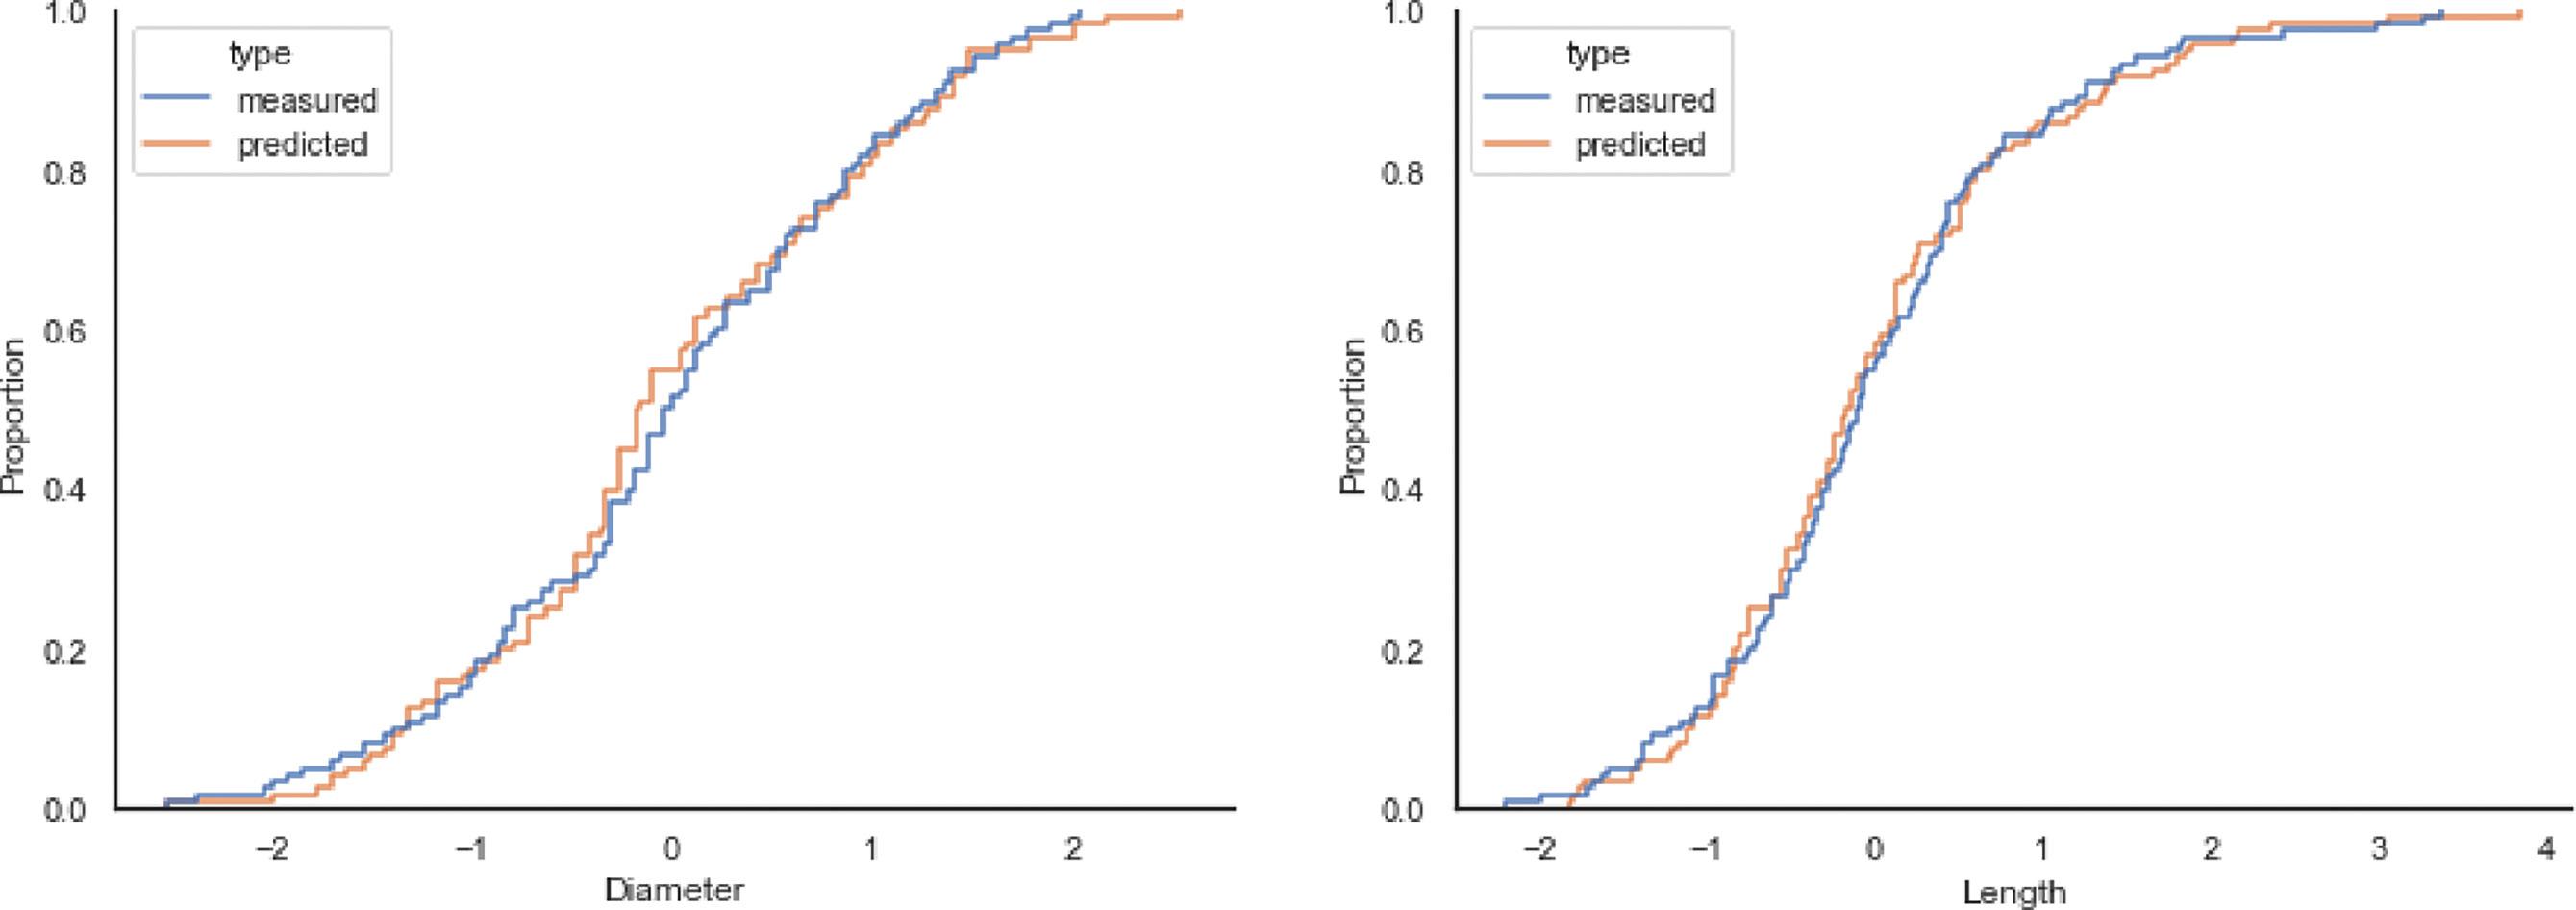
Pineapple fruit detection and size determination in a juicing factory in the Eastern Cape, South Africa
Jessica Harris, Sebnem Er
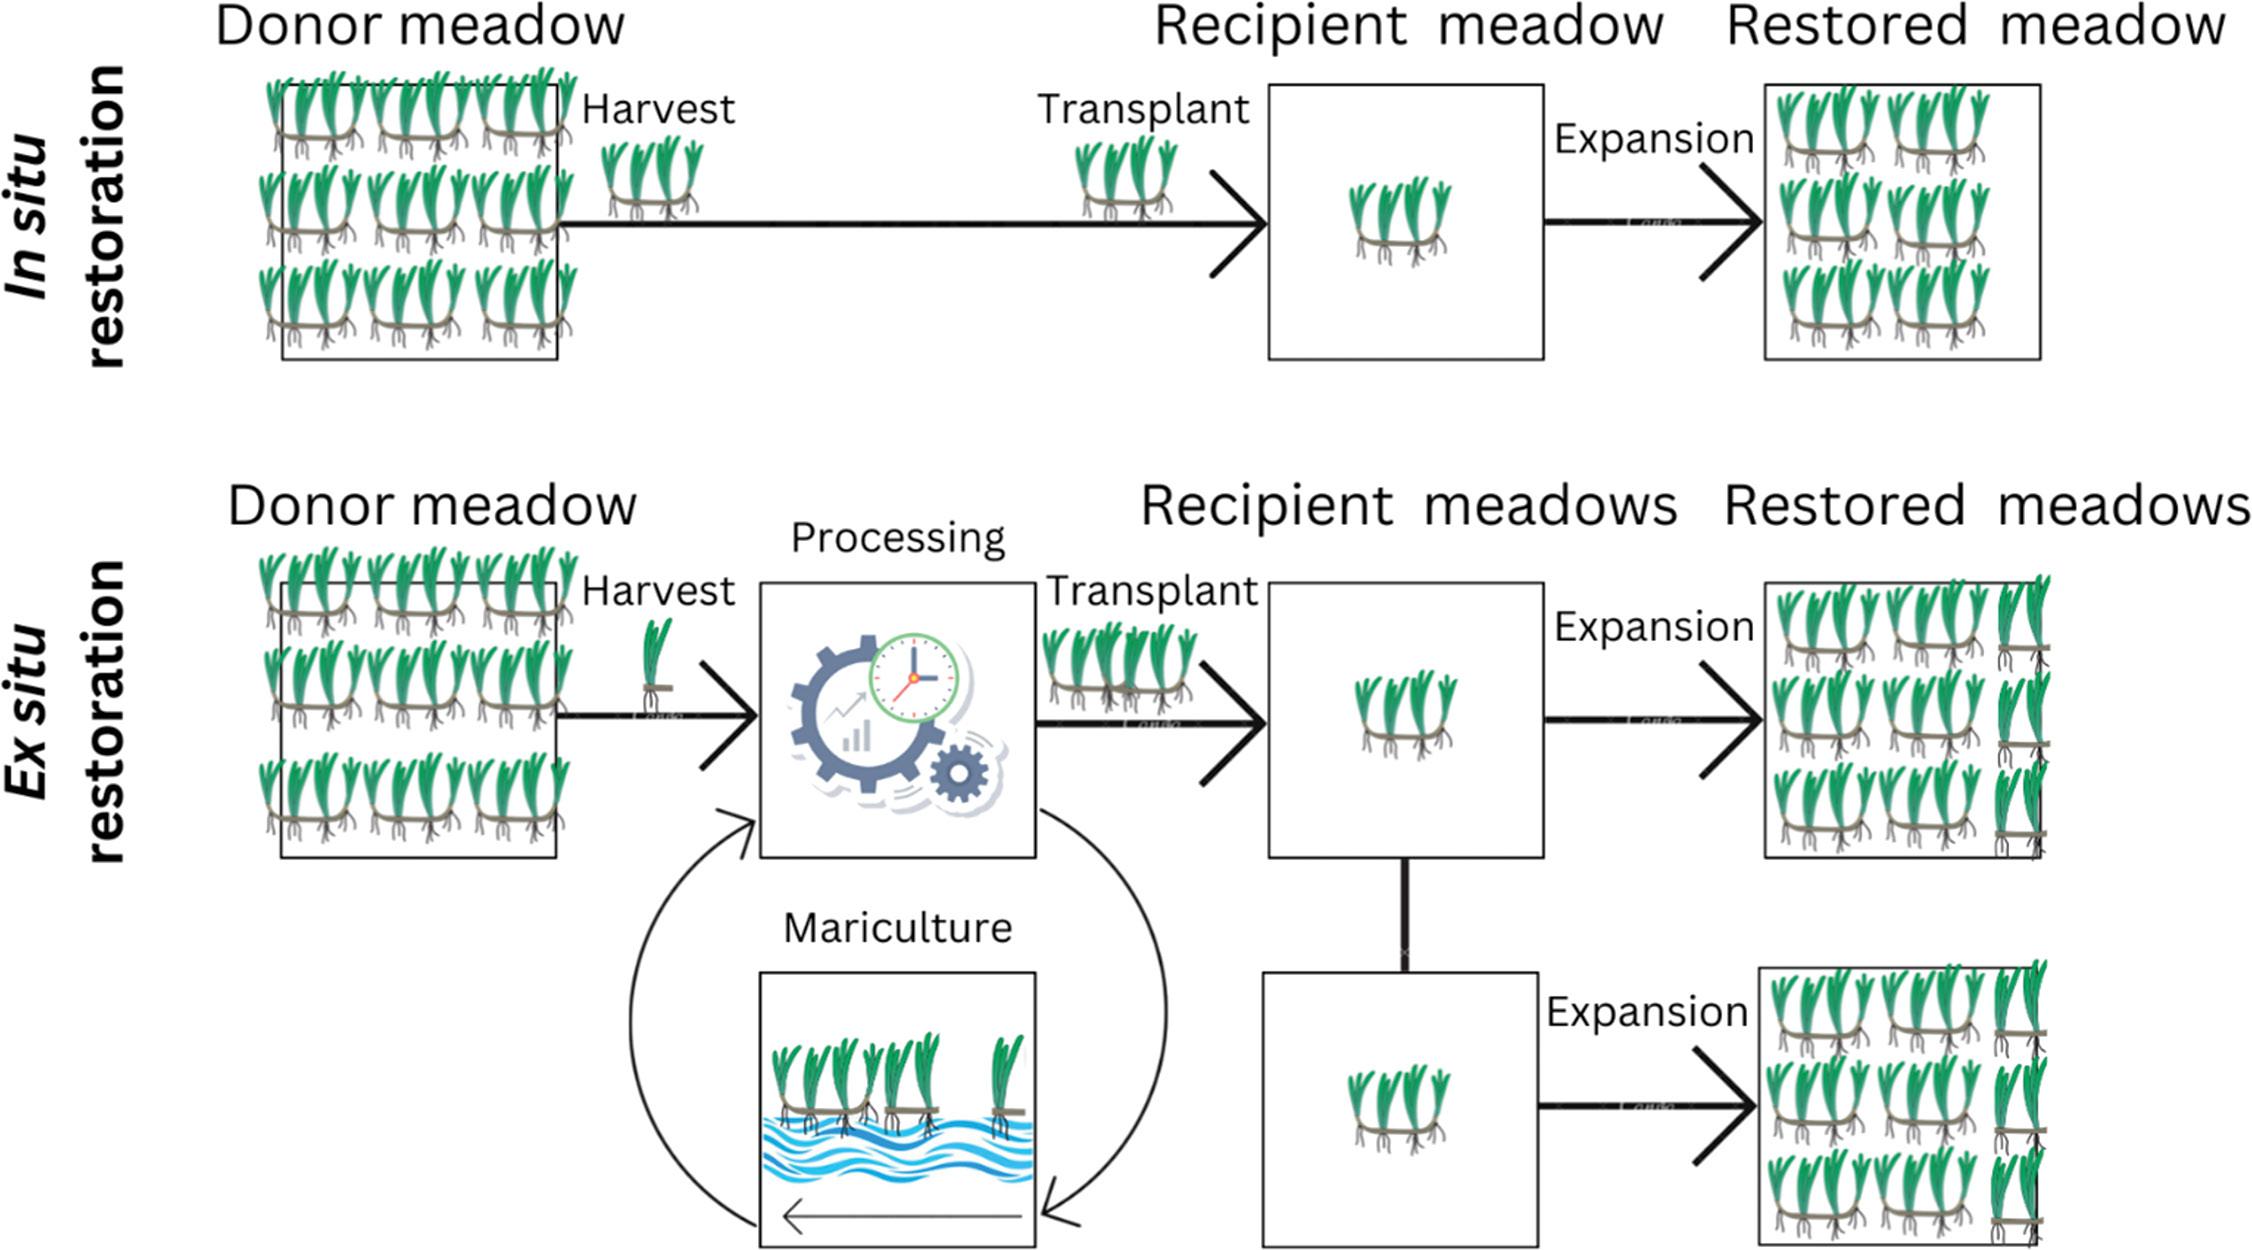
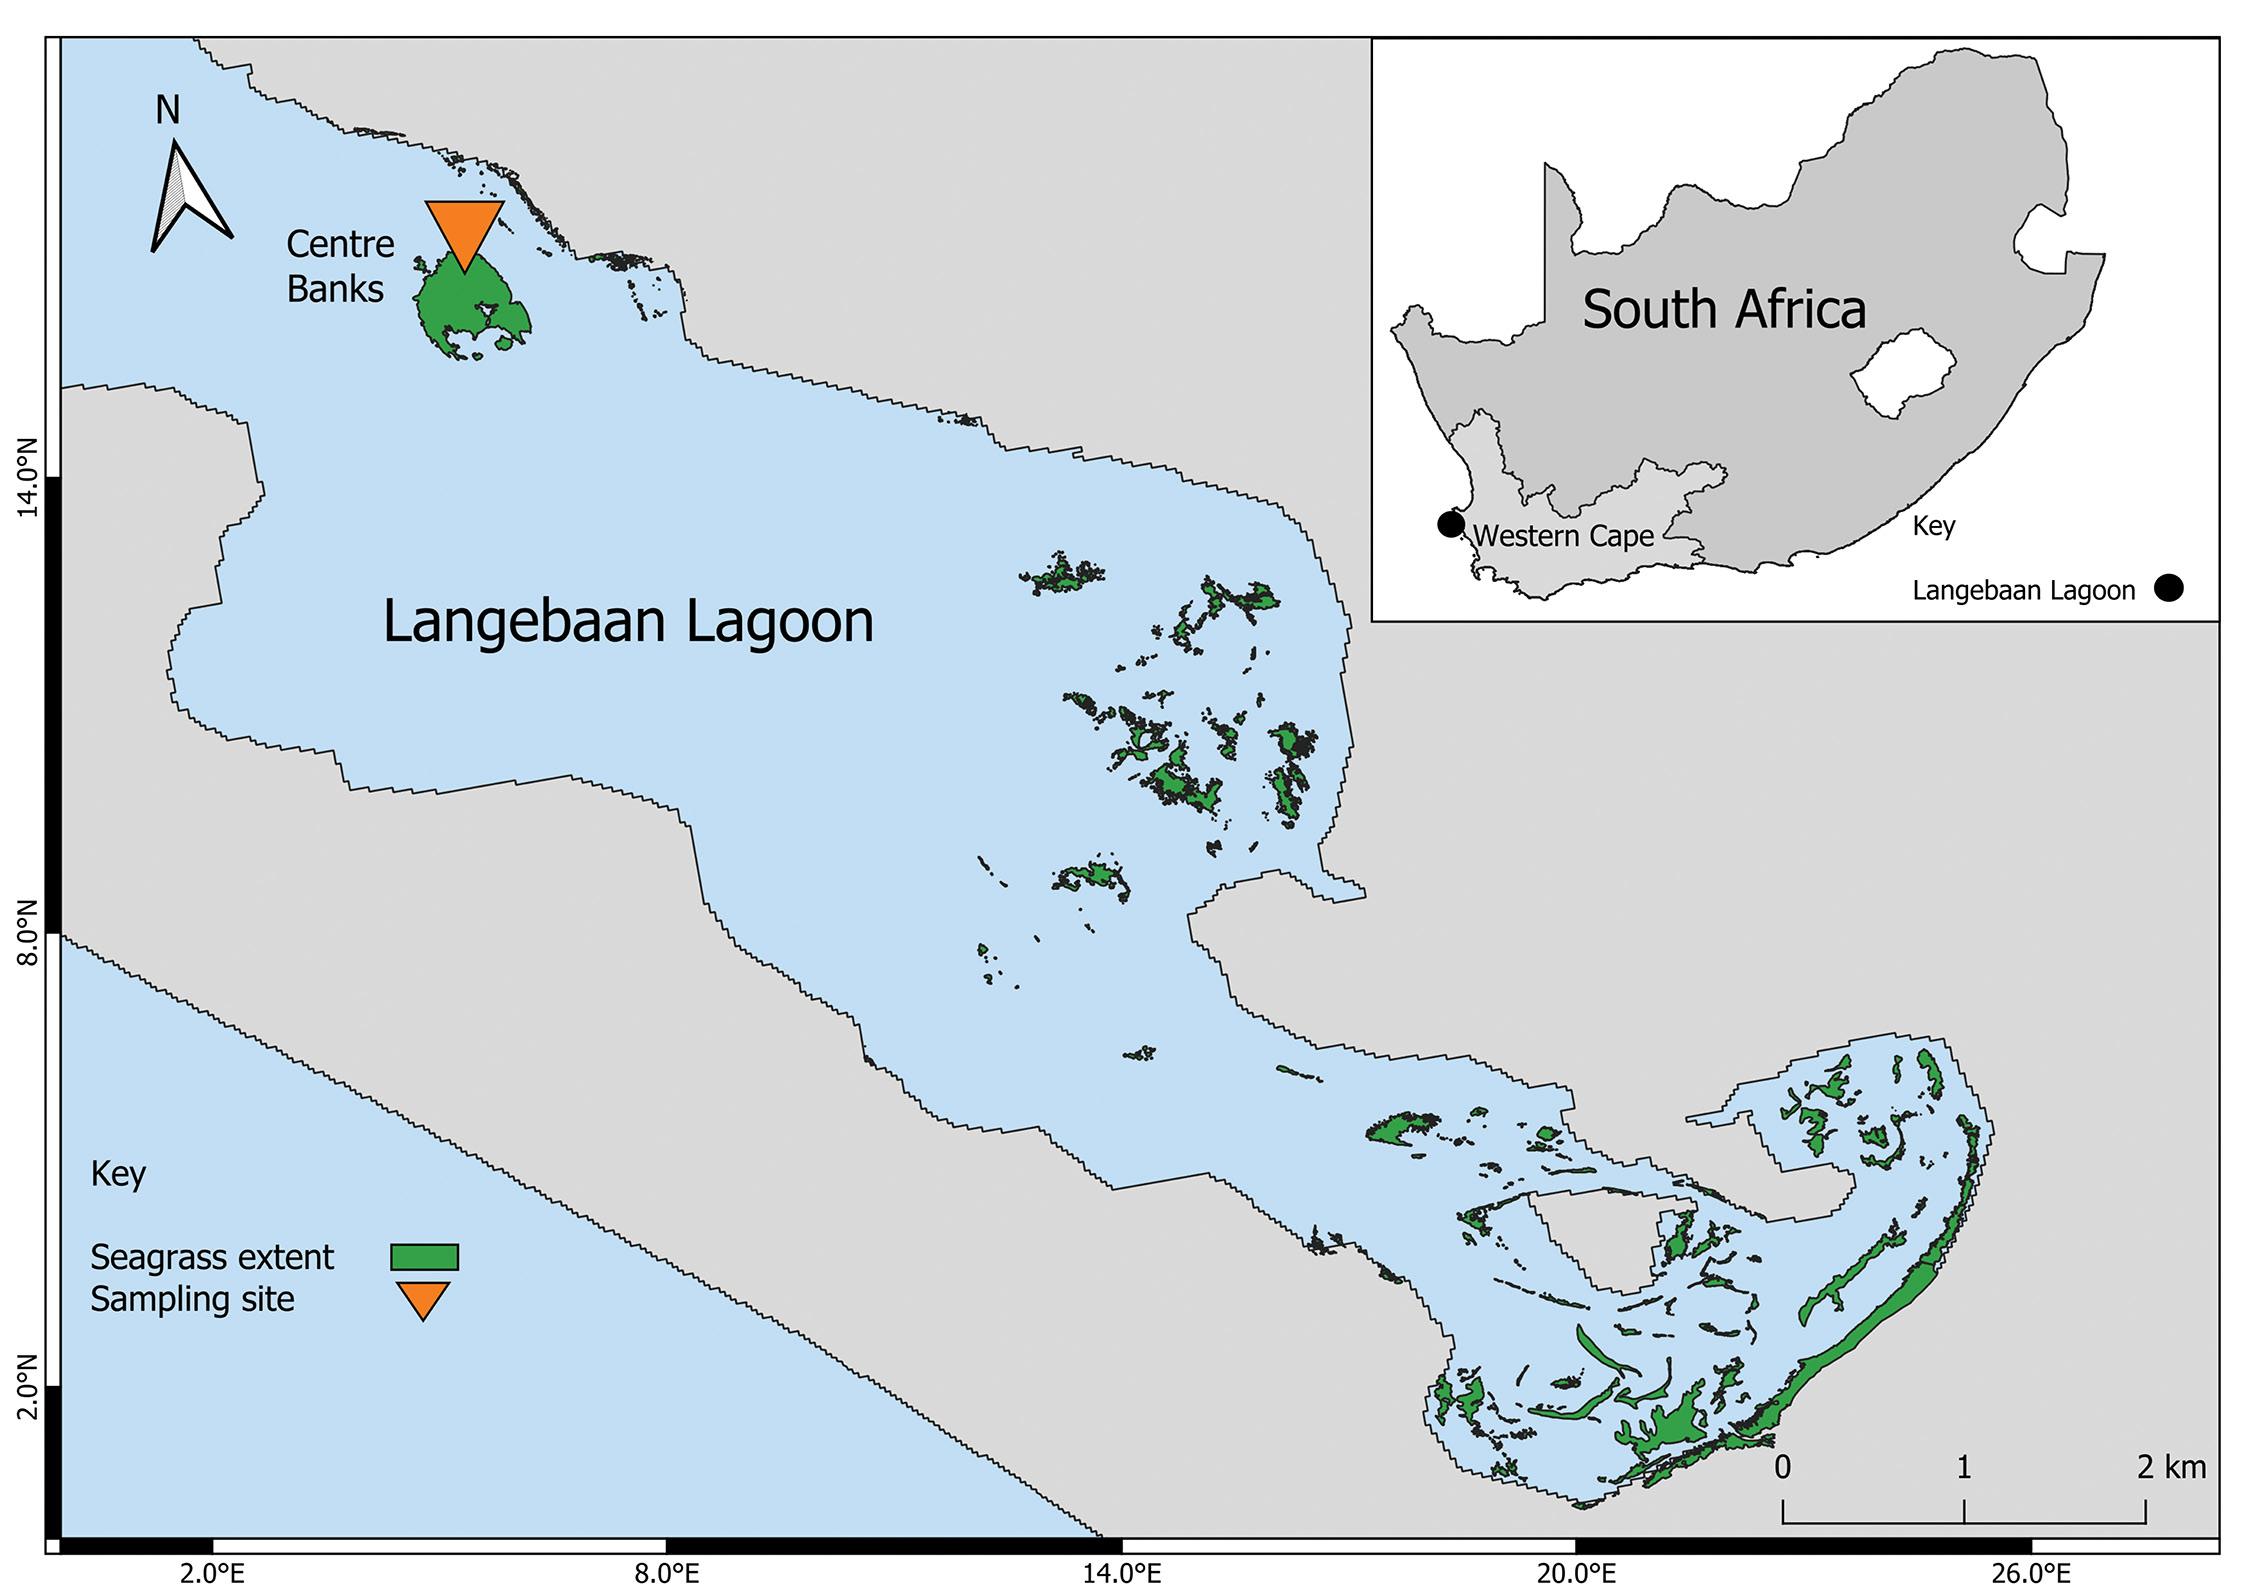
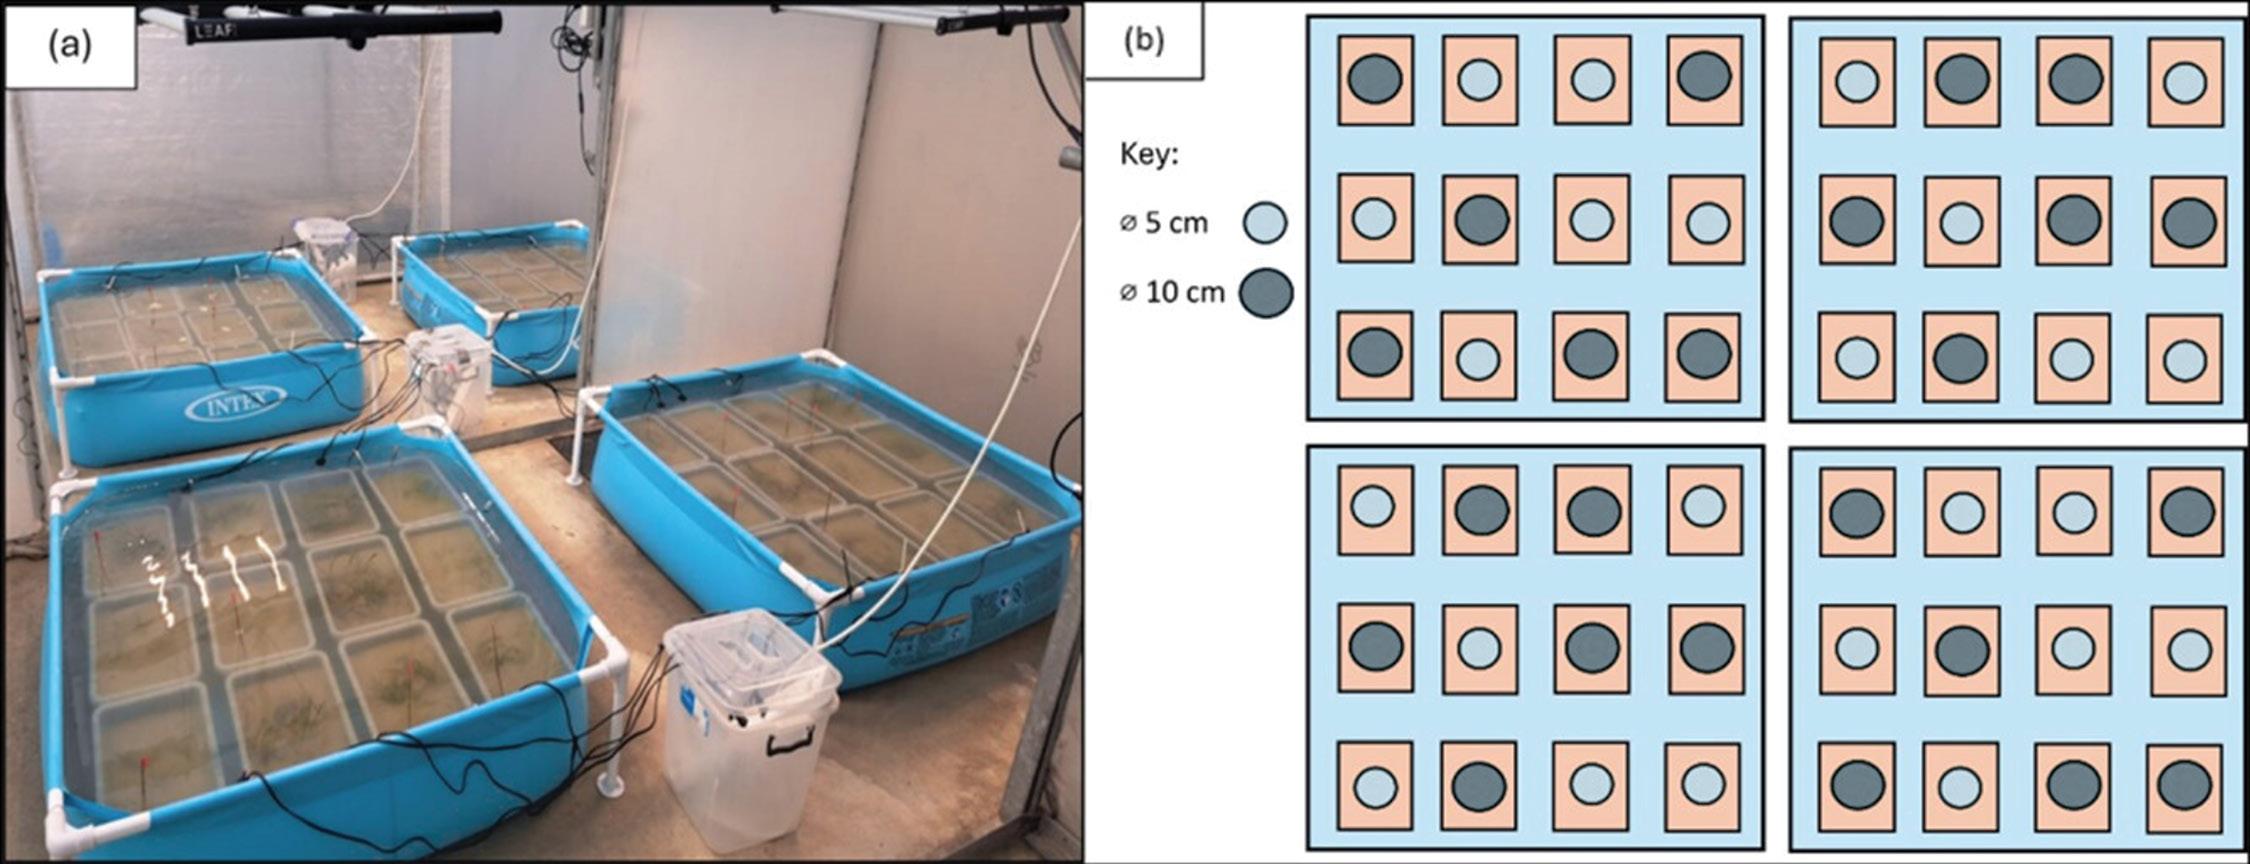
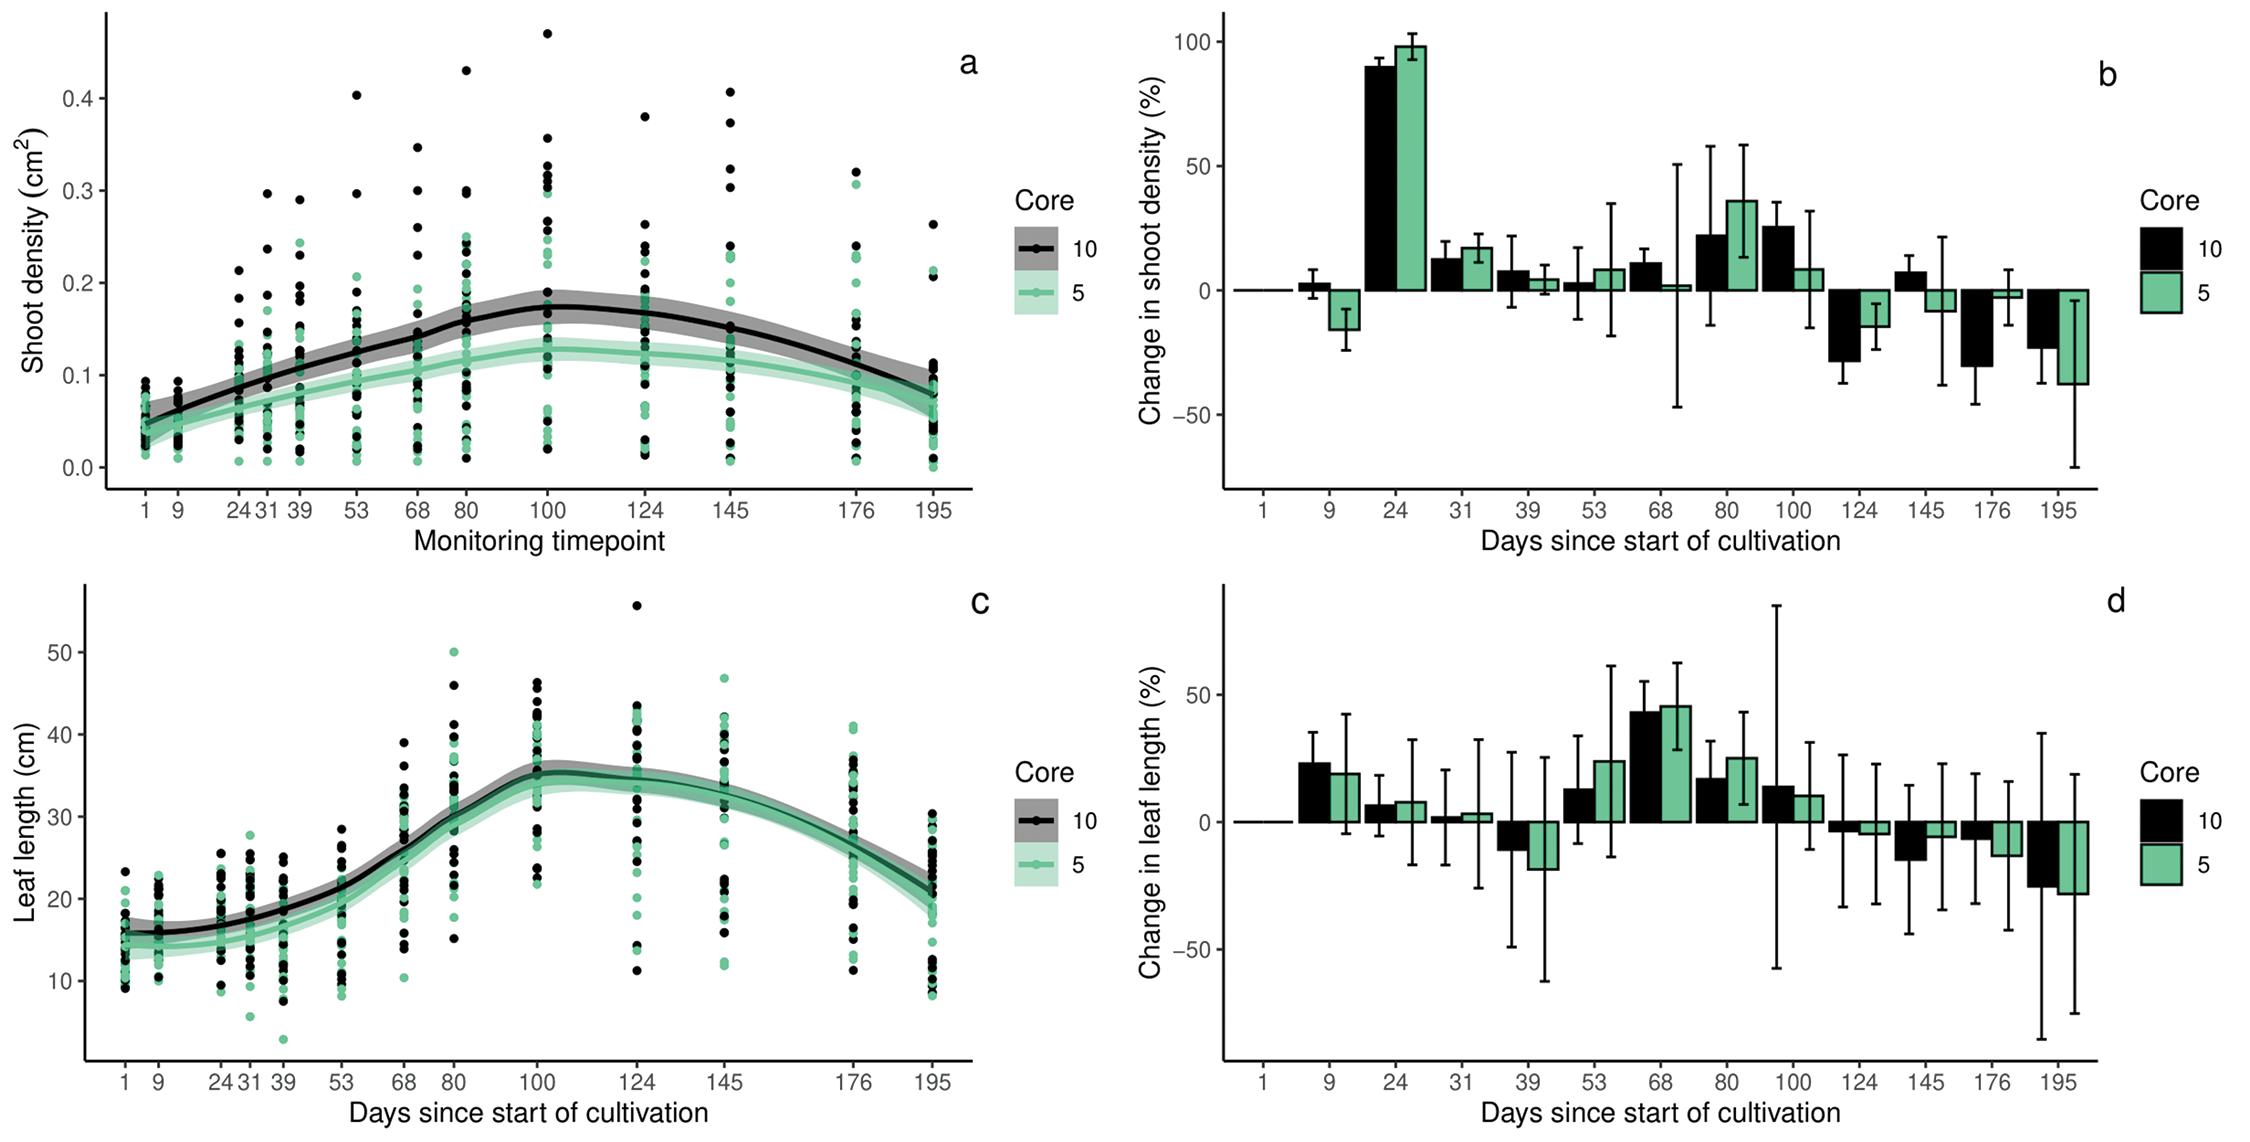
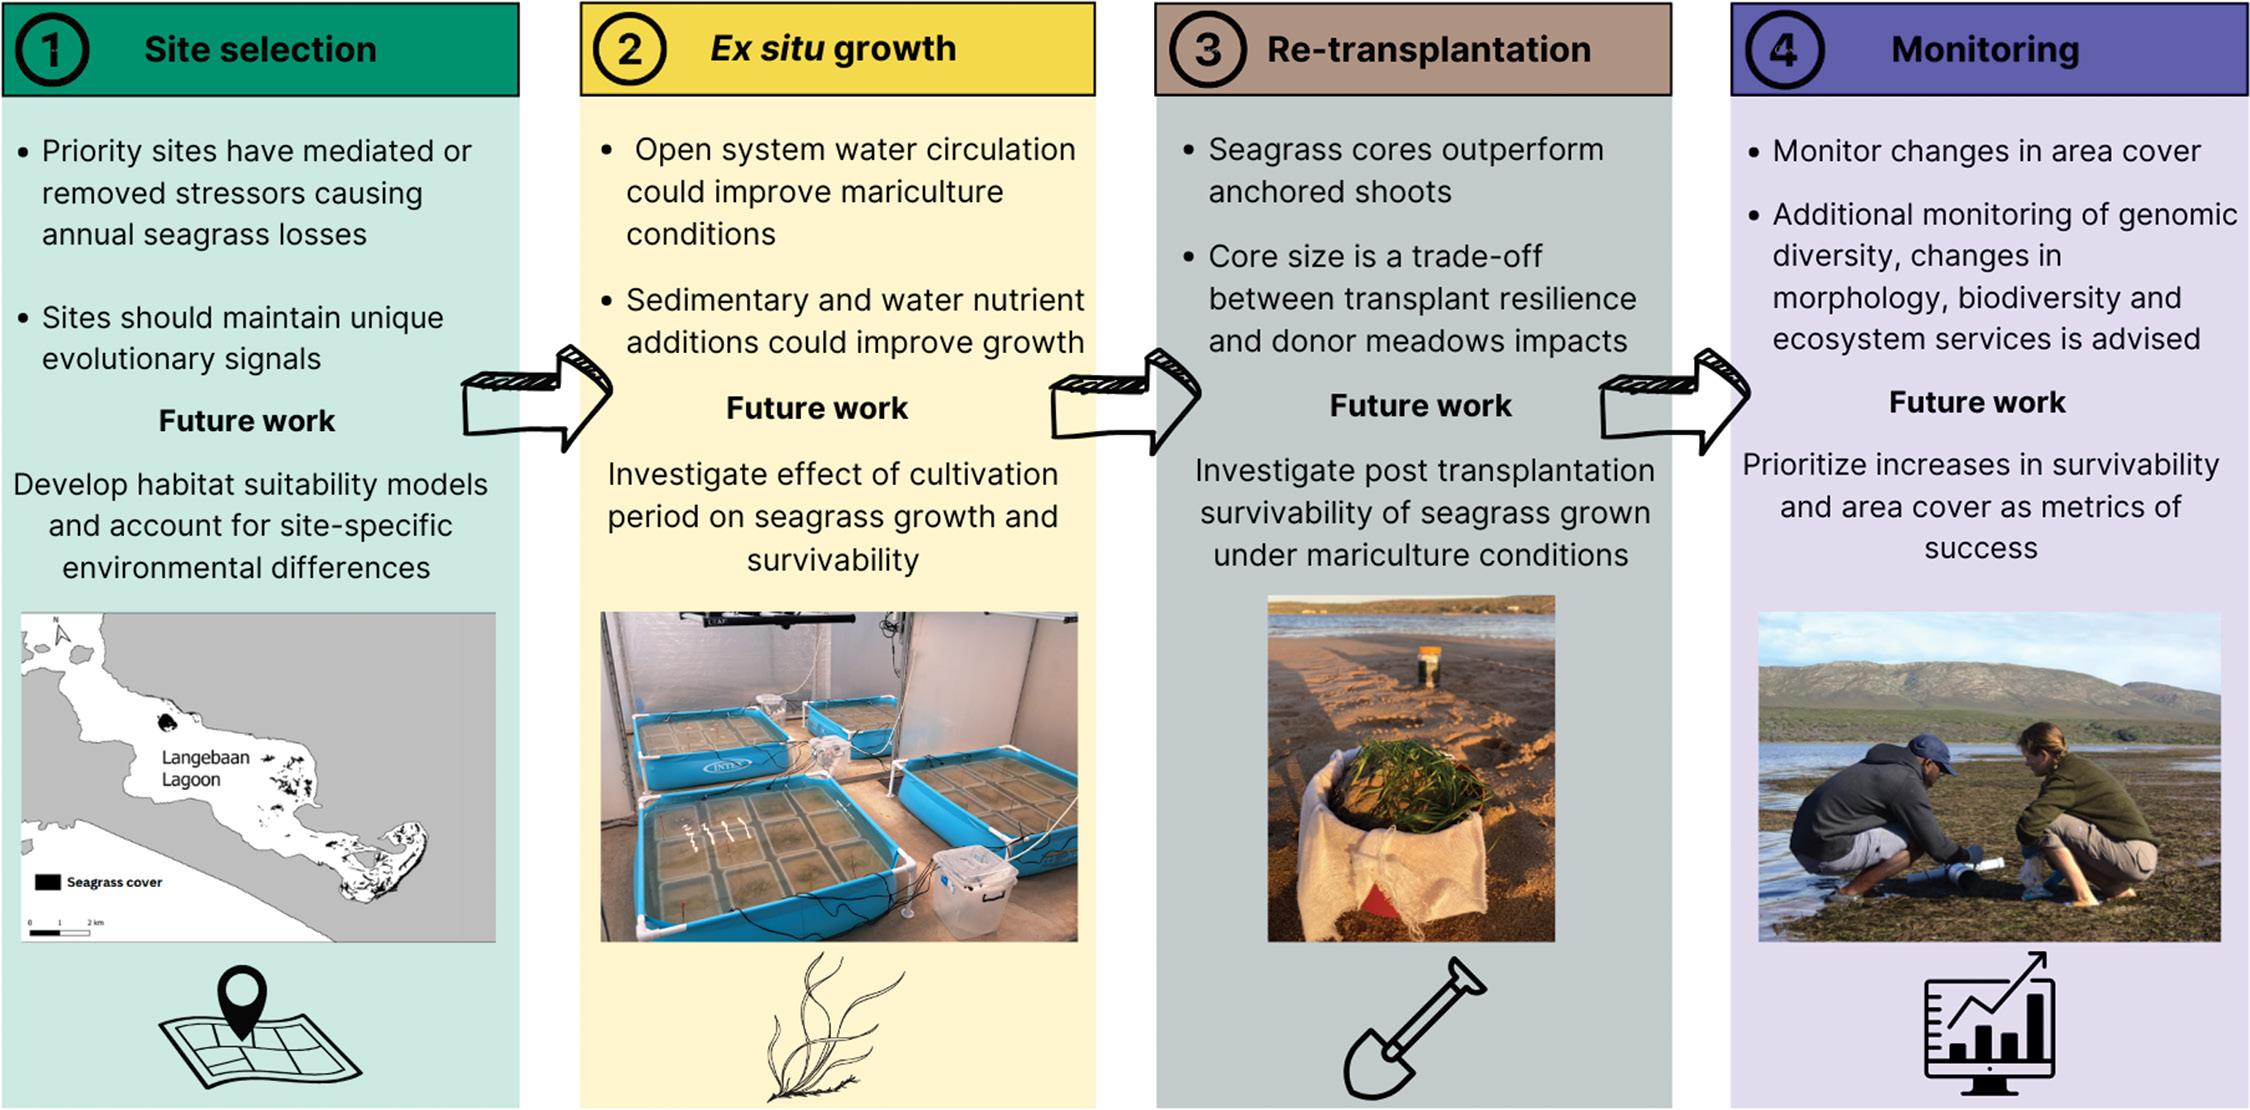
Ex-situ mariculture can support the restoration of the endangered seagrass Zostera capensis
79
Aidan Bossert, Katie M. Watson, Andrew Ndhlovu, Sophie von der Heyden 89
Smart Worksheets to probe and support scientific numeracy proficiency of first-year chemistry students
Joyce Sewry, Emily Coyte, Leanne Williams, Aidan Barker, Shubham Suryawanshi, Dudley E. Shallcross, Michael T. Davies-Coleman 96
Research Letter
Sensitivity of GERD/GDP to time academics spend on R&D in South Africa, 2022/2023
Anastassios Pouris 104
An aloe plant in the wild. Certain aloe species are well known for their medicinal properties. Mbelebele and colleagues explored the sustainable use of medicinal plants, including candelabra aloes, by smallholder farmers in the Amatole District Municipality in the Eastern Cape.
Navigating peer review in 2025
Peer Review Week 2025 is just behind us, and, as always, aims to spark discussions on relevant topics. This year was no different. The theme ‘Rethinking Peer Review in the AI Era’ highlights how new technologies, in particular artificial intelligence (AI), are reshaping traditional peer review processes. AI is, however, only one part of a much broader and continually evolving peer review landscape. At our Journal, other important issues –such as sustainable reviewing practices and transparency – have been on our radar and remain central to current peer review discussions.
AI in peer review: Threat or tool?
The use of AI in peer review is a topic of debate within the scholarly publishing community. Critics view it as a potential threat to the integrity of the process, noting concerns around confidentiality, accountability, and the loss of human judgement.1 Supporters argue that – with clear guidelines, human oversight and transparency – AI can be responsibly integrated as a supporting tool.2 Possible applications include basic manuscript screening, flagging inconsistencies or ethical issues, and assisting with reviewer selection. Several major publishers such as Wiley, Elsevier and Springer Nature have already begun adopting AI-powered tools for various tasks, including peer review assistance.3
While much is happening in this space, a few recent cases are worth highlighting. Barker4 and Lo Vecchio5 describe their recent experiences with what they believe to have been AI-generated peer reviews. Overarching issues reported were reviews that were strikingly uniform in tone, vague, lacking in detail or examples, devoid of meaningful engagement with the argument, occasionally inaccurate and in conflict with journal guidelines. These characteristics they described may be considered useful markers for authors when receiving review reports, and if unethical AI use that contravenes a journal’s policy is suspected, authors should raise the matter with the editorial team.
On the flip side, we have also seen concerning cases of AI use by authors, of which editors and reviewers need to be aware. The now-retracted paper6 featuring an AI-generated image of a rat with exaggerated reproductive organs and made-up labels underscores the need for careful scrutiny of AI-generated content. The discovery of ‘keyword injections’ designed to prompt AI tools to give favourable peer reviews7, shows how some may attempt to exploit AI use in the system. In addition, the rise in low-quality and sometimes misleading papers generated by AI paper mills using openly accessible data sets8, poses a serious threat to the integrity of the scientific record.
These accounts indicate that we are far from AI replacing human editors and reviewers; if anything, they highlight the growing importance of human oversight. Clear, comprehensive guidance for all stages of the peer review process, and for all participants, is essential, as is requiring declarations of AI use. Our Journal policies do not permit the use of AI tools to replace the work of peer reviewers or editors, but we recognise that this is an evolving area requiring ongoing review as the AI landscape changes.
Sustainable peer review: Recognition, rewards and reviewer pools
A recent Nature news feature by Adam9 describes peer review as being in a state of “crisis” due to an overloaded system. Adam attributes this crisis to significant increases in public research funding, a growing volume of manuscript submissions, and the added pressures of the COVID-19 pandemic, all of which have intensified the need for faster and more effective peer review.
As demands on researchers’ time continue to grow, sustaining a healthy peer review system requires more than goodwill – it requires recognition, meaningful incentives and institutional systems that value reviewers’ contributions. The Academy of Science of South Africa (ASSAf) issued a statement in 2024 on the Recognition of the Work of Editors and
Peer Reviewers of Academic Journals and Books in South Africa.10 The statement urges universities and science councils to formally acknowledge and support editorial work, and provides recommendations for including this work in performance appraisals.
Formal recognition services such as Reviewer Credits, Web of Science Reviewer Recognition and ORCID enable reviewers to log verified reviews, receive certificates, and build a portfolio of their reviewing activity across journals and publishers. These profiles enhance CVs, support professional development, and help reviewers gain recognition within their institutions and scholarly communities. Publishers also use these tools to help find and match reviewers with manuscripts. Many journals publish an annual list of reviewers as a form of acknowledgement, and some have annual reviewer awards to acknowledge exceptional contributions. At our Journal, we publish an annual reviewer list, have an annual Outstanding Reviewer Award, and recently registered with Reviewer Credits. For reviewers who have a Reviewer Credits profile, reviews completed on our online system are automatically logged on the platform through seamless integration. We hope these initiatives help to recognise and reward the essential and hard work of our reviewers. While financial incentives are sometimes proposed as a way to reward reviewers, these raise practical and, more importantly, ethical concerns that need to be carefully considered, including increased costs, potential conflicts of interest, risks to the integrity of the review process, and the potential to make existing inequities worse.11
Adam9 poses a critical question: how can we avoid overburdening a limited reviewer pool? Emerging solutions include AI-assisted reviewer matching, to help identify suitable and available reviewers, and the growing practice of “co-reviewing” in which an established academic collaborates with an early-career researcher.9 This approach not only shares the peer review workload but also builds peer review capacity, something we encourage in our peer review policies
Transparency in peer review: Publication of peer review history
Scholarly publishing has seen a gradual shift towards promoting open science, including greater transparency in peer review through initiatives such as open peer review and the publication of review reports. Recently, Nature announced12 their transition from voluntary to compulsory publication of reviewers’ reports and author responses alongside all published original research articles. While some argue that this still falls short of full transparency as it runs the risk of turning peer review reports into “promotional endorsements” instead of critical evaluations and could distort editorial decision-making13, we believe it is still a step in the right direction.
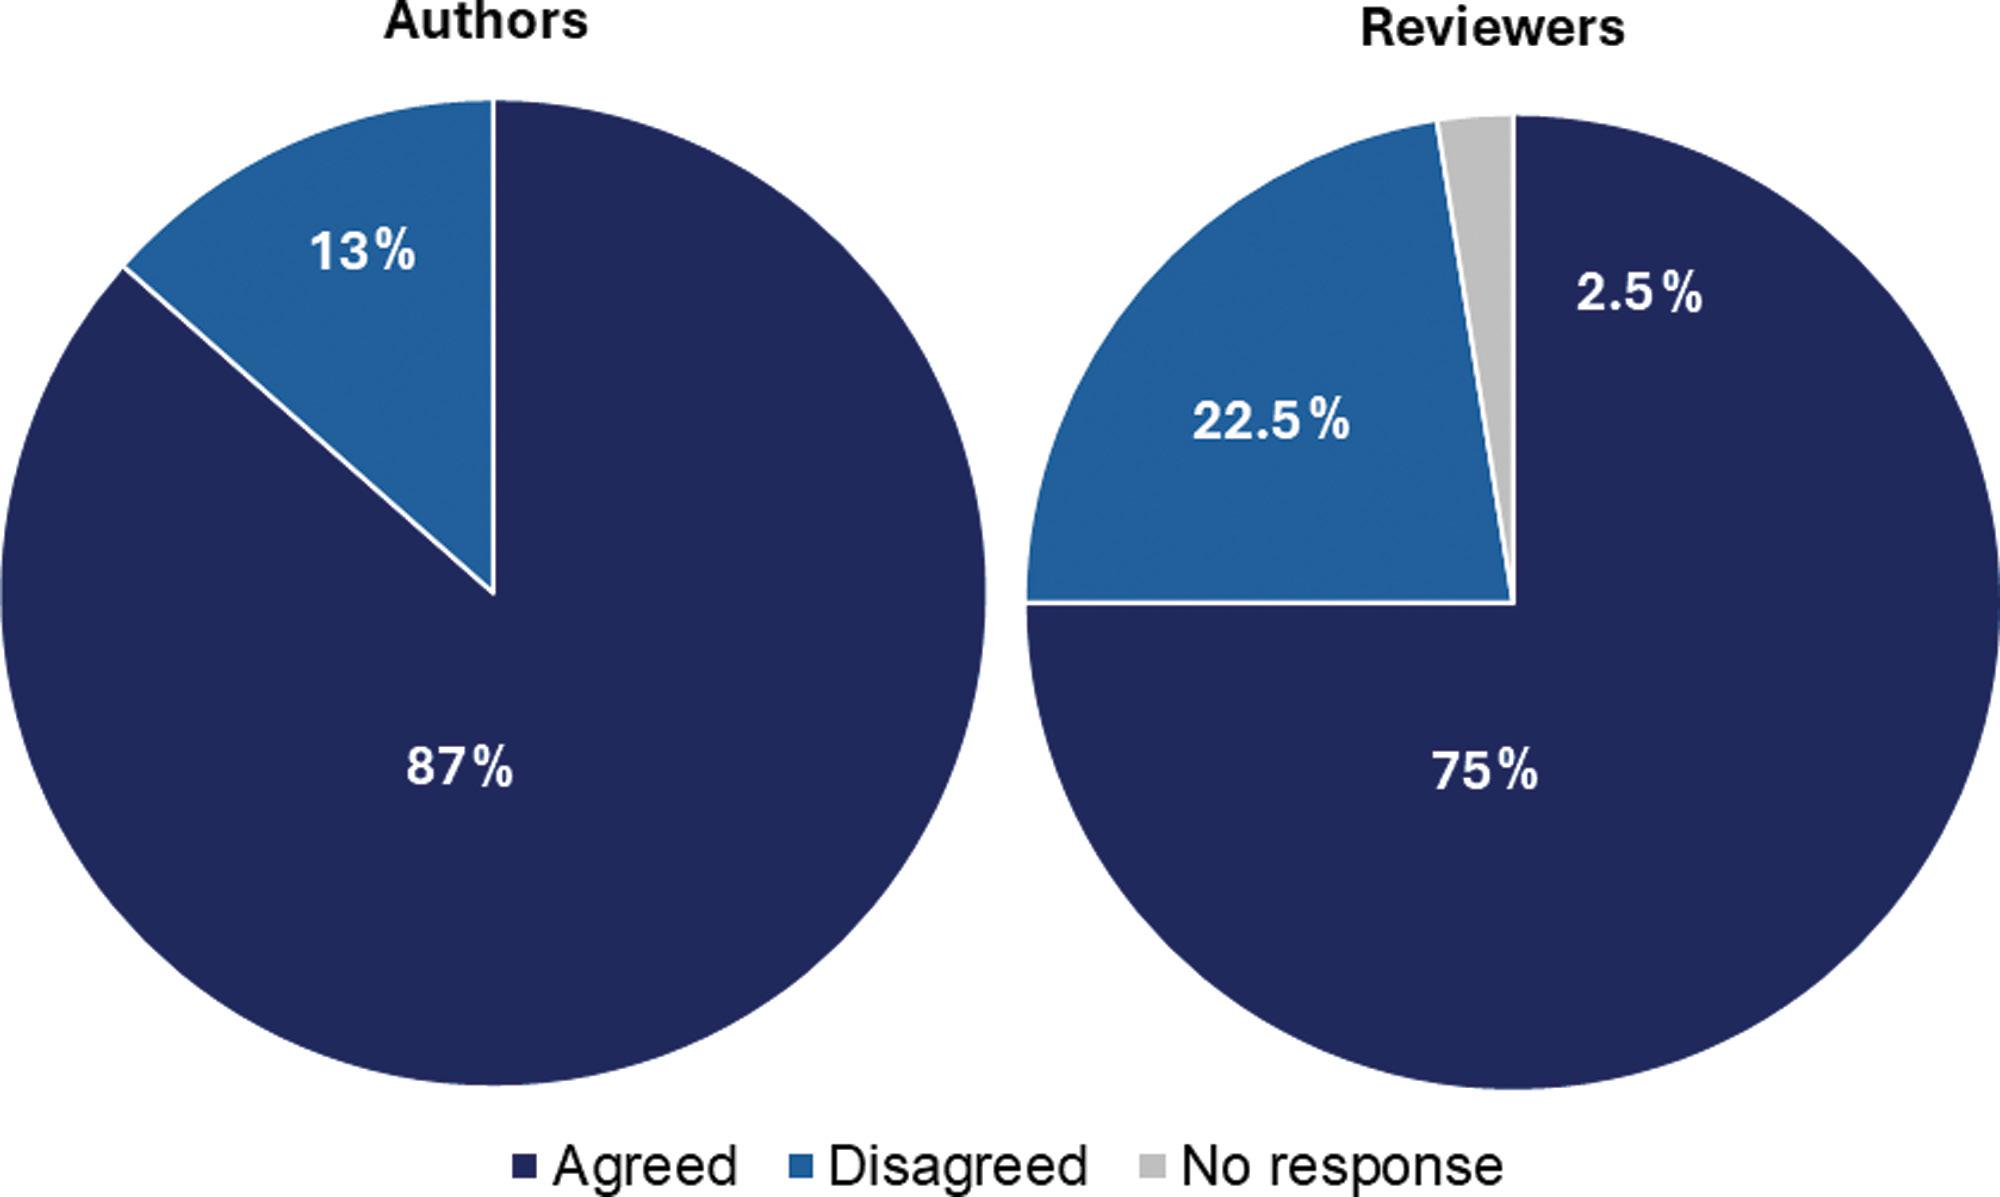
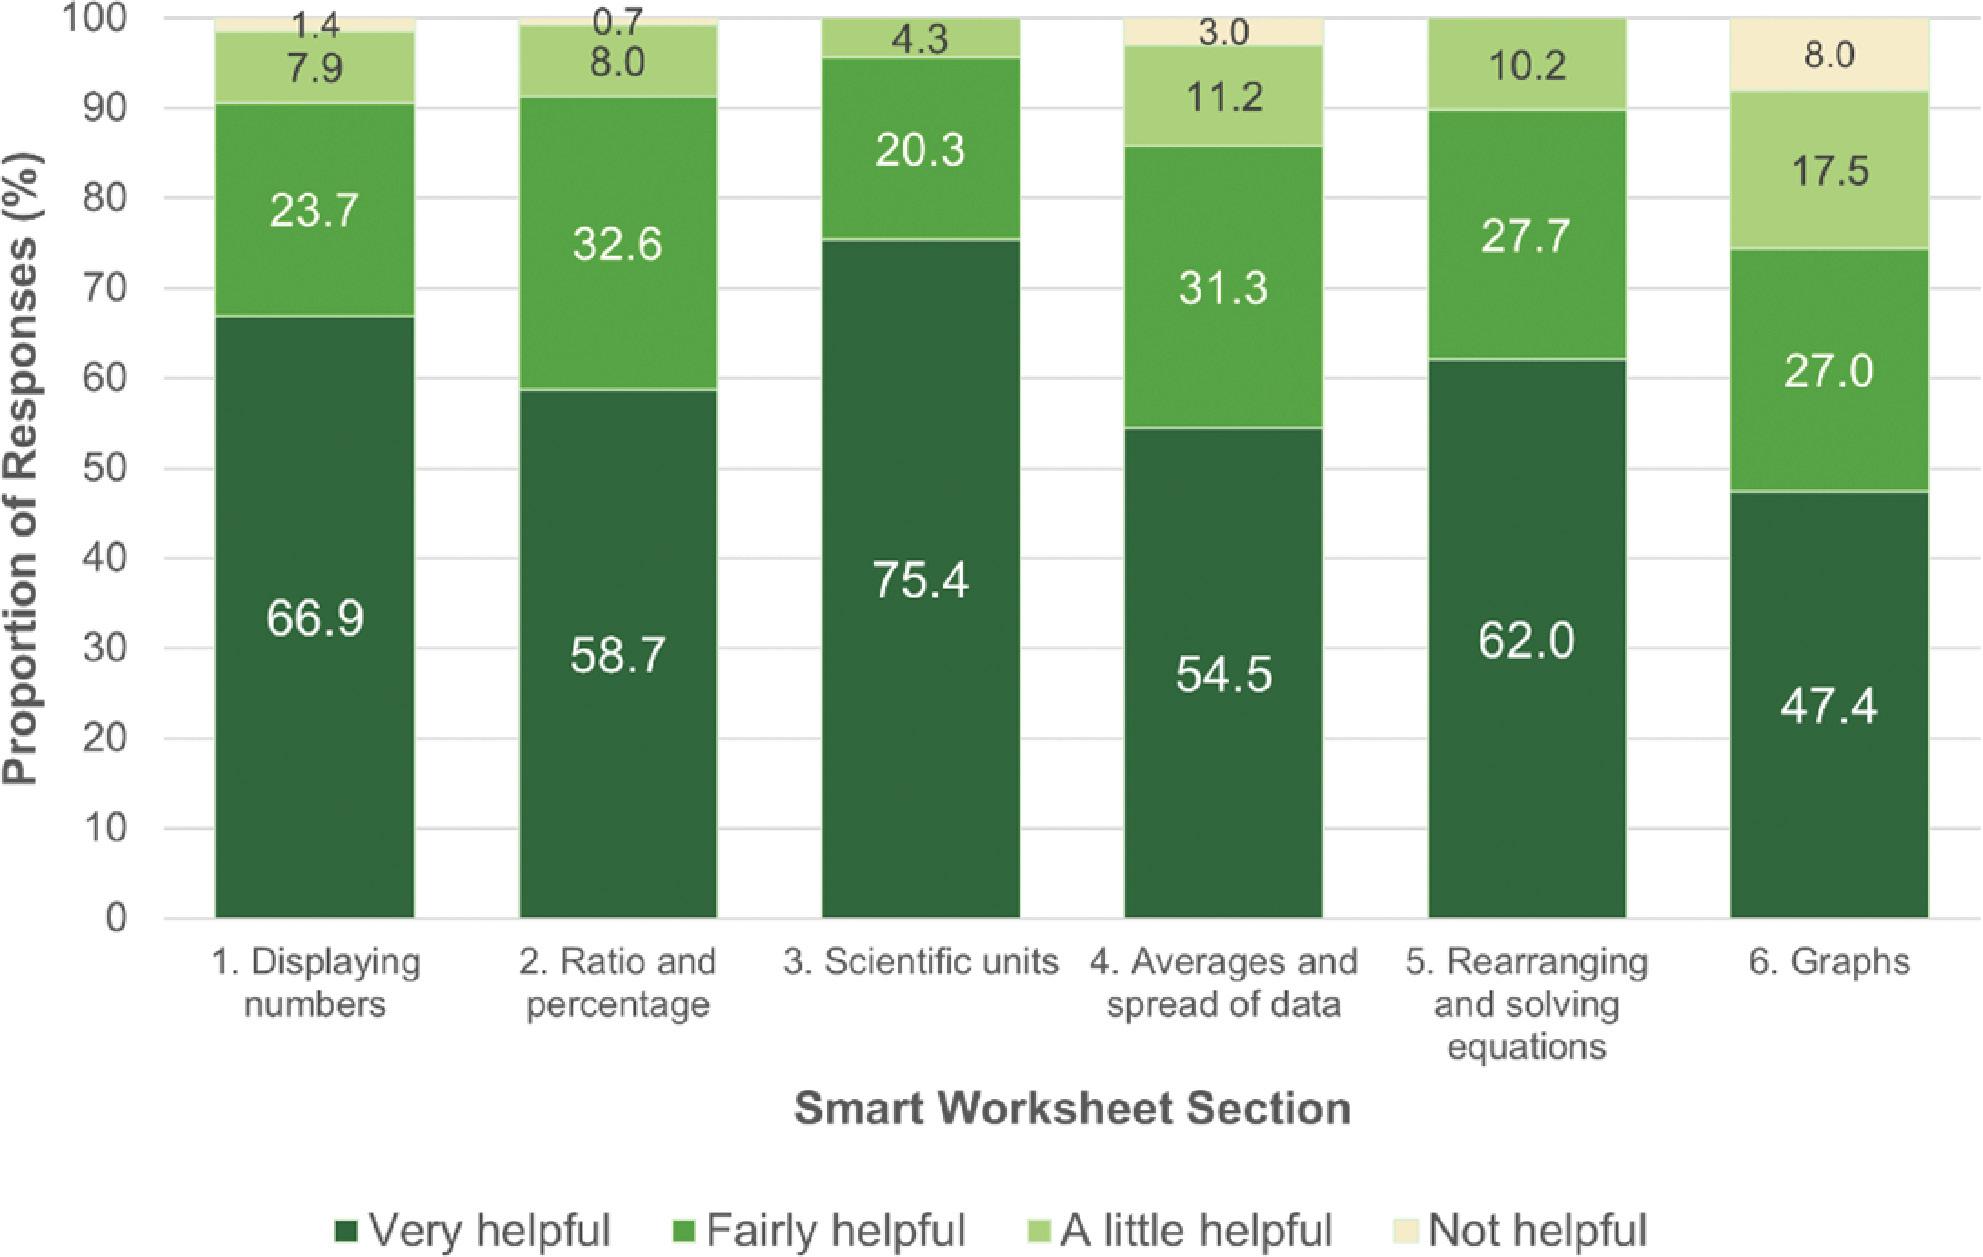
Our Journal follows a double-anonymous peer-review model, in line with ASSAf’s Code of Best Practice in Scholarly Journal Publishing, Editing and Peer Review.14 To align with broader trends towards openness, in October 2023 we introduced a policy encouraging the publication of the peer review history alongside published articles. This policy encourages reviewers and authors to allow the publication of their anonymised review reports and author responses, respectively, alongside the published articles. While we anticipated mixed reactions, we were pleased to discover that support far outweighed opposition, with 87% of authors and 75% of reviewers to date agreeing to the publication of the peer review history (Figure 1). Reasons given for not agreeing to the publication of the peer review history vary, with both authors and reviewers expressing unfamiliarity with the practice and concern that readers might misinterpret or misunderstand content within the reports.
Since implementation in October 2023, we have published the peer review histories for 81 articles, and these have collectively been downloaded nearly 14 000 times. These readership metrics are
Figure 1: Percentage of authors and reviewers who agreed to the voluntary publication of anonymised peer review histories in the South African Journal of Science since adoption in October 2023.
encouraging, as one of our aims in introducing the policy was to create a learning resource, particularly for early-career researchers to benefit from seeing real examples of reviewer feedback and author responses.
It is important to acknowledge, however, that publishing peer review histories has also brought challenges for our Journal. There has been an additional administrative load in obtaining permission from authors and reviewers, and in compiling and formatting reports for publishing, as well as technical challenges with indexing the peer review histories that are yet to be resolved.
Despite these challenges, the positive outcome has exceeded expectations, and we look forward to building on this momentum in openness and transparency of peer review in the years ahead.
References
1. Chaturvedi A. AI in peer review: A recipe for disaster or success? [webpage on the Internet]. c2024 [cited 2025 Aug 10]. Available from: https://asm.org /articles/ai-in-peer-review-recipe-for-disaster-or-success/
2. Linss M-A. Reimagining peer review: A case for innovation [webpage on the Internet]. c2025 [cited 2025 Aug 10]. Available from: https://www.researc hinformation.info/viewpoint/reimagining-peer-review-a-case-for-innovation/
3. Palmer K. Publishers embrace AI as research integrity tool [webpage on the Internet]. c2025 [cited 2025 Aug 11]. Available from: https://www.insidehigh ered.com/news/faculty-issues/research/2025/03/18/publishers-adopt-ai-to ols-bolster-research-integrity/
4. Barker TH. ‘Vague, confusing, and did nothing to improve my work’: How AI can undermine peer review. The Conversation Africa. 2025 March 09 [cited 2025 Aug 11]. Available from: https://theconversation.com/vague-confusin g-and-did-nothing-to-improve-my-work-how-ai-can-undermine-peer-revie w-251040
5. Lo Vecchio N. Personal experience with AI-generated peer reviews: A case study. Res Integr Peer Rev. 2025;10, Art. #4. https://doi.org/10.1186/s410 73-025-00161-3
HOW TO CITE:
6. Guo X, Dong L, Hao D. Cellular functions of spermatogonial stem cells in relation to JAK/STAT signaling pathway. Front Cell Dev Biol. 2024;11, Art. #1339390. https://doi.org/10.3389/fcell.2023.1339390
7. Sugiyama S, Eguchi R. ‘Positive review only’: Researchers hide AI prompts in papers. Nikkei Asia. 2025 July 01 [cited 2025 Aug 11]. Available from: https:// asia.nikkei.com/business/technology/artificial-intelligence/positive-review-o nly-researchers-hide-ai-prompts-in-papers
8. Robinson D. Boffins warn that AI paper mills are swamping science with garbage studies. The Register. 2025 May 13 [cited 2025 Aug 11]. Available from: https://www.theregister.com/2025/05/13/ai_junk_science_papers/
9. Adam D. The peer-review crisis: How to fix an overloaded system. Nature News. 2025 August 06 [updated 2025 Aug 08; cited 2025 Aug 11]. Available from: https://www.nature.com/articles/d41586-025-02457-2
10. Academy of Science of South Africa (ASSAf). ASSAf statement on the recognition of the work of editors and peer reviewers of academic journals and books in South Africa [document on the Internet]. c2024 [cited 2025 Aug 10]. Available from: https://research.assaf.org.za/assafserver/api/core/bitstr eams/c8fdebcf-e4f0-4908-bf26-dbf2884c4b3f/content
11. Vines T, Mudditt A. What’s wrong with paying for peer review? Scholarly Kitchen. 2021 June 16 [cited 2025 Aug 11]. Available from: https://scholar lykitchen.sspnet.org/2021/06/16/whats-wrong-with-paying-for-peer-review/
12. Editorial: Transparent peer review to be extended to all of Nature’s research papers. Nature. 2025;642, Art. #542. https://doi.org/10.1038/d41586-02 5-01880-9
13. Stern B. Nature’s decision to publish positive peer review reports only gives half the picture [webpage on the Internet]. c2025 [cited 2025 Aug 10]. Available from: https://blogs.lse.ac.uk/impactofsocialsciences/2025/08/06/natures-decision-to-p ublish-positive-peer-review-reports-only-gives-half-the-picture/
14. Academy of Science of South Africa (ASSAf). ASSAf’s code of best practice in scholarly journal publishing, editing and peer review. Pretoria: ASSAf; 2025. https://doi.org/10.17159/assaf.2025/117
Grobler N. Navigating peer review in 2025. S Afr J Sci. 2025;121(9/10), Art. #23543. https://doi.org/10.17159/sajs.2025/23543
AuTHORS: Himla Soodyall1
Michèle Ramsay2
Jennifer G.R. Kromberg3
AFFILIATIONS:
1Academy of Science of South Africa (ASSAf), Pretoria, South Africa
2Sydney Brenner Institute for Molecular Bioscience, Faculty of Health Sciences, University of the Witwatersrand, Johannesburg, South Africa
3Division of Human Genetics, National Health Laboratory Service and School of Pathology, Faculty of Health Sciences, University of the Witwatersrand, Johannesburg, South Africa
CORRESPONDENCE TO: Himla Soodyall
EMAIL: himla@assaf.org.za
HOW TO CITE:
Soodyall H, Ramsay M, Kromberg
JGR. Trefor Jenkins (1932–2025): Pioneer of human genetics in southern Africa. S Afr J Sci. 2025;121(9/10), Art. #23578. https: //doi.org/10.17159/sajs.2025/23578
ARTICLE INCLuDES:
☐ Peer review
☐ Supplementary material
PubLISHED:
29 September 2025
Trefor Jenkins (1932–2025): Pioneer of human genetics in southern Africa
Professor Trefor Jenkins was one of the most influential figures in the development of the field of human genetics in southern Africa. His career, spanning over four decades, fundamentally transformed the landscape of genetic research, clinical services and education across the region. Through his pioneering work at the University of the Witwatersrand (Wits) and the South African Institute for Medical Research (SAIMR) [now integrated into the National Health Laboratory Service (NHLS)], Jenkins established the foundation for modern genetic studies in South Africa while contributing significantly to our understanding of human population diversity and genetic diseases on the continent.
Early career and academic foundation
Jenkins began his career in medicine in the United Kingdom, qualifying in 1956, before embarking on a journey that would take him to Rhodesia (now Zimbabwe) and eventually South Africa. His initial work as a mine medical officer provided him with early exposure to the diverse populations of southern Africa, an experience that would later inform his genetic research. Jenkins taught and did research in the field of human genetics and founded genetic counselling clinics and diagnostic and research laboratories throughout his career.1
With the support and encouragement of Professor Phillip Tobias, Jenkins’ transition to human genetics came in 1969 when he took up the positions of Head of the Human Sero-Genetics Unit at the SAIMR and part-time lecturer in human genetics in the Department of Anatomy (Wits). This marked the beginning of his systematic approach to establishing human genetics as a distinct discipline in southern Africa.2,3 Together with Tobias, he conducted field research on local communities, motivated by his curiosity about population history and why some diseases, like the sickle cell trait, were prevalent in some community groups he encountered as a doctor working in Zimbabwe.
Institutional leadership and development
Jenkins’ appointment as the first Professor of Human Genetics at Wits in 1974 transformed the department to excel in research, clinical services and education. He introduced genetic services in Johannesburg, which later expanded to other regions. At first, the services involved chromosome studies, and later he introduced serogenetic markers, including blood groups and serum proteins, for diagnostic purposes and research.
The South African Medical Research Council, in conjunction with the SAIMR and Wits, awarded Jenkins an extramural research unit and appointed him as Director of the Human Ecogenetics Research Unit between 1977 and 1993. Funding from this source supported much of the research conducted in the department. In the early 1980s, in line with international trends, Jenkins turned his attention toward integrating the ‘new genetics’ based on the use of DNA technology to enhance diagnosis and research. His department became a regional centre of excellence, attracting researchers and clinicians from across the globe and stimulating international collaborations that elevated the profile of genetic research in African populations.
Through a generous endowment from Philip von Wielligh, Jenkins initiated a lecture series that ran for over two decades and enabled him to invite prominent international experts to visit the department to share their knowledge and expertise. This provided an exciting and enabling environment for cutting-edge research.
Following his retirement, Jenkins was called back to service to play a major role in the establishment of the Institute for Human Evolution (later renamed the Evolutionary Studies Institute) at Wits and he acted as Interim Director from 2004 to 2009. During this time, he co-edited a book with Philip Bonner and Amanda Esterhuysen titled A Search for Origins: Science, History and South Africa’s ‘Cradle of Humankind’, which was published in 2007.4
Research contributions and scientific impact
Jenkins’ research portfolio was remarkably diverse, reflecting the complex genetic landscape of southern Africa. He published and collaborated on over 300 papers and three books, demonstrating his prolific contribution to the scientific literature. His work encompassed several key areas that were particularly relevant to the African context.
One of his most significant contributions was in population genetics, where he studied the genetic diversity and relationships among southern African populations.5 His research provided crucial insights into the origins, migrations and genetic affinities of various ethnic groups in the region. This work was particularly important given the unique position of southern Africa as a crossroads of human migration and the home of some of the world’s oldest human populations.
Blood group genetics formed another major area of Jenkins’s research. This research contributed to understanding population relationships and migration patterns in southern Africa, which provided the foundation that was later refined with patterns of variation at the molecular level using DNA markers.
His team’s work led, among other contributions, to new insights into the origins and affinities of the peoples of sub-Saharan Africa. These findings were crucial for understanding human evolutionary history and the genetic basis of population diversity in Africa.
The second broad theme of his research was the identification of the molecular DNA variants that cause Mendelian traits, including sickle cell anaemia and albinism, that disproportionately affect African populations. The research of the students and staff he guided also uncovered the mutational profiles for thalassaemia, cystic fibrosis, spinal
2025 https://doi.org/10.17159/sajs.2025/23578
muscular atrophy, Huntington’s disease, myotonic dystrophy, Duchenne muscular dystrophy, fragile X syndrome, several rare skin diseases and other genetic conditions in South African families.6 The knowledge gained informed the genetic services offered by the Department and ensured their relevance in the South African context.
In a seminal review article7, published in the Journal of Medical Genetics in 1990, Jenkins provided a comprehensive overview of the state of medical genetics in South Africa. This publication became a landmark reference that documented the progress made in the field and outlined future directions for genetic research and clinical services in the country.
Educational innovation and legacy
Beyond his research contributions, Jenkins was a keen educator who revolutionised human genetics teaching in southern Africa. Jenkins also pioneered an undergraduate teaching project in medical ethics at Wits, demonstrating his commitment to ethical practice in genetics research and clinical care.
His educational interests led him to increase the contribution of genetics to the undergraduate medical student curriculum, while his enthusiasm for research led him to encourage his staff, colleagues and clinicians to pursue higher degrees in the field. This approach created a multiplier effect, as his students and mentees went on to establish genetic services and research programmes throughout the region and further afield.
Jenkins’ commitment to education extended beyond formal university settings. He recognised the importance of translating genetic knowledge into practical clinical applications. He was a superb speaker who enthralled audiences with his humour, enthusiasm and storytelling ability in many diverse situations.
Jenkins’ work gained international recognition, and he became a respected voice in global genetics communities. His research provided African perspectives on human genetic diversity, challenging Eurocentric assumptions and contributing to a more inclusive understanding of human genetics. He was awarded honorary degrees by the Universities of South Wales, the Witwatersrand and Cape Town for his contributions to science and education.
His community engagement expanded when he started the South African Inherited Disorders Association in 1973. This association initiated genetic support groups in the community, supported research, and raised public awareness of genetic disorders and birth defects. In addition, he was instrumental in founding the Southern African Society for Human Genetics in 1986, creating a space for geneticists to engage and be updated with the most recent developments in the field of human genetics.
Jenkins was also one of the founding members of the Academy of Science of South Africa (ASSAf) which was inaugurated in 1996. In 2003, he was awarded the first ASSAf Science-for-Society Gold Medal, the highest accolade ASSAf confers in recognising outstanding achievement in scientific thinking for the benefit of society.
Impact on contemporary genetic research
The foundation laid by Jenkins continues to influence contemporary genetic research in southern Africa. His emphasis on studying Indigenous African populations has proven prescient, as modern genomic studies have revealed the exceptional genetic diversity present in African populations. Current research building on his work has shown that African populations harbour the greatest genetic diversity of any continental group, reflecting humanity’s African origins.
Modern whole-genome sequencing studies of African populations continue to build on the population genetic frameworks established by Jenkins and his colleagues. These contemporary studies validate many of his earlier insights about population relationships and migration patterns while providing unprecedented detail about the genetic history of African peoples.
Medical ethics, human rights and standing up against apartheid
The tragic death of Steve Biko in 19778 stands as one of the most significant cases in medical ethics, highlighting the intersection of professional responsibility, political pressure and human rights. The subsequent legal and professional proceedings, including the work of academics like Trefor Jenkins, Phillip Tobias, Frances Ames and another group of doctors including Dumisani Mzamane, Yosuf Veriava and Tim Wilson, exposed deep-seated racism within South African medicine and raised fundamental questions about medical ethics under authoritarian regimes.
Through their collaboration on ‘The Steve Biko Affair: A Case Study in Medical Ethics’, Jenkins and co-author Graham McLean provided a critical analysis that continues to influence medical ethics education worldwide.9 10 They used the Biko case to highlight the moral dilemmas that challenged the medical profession’s fundamental principles. The case became a landmark study in medical ethics, revealing how political influence can undermine professional responsibility. It also contributed to the development of international guidelines for medical professionals working in situations of political conflict or oppression and helped establish principles for maintaining medical neutrality and professional independence, even under extreme political pressure.
Jenkins was a founding force behind the establishment of the Steve Biko Centre for Bioethics at Wits in 2007, where a swathe of pertinent issues continues to be debated. He became deeply involved in the destigmatisation of HIV/Aids, advocating to make it a notifiable condition in medical practice in South Africa. Later, Jenkins worked closely with the then Dean of the Faculty of Health Sciences, Max Price, and Yosuf Veriava to put together a submission to the Truth and Reconciliation Commission on behalf of the faculty. There is now a plaque at the entrance of the Wits Medical School that states: “The Faculty reaffirms its rejection of racism and other violations of human rights.”
The contribution of Jenkins’ work as a medical geneticist, ethics educator and moral analyst demonstrates the importance of medical professionals taking broader social responsibilities seriously. His analysis of the Biko affair, combined with his scientific work challenging racist ideologies, represents a comprehensive commitment to using medical knowledge and professional influence in service of human dignity and social justice.
“Prof Trefor Jenkins: A good man in Africa.”1
Image: ASSAf
Conclusion
Trefor Jenkins’ career represents a transformative period in the history of human genetics in southern Africa. Through his visionary leadership, he established the institutional framework, research programmes and educational initiatives that continue to shape genetic research and clinical practice in the region today. His work demonstrated the critical importance of studying human genetic diversity in African populations, both for understanding fundamental aspects of human evolution and for addressing health disparities that disproportionately affect African communities.
Jenkins’ legacy extends far beyond his immediate research contributions. He created a sustainable model for genetic research and clinical services that could thrive in resource-limited settings while maintaining international standards of excellence. His emphasis on education and capacity building ensured that his influence would continue through subsequent generations of African geneticists and clinicians.
The foundation he established continues to be relevant in the genomic era, as researchers increasingly recognise the importance of including diverse populations in genetic studies. Jenkins’ early recognition of the genetic wealth represented by African populations has proven prophetic, as contemporary genomic research continues to reveal the exceptional diversity and evolutionary significance of African genetic heritage.
His career stands as a testament to the impact that dedicated individuals can have on entire scientific disciplines, particularly in areas where such disciplines are still developing. Through his combination of rigorous science, institutional building and educational innovation, Trefor Jenkins created lasting change that continues to benefit both the scientific community and the populations of southern Africa.
References
1. Academy of Science of South Africa (ASSAf). Prof Trefor Jenkins: A good man in Africa. In: Legends of South African science. Pretoria: ASSAf; 2017. https://doi.org/10.17159/assaf.2016/0012
2. Kromberg JGR, Krause A. Human genetics in Johannesburg, South Africa: Past, present and future. S Afr Med J. 2013;103(12 suppl 1):957–961. https ://doi.org/10.7196/SAMJ.7220
3. Kromberg JGR, Ramsay M, Krause A, Soodyall H. Professor Trefor Jenkins: A tribute. S Afr Med J. 2013;103(12 suppl 1), Art. #956. https://doi.org/10 .7196/SAMJ.7627
4. Bonner P, Esterhuysen A, Jenkins T, editors. A search for origins: Science, history and South Africa’s ‘Cradle of Humankind’. Johannesburg: Wits University Press; 2007. https://doi.org/10.18772/22007104181
5. Nurse GT, Weiner JS, Jenkins T. The peoples of southern Africa and their affinities. Oxford: Clarendon Press; 1985.
6. Krause A, Seymour H, Ramsay M. Common and founder mutations for monogenic traits in sub-Saharan African populations. Annu Rev Genom Hum Genet. 2018;19:149–175. https://doi.org/10.1146/annurev-genom-083117-02 1256
7. Jenkins T. Medical genetics in South Africa. J Med Genet. 1990;27(12):760–779. https://doi.org/10.1136/jmg.27.12.760
8. Pityana NB, Ramphele M, Mpumlwana M, Wilson L, editors. Bounds of possibility: The legacy of Steve Biko and Black Consciousness. Cape Town: David Philip Publishers; 1991.
9. Jenkins T, McLean GR. The Steve Biko affair: A case study in medical ethics. Dev World Bioeth. 1982;2(1):77–95.
10. McLean GR, Jenkins T. The Steve Biko inquest and South African medical ethics. Lancet. 1983;1(8316):95–96.
bOOK TITLE: The Meaning of a Life: A South African Scientist’s Tale
AuTHOR: Wieland Gevers
ISbN: 9781928246688 (paperback, 312 pp)
PubLISHER:
Best Red, Cape Town; ZAR320
PubLISHED: 2025
REVIEWER: Anwar S. Mall1
AFFILIATION:
1Emeritus Professor, University of Cape Town, Cape Town, South Africa
EMAIL: anwar.mall@uct.ac.za
HOW TO CITE: Mall AS. A multi-talented scientist reflects on the meaning of his life. S Afr J Sci. 2025;121(9/10), Art. #21946. https://doi.org/10.17159/sa js.2025/21946
ARTICLE INCLuDES:
☐ Peer review
☐ Supplementary material
PubLISHED: 29 September 2025
A multi-talented scientist reflects on the meaning of his life
Milan Kundera’s protagonist Tomas1 loved the way he lived his life, in absolute certainty that it was by his choice, in the spirit of Beethoven’s ‘Es muss sein’ … ‘it must be so’, which became the basis for the latter’s fourth movement of the last quartet, Opus 135. What a shock Tomas had during a conversation with his partner that the love story of his life exemplified the opposite of ‘it must be so’, to ‘it could just as well be otherwise’ The lesson for the reader was that every decision one takes, no matter how innocent, can potentially have any number of possible outcomes. That reminded me of my very first short and unplanned meeting with Professor Wieland Gevers – a brilliant, warm and humble being2 – that changed the trajectory of my life. Thus began my career at the University of Cape Town (UCT) and my relationship with Wieland – a relationship that enriched my life, and certainly those of many others too.
What becomes obvious to readers of The Meaning of a Life is Wieland’s love for the acquisition of knowledge and the sharing of it, his capacity for the deep reflection of the steps he took along the way to fulfil his goals, and, most of all, his unusual ability to integrate different aspects of academic and university administrative matters in a way that made learning exciting and meaningful. His brilliant teaching, which earned him the Distinguished Teachers Award, came from a deep understanding and love of his subject, and for medical research. Whilst his later legacy as an institution builder was aimed at improving the quality of the learning environment at the institution through curriculum and faculty reform, his honest appraisal of why these were not entirely successful is appreciated.
Wieland says in the Preface that he was constantly preoccupied with the arts and humanities while his professional life was devoted to the medical and natural sciences. Perhaps herein lies the origins of his love for integrated learning (much to the benefit of many) in the true spirit of ‘consilience’, shared so clearly in a book of the same title3 by one of the world’s leading biologists of the 20th century, Edward O. Wilson (the first line of which reads “I can remember very well the time I was captured by the dream of unified learning”). Wilson believed that a relationship between the sciences and humanities would be of benefit to human welfare. Whilst reading, I was reminded of the words of another great South African scientist, Phillip V. Tobias, whose advice to his students was that “whilst they specialised in their chosen field, they should be able to carry on a reasonably intelligent conversation in the other fields of human endeavour, including music, art, history, politics and ethics. That is the mark of an educated person.”4
Such ideas were the basis of Wieland’s approach to teaching and research, and later in his attempts as a Senior Deputy Vice-Chancellor of the University of Cape Town at curriculum reform and projects such as the Distinguished Professor lectures and his role in the establishment of the Academy of Science of South Africa (ASSAf), amongst other projects. What was required in the case of the latter at the national level, was an amalgam of scientists of various backgrounds to work together (“…the inclusion of all scholarship that is empirical in nature...”), using evidence-based research and everyday scientific methodology to investigate the country’s health issues. At a national level, Wieland served on the National Health Research Committee to survey and integrate the health research carried out by the different science councils. His aptitude for rigour benefitted the various committees on which he served, when (in many instances), he drew up clear guidelines for the functioning of those committees. His strong opposition to the National Qualifications Framework proposals, based on breaking down learning into unit standards, is another clear example of his love for integrated learning and its benefits.
Readers may well describe Wieland as an institution builder. He went well beyond his clinical training as a medical doctor, a medical biochemist and a teacher, to make enormous contributions to UCT and higher education in the country in general. This required his participation in a variety of educational matters and policies, even at governmental level, guiding major national institutions (some of which he contributed to the formation of), to fulfil their roles in their interactions with tertiary education.
As one reads, one is struck by the notion of how a young mind, if stimulated adequately early enough (South African government take note!), excels not only in a chosen profession, but also is easily able to adapt to new challenges and respond to these challenges with great introspection along the way, resulting in a reflection of ‘a meaning of a life’, shared in this story for the benefit of the interested reader. Wieland has gracefully written about his successes in his career as a scientist, researcher, teacher, administrator (at the level of tertiary education) and family man, bravely and honestly highlighting both his professional and personal failures and shortcomings and the controversies they generated, and the lessons he learnt from it all. This is a ‘must-read’ for all academics and administrators in tertiary institutions and would be of benefit to anyone interested in the educational future of our country. I think it was Albert Einstein who once remarked that a successful and satisfying career in any field creates in one an anchor to broader thinking, a worldview rich in meaning and a desire to share for the benefit of others. Wieland has successfully achieved this in his life – a life that has benefitted many.
It was inevitable that I felt a huge pang of regret and sympathy for those whose dreams and ambitions of a successful career and life such as his were stymied for so many by the discriminatory practices of the previous apartheid regime in South Africa. Wieland’s approach in the training of young scientists went well beyond matters of race, in a true spirit of transformation of our tertiary institutions and I, amongst many, stand testimony to that.
Readers, especially those involved in matters of education, may have wanted or benefitted further from an analysis of our schooling system which produced the ‘unprepared’ student for higher education. The Academic
Development Programme at UCT, whilst claiming much success as a bridging programme between school and university, would have its burden eased if matters of poor schooling standards were attended to by the powers that be.
So, what does give a life meaning? Being comfortable in one’s own being, curiosity and a love for learning, and a strong desire to create opportunities for others to share the benefits of one’s talent, especially with the downtrodden; Wieland displays all these qualities in his rich life.
References
1. Kundera M. The unbearable lightness of being. London: Faber & Faber; 1999.
2. Mall AS. Mucus: Slippery, sticky, but sweet and satisfying. 29th D.J. du Plessis lecture, delivered at the Surgical Research Society Meeting, Cape Town, 3 July 2008. S Afr J Surg. 2007;45(2):54–59.
3. Wilson EO. Consilience. London: Abacus; 1999.
4. Green J. Tobias still tickling funny bone. The Star. 2004 August 06.
bOOK TITLE: Segregated Species: Pests, Knowledge, and Boundaries in South Africa, 1910–1948
AuTHOR:
Jules Skotnes-Brown
ISbN:
9781421448565 (hardcover, 323 pp)
PubLISHER:
Johns Hopkins University Press, Baltimore, MD; USD65
PubLISHED: 2024
REVIEWER:
Anjuli Webster1
AFFILIATION:
1Department of Liberation Studies, University of Fort Hare, Alice, South Africa
EMAIL: awebster@ufh.ac.za
HOW TO CITE:
Webster A. Segregated species, language and knowledge. S Afr J Sci. 2025;121(9/10), Art. #22001. https: //doi.org/10.17159/sajs.2025/22001
ARTICLE INCLuDES:
☐ Peer review
☐ Supplementary material
PubLISHED: 29 September 2025
Segregated species, language and knowledge
Segregated Species is a history of animals, insects, disease, settler science, knowledge, boundary-making and segregation in early 20th century South Africa. Through five regionally specific case studies, Skotnes-Brown explores how and why some animals came to be protected by law in colonial South Africa, while others came to be reviled. The author frames his inquiry around three main analytical concepts: boundaries, pests and knowledge. He traces how various creatures, from elephants to gerbils and trypanosomes to locust birds, crossed physical boundaries between veld, farm and town, and conceptual boundaries between useful and harmful. In doing so, he offers an interspecies history of the making of segregationist South Africa.
The book is clearly written and based on extensive research in various archives, periodicals, newspaper articles and reports by scientists and government experts. Geographically, the first two chapters focus on discrete areas –the Addo Elephant Park of the Eastern Cape and colonial Zululand. The boundaries of Chapters 3 and 4 expand through the routes of birds and rodents, respectively – creatures that are difficult to contain through fencing or hunting. The final chapter narrows the geographical focus again – on the Kalahari Gemsbok National Park. Each substantive chapter is preceded by a partly fictional interlude drawing on historical evidence.
Skotnes-Brown uses the term “vernacular knowledge” to describe expertise among groups of people beyond the realm of the professional sciences (p. 17). According to the author, the making of settler colonial scientific expertise often depended on settler scientists, farmers and bureaucrats appropriating African knowledge, while simultaneously representing Africans as untrustworthy, unreliable and unscientific. Scientific debates about pest control were intimately related to debates about racial segregation – an argument he makes compellingly.
I have several concerns with the book, but will focus mainly on two here. My first concern relates to the author’s claims regarding African knowledge while relying heavily on English-language sources. Skotnes-Brown states that he has written a history “without silencing African historical actors” by “scouring periodicals, newspapers, anthropological texts, and retrospective interviews” to find instances of “African expertise” (p. 242). I think that a caveat might have been made here that the scouring is almost exclusively in English-language sources.
Chapter 3, ‘Birds and the Balance of Nature’, demonstrates the issue most clearly. The majority of the chapter traces settler ideas and debates about the usefulness of wild birds, focusing on economic ornithology’s attempts to integrate them into settler agrarian economies (p. 108). The main actor in the chapter is settler zoologist Frederick FitzSimons, who conceived of wild birds as “part of a natural system that sustained settler capitalism and white prosperity in rural areas” (p. 121). In a section titled ‘Black Expertise, the Demonization of Black Farmers, and White Degeneration’, Skotnes-Brown claims to paint a picture of “indigenous African ideas about birds” (p. 122). The sources he engages deeply for this section of the chapter are English-language sources, most articulated from a white settler viewpoint, whether in the figure of Eastern Cape missionary and settler Reverend Robert Godfrey, settler linguist Clement Doke, or settler anthropologist Eileen Krige (p. 123–124). While he cites Azariel Sekese’s short story ‘Pitso ea Linyonyane’, Skotnes-Brown’s sources for his account of this story are all secondary English-language sources (p. 122, and footnotes 78–81 on p. 282–283). Rather than referring to sources in Indigenous languages which the author did not read to draw conclusions about “African thinking” about the “economic relations between African groups and birds” (p. 122), I think the author should have been more frank about the limitations of the study.
There are African actors and voices included in the book. Chapter 2, ‘Transporting Trypanosomes’, is probably the most successful in this regard. Skotnes-Brown explores Indigenous knowledge about nagana in some detail, and shows how settler science simultaneously drew on this knowledge while representing it as unscientific. However, at other times, it seems as if the ‘African voice’ has been brought in post-facto, and tagged on to the analysis.
Skotnes-Brown does admit that African knowledge was not the “sole focus” of the study. Fair enough. However, in the Conclusion, he frames Segregated Species as a kind of foundational text in interspecies South African history which he hopes will encourage other scholars with “skills in Nguni languages” (why not Sotho-Makua-Venda?) to draw on linguistics, archaeology, and the “discovery of new archives” to explore further the work of African historical actors (p. 242). New methods or archives are not necessarily required for this kind of work. To continue with the example of Chapter 3 – a basic search for the Sotho word ‘linonyana’ in Readex’s African Newspapers collection brings up 202 articles in Leselinyana la Lesutho. A search for the Zulu ‘izinyoni’ brings up 37 articles in Ilanga lase Natal and 35 articles in Izindaba Zabantu. The Xhosa word ‘intaka’ returns 63 articles in Imvo Zabantsundu, 39 in Izwi Labantu, and 23 in Isigidimi Sama-Xosa. This is not to mention the numerous collections of oral traditions, proverbs and, indeed, monographs written by African authors in Indigenous languages. The sources are there. It is only language skills that are required to engage them seriously and on their own terms.
The second concern I have is with the author’s conflation of so-called ‘racism’ and ‘segregation’ among certain animal groups with white supremacy and anti-black racism in settler colonial South Africa. While Skotnes-Brown claims to draw connections rather than make comparisons between settler strategies of categorisation and segregation among human and animal communities (p. 12), and that “the subjective experiences of animal and human oppression cannot be conflated or even compared” (p. 239), at times he does precisely this. For example, in Chapter 1, ‘Domestication and Degeneration’, he writes that, although “racist evolutionary and ecological thinking was typically associated with humans, elephants were also subjected to it” (p. 31). Due to “scientific racist ideas”, settler science advocated for the preservation of elephants in a separate park, rather than assimilation into colonial society (p. 62). While the term ‘race’ may describe different species in general biological taxonomy, Skotnes-Brown here conflates actions regarding elephants with white supremacy and racism in the human,
historical, political realm. In the final chapter, Skotnes-Brown returns to the models used to preserve the Addo elephants in trying to make sense of the segregation of Khoe-San peoples in the Kalahari Gemsbok Park. Here he makes direct comparisons (not simply connections) between San peoples and elephants, writing that “the management of human and animal-kind was not just connected, as in other chapters, but strategies for managing animals were actively redeployed for the preservation of humans”, and that we cannot understand the subjection of San communities in the 20th century without “recognizing their roots in game management and pest control” (p. 234). I think seeking the “roots” of settler colonial methods of dehumanising Indigenous
communities in animal management during the 20th century can obscure the deep origins and global dimensions of white supremacist colonial conquest, domination and violence.
These few concerns aside, Segregated Species is an important contribution to the historiography of settler colonialism and settler scientific knowledge in southern Africa. Skotnes-Brown has done an exceptional job revealing the interconnections between settler colonial science and animal conservation and management. The book will be useful for historians of science, settler colonialism and the environment, as well as those interested in animal studies more broadly.
https://doi.org/10.17159/sajs.2025/22001
bOOK TITLE: Frantz Fanon: Combat Breathing
AuTHOR: Nigel C. Gibson
ISbN: 9781776149346 (paperback, pp 362)
PubLISHER: Wits University Press, Johannesburg; ZAR395
PubLISHED: 2024
REVIEWER: Wahbie Long1
AFFILIATION:
1Department of Psychology, University of Cape Town, Cape Town, South Africa
EMAIL: wahbie.long@uct.ac.za
HOW TO CITE:
Long W. A life in motion: A review of ‘Frantz Fanon: Combat Breathing’. S Afr J Sci. 2025;121(9/10), Art. #22129. https://doi.org/10.17159/sa js.2025/22129
ARTICLE INCLuDES:
☐ Peer review
☐ Supplementary material
PubLISHED: 29 September 2025
A life in motion: A review of ‘Frantz Fanon: Combat Breathing’
What more can one say about Frantz Fanon? Whether you like him or not, he is surely one of the most important anticolonial thinkers of our time, canonised by some as “the most noble approach to the human that has ever been made until now in this inhuman world” (p. 141). For Francis Jeanson – it was he who urged the title, Black Skin, White Masks – Fanon was clearly more than a man: he had become a guide, a yardstick like no other. If, however, we are all his interlocutors – and it is hard not to be in a country like South Africa – then perhaps it is more fitting to describe him as “a climate of opinion”, as W.H. Auden intoned in the wake of Freud’s passing.
It is an odd turn of phrase – ‘whether you like him or not’ – to use for a man who died over 60 years ago. But it is an apt one – because no one reads Fanon and remains unaffected. When Jeanson – Fanon’s editor – asked him to explain a sentence from Black Skin, White Masks, his response was as follows: “This sentence is inexplicable. I seek, when I write such things, to touch my reader with affect… that is to say irrationally, almost sensually.” (p. 60). Viscerality is a standout theme in Nigel Gibson’s latest offering, Frantz Fanon: Combat Breathing. Indeed, by referencing the most basic human process in the subtitle of his book, Gibson dials it back to the elemental. He observes how Fanon repeatedly uses the words “suffocated”, “smothered” and “imprisoned” in his own writing, capturing the constrictedness of lives hemmed in by racism and colonialism. Space, food, water are denied. Even the act of breathing must be controlled: “Under these conditions, the individual’s breathing is an observed, an occupied breathing. It is a combat breathing”1(p.65), a struggle to survive, giving rise to underground forms of existence that supply the oxygen “shap[ing] a new humanity”1(p.181)
Combat Breathing is an intellectual biography that, from one perspective, frames Fanon’s life as a life in motion Fanon was always acutely aware of the body’s movement through space – no doubt reinforced by the courses he took with Merleau-Ponty at the University of Lyon – whether reminiscing about Fort-de-France’s main park, the savannah, and its after-school crowds of young people “walking up and down, greeting one another, grouping –no, they never form groups, they go on walking”2(p.14); or theorising the imposition of “a racial epidermal schema”1(p.84) that corrupted the possibility of “creat[ing] a real dialectic between my body and the world”1(p.83); or explaining the lack of movement, “the colonized’s idleness… a protection… since labour… leads to nothing”3(p.530)
Yet Fanon also displayed a unique understanding of how his own body operated in relation to his mind. It is now a well-known fact that, when composing his works, he would typically ask for someone to type as he spoke his thoughts out loud. He followed this method with his play Parallel Hands; he used it for Black Skin, White Masks, and he did it again with A Dying Colonialism. He would pace up and down the room, embodying the dialectic in motion: “His thinking seemed to spring from the movement of his body, like something physical” (Aubenas, 2017 quoted in Gibson p. 56). Invariably, he relied on no notes and the end-product required minimal revision.
Not much is known about Fanon as an ordinary person: he was not one to talk about himself, while his widow, Josie, seldom spoke of him in public after his death. Even so, Gibson brings together a range of first-hand impressions of the man himself. According to Marie-Jeanne Manuellan – the assistant and friend who typed A Dying Colonialism –he loved to teach and “grow brains” (p. 189); for Alice Cherki – his colleague in Algeria and Tunisia – “[h]e was much too fond of love and friendship and too sensitive to human suffering” (p. 190). And still for others who knew him, he was a devoted husband and father, had a wonderful sense of humour, and proved himself several times on the battlefield – although there appears to be some debate about whether he was a team player, especially on the soccer field. His writings, however, are a testament to his radical humanism: for Gibson, “[j]ust as Fanon was not an individualist, his universalism did not mean uncritically following orders” (p. 44–45).
There is a distinctly hagiographic feel about Combat Breathing, which places its portrayal of Fanon some distance from, for example, David Macey’s4 comparatively measured assessment in Frantz Fanon: A Biography. On the other hand, Gibson’s obvious admiration for Fanon in no way diminishes the importance of this book: on the contrary, the growing popularity of pathography and its concern with making greatness accessible – or, to use a different idiom, with dragging the sublime into the dust – has robbed us, arguably, of heroes at a time when they are in short supply. Fanon, though, rightly belongs in the pantheon of great liberation theorists. On more than one occasion, his older brother, Joby, asked him why he was making other people’s fights his own. His reply on being asked why he was joining the French army in World War II was characteristically withering: “Whenever liberty is in question, I feel concerned. We’re all concerned, whatever our color – white, black, yellow, coconut, dark brown, cocoa. Your teacher is a bastard and I swear to you, today, that whenever liberty is threatened, I’ll be there” (J. Fanon, 2014 quoted in Gibson p. 38–39).
Needless to say, Combat Breathing goes far beyond the terrain of anecdotes. Gibson is a leading Fanonian scholar, and he has produced a highly engaging account stitching together Fanon’s life and key ideas, walking us through the main arguments of his three most famous texts: Black Skin, White Masks2 , A Dying Colonialism1 and The Wretched of the Earth5. Accordingly, this book is for anyone needing an entry point into Fanon’s challenging corpus, for (training) psychotherapists grappling with the role of politics in the consulting room, and for activists and intellectuals troubled in these genocidal times by the cravenness of the powers that be. Frantz Omar Fanon: political theorist, psychiatrist, freedom fighter.
2025. The Author(s). Published under a Creative Commons Attribution Licence.
Review
References
1. Fanon F; Chevalier H, translator. A dying colonialism. New York: Grove Press; 1965.
2. Fanon F; Markmann CL, translator. Black skin, white masks. New York: Grove Press; 1967.
3. Fanon F; Corcoran S, translator. The meeting between society and psychiatry. In: Khalfa J, Young R, editors. Alienation and freedom. London: Bloomsbury Academic; 2018. p. 511–530.
4. Macey D, Frantz F. A biography. New York: Picador; 2001.
5. Fanon F; Farrington C, translator. The wretched of the earth. New York: Grove Press; 1965.
bOOK TITLE: Dockside Reading: Hydrocolonialism and the Custom House
AuTHOR: Isabel Hofmeyr
ISbN: 9781776147625 (paperback, 136 pp)
PubLISHER: Wits University Press, Johannesburg; ZAR330
PubLISHED: 2022
REVIEWER: Jane Carruthers1
AFFILIATION:
1Department of History, University of South Africa, Pretoria, South Africa
EMAIL: j.carruthers@mweb.co.za
HOW TO CITE: Carruthers J. Books on the hydrocolonial margin. S Afr J Sci. 2025;121(9/10), Art. #22294. https: //doi.org/10.17159/sajs.2025/22294
ARTICLE INCLuDES:
☐ Peer review
☐ Supplementary material
PubLISHED: 29 September 2025
Books on the hydrocolonial margin
Isabel Hofmeyr is one of South Africa’s most highly esteemed academics and has an impressive international reputation. She refers to the Department of African Literature at the University of the Witwatersrand as her “intellectual home since 1984” (p. ix), where she was based until her retirement in 2023. She is currently Professor Emeritus and an active member of the Wits Institute for Social and Economic Research (WISER). From 2013 to 2022, she taught biennially in the English Department at New York University and is prominent in the worlds of Indian Ocean Studies and the Oceanic Humanities. With her global as well as national profile, Hofmeyr is widely respected and has garnered many awards for her work.
As befits a literary critic and scholar of English literature, her research field is print culture, and her speciality is in analysing how this relates to southern African literary history. Her best-known books include We Spend our Years as a Tale that is Told: Oral Historical Narrative in a South African Chiefdom (Wits University Press; 1993), The Portable Bunyan: A Transnational History of The Pilgrim’s Progress (Princeton University Press; 2004) and Gandhi’s Printing Press: Experiments in Slow Reading (Harvard University Press; 2013).
Hofmeyr is a creative thinker and imaginative scholar who probes unusual issues. Her latest publication moves away from book authorship and reception to what she calls ‘bookhood’ (p. 84), namely the materiality of a book. Her aim is to consider the book as an object: its appearance, its manufacture and publication, its travels, and what it has undergone physically in order to survive and to find a reader. In our current world of conversations over tariffs, migration and free speech, what Hofmeyr has uncovered in Dockside Reading is her analysis of the book as commercial object and traveller. This makes for a fascinating tale. This is a short book, 121 pages in total, but the notes and bibliography attest to the huge number of sources that she has been able to consult, despite the COVID lockdown period during which much of the book was written.
There are many threads to unpack in this experimental book which narrates the goings-on at the Custom House in South Africa, particularly that located in Durban. It was the customs and excise staff at the dockside through which books were funnelled as they arrived on ships as items of cargo. There, at the hands of the officials, they were scrutinised and evaluated before being released onshore and into the interior. For some of this story, Hofmeyr uses the documented career of George Rutherford, the Customs Collector at Durban’s harbour, and she provides some comparisons with Australia. Hofmeyr leads from this theme to the changing and rather idiosyncratic censorship procedures that were applied to books as officials flicked through the pages.
Published in 2022, Dockside Reading was eagerly read and quickly acclaimed in scholarly reviews in a wide range of journals including, for example, American Historical Review, Journal of British Studies, African Studies Review, South African Historical Journal, and South African Journal of Cultural History, as well as on H-Net Moreover, The Cambridge Journal of Postcolonial Literary Enquiry contains a ‘Book Forum’ in which Hofmeyr explains the aim and content of her book and gives her response to three specific readers.1 By perusing some of these assessments, readers of the present review would be rewarded with far more detail than is possible here. The numerous peers who have reviewed Dockside Reading home in on how Hofmeyr works with the concept of hydrocolonialism –the theory she advances to dissect the complex interface between land and sea during the colonial era. Literary scholars who have reviewed this book tend to concentrate on the theoretical possibilities and limitations of the concept, and suggest the further interrogation required to bring it into full use.
My interests as an historian were slightly different. I wondered about the careers of the dockside officials, their qualifications and backgrounds for this type of employment as it changed over time and with the political context. Apart from Rutherford, what type of men were the others? How was copyright legislation aligned to import duties and specific decisions made? Hofmeyr’s descriptions of the fate of some of the books that landed in Cape Town during the South African War of 1899–1902 are illuminating.
Thus, Dockside Reading opens new and exciting avenues of enquiry for many fields of research. Hofmeyr has shown how rich the archival sources are and how much more there is to learn about, and to understand, the past through the lens of customs and excise at the harbour. Moreover, the long history of the power and control in the hands of dockside officials, both white and black (naturally all men), in the colonial era and the use of the ‘tariff handbook’ would certainly reward further historical investigation. So too, would the role of colonial book publishers and booksellers, Thomas Maskew Miller (1863–1930) in Cape Town for example, be instructive.
In her concluding chapter, Hofmeyr quotes from a collection entitled Book Parts2, in which a book is defined as “an alignment of separate component pieces, each possessed of particular conventions and histories”. In Dockside Reading, Hofmeyr has captured many of these pieces, using a truly impressive range and variety of sources, and has encouraged her readers to think about the many lives, cultures and travels in which books were enmeshed in the colonial era.
References
1. Hofmeyr I. Reader response to Dockside Reading. Camb J Postcolonial Lit Inq. 2023;10(2):254–258. https://doi.org/10.10 17/pli.2023.10
2. Duncan D, Smyth A. Introductions. In: Duncan D, Smyth A, editors. Book parts. Oxford: Oxford University Press; 2019. p. 1–10.
bOOK TITLE: A New History of Formal Schooling in South Africa, 1658–1910: An Education of Contradictions
Beyond grand narratives: Ambiguity, complexity and contradiction in South Africa’s history of formal schooling
ISbN: 9780796926807 (paperback, 312 pp)
PubLISHER: HSRC Press, Cape Town; ZAR375
PubLISHED: 2024
REVIEWER: Ashley Visagie1
AFFILIATION:
1School of Education, University of Cape Town, Cape Town, South Africa
EMAIL: ashley.visagie@uct.ac.za
HOW TO CITE: Visagie A. Beyond grand narratives: Ambiguity, complexity and contradiction in South Africa’s history of formal schooling. S Afr J Sci. 2025;121(9/10), Art. #22583. https: //doi.org/10.17159/sajs.2025/22583
ARTICLE INCLuDES:
☐ Peer review
☐ Supplementary material
PubLISHED: 29 September 2025
A New History of Formal Schooling in South Africa, 1658–1910: An Education of Contradictions claims a first as a history of South African schooling from the vantage point of subjugated people. While there are other treatments which privilege the perspective of the oppressed, such as those writings which have emerged from within the Non-European Unity Movement, as well as the many contributions to edited volumes in the History of Schools and Schooling series, the book’s claim holds strong because it is the first of this nature to offer a systematic and in-depth treatment exploring the emergence and development of formal schooling in South Africa. “Formal”, the authors remind, is not employed pejoratively but rather serves to differentiate between pre-colonial forms of education and cultural transmission, and the import of the formal school.
The book begins with the story of the first school in South Africa, a school for slaves, run by Pieter van der Stael, and ends in the period building up to the formation of the Union of South Africa. It adopts a historical periodisation which divides time according to education under Dutch rule, education under British rule, the impact of the mineral revolution, and the construction of the Union after the South African War of 1899–1902.
The authors adopt a Foucauldian approach in reconstructing the story of formal schooling in South Africa and this also gives the book its unique character, highlighting the ambiguities and contradictions in how this history has previously been presented. In the book, readers will encounter a polyphony of voices and be confronted with the complex and contradictory positions and stances which both the agents and the institutions appear to hold together, and which offer caution against reading history in ways which flatten the landscape or present individuals or groups in a one-dimensional manner for the sake of building a grand narrative. In this regard, the history of formal schooling may have been a history of subjection but, as the authors show, it was also a story of subjugated people subverting the purposes of such an education for domination, and also of appropriating the master’s tools in acts of resistance. It is a history which does not represent Indigenous and enslaved people as totally dominated, demonstrating the agency people have even under abhorrent conditions, even if such agency is expressed in playing truant, and in this way, the text may be positioned alongside other recent publications such as The Lie of 1652 (Tafelberg; 2020) or The Truth about Cape Slavery (Tafelberg; 2024). In a similar manner, missionary educators, for example, are not over-simplistically presented as the advance guard of colonialism as in Dora Taylor/Nosipho Majeke’s The Role of Missionaries in Conquest (APDUSA; 1986). While they may have been implicated in such a role, the authors of this new history remind us that many were also criticised for undermining ruling ambitions.
At its core, the book is an invitation to recognise the complexity of human beings and presents a caution against anachronistically reading into history clear projects and plans, where much more uncertainty, contradiction and reactionary recourse existed in relation to broader social, political and economic upheaval and change. As the authors express: “ the nature of power at the Cape is that it is never either singular in its character or without its own internal contradictions. It might be a moment structured in dominance, and this dominance is, of course, historically shaped, but it is never, using Foucault’s terms, fundamental or unchallenged” (p. 23) This nuanced view, it seems, is becoming increasingly necessary as an antidote to reductive understandings of race and class violence in South Africa, and also to ‘great man’ theories which posit particular figures as “architects” of history in ways that neglect the social conditions and ideas which came together in a particular time and place.
Returning to the conceptual framework in which A New History of Formal Schooling in South Africa is anchored, the final chapter, which brings the book to the formation of the Union, very strongly posits race as dominating the South African social imaginary. Race, they argue, was increasingly inscribed in law and practice and in body and mind, with education as “the premier site for shaping and refining the individual’s consciousness” (p. 232), a racial consciousness. The authors put it quite plainly: “Race determines how everything is seen” (p. 232). Importantly, however, the authors’ analysis arrives here through a political economy analysis which links racist thought (ideas) with both social processes (industrialisation and capitalist modernity) and political interests. In this regard, the book cautions against the limitations of both a purely ideological critique and economic reductionism, and this is not a small matter because such points of view continue to abound, potentially undermining more practical questions of what is to be done in building alternatives.
Understanding how the purposes of education are entangled with political interests and social processes and how this has played out historically is vital to how future teachers construct their own identities. The careful treatment and engagement with both existing work and archival sources makes the book well suited as an academic read to introduce students to the history of formal schooling in South Africa. While at times the vocabulary choice could have been more accessible, particularly so in South Africa where the majority of potential readers (and teachers) are not first-language English speakers, the book remains well organised and legible. Where the popular education text The Right to Learn (Ravan Press; 1985) has for decades been used as an introductory reader because of its accessibility and its critical point of departure, A New History of Formal Schooling in South Africa is a much-needed text to revive an in-depth engagement with the history of education – a critical body of knowledge which appears to have increasingly been neglected or deliberately undermined in the design of teacher education programmes.
1Department of Education Policy Studies, Stellenbosch University, Stellenbosch, South Africa
EMAIL: lgoliath@sun.ac.za
HOW TO CITE:
Goliath LL. Planning the academic journey: A review of ‘Roadmap of the Professoriate’. S Afr J Sci. 2025;121(9/10), Art. #22234. https: //doi.org/10.17159/sajs.2025/22234
ARTICLE INCLuDES:
☐ Peer review
☐ Supplementary material
PubLISHED: 29 September 2025
Planning the academic journey: A review of ‘Roadmap of the Professoriate’
As a novice researcher, I approached Habib Noorbhai’s Roadmap of the Professoriate with curiosity and a lack of clarity about what to expect. Noorbhai, a lecturer at the University of Johannesburg and a visiting professor at the Massachusetts Institute of Technology (MIT), hopes to mentor emerging researchers on academic journeys. The book presents 25 strategic rules and 40 actionable takeaways in 12 thematic sections.
The 12 sections are wide ranging, from ‘Defining Your Path’ to ‘Building a Legacy’. Each includes strategic rules presented as brief, condensed commandments, such as “Publish with Purpose”. These rules are not just theoretical concepts, but practical guidelines that equip you for your academic journey, making you feel not just prepared, but empowered and capable. Near the book’s end, tangible takeaways – such as worksheets, templates and checklists – are given to apply the strategic rules. In addition to this, the guide offers reflection prompts that allow you to consider your ambitions genuinely. In this way, Noorbhai inspires readers and leaves them ready to embark on their academic journey.
The checklists were helpful in that they provided me with a concrete starting point. However, at times, I wished for more explanation on why each rule is significant in the broader academic project.
The strength of this book lies in the provision of worksheets and templates; it felt infinitely less intimidating to have a prefabricated career map to follow than to create one of my own from scratch. Moreover, the guide includes research, teaching, leadership and service. It is a good reminder of the holistic duties of an academic as presented in Jansen and Visser’s On Becoming a Scholar (African Minds; 2022). In other words, Noorbhai’s book reminds the reader that being an academic involves much more than just publishing. Some examples seemed more applicable to South Africa (e.g. National Research Foundation grant writing tips), while others, like stories about MIT visiting professorships, might appear less relevant to readers outside North America.
As someone still learning to dissect academic writing, I was surprised to find that this guide paid little attention to career development theories (i.e. how and why academic identity develops). This made it difficult to understand the purpose behind many of the exercises, as theory provides a kind of map that makes it easier to understand the ‘why’ behind the ‘how’.
Despite these limitations, the guide is generalisable across academic audiences. Noorbhai has designed his rules and templates to be broad and generic to fit various contexts; anyone should be able to adjust them to suit their institution. While the advice related to South Africa’s National Research Foundation may not be directly comparable to that of other national research councils, readers in different countries could adapt the advice accordingly. This adaptability makes the audience feel the book can be tailored to their needs.
Noorbhai highlights the book’s relevance to the South African higher education system by acknowledging the relative lack of mentorship in South Africa. As such, the focus on peer networking and strategic planning felt reassuring. The South African references within the book proved especially helpful in ‘locating’ this advice within our national academic context, making one feel understood and catered to in the academic journey.
For someone who envisions themselves as a professor in the future, Roadmap of the Professoriate offers a user-friendly, nuts-and-bolts introduction to planning an academic career. Its clear layout and straightforward exercises make the material easy to digest, providing a comfortable learning experience for graduate students and early career academics.
Yet I wish the book provided more justification for why the strategies make sense (i.e. theory) and adaptation for contexts other than South Africa and North America. Nonetheless, I recommend Roadmap of the Professoriate to early career academics needing structured, hands-on support in their journey towards the professoriate.
2025. The Author(s). Published under a Creative Commons Attribution Licence.
Author: Francis Thackeray1
AFFILIAtIoN:
1Evolutionary Studies Institute, University of the Witwatersrand, Johannesburg, South Africa
CorrESPoNDENCE to: Francis Thackeray
EMAIL: francis.thackeray@wits.ac.za
hoW to CItE:
Thackeray F. Use of cocaine and cannabis in 17th-century Italy and England, with reference to Shakespeare. S Afr J Sci. 2025;121(9/10), Art. #21465. https: //doi.org/10.17159/sajs.2025/21465
ArtICLE INCLuDES:
☐ Peer review
☐ Supplementary material
KEYWorDS:
cannabis, cocaine, tobacco pipe, Shakespeare, 17th century
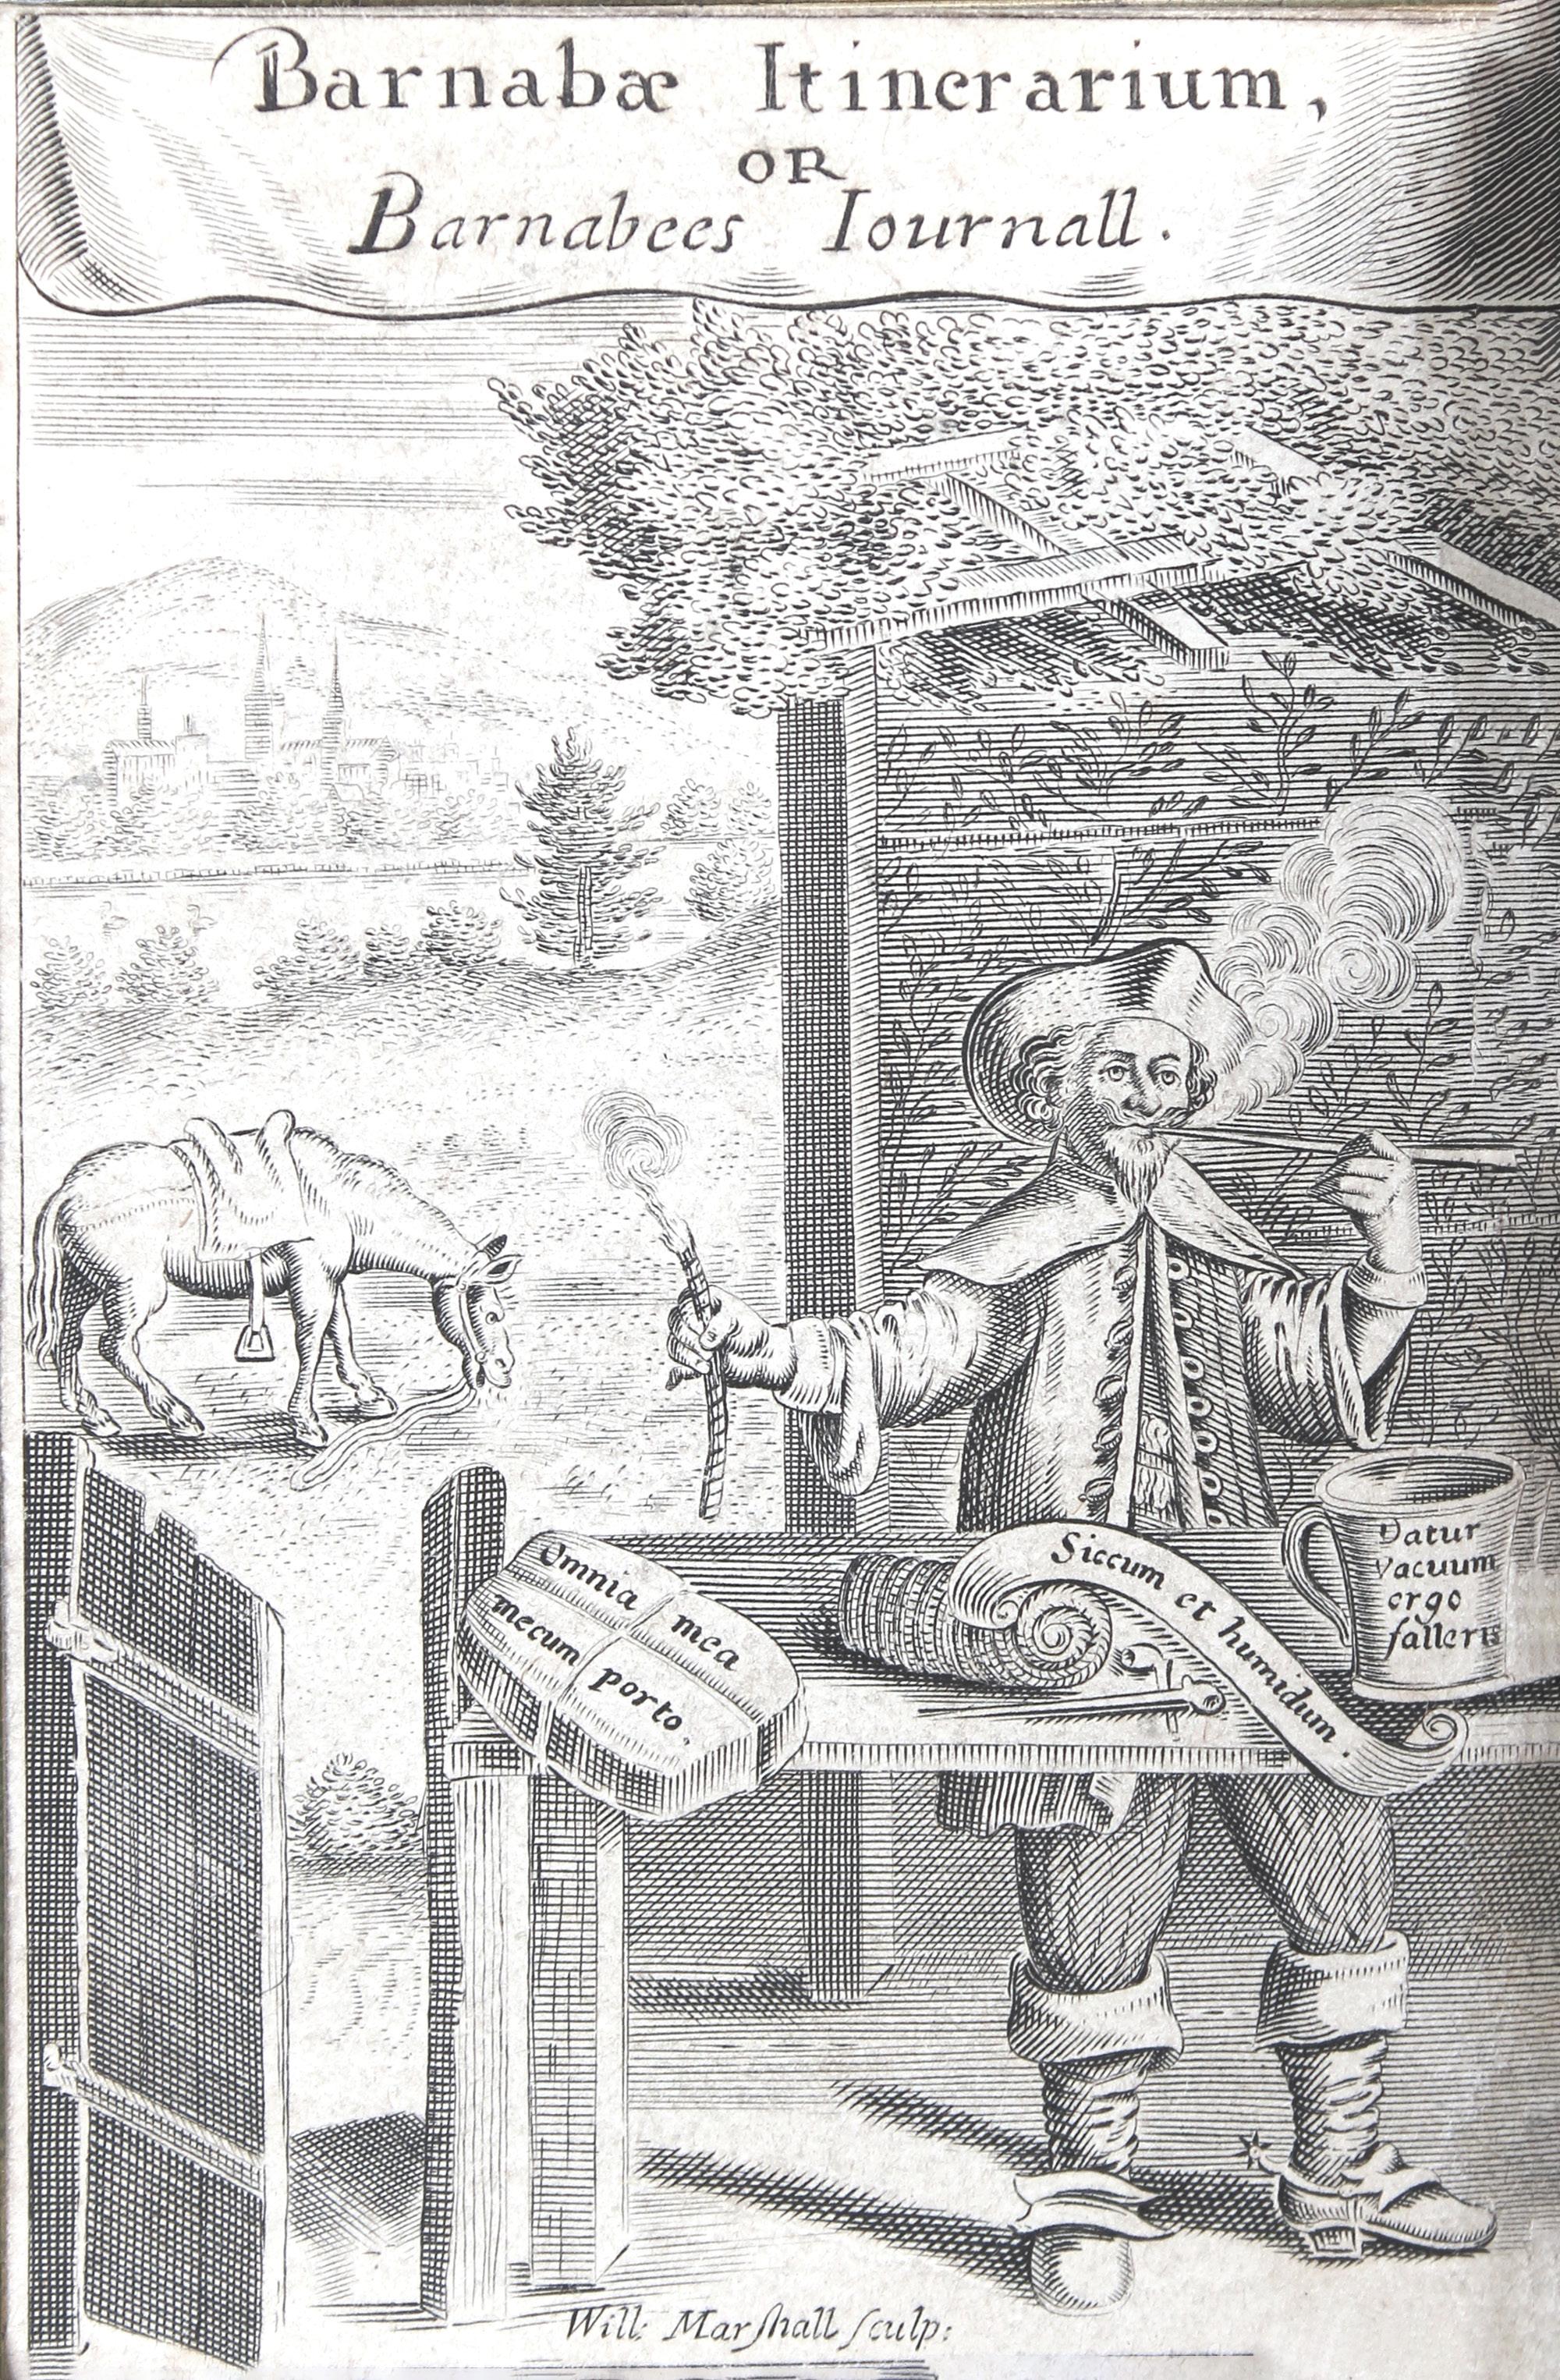
Use of cocaine and cannabis in 17th-century Italy and England, with reference to Shakespeare
Significance:
• Chemical evidence for the use of cocaine (Erythroxylum) and cannabis (Cannabis) in the early 17th century has been obtained from corpses in a crypt in Milan.
• Chemical evidence for the smoking of cocaine and cannabis is indicated from chemical analyses of early 17th-century clay ‘tobacco’ pipes from England.
• The combination of literary and chemical evidence supports a hypothesis that William Shakespeare used hemp/cannabis for creative writing (“invention in a noted weed”, Sonnet 76).
• There is no evidence that the Bard used Erythroxylum. Sonnet 76 relates to turning away from “compounds strange”, i.e. strange drugs.
• There was a need to be cryptic about the smoking of cannabis in the 17th century.
Giordano et al.1 have published a dramatic article entitled ‘Forensic toxicology backdates the use of coca plant (Erythroxylum spp.) in Europe to the early 1600s’, pointing to the probable chewing of cocaine-rich leaves. The new evidence has been obtained from archaeotoxicological analysis of brain tissue from human bodies in an early 17th century Ca’Granada crypt in Milan, supplementing evidence (from femoral bone) for the use of cannabis (Cannabis spp.) by other individuals represented in the same crypt adjacent a hospital.2 They state:
The alkaloid of cocaine was detected in two separate biological samples and can be associated [with] Erythroxylum spp. consumption. Given that the plant was not listed inside the detailed hospital pharmacopeia, it may not have been given as a medicinal remedy but may have been used for other purposes 1
Whereas the new report refers to early 17th century human cranial tissue in Italy, attention can be directed to a publication by Thackeray et al.3 in 2001 in the South African Journal of Science, pointing to the smoking of coca leaves in early 17th century clay ‘tobacco’ pipes from Stratford-upon-Avon (Harvard House, specimen WS-7A) and Abingdon (near Oxford, specimen 1912.6) in England. Cocaine was indicated by m/z mass:charge ratios determined from gas chromatography with mass spectroscopy (GCMS) of residues in the pipe fragments.
In his The Herball of 1597, the botanist John Gerard mentioned a kind of tobacco as “the henbane of Peru”. Henbane in Europe is a plant with toxic effects. In 1579, during his circumnavigation of the world, Sir Francis Drake sailed into the Peruvian capital of Lima, and it is probable that he (among others) collected coca leaves – evidently the ‘henbane’ tobacco from Peru to which Gerard referred. Together with the results of chemical analyses of ‘tobacco’ pipes from the vicinity of Stratford-upon-Avon and Oxford3, this presents a strong case that coca leaves were being smoked in England in the early 17th century.
Shakespeare
Thackeray et al.3 were careful to note that, in their study, neither of the pipes with cocaine (n = 2 out of a sample of 24) came from the foundations of Shakespeare’s house (New Place). Furthermore, it could not be claimed that any of the pipes were necessarily smoked by the Bard.
The chemical evidence for cocaine was mentioned by Thackeray et al.3 in relation to Shakespeare’s Sonnet 76 in which “compounds strange” occurs. The word ‘compound’ in the early 17th century in England most certainly referred to drugs. It would seem apparent that the sonneteer was indicating a preference to turn away from “compounds strange”4,5
Chemical (GCMS) evidence from residues in clay ‘tobacco’ pipes from Stratford-upon-Avon and environs also points to the smoking of cannabis3, based on signals with the following m/z ratios: 193, 231, 238, 243, 246, 258, 271, 295, 299, 310 and 314. Although Thackeray et al.3 were extremely cautious in their interpretations on account of low intensities, it can be noted that all of these 11 m/z values relate to cannabis. Suggestive evidence for the latter was discovered in 8 out of 24 pipe fragments, and in 4 samples from New Place, Shakespeare’s residence. Thackeray’s4 5 interpretation of Sonnet 76 is that the Bard was cryptically referring to a preference for “the noted weed” (cf. cannabis, as a kind of ‘tobacco’), instead of “compounds strange” (cf. cocaine). In one scenario5, Shakespeare smoked cannabis moderately as a source of inspiration (cf. “The Tenth Muse” for “invention” in Sonnet 38), reflected also by “invention in a noted weed” in Sonnet 76 where “invention” refers to creative writing5. The late Lester Grinspoon6 from Harvard Medical School stated that the use of cannabis has the potential to “promote fluidity of association and enhance insight and creativity”, at least in moderation. This is in complete contrast to the effects of Erythroxylum, i.e. cocaine.
Discussion
Giordano et al.1 claim that their results are “the first evidence of Erythroxylum spp. use in Europe before the 19th century, backdating our understanding of the presence of the plant by almost two centuries”. The earlier chemical signature for cocaine, reported in 2001 by Thackeray et al.3, was based in part from the pipe specimen from
2025 https://doi.org/10.17159/sajs.2025/21465
Abingdon with a bowl diameter of 9.8 mm, indicating a date range of 1600–1620 if one uses measurements given by Friederich7 as a basis for chronological estimates. The Ca’Granada crypt samples from Milan, with evidence of cocaine and Cannabis as well as Papaver (opium poppy)8, were apparently accumulated between 1638 and 1697.2
On the basis of research undertaken by Giordano et al.1 and by Thackeray et al.3, it would seem that the smoking and/or chewing of coca leaves, in England, Italy and probably elsewhere in Europe, was practised in the early 17th century, if not before. Sir Francis Drake had had the potential opportunity to introduce coca leaves to England after his visit to Peru in 1579. At about the same time, John Hawkins (in 1573) and Sir Walter Raleigh (in 1586) introduced tobacco in the form of Nicotiana. The latter plant was indeed also identified by Thackeray et al.3 from their study of early 17th century English clay pipes.
What needs to be recognised is that more than one kind of ‘tobacco’ was smoked in Stratford-upon-Avon and elsewhere four centuries ago. In
Thackeray’s4,5 scenario, Shakespeare was selective about which to use, preferring a “noted weed” (cf. cannabis) to facilitate creativity, turning away from “compounds strange” (cf. cocaine).
Hemp/cannabis in the form of tobacco was evidently a source of inspiration (muse) in a poem called ’In Praise of Hempseed‘, written in 1620 by John Taylor:
A number have contagiously rehearsed
And on Tobacco [hemp] vapourised and versed [smoked and wrote verse],
Maintaining that it was a drug divine
Fit to be served by all the Sisters nine [nine Muses, sources of inspiration] 5
Remarkably, this verse makes an explicit connection between smoking and writing. Furthermore, Taylor’s poem is extraordinarily interesting
Figure 1: Gentleman smoking a pipe held in one hand, while holding a piece of rope (made from hemp/Cannabis) in the other, both objects exuding smoke.9
Source: Engraving by William Marshall, reproduced with kind permission of The Library, King’s College, Cambridge.
as it reflects a connection between smoking and a “number” of people who “rehearsed”. Most certainly in Shakespeare’s time, “rehearsed” was used in the context of acting. For example, in a play within a play (A Midsummer Night’s Dream, Act 3, Scene 1) we have: “Here’s a marvellous convenient place for our rehearsal,” and “Come, sit down… and rehearse your parts.”
We can infer from Taylor’s verse that the “number” of individuals who “rehearsed” evidently included not only actors but also writers who “vapourised” hemp (Cannabis), “fit to be served by [Muses] nine” for literary as well as theatrical purposes. Of course, the Bard was both actor and writer
Taylor makes no mention of Shakespeare by name in the context of smoking (“vapourising”) cannabis, but he does so in the context of paper being produced from hemp for the printing of “Folios”5. Reference to hemp in relation to paper was evidently safe without running any risk. By contrast, the risk of having books burnt because of explicit reference to the effects of cannabis had been real. Garcia da Orta was a botanist who published a treatise on The Simples and Compounds [drugs] of India, including Cannabis. His books were burnt after the Pope condemned the plant.5 Perish the thought that any of Shakespeare’s works should have been burnt by a literary censor such as John Whitgift, Archbishop of Canterbury, analogous to the Pope.5
Evidently, there had been a need to be cryptic. In France, Rabelais created the word ‘pantagruelion’ to refer cryptically to Cannabis in his satirical Gargantua and Pantagruel. Shakespeare would have been familiar with the works of Rabelais because he uses the word ‘Gargantua’ in As You Like It (Act 3, Scene 2).
The need to be cryptic is reflected in an early 17th century engraving by William Marshall (Figure 1) in Barnabee’s Journall.9 In this scene, a man is shown smoking a pipe held in one hand, and curiously burning a piece of rope in the other. It may not be coincidental that the latter material was manufactured from hemp. In its dry form (siccum in the engraving), when combusted, such rope would have exuded vapour. The scene may be considered to be at least a symbolic and cryptic reference to the smoking of cannabis, with a sense of humour.
Smoke emanating from the pipe in Figure 1 is associated with the Latin words “sic omnia fumus”, meaning “so we smoke everything.” The latter could have been intended as a humorous and again cryptic reference to the smoking of more than one kind of ‘tobacco’, including not only Nicotiana from North America (common tobacco), but also Cannabis from India.3
In early 17th century England, “stigma” was one of three concepts expressed by the word “noted” (cf. “the noted weed” in Sonnet 76).5 10 Other meanings of “noted” were the concepts of “well-known” or “notorious”.9 Even today, in many countries around the world, cannabis is stigmatised, well known and notorious, despite widespread claims for its medicinal and nutritional advantages.11 Unquestionably, it has value in terms of its fibre for paper, clothing and rope.
Shakespeare never uses the botanical term Cannabis by name, nor does he even make use of the word ‘tobacco’, recognising perhaps the awful risk of offending a literary censor associated with the Church. However, he cryptically refers to cannabis in the line “What hempen homespuns have we swaggering here?” (A Midsummer Night’s Dream, Act 3, Scene 1), where “homespuns” refers to clothing, otherwise referred to as “weeds”. “Swaggering” is derived from the 16th-century ‘swag’ meaning inter alia “to move unsteadily” potentially associated with abuse of cannabis
Thackeray5 has formulated the ‘Shakespeare-Hemp-Cannabis (SHC) Hypothesis’ as follows: “William Shakespeare discreetly smoked stigmatised cannabis/hemp/weed – with a moderate degree of the mind-stimulating compound tetrahydrocannabinol (THC) – associated with a source of inspiration for creative writing (“invention in a noted
weed” in cryptic wordplay in Sonnet 76), constituting a “Tenth Muse” which “gives invention light (lux in Latin)” (Sonnet 38) to supplement the nine Muses known to the Greeks.” How can we ever test this SHC hypothesis? As noted above, Giordano et al.2 have demonstrated the feasibility of detecting cannabis chemically from femoral (leg) bones of individuals preserved in a 17th-century crypt in Milan. Unfortunately, it has not been possible to undertake the same kind of analyses on Shakespeare’s femora, given the epitaph on his tombstone, said to have been written by the Bard himself: “cursed be he who moves my bones”. However, the evidence from both literary and chemical sources would seem to strongly support the SHC hypothesis that Shakespeare used cannabis for creative writing (“invention”). For reasons which are obvious, I am unable fully to validate my ideas, but suggest they are well worth considering.
Acknowledgements
I wish to extend my thanks to James Clements and The Library, King’s College, Cambridge, for permission to reproduce the engraving by William Marshall (Figure 1). The Shakespeare Birthplace Trust is thanked for the opportunity to analyse ‘tobacco’ pipes from Stratford-upon-Avon and environs. Four anonymous readers helped to improve the original manuscript and I am most grateful to them.
Declarations
I have no competing interests to declare. I have no AI or LLM use to declare.
r eferences
1. Giordano G, Mattia M, Biehler‐Gomez L, Boracchi M, Porro A, Sardanelli F, et al. Forensic toxicology backdates the use of coca plant (Erythroxylum spp.) in Europe to the early 1600s. J Archaeol Sci. 2024;170, Art. #106040. https: //doi.org/10.1016/j.jas.2024.106040
2. Giordano G, Mattia M, Boracchi M, Biehler‐Gomez L, Cummaudo M, Porro A, et al. Forensic toxicological analyses reveal the use of cannabis in Milano (Italy) in the 1600’s. J Archaeol Sci. 2023;160, Art. #105873. https://doi.or g/10.1016/j.jas.2023.105873
3. Thackeray F, van der Merwe NJ, van der Merwe TA. Chemical analysis of residues from seventeenth-century clay pipes from Stratford-upon-Avon and environs. S Afr J Sci. 2001;97(1/2):19–21. https://journals.co.za/doi/pdf/10 .10520/EJC97282
4. Thackeray JF. Shakespeare, plants, and chemical analysis of early 17th century clay ‘tobacco’ pipes from Europe. S Afr J Sci. 2015;111(7/8), Art. #a0115. https://doi.org/10.17159/sajs.2015/a0115
5. Thackeray F. John Taylor and the Shakespeare-Hemp-Cannabis hypothesis: Was the “noted weed” a source of inspiration for creativity (“invention”)?. In: Northover RA. Trance and transfiguration in rock art and literature. Pretoria: Routledge/Unisa Press; 2025.
6. Bennett C, McQueen N. Sex, drugs, violence and the Bible. Gibsons: Forbidden Fruit Publishing Company; 2001.
7. Friederich FHW. Pijpelogie: Vorm, versiering en datering van de hollandse kleipijp. [Pipeology: shape, decoration, and dating of the Dutch clay pipe]. Westzaan: Amor Vincit Omnia; 1975. Dutch.
8. Giordano G, Mattia M, Biehler-Gomez L, Boracchi M, Tritella S, Mederna E, et al. Papaver somniferum in seventeenth century (Italy): Archaeotoxicological study on brain and bone samples in patients from a hospital in Milan. Sci Rep. 2023;13, Art. #3390. https://doi.org/10.1038/s41598-023-27953-1
9. Brathwait R. Barnabees journall, under the names of Mirtilus & Faustulus shadowed: For the travellers solace lately published, to most apt numbers reduced, and to the old tune of Barnabe commonly chanted. London: J. Haviland; 1638.
10. Crystal D, Crystal B. Shakespeare’s words. London: Penguin; 2002.
11. Conrad C. Hemp for health: The medicinal and nutritional uses of Cannabis sativa. Rochester, VT: Healing Art Press; 1997.
AuTHORS: Ryan Cloete1
Jianshu Duan2
Satish Myneni2
Alakendra Roychoudhury1
AFFILIATIONS:
1Department of Earth Sciences, Stellenbosch University, Stellenbosch, South Africa
2Department of Geosciences, Princeton University, Princeton, New Jersey, USA
US National Science Foundation, Princeton University (Scott Vertebrate Funds and Phillips Equipment Fund), Whales and Climate Change Program, South African National Antarctic Programme, South African Department of Science, Technology and Innovation, South African Department of Forestry, Fisheries and the Environment, South African National Research Foundation
This Invited Commentary is based on our recently published paper which highlights how different chemical forms of the element, and micronutrient, zinc (Zn) affect its distribution and relationship with major nutrients (phosphate, silicate) within the Southern Ocean. Using novel X-ray techniques to characterise particle-hosted Zn at the molecular scale, Zn chemistry was shown to change with depth, latitude and season. These observations reveal a new dimension to marine Zn cycling, highlighting an underappreciated importance for inorganic Zn phases. The future balance between organic and inorganic Zn phases, mediated in part by climatic changes, will impact the oceans’ biological productivity.
Introduction
Zinc (Zn) is an essential trace element micronutrient for marine microorganisms called phytoplankton, which require Zn to produce enzymes and proteins responsible for a host of cellular processes, notably carbon fixation (photosynthetic conversion of inorganic atmospheric carbon dioxide [CO₂] into organic compounds) and assimilation of major nutrients such as phosphorus.1 Previous work has shown that low levels of Zn in the surface ocean may hinder phytoplankton growth2 and that Zn nutritional stress is more widespread than previously thought3. As a result, the distribution and availability of Zn in the surface ocean can impact phytoplankton growth with knock-on effects for marine primary productivity and, therefore, the ability of the ocean to absorb excess atmospheric CO2 and regulate Earth’s climate.
Despite Zn being abundant in Earth’s crust (70 parts per million), its concentrations in the ocean are in the nano-topicomolar range (parts per billion – parts per trillion). In seawater, Zn can be classified into two operationally defined pools: zinc dissolved in the water column (dissolved zinc, dZn) and Zn associated with small (micrometre scale) suspended organic or inorganic particles (particulate zinc, pZn). The oceanic concentration of Zn is affected by several factors, including its sources (e.g. atmosphere, rivers, hydrothermal vents) and water column processes (e.g. photosynthesis, respiration, adsorption-desorption termed ‘scavenging’ and precipitation-dissolution) which partition Zn between dissolved and particulate pools. These local biological and chemical processes are superimposed on different water masses which are defined by distinct physical characteristics such as temperature, salinity and oxygen, and have unique transport pathways. Combined, the individual water masses form the global thermohaline circulation and transport Zn horizontally and vertically, thus playing a major role in setting large-scale Zn distributions.4
The majority of studies to date have focused on the dissolved pool, in particular, relationships of dZn with major dissolved nutrients like phosphate (PO4) and silicate (Si). An interesting feature of these studies pertains to the observed correlation between dZn and Si, but a lack thereof between dZn and PO4 throughout the global ocean5, which is at odds with their respective nutrient roles in phytoplankton. Mechanisms behind the so-called ‘Zn paradox’ are under debate and rely predominantly on modelling approaches testing the sensitivity of the correlation to biogeochemical forcings. This Invited Commentary highlights how our study6 focused instead on pZn and adopted a new analytical approach to examine changes in pZn chemistry across different geographical locations, water depths and seasons. The observations provided direct, molecular-scale evidence for a mechanism coupling the distributions of dZn and Si and revealed a new dimension to marine Zn cycling.
The first seawater Zn measurements were made nearly 50 years ago.7 Earlier attempts were found to be inaccurate as a result of improper methodology leading to gross overestimation of concentrations. Collecting seawater samples for trace element studies is notoriously difficult due to contamination from research ships and collection equipment. Moreover, the low Zn concentrations are incorporated within a complex seawater matrix, which makes isolating and quantifying Zn analytically challenging, even with modern instruments. However, the past 15 years have seen an order of magnitude increase in observations, driven by methodological and analytical advancements as well as the inception of the GEOTRACES programme8 – an international collaboration aimed at investigating marine trace element cycles. Data produced under the GEOTRACES framework focused primarily on dZn (the fraction of total Zn that passes through a 0.2 m filter) because dZn is widely accepted to be the fraction of total Zn available to phytoplankton, the main primary producer in the ocean. From these observational data, scientists noticed a peculiar relationship between dZn, Si and PO4 5,9 dZn and Si showed a remarkably close, near-linear global correlation (Figure 1a) while dZn and PO4 were decoupled (Figure 1b). Like Si, dZn is enriched in deep water masses and deficient in intermediate water masses relative to PO4 (Figure 1c). While dZn and Si show similar spatial distribution patterns, their biogeochemical roles differ significantly. Si is mainly used by diatoms, a group of predominantly polar phytoplankton that require Si to construct their frustules (outer shells). dZn is minimally incorporated into diatom frustules10 and is instead required across a broader range of phytoplankton species, associated primarily with internal cellular processes and often co-located with particulate phosphorus (pP, the organic form of PO4 once assimilated by phytoplankton). As cellular materials are expected to decompose (remineralise) more easily than frustules in water columns, Zn and P associated with these organic particles are expected to be concurrently released into seawater at depths where Si in frustules still remains stable. Thus, the coupling of dZn and Si and decoupling of dZn and PO4 are at odds with their respective physiological roles and biogeochemical behaviour.
2025 https://doi.org/10.17159/sajs.2025/20922
Ongoing debate
There is no consensus as to the mechanisms explaining the Zn paradox. However, evidence points toward an importance for the Southern Ocean and its distinct diatom-dominated ecology. The Southern Ocean flows uninterrupted around Antarctica and acts as a central hub for global thermohaline circulation whereby waters moving to and from the Atlantic, Indian and Pacific Oceans mix. Biological and chemical processes occurring in the Southern Ocean water column therefore determine the elemental composition of water masses which subsequently flow northward and control nutrient availability in tropical and subtropical surface waters.11 Intense, diatom-dominated phytoplankton blooms occur in the high latitude Southern Ocean, spurred on by the large-scale upwelling of nutrient-rich water masses. Surface waters are consequently stripped of dZn and Si, due to biological consumption, to a greater degree than PO4, overprinting the independent biogeochemical cycles of Zn and Si and transporting a coupled dZn-Si and decoupled dZn-PO4 signature to other ocean basins.9 The hypothesis that dZn-Si-PO4 distributions are controlled by diatoms and Southern Ocean circulation implies that these signatures are not being altered significantly within water masses for hundreds to thousands of years during thermohaline water mass transport. Modelling simulations, however, suggest contrary views, invoking additional water column processes to explain the deep accumulation pattern of dZn. It is suggested that about two thirds of dZn (6–7 nmol/kg) in deep waters outside the Southern Ocean is derived from physical water mass circulation, meaning that one third (3–4 nmol/kg) must have accumulated during water mass transport after leaving the Southern Ocean formation region.12 According to this scenario, a water column process is required to drive a deeper accumulation of dZn and reconcile the dZn-Si-PO4 relationships. Reversible scavenging is a potential mechanism whereby dZn is released with PO4 at shallow depths from decomposing organic matter (e.g. phytoplankton cells), before the dZn is scavenged (adsorbed) onto sinking particles and re-released at depth. Field and modelling investigations show reversible scavenging to be consistent with the concentration profiles of, and isotopic variations in, dZn.13 Scavenging processes ultimately determine the timescales, and therefore depth, at which dZn is released back into the water column. The hypothesis that reversible scavenging impacts marine Zn cycling confirms the control that geochemical speciation of pZn plays in Zn cycling. However, mechanistic understanding is broadly lacking because of the analytical difficulties associated with assessing detailed chemical forms of marine particulates at molecular scales.
A novel approach to investigating Zn cycling
Despite advances regarding the dZn cycle, little is known about the concentration and speciation of pZn. The few pZn-focused studies to date are based on quantitative concentration data where bulk pZn is measured by subjecting sample filters to various acid leaches which release the elements from the filter residue.14 Estimates of the lithogenic (inorganic phases from rocks and mineral precipitation) and biogenic (predominantly organic particles from biological processes) fractions of pZn are typically calculated from crustal (e.g. aluminium to Zn) or cellular (e.g. phosphorus to Zn) ratios of elemental abundance and therefore provide an operationally defined, broad categorisation of pZn speciation. Synchrotron-based X-ray absorption spectroscopic techniques, i.e. techniques involving the absorption of electromagnetic radiation (e.g. X-rays) by matter, can provide information about the chemical speciation (for example, oxidation state and coordination structures with other elements) of elements at nano-to-micrometre scale (10–9–10–6 m) and low abundances (on the order of parts per million). In particular, X-ray absorption near-edge structure (XANES) spectroscopy has been used to great effect in mapping chemical species of iron (Fe) in suspended marine particles.15
The low-concentration nature of Zn in ocean particles necessitates long collection times of XANES spectra for robust speciation results, limiting the applicability of this technique in terms of the number of particles/ samples. Thus, the challenge with spectroscopic techniques such as XANES lies in time and cost trade-offs between its superior capability of providing detailed microscale speciation and structural information of single particles versus the need to examine as many particles as deemed necessary to create a representative picture of a large ocean area. Comparatively, imaging the collected filters by microscale X-ray
fluorescence (XRF) can provide an efficient overview of elemental distributions and inter-element associations. Therefore, XRF images are useful guides to target individual particles for XANES analysis. Additionally, the inter-element associations from XRF images can be used to deduce chemical speciation provided with known geochemical associations of elements, overcoming the disadvantages of XANES and allowing a more rapid yet statistically meaningful investigation of elemental chemistry in ocean particles.
Using a two-step XRF-coupled XANES approach, Duan et al.6 investigated the chemical forms of pZn in the Southern Ocean. In total, close to 4000 particles were analysed from 26 filters representing different locations (Atlantic and Indian sectors of the Southern Ocean), depths (25–3500 m) and seasons (summer and winter). Amongst these, 277 particles were studied in detail using XANES. The XANES analysis was also performed on two sediment cores to assess which pZn species are preserved during vertical transport and deposited on the seafloor. This analytical approach represents the first of its kind performed on Zn-bearing particles from marine settings and provided direct observations to test current hypotheses regarding the conversion of Zn from dissolved to particulate phases and their chemical form.
Diverse chemical forms of Zn
Changes in the speciation of pZn with season, location and depth, as described by Duan et al.6, can be interpreted in the context of water column processes and sources. Depth changes in pZn reflect the relative stability of biogenic and lithogenic phases in the water column. In the surface ocean, phytoplankton assimilate dZn and produce biogenic complexes, including pZn bound to phosphoryl, cysteine, histidine and carboxyl ligands. Biogenic pZn complexes are more abundant in summer and accounted for nearly 75% of particles analysed, reflecting expected higher summer productivity (evidenced by higher concentrations of the photosynthetic pigment chlorophyll-a) and resulting increased demand for Zn by phytoplankton. In contrast, poor winter growing conditions reduce organic matter production, leading to similar proportions of lithogenic and biogenic pZn complexes. Biogenic pZn-Si complexes are found at sites where diatoms dominate the phytoplankton community, and are more abundant in deeper waters than in surface waters, implicating a control of pZn chemistry by biogenic silica in water column processes. The ratio of biogenic to lithogenic pZn phases generally decreases with depth and the only phases that are preserved in ocean floor sediments are biogenic silica and lithogenic complexes (silicates, clays and carbonates). Bacterially mediated remineralisation releases Zn from biogenic particles associated with sinking phytoplankton cells, replenishing the dZn pool in subsurface water masses (Figure 1c). While some of the released dZn can be subsequently adsorbed (scavenged) onto biogenic silica (diatom frustule material), coupling Zn and Si, lithogenic phases also show a strong affinity for dZn scavenging in deep waters. In particular, pZn associated with clays and iron, manganese, and aluminium oxides are abundant in deep waters. The latter are potentially sourced from hydrothermal systems or transported from continentally influenced waters such as the Agulhas Current.14 The newly acquired data document a mechanistic view of reversible scavenging in the marine Zn cycle, providing evidence for a link behind the coupling of dZn and Si and decoupling of dZn and PO4 (Figure 1c, d). Revealing the chemical form of important Zn scavengers provides valuable insights into the sensitivity of the marine Zn cycle to global climate change.
Zinc cycling in a changing climate
The newly discovered importance of lithogenic phases in the ocean Zn cycle has implications under changing climatic scenarios. Sources of lithogenic material are supplied to the Southern Ocean via atmospherically transported dust16, sediment fluxes from sub-Antarctic islands17 and continental shelves18 as well as ice sheet19 and iceberg20 meltwater entrained with sediment from rock interactions. In today’s climate, these sources are often localised or periodic. However, future climate scenarios may perturb the magnitude of these sources with knock-on effects for Zn chemistry and primary production.
Atmospheric dust and meltwater, from ice sheets and icebergs in particular, are sources of lithogenic material that are likely to increase,
Data source: GEOTRACES23 (released under a CC BY 4.0 International Licence)
Figure 1: Nutrient distributions in the ocean. Correlations of (a) dissolved zinc (dZn) and silicate (Si) and (b) dissolved zinc (dZn) and phosphate (PO4). Colours represent depth (m) in the water column. Data points are indicated by small white dots. Black dashed lines are the linear regressions between nutrient concentrations, and corresponding equations are shown on the top of each panel. Typical ocean water column distributions of (c) dZn, Si and PO4 and (d) dZn showing schematically the effect of reversible scavenging in coupling dZn and Si and decoupling dZn and PO.
according to the latest consensus from the Intergovernmental Panel on Climate Change (IPCC).21 Current model predictions indicate decreased precipitation levels in the subtropics, including the Southern Ocean dust emitting regions of South America, southern Africa and Australia. Together with modest surface warming, these regions will likely become drier in the coming decades, thereby raising the potential for dust supply. The polar regions are further predicted to experience stronger warming trends than elsewhere on Earth, consequently increasing freshwater melt fluxes and iceberg calving. The anticipated increase in lithogenic particle supply to the Southern Ocean may provide extra scavenging potential for dZn, enhancing vertical export (moving Zn from the surface to deep ocean) and decreasing the reservoir of bioavailable Zn for resupply to support primary productivity. Although Fe is the primary micronutrient limiting phytoplankton growth in the Southern Ocean22, a decreased abundance of bioavailable Zn could result in more widespread co-limitation patterns,
reducing the future capacity of the Southern Ocean to sequester carbon dioxide through biological processes.
Conclusions and perspectives
The observations of changing pZn chemistry in the Southern Ocean water column provide a new perspective on Zn cycling. Biogenic pZn complexes are prevalent in the surface ocean, consistent with known metabolic roles of Zn in phytoplankton. With depth, pZn is released back to the water column and the regenerated dZn is subsequently scavenged to inorganic complexes involving biogenic silica and lithogenic phases, thereby reducing the dZn pool available for resupply and enhancing deep pZn flux. The water column shifts in Zn chemistry are imprinted on Southern Ocean water masses which are responsible for redistributing Zn and major nutrients globally, and similar water column processes are expected in other oceans beyond the Southern Ocean. In particular, the
https://doi.org/10.17159/sajs.2025/20922
association of Zn and biogenic silica suggests diatoms modify the deep ocean Zn cycle and provides a mechanistic link to the globally observed correlation of dZn and Si, which was previously at odds.
By focusing on the products (pZn) of chemical ocean processes, as opposed to the reactants (dZn), synchrotron-based approaches offer new tools to investigate nutrient trace elements such as cadmium, copper, nickel and cobalt, which may experience similar chemical changes to those observed for Zn. The molecular mechanisms responsible for the chemical partitioning between dissolved and particulate phases in trace elements thus have wide implications for understanding biological productivity and global carbon cycling and predicting their responses to changing climate conditions.
Acknowledgements
We appreciate the assistance we received from R. Tappero, S. Nicholas, K. Zhao, D. Schlesinger, L. Pincus, E. Stavitski, D. Leshchev and S. J. White during the acquisition of X-ray data. The Zhang and Onstott labs at Princeton University provided access to the clean room and the laminar flow hood for sample preparation. We thank the captains and crew of the SA Agulhas II research vessel for their efforts onboard as well as the chief scientists and participants during each voyage. We are grateful to the TracEx team members for their help with sample collection. This research used resources of the National Synchrotron Light Source II (USA), the Advanced Photon Source (USA), Brookhaven National Laboratory (US Department of Energy) and Argonne National Laboratory (US Department of Energy). Portions of this work were performed at GeoSoilEnviroCARS (University of Chicago, IL, USA) at the Advanced Photon Source.
Funding
We acknowledge funding and support from the US National Science Foundation, Princeton University (Scott Vertebrate Funds and Phillips Equipment Fund in the Department of Geosciences and student internships in the High Meadows Environmental Institute), an anonymous charitable donor trust as part of the Whales and Climate Change Program, the South African National Antarctic Programme (SANAP), the South African Department of Science, Technology and Innovation (DSTI), the South African Department of Forestry, Fisheries and the Environment (DFFE) and the South African National Research Foundation (NRF).
Declarations
We have no competing interests to declare. We have no AI or LLM use to declare. All authors read and approved the final manuscript.
References
1. Morel FMM, Price NM. The biogeochemical cycles of trace metals in the oceans. Science. 2003;300:944–947. https://doi.org/10.1126/science.108 3545
2. Morel FMM, Reinfelder JR, Roberts SB, Chamberlain CP, Lee JG, Yee D. Zinc and carbon co-limitation of marine phytoplankton. Nature. 1994;369:740–742. https://doi.org/10.1038/369740a0
3. Kellogg RM, Moosburner MA, Cohen NR, Hawco NJ, McIlvin MR, Moran DM, et al. Adaptive responses of marine diatoms to zinc scarcity and ecological implications. Nat Commun. 2022;13, Art. #1995. https://doi.org/10.1038/s 41467-022-29603-y
4. Middag R, de Baar HJW, Bruland KW. The relationships between dissolved zinc and major nutrients phosphate and silicate along the GEOTRACES Ga02 transect in the West Atlantic Ocean. Global Biogeochem Cy. 2019;33:63–84. https://doi.org/10.1029/2018GB006034
5. de Souza GF, Khatiwala SP, Hain MP, Little SH, Vance D. On the origin of the marine zinc–silicon correlation. Earth Planet Sci Lett. 2018;492:22–34. https://doi.org/10.1016/j.epsl.2018.03.050
6. Duan J, Cloete R, Loock JC, Lanzirotti A, Newville M, Martínez-García A, et al. Biogenic-to-lithogenic handoff of particulate Zn affects the Zn cycle in the Southern Ocean. Science. 2024;384:1235–1240. https://doi.org/10.112 6/science.adh8199
7. Bruland KW, Knauer GA, Martin JH. Zinc in north-east Pacific water. Nature. 1978;271:741–743. https://doi.org/10.1038/271741a0
8. Anderson RF. Geotraces reflections. Oceanography. 2024;37:8–12. https://d oi.org/10.5670/oceanog.2024.405
9. Vance D, Little SH, de Souza GF, Khatiwala S, Lohan MC, Middag R. Silicon and zinc biogeochemical cycles coupled through the Southern Ocean. Nat Geosci. 2017;10:202–206. https://doi.org/10.1038/ngeo2890
10. Ellwood MJ, Hunter KA. The incorporation of zinc and iron into the frustule of the marine diatom Thalassiosira pseudonana. Limnol Oceanogr. 2000;45:1517–1524. https://doi.org/10.4319/lo.2000.45.7.1517
11. Sarmiento JL, Gruber N, Brzezinski MA, Dunne JP. High-latitude controls of thermocline nutrients and low latitude biological productivity. Nature. 2004; 427:56–60. https://doi.org/10.1038/nature02204
12. Weber T, John S, Tagliabue A, Devries T. Biological uptake and reversible scavenging of zinc in the global ocean. Science. 2018;361:72–76. https://do i.org/10.1126/science.aap8532
13. Sieber M, Lanning NT, Bian X, Yang SC, Takano S, Sohrin Y, et al. The importance of reversible scavenging for the marine Zn cycle evidenced by the distribution of zinc and its isotopes in the Pacific Ocean. J Geophys Res Oceans. 2023;128(4), e2022JC019419. https://doi.org/10.1029/2022JC01 9419
14. Cloete R, Loock JC, van Horsten NR, Menzel Barraqueta JL, Fietz S, Mtshali TN, et al. Winter dissolved and particulate zinc in the Indian sector of the Southern Ocean: Distribution and relation to major nutrients (GEOTRACES Gipr07 transect). Mar Chem. 2021;236, Art. #104031. https://doi.org/10.10 16/j.marchem.2021.104031
15. von der Heyden BP, Roychoudhury AN, Mtshali TN, Tyliszczak T, Myneni SCB. Chemically and geographically distinct solid-phase iron pools in the Southern Ocean. Science. 2012;338:1199–1201. https://doi.org/10.1126/science.12 27504
16. Jickells TD, Baker AR, Chance R. Atmospheric transport of trace elements and nutrients to the oceans. Phil Trans R Soc A. 2016;374(2081), Art. #20150286. https://doi.org/10.1098/rsta.2015.0286
17. Sarathchandraprasad T, Tiwari M, Kumar V, Dash T, Sherin S, Rodrigues V, et al. Effects of island weathering and natural iron fertilization in the geochemistry of deglacial sediments from the Kerguelen Plateau, Southern Ocean. Cont Shelf Res. 2022;251, Art. #104881. https://doi.org/10.1016/j .csr.2022.104881
18. de Jong J, Schoemann V, Lannuzel D, Croot P, de Baar H, Tison JL. Natural iron fertilization of the Atlantic sector of the Southern Ocean by continental shelf sources of the Antarctic Peninsula. J Geophys Res. 2012;117(G1), Art. #G01029. https://doi.org/10.1029/2011JG001679
19. Wadham JL, De’Ath R, Monteiro FM, Tranter M, Ridgwell A, Raiswell R, et al. The potential role of the Antarctic Ice Sheet in global biogeochemical cycles. Earth Environ Sci Trans R Soc Edinb. 2013;104(1):55–67. https://doi.org/10 .1017/S1755691013000108
20. Smith KL, Robison BH, Helly JJ, Kaufmann RS, Ruhl HA, Shaw TJ, et al. Free-drifting icebergs: Hot spots of chemical and biological enrichment in the Weddell Sea. Science. 2007;317:478–482. https://doi.org/10.1126/sci ence.1142834
21. Intergovernmental Panel on Climate Change (IPCC). Climate change 2021: The physical science basis. Contribution of Working Group I to the Sixth Assessment Report of the Intergovernmental Panel on Climate Change. In: Masson-Delmotte V, Zhai P, Pirani A, Connors SL, Péan C, Berger S, et al, editors. Cambridge, MA: Cambridge University Press; 2021. https://doi.org /10.1017/9781009157896
22. Browning TJ, Moore CM. Global analysis of ocean phytoplankton nutrient limitation reveals high prevalence of co-limitation. Nat Commun. 2023;14, Art. #5014. https://doi.org/10.1038/s41467-023-40774-0
23. GEOTRACES Intermediate Data Product Group. The GEOTRACES Intermediate Data Product 2021 version 2 (IDP2021v2) [data set]. Liverpool: NERC EDS British Oceanographic Data Centre, National Oceanography Centre; 2021. https://doi.org/10.5285/ff46f034-f47c-05f9-e053-6c86abc0dc7e
AuTHOR: Stephen Tooth1
AFFILIATION:
1Earth Surface Processes Research Group, Department of Geography and Earth Sciences, Aberystwyth University, Aberystwyth, Wales, United Kingdom
CORRESPONDENCE TO: Stephen Tooth
EMAIL: set@aber.ac.uk
HOW TO CITE:
Tooth S. A geoscience perspective on the gully erosion problem across the interior of southern Africa. S Afr J Sci. 2025;121(9/10), Art. #21672. https://doi.org/10.17159/sajs.2 025/21672
ARTICLE INCLuDES:
☐ Peer review
☐ Supplementary material
KEYWORDS:
donga, erosion, geoscience, land use, soil
PubLISHED:
29 September 2025
A geoscience perspective on the gully erosion problem across the interior of southern Africa
Across southern Africa, gullies are highly visible forms of soil erosion. Gullies provide exposure of hillslope and river sediments, some of which contain fossils and archaeological artefacts. The causes of gully erosion have long been debated, with some researchers favouring human land-use changes, and others favouring natural factors (e.g. soil types, climate variations, base-level changes). This Invited Commentary outlines how geochronology can help determine the timing of gully formation and thus support inferences regarding causes of erosion. A geoscience perspective on the gully erosion problem advances our understanding of human–landscape interactions, with practical benefits for improved erosion control.
Introduction
Across large parts of the southern African interior, soil erosion by water and/or wind is a widespread phenomenon. Soil erosion by water includes sheet, rill and gully erosion, the latter commonly leading to highly dissected land surfaces, both in colluvial (e.g. hillslope, pediment) and alluvial (e.g. river terrace, floodplain) landforms.1 In countries such as South Africa, Lesotho and Eswatini, individual gullies and coalesced gully networks (‘badlands’) are widely referred to as ‘dongas’, but in this Invited Commentary ‘gully’ is used as the catch-all term. Gullies range widely in size but can be up to several kilometres long, hundreds of metres wide, and tens of metres deep, and commonly provide extensive exposures of Quaternary sedimentary successions (Figure 1). Many of these successions provide evidence for past phases of sedimentation and palaeosol development interspersed with short phases of erosion (including by gullies), and may contain fossil faunal assemblages and/or archaeological artefacts (Figure 1F).2 3 Consequently, gullies provide abundant opportunities for a range of geoscientific, palaeontological and archaeological investigations.
While gullies provide many scientific opportunities, their presence creates an impression of rapid, undesirable landscape change that has been attributed by some researchers to human causes, such as poor land management by Indigenous peoples or European settlers.4 5 To try and control the deleterious on-site (e.g. loss of land) and off-site (e.g. reservoir sedimentation) impacts resulting from gully erosion, many resources have been devoted to so-called ‘degraded/degrading’ lands, including through gully stabilisation/rehabilitation efforts. Other researchers, however, have argued for natural causes of gully erosion, including decadal-scale climatic fluctuations, susceptible soil characteristics, and/or breaching of hard rock barriers along river beds.6-8 Intrinsic land surface adjustments may also account for some gullies (e.g. valley floor oversteepening that leads to erosion and slope adjustment).9,10 If correct, these alternative arguments imply that the affected land more correctly should be labelled as ‘denuded/ denuding’. In other words, is gully erosion across southern Africa dominantly a human-induced problem or is it mainly evidence of natural, ongoing landscape development? The answer has implications, not only for advancing our understanding of Earth surface dynamics and human–landscape interactions, but also for the targeting of the limited resources aimed at erosion control and sustainable land management.
Assessing the relative importance of human and natural causes of gully erosion is contingent on better constraining the age of gullies. In any given topographic setting, when did gullies first start to form, and how quickly have they developed? Does the timing of gully initiation, and any subsequent phases of accelerating/decelerating development, coincide with known human migration or settlement patterns and/or major land use changes, or are there firmer correlations with known palaeoenvironmental (e.g. climatic, vegetation) changes? Erosional landforms are challenging to age using geochronological techniques such as radiocarbon or luminescence dating because the formative processes tend to involve the removal – rather than the preservation – of dateable evidence (e.g. organic or clastic deposits). Nevertheless, building on a body of research developed within and beyond southern Africa over past decades, Lyons et al.11 have shown how field, geochronological and archival data sets can be combined to help constrain the timing of initiation and subsequent development of gullies, and thus improve assessments of the relative importance of human and natural causes.
The purpose of this Invited Commentary is to: (1) summarise the main findings of Lyons et al.11; (2) compare these findings to previous studies of gullies and assess the potential for wider deployment of the investigative approach to other sites across the southern African interior; and (3) outline some of the nuanced aspects of the commonly polarised ‘human versus natural causes’ debate that might form the basis for future investigations and help improve erosion control.
Disentangling human and natural causes of erosion
To assess the relative importance of human and natural causes, Lyons et al.11 investigated the age of gullies at three widely spaced sites across the interior of South Africa: (1) hillslopes in the upper Blood River catchment, KwaZulu‐Natal; (2) river terraces at Erfkroon, located along the middle Modder River, western Free State; and (3) colluvial/alluvial fills along an unnamed tributary of the Moopetsi River (‘the Moopetsi tributary’), Steelpoort region, Limpopo Province. At the Blood River site, gullies have formed in hillslope colluvium and are discontinuous, as they are not connected to an incised river channel downslope. At the Modder River and Moopetsi tributary sites, gullies have formed in colluvium and/or alluvium and are continuous, as they are connected to deeply incised river channels.
2025 https://doi.org/10.17159/sajs.2025/21672
Figure 1: Examples of gullies and associated features from across parts of the South African interior. (A), (B) Aerial views of hillslope gullies in the Steelpoort region, Limpopo, and the Standerton region, Mpumalanga, respectively. (C) Gully sidewall showing interbedding of hillslope parallel, relatively unweathered sediments (lighter layers) and palaoesols (darker layers) in the upper Blood River valley, KwaZulu-Natal. (D) Gully headwall showing piping and slumping of colluvial and alluvial sediments in the Cornelia region, Free State. (E) Gully sidewall showing an example of a palaeosol (lowermost dark grey unit) that has been erosively truncated and overlain by hillslope parallel gravelly sand (orangey-brown unit) in the Steelpoort region, Limpopo. Rhizoliths and reworked nodules of calcium carbonate (white material) are evident in the gravelly sands. (F) Lower jaw of an archaic hippopotamus, recovered from sediments exposed in gullies at Erfkroon, Free State.
At all three sites, geomorphological and sedimentological field investigations, together with optically stimulated luminescence (OSL) dating of exposed sediments, were undertaken to constrain the timing of gully formation. Figure 2 illustrates the adopted sampling strategy. The ages of the uppermost sediment layers exposed in gully sidewalls provide maximum ages for erosion into those layers (i.e. deposition of those layers must have pre-dated the erosion). If present, the ages of any sediments within the gully floors (‘channel fills’) or the basal ages of any sediments deposited downslope of the gullies (‘tributary fans’) provide minimum ages for gully erosion (i.e. sediments have been derived from, and therefore must post-date, the erosion). Collectively, these maximum and minimum ages help to bracket the timing of initiation of erosion (Figure 2). The channel fills – some of which are up to several metres thick – also provide maximum ages for renewed erosion into the gully floors, while the uppermost tributary fan sediments provide minimum ages for this renewed erosion (Figure 2). Where available, other sources (e.g. aerial photographs, old farm plans, orthophoto maps and archaeological evidence within the gully floors) provided ancillary data to support gully age interpretations.11
At the sites, the stratigraphy and age of deeper sediments exposed in the lower to middle parts of gully sidewalls or in the banks of nearby incised rivers indicate that hillslopes and floodplains were relatively stable (i.e. non‐eroding) features during most of the late Quaternary, with conditions typically alternating between sediment accumulation and soil development. At some point in the late Holocene, however, deep erosion
became the dominant trend (Table 1). The maximum and minimum OSL ages show that initiation of erosion at each site significantly pre‐dated the increasingly intensified livestock and arable farming that was associated with European incursion in South Africa’s interior from the late 18th century onwards. Furthermore, although initiation of erosion at the study sites broadly coincides with the earlier arrival of Iron Age settlers in some parts of present‐day South Africa (Table 1), it is unlikely that associated land-use changes at that time would have been sufficiently intense and widespread to have caused deep erosion across such a broad geographical area, especially in the more arid interior at sites like Erfkroon. Instead, available archaeological evidence from the Steelpoort region (e.g. foundations of rondavels, remnants of iron smelting) shows that Iron Age people were even living and working on the pre-existing, relatively flat, sheltered gully floors with their ready access to river water.11
In the absence of evidence for human causes of late Holocene gully erosion, other explanations must be sought. By comparing the OSL ages with various published southern African palaeoenvironmental data sets (e.g. derived from cave speleothems, lake cores, tree rings and marine cores), Lyons et al.11 interpreted gully erosion as broadly coincident with abrupt climatic changes that occurred during the Medieval Climatic Anomaly (MCA, ~AD 900–1300) and Little Ice Age (LIA, ~AD 1300–1800). Erosion may have been triggered by abrupt hydroclimatic oscillations during the MCA and continued during the generally cool and dry LIA in response to large rainfall and flood events. This dramatic shift from long-term net sediment accumulation and soil development to sustained
Figure 2: Schematic illustration of key landforms that may be associated with a gully or gully network (‘donga’), with hypothetical optically stimulated luminescence (OSL) sample locations and the interpretations that can be derived (after Lyons et al.7 11). The age of a gully (i.e. timing of initial phase of erosion) is bracketed by the ages of the uppermost sediments on hillslopes or terraces (maximum ages), and the ages for channel fills within the gully and/or the basal ages for tributary fans downslope (minimum ages). The timing of any subsequent erosional phase is bracketed by the ages for channel fills within the gully (maximum ages) and the ages of the uppermost tributary fan sediments (minimum ages).
Table 1: Summary of the timings of gully erosion at the three study sites (after Lyons et al.11). Bracketing ages were derived principally from optically stimulated luminescence (OSL) dating of sediments associated with gullies, but minimum ages were supplemented by evidence of gullies on aerial photographs (Blood River, Moopetsi tributary) or early farm plans (Modder River).
Study site
Blood River
Modder River
Moopetsi tributary
Initiation of gully erosion (maximum and minimum ages)
After ~1.62 ka but before ~0.89 ka (after ~AD 390 but before ~AD 1120)
After ~0.83 ka but before ~0.30 ka (after ~AD 1180 but before ~AD 1710)
After ~2.7 ka but before ~0.22 ka (after ~BCE 690 but before ~AD 1790)
deep erosion during and following the MCA-LIA likely involved the crossing of vegetation and geomorphic thresholds and positive feedbacks.11 Fluctuations in vegetation cover resulting from hydroclimatic oscillations would have rendered land surfaces more susceptible to erosion, especially during abrupt dry–wet climatic changes when droughts and associated decreases in vegetation density and health would have been followed by increases in rainfall and floods. As gullies and channels deepened, more run-off and floodwater would be contained within, increasing water depths and bed shear stresses and thus further enhancing erosion.11
At some of the investigated sites, soil type and local base-level falls have exerted secondary controls on the specific locations, processes, rates and depths of gully erosion. For instance, marked soil textural contrasts along the Moopetsi tributary strongly control the erosional patterns, with gullies forming mainly along the western bank in soils derived from mafic lithologies of the Bushveld Complex, and many fewer located on the eastern banks in soils derived from the quartz-rich lithologies of the Transvaal Sequence (Figure 3). At Erfkroon, an initial ~15 m of incision occurred through the valley fill in response to climate changes, but the subsequent partial breaching of a dolerite sill exposed ~11 km downstream enabled an additional ~5 m of incision into bedrock.11,12 At all the investigated sites, deep erosion is ongoing, but at rates slower than might be commonly assumed; aerial imagery from the 1930s onwards shows that, at the landscape scale, the dimensions of many gullies (e.g. lengths, widths) have barely changed over many decades (Figure 3).
Other findings and wider deployment of the investigative approach
Lyons et al.’s11 findings complement some previous geomorphological, sedimentological and geochronological studies of alluvial and colluvial deposits exposed in gullies at other southern African locations.13-15 For many sites, adoption of a longer-term, larger-scale ‘geoscience perspective’ helps to address the notion of an apparent rapid erosion problem, as it demonstrates that in many cases gully erosion is commonly a slower, oftentimes periodic, natural process linked to ongoing landscape denudation. One of Lyons et al.’s11 key arguments is that, for sites where detailed investigations have yet to be undertaken, these findings challenge an often default assumption that gully erosion is necessarily attributable to human factors.
The emphasis on ‘necessarily’ in the previous sentence is important. A superficial reading of Lyons et al.11 risks oversimplification of their argument, while a considered reading highlights some important caveats. For instance, there is acknowledgement that the South African (and wider southern African) land mass covers a broad geographical area and so encompasses a diversity of dryland climates, soil types, physiographies and land use histories, within which the relative importance of human (e.g. local land disturbance) and natural (e.g. regional climatic change) factors may differ. Indeed, Lyons et al.11 explicitly address how, in some parts of South Africa, some studies have convincingly demonstrated clear links between land mismanagement and historical and more recent soil erosion, including gully formation.4 5
Renewed phase of erosion (maximum and minimum ages)
After ~0.29 ka but before 0.076 ka (after ~AD 1720 but before AD 1935)
After ~0.30 ka but before 0.109 ka (after ~AD 1710 but before AD 1903)
After ~0.22 ka but before 0.063 ka (after ~AD 1790 but before AD 1948)
In recognition of these competing findings, the question posed in the main title of Lyons et al.11 was deliberately open ended. So far, the number of sites investigated in detail is still trivial relative to the number of gullies so what about the relative importance of human and natural causes across other parts of the southern African interior? Wider deployment of Lyons et al.’s11 investigative approach would help generate additional data sets that could contribute to answers. Along with investigations of new (previously unstudied) sites, revisiting sites where luminescence techniques have previously been employed successfully to date deeper (older) parts of sedimentary successions also might be productive; more focused sample collection for luminescence dating from the uppermost colluvial/alluvial layers and any channel fill or tributary fan deposits at locations like St Paul’s Mission, the Okhombe valley and Voordrag14-16 would generate additional data sets to enable wider spatial assessment of the relative importance of human and natural causes.
Reconciling competing explanations
Debates regarding the relative importance of human and natural causes of gully (and wider soil) erosion commonly become highly polarised; read in isolation, the open-ended question posed in the main title of Lyons et al.11 (Are human activities or climate changes the main causes of soil erosion in the South African drylands?) could be taken as a perpetuating factor. In reality, ‘human’ and ‘natural’ causes are catch-all terms for various activities and factors that can interact in complex ways. In some areas of the interior, different human activities may be the dominant cause of erosion, while various natural factors may be the dominant cause elsewhere, but rarely do these two sets of factors operate independently. For instance, human and natural causes could be compounding: landscapes might be culturally primed but climatically driven, or climatically primed but culturally driven (cf. Macklin et al.17). Alternatively, the two sets of factors may be counteracting: for example, where rills and gullies are obliterated by deliberate ploughing, gully floor levelling or infilling for agriculture, or where gullies initiated on land cleared for agriculture naturally ‘heal’ through weather/climate-controlled vegetation regrowth.
In southern Africa, these types of interactions remain to be more fully investigated. Lyons et al.11 briefly allude to the possibility of testing different hypothesised human–palaeoenvironmental interactions. They note that, in some areas, Iron Age land use (e.g. forest clearance) may have rendered landscapes more susceptible to erosion by other forcing factors (e.g. climate changes), or the reverse may have occurred, with Iron Age settlers arriving in landscapes primed for erosion by preceding climatic and wider environmental changes (see also Neumann et al.18).
Generating the geochronological and other data sets necessary to enable rigorous testing of such hypotheses in contemporary, historical and palaeoenvironmental contexts will require time, effort and resources. Detailed site‐by‐site and region‐by‐region investigations will be needed. But the potential benefits of improving knowledge of the causes, spatiotemporal patterns, and magnitudes of gully erosion are threefold.
First, just as the investigations of sites such as the Moopetsi tributary and the Modder River at Erfkroon have revealed the richness of interactions between a range of natural factors (e.g. climate change, soils, base-level
Figure 3: Aerial views of gullies along part of the Moopetsi tributary in: (A) June 2006 and (B) November 2023. The image width is 4.1 km and north is aligned to the top. Hillslopes converge from the west and east towards the tributary channel (image centre). During floods, flow in the channel is from north to south along the approximate contact between the Bushveld Complex lithologies (west) and the Transvaal Sequence lithologies (east). Note that most gullies have developed west of this lithological contact on mafic soils, and few gullies have formed east on quartz-rich soils. In the older image, most dwellings and roads are located in the east where there are few gullies, suggesting that, at this location, these types of human activities are not a main cause of gully erosion. The more recent image shows that increases in dwellings in the east and establishment of mine access roads in the west have led to no detectable gully network expansion. Mining operations in the last two decades have led to rapid, substantial earth material movement in the flanking mountain ranges, vastly outstripping the rates and volumes of gully erosion.
fall) in explaining the locations, processes, rates and depths of erosion, so might richer, more nuanced interpretations of contemporary erosion result from consideration of the interactions between a range of human and natural factors (e.g. Claasen et al.19). Palaeontological and archaeological investigations also would be enriched by greater consideration of the dynamic land surfaces upon which aspects of biological evolution and human cultural development have occurred.2,3
Second, more detailed consideration of gully erosion helps put contemporary land transformation in context. While gully and other forms of soil erosion have many deleterious on-site and off-site impacts, some other human activities (e.g. mining) are moving earth materials in greater volumes and at greater rates. In some cases, this ‘terraforming’ may be irreversibly damaging or removing key parts of the geoscience evidence base (Figure 3).
Third, a clear understanding of the causes of erosion, especially the relative importance of human and natural factors, is essential for the targeting of the limited resources available for erosion control and broader sustainable land management initiatives. Once gullies have been initiated and are actively eroding, they are very difficult to stabilise. Where human land use (e.g. ill-designed ploughing regimes, overgrazing, excessive burning) is indisputably causing new gullies or worsening existing gully erosion, the cessation of activities and erosion control efforts (e.g. revised land-use strategies and revegetation efforts) may have some chance of success.1 But where gullies initially formed in response to natural factors occurring many decades or hundreds of years ago and are not now rapidly expanding, then erosion control efforts may be futile or worse. Lyons et al.11 cite the example of gabion weirs in the Blood River dongas that have encouraged water retention (ponding) on duplex soils prone to dispersion and piping in the upper layers, so that water flow commonly occurs around the sides of the weirs and has resulted in localised donga widening; such weirs and other gully erosion control efforts (e.g. contour bank construction, run-off diversion, concrete check dams) are having similar impacts at other interior sites.1 With the approach of the 20th anniversary of the United Nation’s International Year of Deserts and Desertification (2006), there is an opportunity to reflect critically on the targeting and effectiveness of erosion control and sustainable land management efforts, particularly in view of projected increases in climate variability and growing land-use pressures.
Conclusion
Recent decades have seen great advances in spatial data acquisition relating to soil erosion across the southern Africa interior; in particular, South Africa remains one of the few countries worldwide to have
attempted a country-wide, systematic mapping of gully erosion.20 We now also have many techniques for monitoring short-term gully growth19, but temporal data acquisition relevant to advancing understanding of the age of gullies – essential for assessments of the relative importance of human and natural causes – has been far slower and limited to relatively few sites. Following Lyons et al.11, wider deployment of investigative approaches that combine field, geochronology and archival data sets will help test hypotheses. A geoscience perspective on the gully erosion problem not only advances our understanding of Earth surface dynamics and human–landscape interactions but also has practical benefits for improved erosion control and sustainable land management efforts.
Acknowledgements
The data, concepts and arguments covered in this paper have been developed over a number of years, and have benefitted greatly from discussions with a number of colleagues worldwide, particularly Professor Terence S. McCarthy (School of Geosciences, University of the Witwatersrand). Over the years, support for the previously published research of myself and colleagues, as summarised within the Invited Commentary, has been provided by a number of sources, including Aberystwyth University, the University of the Witwatersrand, and the South African National Research Foundation.
Declarations
I have no competing interests to declare. I have no AI or LLM use to declare.
References
1. Olivier G, van de Wiel MJ, de Clercq WP. Intersecting views of gully erosion in South Africa. Earth Surf Process Landf. 2023;48:119–142. https://doi.or g/10.1002/esp.5525
2. Churchill SE, Brink JS, Berger LR, Hutchison RA, Rossouw L, Stynder D, et al. Erfkroon: A new Florisian fossil locality from fluvial contexts in the western Free State, South Africa. S Afr J Sci. 2000;96:161–163.
3. Will M, Blessing M, Möller GHD, Msimanga L, Pehnert H, Riedesel S, et al. The Jojosi Dongas: An interdisciplinary project to study the evolution of human behaviour and landscapes in open-air contexts. South Afr Field Archaeol. 2024;19, Art. #3010. https://doi.org/10.36615/safa.19.3010.2024
4. Hoffman MT, Todd S, Ntshona Z, Turner S. Land degradation in South Africa. Pretoria: Department of Environment Affairs and Tourism; 1999.
5. Boardman J. How old are the gullies (dongas) of the Sneeuberg uplands, Eastern Karoo, South Africa? Catena. 2014;113:79–85. https://doi.org/10.1 016/j.catena.2013.09.012
6. Rienks SM, Botha GA, Hughes JC. Some physical and chemical properties of sediments exposed in a gully (donga) in northern KwaZulu‐Natal, South Africa and their relationship to the erodibility of the colluvial layers. Catena. 2000;39:11–31. https://doi.org/10.1016/S0341-8162(99)00082-X
7. Lyons R, Tooth S, Duller GA. Chronology and controls of donga (gully) formation in the upper Blood River catchment, KwaZulu‐Natal, South Africa: Evidence for a climatic driver of erosion. The Holocene. 2013;23:1875–1887. https://doi.org/10.1177/0959683613508157
8. Tooth S, Brandt D, Hancox PJ, McCarthy TS. Geological controls on alluvial river behaviour: A comparative study of three rivers on the South African Highveld. J Afr Earth Sci. 2004;38:79–97. https://doi.org/10.1016/j.jafrear sci.2003.08.003
9. Tooth S, McCarthy TS, Rodnight H, Keen‐Zebert A, Rowberry M, Brandt D. Late Holocene development of a major fluvial discontinuity in floodplain wetlands of the Blood River, eastern South Africa. Geomorphology. 2014; 205:128–141. https://doi.org/10.1016/j.geomorph.2011.12.045
10. Pulley S, Ellery WN, Lagesse JV, Schlegel PK, McNamara SJ. Gully erosion as a mechanism for wetland formation: An examination of two contrasting landscapes. Land Degrad Dev. 2018;29:1756–1767. https://doi.org/10.100 2/ldr.2972
11. Lyons R, Tooth S, Duller GAT, McCarthy TS. Are human activities or climate changes the main causes of soil erosion in the South African drylands?: A palaeo-perspective from three sites in the interior. J Quat Sci. 2024;39:1116–1137. https://doi.org/10.1002/jqs.3651
12. Tooth S, Hancox PJ, Brandt D, McCarthy TS, Jacobs Z, Woodborne S. Controls on the genesis, sedimentary architecture, and preservation potential of dryland alluvial successions In stable continental interiors: Insights from the incising Modder River, South Africa. J Sediment Res. 2013;83:541–561. https://doi.org/10.2110/jsr.2013.46
13. Botha GA, Wintle AG, Vogel JC. Episodic late quaternary palaeogully erosion in northern KwaZulu‐Natal, South Africa. Catena. 1994;23:327–340. https:// doi.org/10.1016/0341-8162(94)90076-0
14. Botha GA. The geology and palaeopedology of late Quaternary colluvial sediments in northern KwaZulu/Natal. Memoir vol. 83. Pretoria: Council for Geoscience; 1996.
15. Temme AJAM, Baartman J, Botha GA, Veldkamp A, Jongmans AG, Wallinga J. Climate controls on late Pleistocene landscape evolution of the Okhombe valley, KwaZulu‐Natal, South Africa. Geomorphology. 2008;99:280–295. https://doi.org/10.1016/j.geomorph.2007.11.006
16. Colarossi D, Duller GAT, Roberts HM, Tooth S, Botha GA. A comparison of multiple luminescence chronometers at Voordrag, South Africa. Quat Geochronol. 2020;60, Art. #101094. https://doi.org/10.1016/j.quageo.20 20.101094
17. Macklin MG, Passmore DG, Rumsby BT. Climatic and cultural signals in Holocene alluvial sequences: The Tyne Basin, Northern England. In: Needham S, Macklin MG, editors. Alluvial archaeology in Britain. Oxbow Monograph 27. Oxford: Oxbow Press; 1992. p. 123–140.
18. Neumann FH, Scott L, Bousman CB, van As L. A Holocene sequence of vegetation change at Lake Eteza, coastal KwaZulu‐Natal, South Africa. Rev Palaeobot Palynoly. 2010;162:39–53. https://doi.org/10.1016/j.revpalbo.20 10.05.001
19. Claasen D, Botha G, Linol B. An integrated assessment of erosion drivers facilitating gully expansion rates – a near century multi-temporal analysis from South Africa. Land Degrad Dev. 2024;35:3675–3699. https://doi.org/ 10.1002/ldr.5161
20. Mararakanye N, Le Roux JJ. Gully location mapping at a national scale for South Africa. S Afr Geogr J. 2012;94:208–218. https://doi.org/10.1080/03 736245.2012.742786
https://doi.org/10.17159/sajs.2025/21672
AuTHOR: Francis Thackeray1
AFFILIATION:
1Evolutionary Studies Institute, University of the Witwatersrand, Johannesburg, South Africa
CORRESPONDENCE TO: Francis Thackeray
EMAIL: francis.thackeray@wits.ac.za
HOW TO CITE:
Thackeray F. Commentary on Neves et al. (2024): Dental metrics of Sahelanthropus and other hominoids. S Afr J Sci. 2025;121(9/10), Art. #19358. https://doi.org/10.17159/sa js.2025/19358
Commentary on Neves et al. (2024): Dental metrics of Sahelanthropus and other hominoids
Significance:
Neves et al. (S Afr J Sci. 2024;120(7/8), Art. #16362) have presented a valuable dental database for a diversity of hominoids, which can be criticised for two reasons. Firstly, they make a taxonomic statement based only on a size-related first principal component. Secondly, they regard the second principal component as insignificant. Thus, they conclude on weak grounds that their results do not “preclude” Sahelanthropus from being a hominin. I used UPGMA (unweighted pair group method with arithmetic mean) analysis to infer that variability in upper dentition molars of the hominoid taxa under consideration is not inconsistent with the view that Sahelanthropus is a hominin.
Introduction
Neves et al.1 have undertaken an interesting “first of its kind” multivariate analysis of mesiodistal (MD) and buccolingual (BL) measurements of teeth of a diversity of hominoids (hominins and apes), including Sahelanthropus, circa 7 million years old from Chad as reported by Brunet et al.2 From principal component (PC) analysis they conclude that their results are not inconsistent with the view that taxonomically Sahelanthropus is a hominin rather than an ape. Their conclusion is based on the first component (PC1) which they correctly recognise as being associated with size; but size alone is certainly not necessarily a reflection of taxonomic relationships. Secondly, they dismiss PC2 as having no relevance in their analysis. They explicitly state: “PC2 is residual in nature and does not allow for any interpretation.”1 However, this is not necessarily the case, as the second component is typically related to shape, associated with morphology, even if the amount of variance associated with PC2 (or PC3) is relatively low.
These observations do not in any way diminish the value of their basic data set and the results of their PC analysis. What matters is the way in which the data are interpreted. In their graph upon which Figure 1 is based, PC2 values for Sahelanthropus, early Homo and Pan (chimpanzees) all fall within a limited range of about +1.5 to -1.5. Contrary to the view of Neves et al.1 who stated that PC2 “does not allow for any interpretation”, there is indeed significance in the sense that Paranthropus shows the greatest degree of variability in the first and second principal components.
MD/bL ratios independent of size
Recognising that size is strongly associated with PC1 which accounts for most of the variability of the multivariate analysis, it is appropriate to examine MD/BL ratios which are independent of size. Table 1 shows such ratios for upper first, second and third molars for nine hominoid taxa. These data are based only on mean MD/BL values published by Neves et al.1 such that, as yet, it is not possible to demonstrate ranges of variation. Unfortunately, from the results available based on mean values (Table 1), independent of size, it is not possible to identify distinct taxonomic groups.
uPGMA analysis
The results of an UPGMA (unweighted pair group method with arithmetic mean) analysis of the MD and BL measurements published by Neves et al.1 for upper post-canine dentition are presented in Figure 2. Three groups
Figure 1: Results of a principal component (PC) analysis of mesiodistal (MD) and buccolingual (BL) measurements of upper post-canine teeth, based on the study by Neves et al.1
2025 https://doi.org/10.17159/sajs.2025/19358
Table 1: Mesiodistal (MD) and buccolingual (BL) ratios for first (M1), second (M2) and third (M3) upper molars for nine hominoid taxa, based on data published by Neves et al.1
Hominoid taxon
Sahelanthropus
H. erectus 0.928 0.902 0.824
Paranthropus robustus 0.881 0.879 0.879
P. boisei 0.912 0.869 0.842
Pan troglodytes male 0.948 0.881 0.845
are recognised. The y-axis reflects UPGMA distance on a scale not related to time.
The three groups based on UPGMA are shown schematically in Figure 3 with reference to relative dates for genera under consideration. Group 1 includes South African Australopithecus as well as East African and South African Paranthropus. Group 2 includes East African Australopithecus, East African early Homo, Orrorin and Sahelanthropus. Group 3 includes Pan. A conclusion which can be drawn is that Sahelanthropus relates more closely to Orrorin and later East African hominins, than it does to Pan
Conclusion
Neves et al.1 have presented a valuable database for MD and BL measurements for upper post-canine dentition of a diversity of hominoids, but they can be criticised for two reasons. Firstly, they make a taxonomic statement based only on a size-related PC1. Secondly, they regard PC2 as insignificant. Thus, they conclude on weak grounds that their results do not “preclude” Sahelanthropus from being a hominin. Based on an UPGMA, it can be inferred that the variability in upper post-canine dentition of the taxa under consideration is not inconsistent with the view that Sahelanthropus is a hominin (Figure 3).
Figure 2: UPGMA (unweighted pair group method with arithmetic mean) analysis of mesiodistal and buccolingual measurements obtained from upper post-canine dentition, based on data published by Neves et al.1 Three groups are recognised. The y-axis reflects UPGMA distance on a relative scale not related to time.
Figure 3: Simplified results of UPGMA (unweighted pair group method with arithmetic mean) analysis of mediodistal (MD) and buccolingual (BL) measurements of upper molar post-canine teeth, based on data published by Neves et al.1 Three groups are identified. The taxa within each group are shown in the context of relative dates.
Acknowledgements
I am grateful to Walter Neves for correspondence, and two anonymous readers for comments.
Declarations
I have no competing interests to declare. I have no AI or LLM use to declare.
References
1. Neves W, Valota L, Monteiro C. Dental metrics of Sahelanthropus tchadensis: A comparative analysis with apes and Plio-Pleistocene hominins. S Afr J Sci. 2024;120(7/8), Art. #16362. https://doi.org/10.17159/sajs.2024/16362
2. Brunet M, Guy F, Pilbeam D, Mackaye HT, Likius A, Ahounta D, et al. A new hominid from the Upper Miocene of Chad, Central Africa. Nature. 2002; 418:145–151. https://doi.org/10.1038/nature00879
https://doi.org/10.17159/sajs.2025/19358
AuTHORS: Pfananani A. Ramulifho1 Jennifer M. Fitchett2
AFFILIATIONS:
1Department of Environmental Sciences, University of South Africa, Johannesburg, South Africa 2School of Geography, Archaeology and Environmental Studies, University of the Witwatersrand, Johannesburg, South Africa
CORRESPONDENCE TO: Pfananani Ramulifho
EMAIL: eramulpa@unisa.ac.za
HOW TO CITE:
Ramulifho PA, Fitchett JM. Reducing the chance of manuscript rejection: Tips from editors. S Afr J Sci. 2025;121(9/10), Art. #21244. https: //doi.org/10.17159/sajs.2025/21244
All academics receive desk rejections from journals at some point in their careers. While this is never entirely avoidable, one can try to reduce this occurrence. We share insights from the South African Journal of Science (SAJS) to help authors avoid common mistakes that lead to desk rejection, such as misalignment with journal scope, lack of novelty, and ethical issues. Careful attention to these aspects can reduce the chance of a frustrating and avoidable rejection and should become a routine part of the author’s pre-submission screening.
Introduction
Publication is an essential component of sharing knowledge and ideas in the academic world1, and allows researchers to present their work, contribute to their field of study, and engage with other experts2. Through the process of peer review, the quality and accuracy of the research is tested and strengthened.3 Publishing peer-reviewed papers allows researchers to build their reputation, share new discoveries, and support education.4 Colleges and universities often evaluate and promote academic staff based on the number and quality of their publications5, and some institutions also require postgraduate students to provide evidence of having submitted or published a journal article before they can graduate6. However, the essence of scientific research and publication is the production of knowledge, and the wide distribution and constructive exchange of the generated knowledge to improve our understanding of the world.7
For most researchers, having a manuscript accepted by a journal induces feelings of accomplishment, relief and pride.8 By contrast, having a manuscript rejected can be frustrating and disheartening, especially for early-career researchers.9 The majority of manuscripts do not make it past the initial editorial check, and are desk rejected.3 According to Boughey6, many postgraduate students do not receive adequate guidance in submitting manuscripts, which places an added burden on journal editors and reviewers and potentially increases desk rejection rates. Only a small fraction of manuscripts is rejected after peer review, either following the first round of peer review, or after the authors have attempted to improve their manuscript based on review comments. Although disappointing, a rejection provides valuable insights. Suggestions from reviewers aid in enhancing the clarity of the work, and criticisms provide directions for improvement.3 Recent studies indicate that rejection rates in academic journals can range from 30% to 90%, influenced by factors such as the number of submissions, the prestige of the journal and its scope and target audience.10
Although this article focuses on the South African Journal of Science (SAJS), the aim is to give general advice that can help authors improve their chances of publishing in any academic journal. Authors should note that the peer review process is in itself not a perfect system but is still the most accepted way of reviewing and publishing research work in the scientific community. Understanding how the system works helps in making it less confusing and improves the chances of a manuscript being accepted. In our role as associate editors of SAJS, and with insight into the rejection data, we identified some common reasons for manuscript rejection and provide guidelines for authors on how to improve their submissions and thereby increase their chances of acceptance. Given the rigorous standards of the SAJS, and its importance in the African scientific community, authors submitting to the journal would benefit from understanding why manuscripts often get desk rejected and knowing how to improve their chances of acceptance. The overall goal of this Commentary is to raise awareness of the expectations of academic journal editors and how authors can align their work with these standards.
Common reasons for manuscript rejection
The Journal’s requirement for original and relevant high-quality research to be published necessitates that each submission undergoes stringent scrutiny, and failure to meet these standards leads to many submissions being desk rejected, that is, rejected without review. The most common reason for this rejection is that manuscripts do not meet the scope and focus of the Journal. For the SAJS, manuscripts should not only be original, novel research, but also relevant to and for Africa. Novelty can mean using new methods, applying old ideas in different situations, or collecting new information to answer questions that have not yet been answered. Manuscripts from elsewhere on the African continent are considered only if their results are relevant more generally to Africa or have specific implications for South Africa. Similarly, in the case of more specialised calls linked to special issues, submitting research that does not align with the special issue focus will lead to rejection.
Reworked students’ dissertations often do not meet the specific structure and style required by journals, making them unsuitable for publication without significant changes. Another frequent reason for rejection is not following the submission guidelines, including the word limits, referencing style and formatting guidelines. We emphasise the necessity for concise introductions and discussions, and limiting references to the most pertinent. The SAJS, in particular, has a very wide audience, and the writing style needs to be accessible across a range of disciplines. Some journals, including the SAJS, offer the opportunity to rectify these technical issues and resubmit, but you will have a less frustrating experience if you adhere to these guidelines carefully before submitting.
2025 https://doi.org/10.17159/sajs.2025/21244
Manuscripts submitted to SAJS risk rejection if they do not make a meaningful contribution to the field of study. This could involve merely repeating existing work, or manuscripts that present work founded on weak methodological approaches, insufficient data or flawed analyses. All these issues undermine the credibility of the findings and their interpretations. If the methodology is not robust nor described in sufficient detail, reviewers may question the validity of the results and reject the manuscript. Many submissions fail to engage adequately with recent literature, methods and key discussions in the field. As publications are expected to contribute new knowledge, this lack of connection is often a reason for rejection. Furthermore, authors need to present clear, well-structured results and avoid excessive jargon. Ethical concerns, such as failing to secure or provide evidence of ethical clearance or undeclared conflicts of interest, can also lead to rejection. Even if a manuscript passes through the initial review round, failure to adequately address reviewers’ comments could still result in rejection.
Editors rely on expert reviewers as the most qualified judges of the quality of a manuscript. As a result, many manuscripts are rejected when they fail to meet the rigorous standards essential for maintaining scientific integrity.
Strategies to avoid rejection
To reduce the chance of having a manuscript submitted to the SAJS rejected, authors should make sure their manuscript fits within the Journal’s scope by focusing on important regional issues and adding meaningful insights to scientific discussions in the target country or continent. Demonstrating how the study is new or different is also key. This can involve finding gaps in current research, using robust and well-accepted methods, and presenting unique results or data. Careful reporting of data collection and appropriate statistical analyses help reviewers to trust the findings.
It is also important to connect the work to existing research. By showing how it fits into ongoing debates and current trends, authors demonstrate their familiarity and understanding of the field. Being honest about ethical matters and conflicts of interest helps maintain trust. Keep in mind that submitting a manuscript is a form of communication. Consider the diversity of the readership when writing your manuscript and ensure that you explain your process effectively to a non-expert. Using clear and inclusive language that is accessible to a diverse, multidisciplinary readership – including specialists, non-specialists and those for whom English is not a first language – improves a manuscript’s chances of acceptance.
If your manuscript is sent out for review, you may be asked to submit suggested changes based on the reviewers’ feedback before it can be accepted for publication. Responding to reviewers’ feedback in a thoughtful way is crucial. Authors should address each comment, explain any changes, and politely justify why they might not follow certain suggestions. Reviewers expect authors to handle feedback seriously and make needed updates. Taking time to revise and respond in detail shows a commitment to quality research and can greatly increase the chances of acceptance. Viewing revision as a chance to grow, rather than as a personal criticism, can make the process more positive.
Looking forward – keeping your finger on the pulse
Looking ahead, it is crucial that we maintain and improve the professional standards that have served us well. The expectations of academic journals are constantly evolving, with a growing emphasis on multidisciplinary research, stronger methodological rigour, and clear presentation of ideas.11 This is also strongly evident in the SAJS, which, since its inception, has been inherently interdisciplinary.12 Research that crosses disciplinary boundaries is highly valued because it offers broader insights from various perspectives and has the potential to solve complex, real-world problems.13 This current research trend means that researchers must stay up to date with the latest developments in their field and in publishing standards.14,15 SAJS, like many regional journals, prioritises work that speaks directly to the needs, challenges and opportunities within its geographical area.16,17 These too are changing rapidly, requiring research that is up to date, relevant and critical. Regardless of all these developments, it is likely that the SAJS will remain a popular choice for researchers because of its interdisciplinary
nature and the space offered for Commentaries, Perspectives and Book Reviews, allowing for a range of voices to continue to contribute to important debates.12
Conclusion
With the growing pressure to publish, driven by career advancement needs, the rise of predatory journals, changing publishing models, and journals’ efforts to maintain their reputations, manuscripts are now held to much higher quality standards than before. As a result, rejection is common in academic publishing, but it can often be avoided by upholding the above standards. By understanding the common reasons for rejection outlined in this paper, authors can take steps to improve their work and increase their chances of acceptance. It is important to ensure that your manuscript fits the journal’s focus, uses appropriate methods, and presents data clearly. By ensuring relevance, appropriate methodology, clarity, ethical considerations, and alignment with evolving journal standards, authors can improve the chances of their manuscript being published. Publishing in respected journals like SAJS not only raises authors’ individual profiles but also contributes meaningfully to scientific progress and dialogue. A well-prepared manuscript shows a strong understanding of both the topic and what peer reviewers expect, which is key to contributing to the academic community.
Declarations
P.A.R. is an Associate Editor Mentee and J.M.F. is an Associate Editor of the South African Journal of Science. There are no competing interests to declare. There is no AI or LLM use to declare. Both authors read and approved the final version.
References
1. Collyer FM. Global patterns in the publishing of academic knowledge: Global North, Global South. Curr Sociol. 2018;66(1):56–73. https://doi.org/10.117 7/0011392116680020
2. Menon V, Varadharajan N, Praharaj SK, Ameen S. Why do manuscripts get rejected? A content analysis of rejection reports from the Indian Journal of Psychological Medicine. Indian J Psychol Med. 2022;44(1):59–65. https://d oi.org/10.1177/0253717620965845
3. Wu J, Sanchez-Diaz I, Yang Y, Qu X. Why is your paper rejected? Lessons learned from over 5000 rejected transportation papers. Commun Transp Res. 2024;4, Art. #100129. https://doi.org/10.1016/j.commtr.2024.100129
4. Caon M. “Revise before review; Reject without review; Reject after review”: Why manuscripts are rejected. Australas Phys Eng Sci Med. 2018;41:3–5. https://doi.org/10.1007/s13246-018-0615-1
5. Woolley KL, Barron JP. Handling manuscript rejection: Insights from evidence and experience. Chest. 2009;135(2):573–577. https://doi.org/10.1378/che st.08-2007
6. Boughey C. Postgraduate students and publishing in academic journals. S Afr J Sci. 2023;119(11/12), Art. #16908. https://doi.org/10.17159/sajs .2023/16908
7. Hangel N, Schmidt-Pfister D. Why do you publish? On the tensions between generating scientific knowledge and publication pressure. Aslib J Inf Manag. 2017; 69(5):529–544. https://doi.org/10.1108/AJIM-01-2017-0019
8. Seifert TA, Perozzi B, Li W. Sense of accomplishment: A global experience in student affairs and services. J Stud Aff Res Pract. 2023;60(2):250–262. http s://doi.org/10.1080/19496591.2022.2041426
9. Fathelrahman AI. Rejection of good manuscripts: Possible reasons, consequences and solutions. J Clin Res Bioeth. 2015;6(1), Art. #1000204. https://doi.org/10.41 72/2155-9627.1000204
10. Khadilkar SS. Rejection blues: Why do research papers get rejected? J Obstet Gynecol India. 2018;68:239–241. https://doi.org/10.1007/s13224-018-1153-1
11. Nielsen BB, Welch C, Chidlow A, Miller SR, Aguzzoli R, Gardner E, et al. Fifty years of methodological trends in JIBS: Why future IB research needs more triangulation. J Int Bus Stud. 2020;51(9):1478–1499. https://doi.org/10.105 7/s41267-020-00372-4
12. Fitchett JM, Waja M, Holtz CJ, Earnest T, Kganane C, Prinsloo A. 120 Years of earth and environmental sciences in the South African Journal of Science S Afr J Sci. 2024;120(Special issue: Celebrating 120 years), Art. #19205. https://doi.org/10.17159/sajs.2024/19205
13. Daniel KL, McConnell M, Schuchardt A, Peffer ME. Challenges facing interdisciplinary researchers: Findings from a professional development workshop. PLoS One. 2022;17(4), e0267234. https://doi.org/10.1371/jour nal.pone.0267234
14. Barreto SG. Open access for publication – can it be chosen? In: Parija S, Kate V, editors. Writing and publishing a scientific research paper. Singapore: Springer; 2017. p. 167–175. https://doi.org/10.1007/978-981-10-4720-6_16
15. Avenier MJ, Cajaiba AP. The dialogical model: Developing academic knowledge for and from practice. Eur Manag Rev. 2012;9(4):199–212. https ://doi.org/10.1111/j.1740-4762.2012.01038.x
16. Swartz L. Yesterday, today and tomorrow: A snapshot of our journal. S Afr J Sci. 2024;120(5/6), Art. #18458. https://doi.org/10.17159/sajs.2024/18458
17. Carruthers J. The South African Journal of Science: A biography. S Afr J Sci. 2024;120(Special issue: Celebrating 120 years), Art. #18378. https://doi.or g/10.17159/sajs.2024/18378
https://doi.org/10.17159/sajs.2025/21244
AuTHOR: Moloko G. Mathipa-Mdakane1 2
AFFILIATIONS:
1Knowledge Management and Information Services, Council for Scientific and Industrial Research, Pretoria, South Africa
2Strategic Investments, Innovation and Impact, National Research Foundation, Pretoria, South Africa
CORRESPONDENCE TO: Moloko Mathipa-Mdakane
EMAIL: molokog.mathipa@gmail.com
HOW TO CITE:
Mathipa-Mdakane MG. Supporting innovation to address South Africa’s socio-economic challenges: A strategic framework. S Afr J Sci. 2025;121(9/10), Art. #21836. https: //doi.org/10.17159/sajs.2025/21836
ARTICLE INCLuDES:
☐ Peer review
☐ Supplementary material
KEYWORDS:
innovation ecosystem, commercialisation, industry–academia collaboration, technology transfer
Supporting innovation to address South Africa’s socio-economic challenges: A strategic framework
Significance:
Innovation drives economic growth and societal progress, yet South Africa struggles to translate research into impact. Despite significant R&D investments, there remains a gap between knowledge generation and commercialisation. Many discoveries remain within academia because of weak support structures. To unlock its potential, South Africa must build a structured innovation pipeline by leveraging existing capabilities, adopting global best practices, and fostering stronger collaboration between academia, industry and government. Strengthening commercialisation pathways and addressing systemic challenges will ensure that scientific advancements lead to tangible solutions, positioning South Africa as a leader in research-driven innovation and enhancing economic competitiveness.
The current landscape
South Africa’s research and innovation ecosystem is supported by institutions, policies and funding mechanisms designed to support scientific advances and technological development. Key stakeholders include the Department of Science, Technology and Innovation (DSTI), the Technology Innovation Agency (TIA), public research funding agencies such as the National Research Foundation (NRF), the South African Medical Research Council (SAMRC) and the Water Research Commission, the Innovation Hub, research councils, and universities. Collectively, these entities advance research, facilitate knowledge transfer, and promote its commercial application. While these structures provide a solid foundation, challenges such as fragmented funding mechanisms, weak industry collaboration and barriers in intellectual property management continue to hinder the seamless transition of research into market-ready solutions.1 These gaps limit the full integration of research and commercialisation efforts, ultimately constraining South Africa’s ability to drive innovation-led economic growth and job creation.
The DSTI drives national policy and funding priorities in research and innovation. For example, the Decadal Plan for Science, Technology and Innovation (STI), aligned with the National Development Plan (NDP 2030), highlights the need for research-led economic growth. The department oversees various programmes aimed at improving South Africa’s innovation performance, including strategic funding for emerging technologies and sector-specific R&D initiatives. The public research funding agencies primarily fund early-stage and applied research (technology readiness levels [TRL] 1–3), supporting fundamental scientific advancements. Through initiatives such as the South African Research Chairs Initiative (SARChI) and Centres of Excellence (CoEs), the NRF has contributed significantly to developing high-level research capacity. However, many of its funded projects remain confined to academic outputs without structured mechanisms to transition them towards commercial application. TIA plays a complementary role by funding innovation and commercialisation in the later stages (TRL 4–7), with seed funding, prototype development support, and commercialisation assistance. However, there is a critical gap at the proof of concept stage, creating a ‘valley of death’ where promising innovations struggle to progress due to lack of support.
The Innovation Hub, South Africa’s leading science and technology park, offers incubation and business support to startups and entrepreneurs. Although it has successfully fostered several high-impact innovations, its effectiveness in integrating university-led research into industry applications remains limited. This challenge reflects broader systemic issues within South Africa’s innovation landscape. For example, a previous study revealed that most of the academics in clothing-related programmes had not participated in university-industry-government research and development collaborations, indicating underdeveloped partnerships that could hinder the translation of academic research into practical industry solutions.2 A different study identified factors such as limited institutional support and awareness of commercialisation processes as barriers to effective technology transfer within South African universities.1 These findings highlight the need for improved collaboration mechanisms to bridge the gap between academic research and industry application.
Universities and research councils, such as the Council for Scientific and Industrial Research (CSIR), the SAMRC and the Agricultural Research Council, are at the core of South Africa’s knowledge production. However, these councils are not solely accountable to the DSTI, but also report to other respective line ministries, such as the Department of Health and the Department of Agriculture, Land Reform, and Rural Development. These science councils equally fulfil an important role in funding directed research which can turn into commercialisable products. This influences their strategic priorities and funding allocations, which can impact coordination within the national innovation ecosystem. They conduct cutting-edge research in various fields, contributing to the country’s global research output.
Technology Transfer Offices (TTOs) have been set up to manage intellectual property (IP), licence research outputs and support spin-off, but their effectiveness varies across institutions due to capacity constraints and inconsistent funding.1 Several initiatives for research commercialisation in South Africa, such as the Intellectual Property Rights from Publicly Financed Research and Development Act (IPR Act), the Technology Development Fund and the TIA Seed Fund, aim to bridge the gap between research and application. Private sector involvement from venture capital firms and industry partners supports university spin-outs, enhancing the commercialisation ecosystem. Efforts such as the University Technology Fund and the South African SME Fund are starting to show results, with universities like Cape Town and Stellenbosch benefitting from funding. Yet, the National System of Innovation
2025 https://doi.org/10.17159/sajs.2025/21836
remains fragmented with minimal coordination. Progress should be made by building on existing strengths and expanding support to more public research institutions.
While these efforts mark significant progress, challenges still persist to ensure seamless research commercialisation.3 In the 2022 HESTIIL review report, it was noted that, with a few exceptions, the National System of Innovation remains largely fragmented and operates in isolated silos. There has been minimal coordination and alignment in strategic planning, not only between the DSTI and the Department of Higher Education and Training, but also throughout the broader government landscape.
The intention for this Commentary is thus to build upon the progress that is already there, ensuring that existing strengths are expanded and adopted more broadly, to ensure a more inclusive and nationally representative innovation ecosystem.
Challenges in South Africa’s innovation ecosystem
Despite significant strides in R&D, South Africa continues to face critical barriers to translating research into commercial success. Several systemic challenges hinder the country’s ability to leverage its knowledge production for economic and societal impact.
Weak commercialisation pathways
Although South Africa produces a substantial number of scientific publications, only a few of them progress into patents, startups, or market-ready solutions.4,5 The National Advisory Council on Innovation6 highlights that fragmented funding mechanisms prioritise earlystage research but provide insufficient support for later-stage development and commercialisation. As a result, low commercialisation rates persist, preventing the country from fully capitalising on its research potential.7
Misalignment between research and industry needs
Collaboration between researchers and industry remains limited, and research priorities are often disconnected from market demands. Many researchers lack the resources, networks and incentives to engage with industry partners, leading to a shortage of demand-driven innovation.8 This misalignment is further reinforced by incentive structures within academia that prioritise global scientific competitiveness and high-impact publication output over national industrial relevance. Funding agency requirements, institutional strategies and performance metrics tend to reward research visibility over local applicability, inadvertently discouraging researchers from aligning their work with the country’s socio-economic needs. Compared to global counterparts such as the UK and Germany, South African research institutions operate largely in silos, further constraining knowledge transfer. The Transformation of Research in the South report highlights that internal fragmentation and insufficient coordination within public research institutions exacerbate this disconnect, limiting opportunities for industry collaboration.9
Inadequate innovation infrastructure
The absence of well-resourced technology transfer hubs, incubators and accelerators tailored to high-potential research poses a significant barrier to commercialisation. Although some institutions have established TTOs, their effectiveness varies due to capacity constraints, inconsistent funding and weak industry links. Without a dedicated infrastructure to support prototype development, mentorship and early-stage funding, many promising innovations struggle to advance beyond the research phase.
Gaps in commercialisation support
Although later-stage funding initiatives such as those provided by TIA exist, structured support throughout the commercialisation process remains limited. Researchers face challenges in accessing risk capital for product development and market entry, as well as a lack of industry-driven incubation programmes.8 Without targeted mentorship and strategic funding mechanisms, many innovative ideas fail to scale, weakening South Africa’s global competitiveness in innovation.
Learning from global best practices
Countries with strong innovation ecosystems have placed universities as key players in the development of applied research that leads to market-ready solutions. Leading research and innovation ecosystems such as Imperial College London’s White City Innovation District, Cambridge University’s Impulse programme and Oxford University Innovation have successfully bridged research and commercialisation by integrating academia, industry and government support. A major success factor in these models is the deliberate creation of environments in which collaboration between researchers, startups and industry partners is seamless. In South Africa, Stellenbosch University’s Innovus platform supports technology transfer and entrepreneurship. Innovus has played a central role in establishing and managing a growing portfolio of university spin-out companies, contributing to the institution’s commercialisation success and offering a model that could be replicated across the country. One way to achieve this is by cultivating transdisciplinary research through shared innovation spaces where startups, corporate partners and academic researchers co-develop solutions. This approach ensures that research results align with industry needs and market demand, ultimately increasing commercialisation rates. South Africa can benefit from establishing similar innovation districts within its research institutions and national facilities, creating an ecosystem that nurtures early-stage ideas and supports their progression towards commercialisation.
The strategic role of TTOs is vital in bridging academia and industry. A robust model supporting researchers from ideation through to commercialisation – by providing patenting, licensing and venture creation support – is crucial. Although South Africa has TTOs embedded within universities, their effectiveness in other institutions is often constrained by limited funding and insufficient industry participation.10 Strengthening and capacitating these offices with national innovation priorities can significantly enhance the commercialisation success rate of locally developed research.
Furthermore, the global success of research-driven startups and spin-out companies highlights the importance of access to risk capital and commercialisation support. Countries with strong innovation ecosystems ensure that funding mechanisms extend beyond early-stage research and innovation, incorporating venture capital, industry co-investment and innovation-driven grants.11 University-affiliated innovation enterprises play a pivotal role in scaling up university-born innovations by investing in high-impact projects and providing structured business development support.12 In South Africa, fragmented funding for later stage research calls for models linking research grants to commercialisation support for long-term innovation success. By implementing these best practices, South Africa can refine its approach to innovation by developing a well-integrated ecosystem that transitions research from laboratories to commercial applications. Key investments in collaborative spaces, strengthening technology transfer mechanisms and improving access to risk capital will be essential in ensuring that research delivers tangible socio-economic benefits. To achieve this, South Africa must develop a more integrated innovation ecosystem that aligns funding with the full research-to-market pathway. By nurturing an environment in which innovation is not only incentivised but also actively supported through strategic partnerships and commercialisation pathways, the country can unlock its research potential and drive sustainable economic development.13
Positioning South Africa’s innovation ecosystem for success
South Africa has progressed in research and development, but challenges remain in translating this research into impactful innovations for economic growth and to address pressing national social needs. This presents a unique opportunity to position South Africa as a leader in research-driven innovation by aligning funding mechanisms, promoting industry collaboration and supporting commercialisation pathways. The development of a structured innovation pipeline, spanning from early-stage research to market-ready solutions, requires a collaborative effort among key institutions to ensure a seamless transition from
research to commercialisation. For example, public research funding agencies can support research up to the proof-of-concept stage, while the TIA can provide funding for prototyping, and innovation hubs can facilitate experimentation and market validation. Aligning these efforts will strengthen the funding structures to ensure seamless support across the TRLs. This coordinated funding approach, where funding agencies collaborate to ensure continuity across TRLs, will be instrumental in positioning South Africa as an innovation leader.
Furthermore, encouraging transdisciplinary and industry-linked research will be key to driving innovation success. Global examples emphasise the importance of integrating academic research with industry needs and encouraging research models that facilitate collaboration between researchers, startups and established industry players. One approach to achieving this is by incentivising industry–academia partnerships, strengthening technology transfer, and ensuring that research is aligned with real-world challenges. Establishing dedicated innovation hubs within national facilities and universities could provide the infrastructure necessary to scale research beyond the laboratory. Current incentives for publications may lead to research being published but not commercialised, so similar incentives for commercialisation could enhance practical applications. A previous study found that a combination of monetary and non-monetary incentives is necessary to encourage academic
researchers’ involvement in technology commercialisation, suggesting that targeted incentives could improve the translation of research into market-ready solutions.1
Policy and regulatory alignment is essential for fostering innovation. South Africa has several strategies, like the Decadal Plan for STI and the NDP 2030, but better integration of policies, funding and incentives is needed. Government-backed venture capital and commercialisation support can be beneficial through public–private partnerships. Furthermore, positioning South Africa’s innovation strategy for success requires a change in mindset, ensuring that innovation is measured not only through academic output but also through commercial impact, technology transfer and societal transformation. This can be achieved by refining key performance indicators that track the commercialisation rate, industry collaborations and socio-economic contributions of funded research. By embedding impact-driven metrics into funding calls, South Africa can ensure that innovation is purpose-driven and contributes meaningfully to national and global development priorities.
The proposed framework in Table 1 presents a set of targeted, actionable and contextually grounded steps that can help address key systemic gaps. It is a suggested tool to strengthen the current work, offering a structured pathway toward a more seamless and responsive innovation
1. Policy alignment and reform Harmonise and streamline policies for innovation
2. Inter-agency collaboration Promote coordination across funding and policy agencies
3. Technology Transfer Office (TTO) capacitation and incentives Strengthen institutional support for commercialisation
4. Regional innovation hubs Foster collaboration through innovation spaces
5. Innovation-specific funding instruments Address the ‘valley of death’ in research funding
• Align Decadal Plan, National Development Plan and key performance indicators (KPIs)
• Flexible IP policies (e.g. trade secrets)
• Establish national innovation implementation committee
• Joint funding calls and reviews
• Fund training for TTO staff
• Link innovation to academic KPIs
• University-anchored sector hubs
• Incentivise co-location with startups
• Launch proof-of-concept fund at public research funding agencies
• Co-investment with venture capital and industry
• Public research funding agencies support TRLs 1–3
• Policy coherence index
• Stakeholder satisfaction
• Number of joint programmes
• Agencies involved
• IP disclosures
• Licences and spin-outs per institution
• Hubs established
• Startups incubated
• Industry partnerships
• Proof-of-concept projects funded
• Technology readiness level (TRL) progression
6. Structured innovation pipelines (TRLs)
Define a clear pathway from basic research to commercialisation (TRLs 1–9)
7. Impact monitoring and evaluation Track innovation beyond academic metrics
8. Human capacity building Develop innovation, leadership and skills
• Collaborate with Technology Innovation Agency for TRLs 4–7
• Partner with innovation hubs for TRLs 8–9
• Develop KPIs linked to impact
• Socio-economic outcome reporting
• National innovation fellowships
• Industry-mentored short courses
• Percentage of projects progressing to higher TRLs
• Commercialisation rate
• Jobs created
• Innovation revenues
• Sustainable Development Goals alignment
• Fellows trained
• Translational research engagement
Table 1: A proposed strategic framework for the innovation ecosystem
ecosystem. Recognising that some elements may already be operational in certain spaces, this framework aims to provide a cohesive model that, if adopted widely, would accelerate progress, reduce duplication and enhance measurable impact. Importantly, the recommendations align with existing funding mechanisms across TRLs and can be implemented in partnership with key stakeholders such as public research funding agencies, TIA and the Innovation Hub.
The success of South Africa’s innovation strategy depends on collaboration, strategic funding and policy cohesion. By uniting funders, government and industry around a shared agenda, and adapting global best practices to local realities, we can unlock a thriving innovation ecosystem – one that moves ideas from the lab to the marketplace and delivers real impact for society.
Conclusions and recommendations
South Africa is at a pivotal moment to utilise its research foundation for socio-economic benefits. Despite progress in research and development, there is a gap in turning these efforts into market-ready solutions. A coordinated innovation strategy is crucial to align research funding, industry collaboration, and policy support for commercialisation. Enhancing the innovation ecosystem requires addressing structural and financial hurdles. Funding should support research from early stages to market entry. Regional innovation centres, linked to universities and industry, will provide infrastructure and networks. Streamlining intellectual property policies will ease research commercialisation. By integrating strategies, South Africa can shift to an innovation-driven economy, enhancing global competitiveness and driving sustainable development, economic growth and social progress.
Declarations
I have no competing interests to declare. I have no AI or LLM use to declare.
References
1. Razwinani M, Tshikovhi N, Motaung KS. Benefits and challenges of research commercialisation in South Africa: A systemic review. Afr J Innov Manag. 2024;6:1–10. https://doi.org/10.51415/ajims.v6i1.1210
2. Sun SL, Zhang Y, Cao Y, Dong J, Cantwell J. Enriching innovation ecosystems: The role of government in a university science park. Glob Transit. 2019;1: 104–119. https://doi.org/10.1016/j.glt.2019.05.002
3. Mafu M. Technology transfer as a catalyst for effective university-industry collaboration in Botswana. Afr J Sci Technol Innov Dev. 2023;15:606–623. https://doi.org/10.1080/20421338.2023.2173403
4. Archibugi D, Filippetti A. The retreat of public research and its adverse consequences on innovation. Technol Forecast Soc Change. 2018;127:97–111. https://doi.org/10.1016/j.techfore.2017.05.022
5. Lehmann EE, Menter M, Wirsching K. University spillovers, absorptive capacities, and firm performance. Eurasian Bus Rev. 2022;12:125–150. https://doi.org/10. 1007/s40821-021-00199-5
6. National Advisory Council on Innovation (NACI). South African science, technology and innovation indicators. Pretoria: NACI; 2020. Available from: ht tps://www.naci.org.za/wp-content/uploads/2020/08/NACI_2020-STI-Indicator s-Report.pdf
7. Owen R, Vedanthachari LN, Hussain J. The role of the university entrepreneurial ecosystem in entrepreneurial finance: Case studies of UK innovation knowledge centres. Vent Cap. 2024;26:351–375. https://doi.org/10.1080/13691066.2023 .2205606
8. Sihlobo S, Mbatha S. University-industry-government research and development collaborations in public higher education institutions in South Africa. Afr J Sci Technol Innov Dev. 2023;15:69–78. https://doi.org/10.1080 /20421338.2021.2016559
9. Gachie W, Govender DW. Commercialization of higher education institutions’ research within the National System of Innovation. Afr J Sci Technol Innov Dev. 2017;9:387–397. https://doi.org/10.1080/20421338.2017.1338387
10. Frenkel A, Maital S, Leck E, Israel E. Demand-driven innovation: An integrative systems-based review of the literature. Int J Innov Technol Manag. 2015;12, Art. #1550008. https://doi.org/10.1142/S021987701550008X
11. Tile S. Technology drivers of innovation: Competitiveness in biotechnology entrepreneurship in Gauteng, South Africa [master’s thesis]. Johannesburg: University of the Witwatersrand; 2024. https://hdl.handle.net/10539/43867
12. Cullen MD, Calitz AP, Chetty MA. Factors affecting researcher participation in technology commercialisation: A South African university case study. South Afr J Entrep Small Bus Manag. 2020;12(1), Art. #329. https://doi.org/10.4 102/sajesbm.v12i1.329
13. Kruss G. Strengthening the interactive capabilities of public research institutes in South Africa. In: OBrien D, Arvanitis R, editors. The transformation of research in the South: Policies and outcomes. Paris: Archives Contemporaines & IRD; 2019. p. 65–70. http://hdl.handle.net/20.500.11910/15141
https://doi.org/10.17159/sajs.2025/21836
Authors: Mehita Iqani1
Anna Feigenbaum2
Melanie Klinkner3
Pawas Bisht4
Sthabile Kolwa5
Leslie Swartz6
AFFILIAtIoNs:
1South African Research Chair in Science Communication, Department of Journalism, Stellenbosch University, Stellenbosch, South Africa
2Department of Communication and Journalism, Bournemouth University, Poole, United Kingdom
3Department of Humanities and Law, Bournemouth University, Poole, United Kingdom
4School of Humanities, Keele University, Newcastle-under-Lyme, United Kingdom
5Department of Physics, University of Johannesburg, Johannesburg, South Africa
6Department of Psychology, Stellenbosch University, Stellenbosch, South Africa
CorrEsPoNDENCE to: Mehita Iqani
EMAIL: mehita@sun.ac.za
hoW to CItE:
Iqani M, Feigenbaum A, Klinkner M, Bisht P, Kolwa S, Swartz L. The uses of evidence: Multidisciplinary insights on oppression and empowerment.
S Afr J Sci. 2025;121(9/10), Art. #21392. https://doi.org/10.17159/sa js.2025/21392
The uses of evidence: Multidisciplinary insights on oppression and empowerment
significance:
Structured Conversation
Interdisciplinary conversations about how knowledge is produced are significant in that they allow for reflection and exchange between different research traditions. This Structured Conversation explores a range of views on how evidence is defined and deployed from four diverse disciplinary perspectives: international law, filmmaking and environmental communication, astrophysics, and psychology and disability studies.
Introduction
Mehita Iqani (M.I.) and Anna Feigenbaum (A.F.): This Structured Conversation explores some epistemological questions about what is counted as science, how science is communicated, and the power dynamics that shape scientific practice, with a particular focus on evidence. Four researchers were invited to grapple with three themes: what counts as compelling evidence in their field; how evidence can or has been deployed by powerful actors; and what role evidence might play in resistance or activism. These discussion points were crafted as entry points into complex and shifting debates around data, methodology and authority as they play out in policy and practice in diverse scientific disciplines. Contributors brought perspectives from their disciplinary positions to explore different conceptual, theoretical and epistemological perspectives on how evidence functions in different ways in research and science communication. Contributors work in the fields of international law (Melanie Klinkner), filmmaking and environmental communication (Pawas Bisht), astrophysics (Sthabile Kolwa), and psychology and disability studies (Leslie Swartz). Their views are, of course, based on their personal and professional experience in scientific research, and cannot be taken to offer comprehensive explanations of their field of science. This Structured Conversation offers not generalisable explanations backed by evidence, but a curated set of subjective opinions, offered here as an exploratory contribution to ongoing conversations and debates about epistemology as well as scientific practice.
the shapes of evidence
M.I. and A.F.: The first provocation offered to our collaborators was organised around the question of the status of evidence. What counts as compelling evidence differs in various scientific disciplines, as do methods of gathering and analysing that data. Apart from the classic divide between quantitative and qualitative approaches, other nuances of what is considered verifiable and convincing also play a role in disciplinary standards of evidence quality. The following observations are drawn from the perspectives of disciplinary framing, and are in relation to individual careers in research and practice in a specific field of research.
Melanie Klinkner (M.K.): In international criminal law, for example at the International Criminal Court, there are different evidential thresholds that need to be met during various stages of proceedings. The highest standard of proof required before the court is that of “beyond reasonable doubt”, which is needed for a conviction. The onus is on the prosecution to prove this and the evidence that is typically presented during proceedings is varied, and could consist of documentary, digital and physical evidence, witness statements and testimony. For the prosecutor to start an investigation, the burden of proof is significantly lower. Here we talk about a “reasonable grounds to believe” threshold which, if met, triggers an investigation. Potentially, then, cases can arise out of an investigation.
Forensic sciences also operate with standards and probabilities, and evidence here can often be pieced together from a variety of sources. DNA identification, which is crucial in the realm of mass graves when recovering human remains, stands out in this regard because a very high threshold (close to 100%) needs to be met for a positive identification to be made.
With processes such as inquiries or truth-finding commissions, they may stipulate what can be considered as fact and what can be considered sufficient evidence to become part of the official records or findings. For example, the Commission on the Truth for El Salvador1 distinguishes the following three: overwhelming evidence, which is conclusive or highly convincing evidence to support the commission’s finding; substantial evidence, which is very solid evidence to support the commission’s finding; and sufficient evidence, which means that there is more evidence to support the commission’s finding than to contradict it (the balance of probability is in favour of inclusion rather than exclusion of this evidence). This shows the practical ways in which evidence and categorising evidence can happen to signify how compelling it is.
Sthabile Kolwa (S.K.): Within physics and astronomy, what is considered and counted as compelling evidence are the empirical results based on observations obtained from telescopes. Astrophysicists take the data that telescopes accumulate, process it, and analyse it using the physical principles that are based on discoveries made in physics and astronomy over hundreds of years. Astronomers use the data to understand the basis for the observations. These are what we call empirical results. Those who do not use observations but rather come up with a theory based on the foundations of physics already available, essentially build on that foundation by forming new relations. The relations may be empirically based or originate from a sequence of logical steps that allow us to model our physical world. Such models and frameworks for our observations are considered compelling evidence. What has been described here is an application of the scientific method, which requires us to come up with a hypothesis of how we understand objects in our physical reality to operate. What follows is the experimental phase in which the hypothesis is tested using the experiment to obtain a set of results. From these results, evidence is
https://doi.org/10.17159/sajs.2025/21392
gleaned of how an object or set of objects interact with one another or evolve with time.
Observations and theory are constantly interlinked, which means that they support each other. Without the theory, we would not be able to fully understand our observations, and without any observations to test our theory against, we would not be able to make sense of what we observe. Essentially, theory and observations are the two types of scientific evidence that are considered compelling in astrophysics. The manner through which such evidence becomes compelling is through peer review. Scientific peers validate how compelling or valid the evidence put forward by a scientist or group of scientists is. Without acceptance through peer review, evidence is not considered worthy of assimilation into our body of knowledge of how the universe works.
Pawas Bisht (P.B.): In environmental communication, particular forms of evidence are mobilised in media storytelling around environmental harm. Marginalised communities that suffer environmental harm and activists (and social movements that work with them) are able to articulate claims around harm and enter conversations around justice. Air pollution is a year-round environmental crisis on the Indian subcontinent, in particular, in the capital city of Delhi.2 The city has an annual average of PM2.5 levels of around 100 µg/m³ (micrograms per cubic metre). PM2.5 is particulate matter that is smaller than 2.5 microns in diameter.3 These are fine particles that can enter the bloodstream and cause a wide range of severe health problems, and they are in the air. The World Health Organization (WHO) specifies a limit of 5 µg/m³ as an acceptable level for this kind of particulate pollution.4 Delhi averages nearly 20 times this figure all year round – it is a huge public health crisis. In terms of media storytelling, however, the problem only assumes a position of credibility in the winter months, when the pollution is visible as a heavy blanket of toxic smog enveloping the city. This idea of visibility is necessary to create a compelling public narrative and becomes crucial in relation to media storytelling.
Another key type of evidence in media storytelling around environmental harm is numerical data, particularly categorisations of levels of pollution and poor air quality. Our analysis demonstrates that there is a focus on numerical categorisations with media coverage tracking movements up and down the scale. This decontextualises environmental contamination and normalises certain levels of environmental harm. The media reporting happens only when the air moves into the very top two categories of contamination, which are ‘very poor’ and ‘severe’. At this point, contamination levels are more than 40 times the WHO-specified limit. Prior to that level of catastrophic environmental harm, all the previous categories did not enter media consciousness at all. This highlights the problematic nature of which evidence forms the basis of media attention.
Leslie Swartz (L.S.): In psychology and disability studies, there is much contestation about the question of evidence itself. A fundamental question is to do with who knows what about whom, who is allowed to know what about whom, and how much people are allowed to know about themselves. There is a long, contested and ongoing history about this. In South Africa, the first census that tried to capture demographic information about disability took place 30 years ago: “We Also Count.”5 From the position of people with disabilities, they are often counted out or discounted, yet also demand to count and to account. Relating the evidence question to disability studies, there has been very little action because of the fight about what actually constitutes evidence. From outside views, which tend to be very medicalised historically, to the centring of insider views and insider accounts, the place we give in disability studies to subjectivity, and how we take account of it, is an ongoing and central question.
The big movement in establishing what came to be known as the British social model of disability was based on a slogan now known far beyond disability studies: “Nothing about us without us.”6 There is the argument that knowledge is not possible, and action on knowledge is not possible, without the input at all levels from people who are affected and controlled by that knowledge in various ways.
When evidence is powerful
M.I. and A.F.: As the observations shared in the previous section highlight, different scientific disciplines find and construct evidence in different
ways, with some prioritising objectivity and quantitative rigour, and others privileging subjective lived experiences. Evidence is central to the scientific project in terms of how it is deployed into analysis, findings and, often, policy and law. We asked our collaborators to reflect on the ways in which evidence enters into formations of power and can be deployed in specific ways to produce specific outcomes, which are, of course, different in each domain of science. Because there are also power dynamics that shape how evidence is gathered (what counts as evidence and how), there are also power dynamics that shape how evidence is used. Existing power structures can shape not only what evidence counts, but how it is made to count. Although certain traditions of scientific enquiry demand rigorous and objective evidence bases, we invited our collaborators to consider how the subjective and political also, inevitably, creep into scientific praxis, and how the uses of evidence cannot always be seen as neutral.
M.K.: In international law, court judgments are top-down in that they issue a verdict, but, like truth commissions, they rely on evidence provided by witnesses and survivors. There are different types of evidence that at different stages and processes can be considered compelling enough to issue verdicts. Investigations of mass graves stand out, as these have been found to produce a reliable set of evidence. This evidence has come before the courts, particularly in relation to the Srebrenica genocide that happened in the 1990s in Bosnia. Indeed, both Radovan Karadžić7 and Ratko Mladić8 were found guilty of genocide. In both cases, there were investigations on the ground in Bosnia, which produced evidence considered legitimate and authoritative and which remains largely uncontested. In the case of mass grave investigations in Bosnia, the point was to corroborate victim and witness accounts of the actual massacres through physical evidence and determine an accurate count of who the victims were, in terms of sex, age, cause and time of death, ethnicity, etc. What was so striking in the Karadžić and Mladić cases is that the Chambers really did say, “this is beyond reasonable doubt”9; the evidence met the threshold of proving genocide. Patterns and systematicity were shown through those investigations. The bar is high in proving genocide, because you also have to prove the intent to commit genocide, which can be inferred from the evidence. It is an important example of how a plethora of evidence has come before a court and resulted in this verdict that meets the “beyond reasonable doubt” threshold. And yet, even though this forensic evidence and other evidence was tested in court, rigorously taken apart, peer reviewed, and, as far as we know, collected in an impartial manner, the independence and credibility are still contested by supporters of the accused. There are voices that reject those findings as unpersuasive or unacceptable, despite the fact that there is physical evidence to prove the contrary, which continues to shape narratives, politics and historical accounts.
Forensic investigations also have another purpose; not just to produce information and evidence for the courts, but also to ultimately speak for the victims and assist in processes to return human remains. So, even though the historical accounts might be contested, the ultimate benefit to the survivors still can accrue by virtue of the human remains being returned, and in that sense, there is that element of persuasiveness for the individuals to whom it matters.
S.K.: Within the domain of astrophysics, there are plenty of examples and ways in which compelling evidence and evidence in general has been used as an instrument of power. There is a competitiveness within the landscape of academia, and within physics and astrophysics in particular. Such competitiveness is generally associated with the push to publish the most compelling and noteworthy scientific results possible.
For those who wish to position themselves high up within the hierarchy of academia, scientific results obtained from the observational and theoretical sides can be used to elevate their status within the field. They can do so by publishing widely, being highly cited in journals, and using that compelling evidence to apply for funding for prestigious grants and gain accolades because of their noteworthy findings.
For those who are capable of doing harm, this level of prestige can be used as a way of wielding power over others who are lower down within academic hierarchies, such as master’s and doctoral students, postdoctoral researchers, and early-career scientists who have not yet
obtained the level of experience that would put them in a position to garner the prestige that comes from publishing compelling and noteworthy results.
Actual examples of such wielding of power by so-called prestigious scientists have come about through the silencing of abuse victims within the field — those who have been harmed through verbal and sexual assault, and those who have also been harmed financially by the employment structure. Such individuals, for instance, may have experienced a lack of access to funding and permanent jobs, or been pushed out of the field entirely. The case of Geoffrey Marcy is a well-known example of a highly accomplished scientist who wielded his position to proposition, solicit, and harass women for many years before he was placed on trial, and excommunicated from the astronomy community.10
Other harmful behaviours in astrophysics include the tendency to scoop or steal noteworthy research results from those who do not possess a high enough position within the academic hierarchy. This is common with students, and the most famous example of this is Dame Jocelyn Bell Burnell, who discovered pulsars through an instrument and experimental setup that she herself built.11 This find was scooped by her PhD supervisors who went on to win the Nobel Prize for the discovery of these astrophysical objects. This is a famous example of how individuals can use their level within the academic hierarchy to essentially silence and steal scientific results and push themselves even higher up within the academic structure. It is a vicious cycle that perpetuates inequality. These are the ways in which neutral or objective scientific evidence can be captured and used as an instrument of power and self-advancement, at the cost of others, within the framework of astrophysics.
P.B.: In the context of representing environmental harm, the choice of evidence and its framing in media storytelling become clear instruments of inclusion and exclusion. What is seen in the actual experience of environmental harm, from an issue such as air pollution, is that there are inequalities in the capacities of populations to mitigate that harm. A small section of the population can remove themselves into private atmospheres of sanitised air, using air purifiers or limiting their exposure to polluted air, but most of the urban workforce and poorer communities are at the forefront of exposure and harm. In media storytelling that is driven by numerical, abstract categorisations of harm or contamination, there is little space for sharing these experiences of vulnerability.
Relatedly, data tend to be framed in line with the interest of government stakeholders and unhelpfully reproduce party political conflicts. For instance, what is seen in the storytelling and data presentation around air pollution is its categorisation as ‘local’ (from urban sources within the city) and ‘non-local’ (pollution from largely rural, non-metropolitan sources outside the city’s administrative boundaries). This oppositional framing tends to pit the suffering of the urban citizen subjects against backward, polluting, rural ‘others’, reinforcing party political frames where blame and responsibility are shifted onto political actors across administrative boundaries. Scientifically, and from a policy perspective, this kind of oppositional categorisation is deeply unproductive. Air pollution needs to be understood and managed through a transboundary ‘airshed’ approach which requires cooperation and coordination between different local, regional and federal administrations and agencies.12
Some people ‘don’t matter’ as citizen subjects in media narratives, for example, agricultural workers, and farmers who reside in Delhi’s neighbouring Indian states of Punjab and Haryana. These farmers are forced to burn some of their agricultural residue for a complex set of reasons, including that agricultural policies are failing them. This agricultural residue burning contributes a small percentage of pollution in the winter months, but there is an inordinate focus on it in media storytelling.13 14 Political and media actors underplay systemic large-scale urban sources of pollution such as transport, construction and industry and instead blame rural others.
Linked to this is a politics of visibility around technological interventions from the state, such as smoke towers and water cannons. These, scientifically, have little credibility in terms of mitigating harm or solving air pollution15, but they function effectively as symbols of a technological modernity and are picked up by the media. There is a confluence of
interests between media storytellers and state policy actors that excludes voices of vulnerable urban poor and rural ‘others’. The voices of excluded actors need to be foregrounded for a new set of transformative media narratives to emerge. A new, more inclusive set of air pollution narratives, on our project website2, is addressing these challenges.
L.S.: If you are unfortunate enough to be involved in an accident, insurance companies (if you have insurance) will make some sort of assessment of how much you should be paid out in compensation. One of the methods that is used by insurance companies is a map of the body showing payouts for injuries. So, if, for example, you lose one finger, it is X amount. If you lose two fingers, it is 2X. Part of what we talk about in disability, in terms of the use of power, is how these methods of counting, which look very objective, and in some ways are, have very profound social and economic implications for people. Part of the history of how disability has been thought about, is linked to technologies of counting and ideas about the objectivity of science. We know that, historically, ideas about what the ‘ideal’ body should look like, what a diseased body is, and what an ‘unacceptable’ body is, have had profound implications for people’s lives.
Under Nazism, the people who were killed before Jewish people and other groups were in the so-called T4 group. These were people who were seen as having bodies that were not useful to the economy. The term that was used in Nazi ideology was “useless feeders”16. So, there is a link between a particular kind of body, and whether it is seen as useful to society in general, that links to other histories of counting. For example, the concept of mental age that comes from psychology, which remains influential, serves in a whole range of ways to determine who is allowed to be in certain spaces, whether a person should be institutionalised, and so on. ‘Mental age’ uses a form of counting which appears objective and scientific, and is in some ways, but also links to a whole range of subjective ideas about evolution and Social Darwinism — the relationship between people and animals, and who deserves to be called a human.
Within the context of colonialism, one theorist has noted, colonialism in an objective sense is disabling, and extractive economies produce disabilities.17 In South Africa, in agriculture and mining, impairments have been created through a particular way of forcing human beings to interact with nature through difficult and dangerous work. As well as this, there is also an ideological way in which disability operates through capitalist labour practices. For example, if you think about the gaze of Westerners onto so-called ‘non-Western people’, we can see that they were labelled as disabled by their lack of conformity to a particular, biased, body ideal. But, if those people were to conform to the dominant colonial ideal, then they might have become alienated from their own cultures, and become constructed as disabled in another way.
This politics of counting, which is one way to describe how evidence is manipulated by oppressive regimes of power, is a way of excluding not only disability but disabilities implicated in a whole range of broader exclusions, including racial and colonial exclusion.
Can evidence liberate?
M.I. and A.F.: As illuminated by the reflections on the ways in which evidence can be absorbed into structures of power in ways that can be oppressive, alienating or marginalising, evidence cannot be treated as neutral or objective, even when it purportedly is. Of course, the personal experiences and interpretations of lone scientists cannot be taken as representations of entire fields and their relations to evidence, but they do offer some insight into the multiple ways in which data and evidence can be harnessed by those who already hold political or social power, whether it is the judges of international courts or senior scientists building individual spheres of influence. Even though evidence can sometimes be used in oppressive ways, as some of the reflections offered so far have hinted, it can also play a strong role in rewriting oppressive systems and creating space for progressive politics. The third theme explored in this Structured Conversation turned to the question of whether, and how, evidence can contribute to strategies and practices of empowerment, especially for people and communities who are excluded by existing hierarchies of knowledge, policy and representation.
M.K.: An arrest warrant was issued by the International Criminal Court on 15 August 2017, which was based largely on evidence collected from social media. The warrant was issued against Mahmoud Mustafa Busayf al-Werfalli in the context of the Libyan conflict.18 He allegedly ordered or committed 33 murders in the Benghazi region. Proceedings have since been terminated, because Mr Al-Werfalli has died, or so social media reports say. This is significant because the arrest warrant initially was based on seven separate incidents that were captured on videos that appeared on social media. Courts are renowned for not necessarily embracing innovation, but this case is an example of a new willingness to take social media posts as sufficient evidence.
A wealth of information collected, documented and archived from digital evidence and on-the-ground evidence has since been repeated in numerous contexts. Of course, there is a flip side to the use of social media as evidence: it can also be used as propaganda or misinterpreted. That is something that needs grappling with: the verification of bottom-up evidence, and how to make sense of it.
The important questions are not, “What’s bottom up? What’s bottom down?”, but rather, “How can the two meet?” In the social sciences and humanities, researchers are privileged because they can do research collaboratively, so the rules of engagement start to matter. Who is invited to the table? Who is allowed to speak? Who is being privileged at any given point in time when we are trying to get to the substance of a subject? These are critical considerations that both scientists and legal scholars can shape.
S.K.: Some physicists have begun to borrow from the social sciences, as far as compiling evidence to counter malpractice within academia. It would benefit scientists to look to social science to enable an effective understanding of systemic and structural inequalities that exist within the sciences. Methods such as case studies, interviews and compiling statistics can offer a sense of the social, interpersonal and professional experiences that scientists have. Such data could allow for the extrapolation of systemic issues encountered by scientists within their field, and how their advancement can be dependent on their identity, whether they are disabled or not. Such insights can shed light on what is considered the norm in their field.
Astrophysics has historically been white men dominant. In the USA, less than 0.5% of physics PhDs were awarded to black individuals between 2018 and 2019.19 The white men who have been able to achieve a level of status in the field come from privileged backgrounds, because financial privilege contributes to success within academia due to how the system is structured. Up until the time that a person can achieve a permanent position, they need to go through a series of short-term contracts and postdoctoral positions. They must, over the course of two or three years, produce compelling evidence, have it peer reviewed and published, and then use that evidence as motivation to find their next postdoctoral contract. All of this may continue indefinitely until one finds a permanent position, which are few and far between. Therefore, there is a sense of great instability that one experiences in their early career as an astrophysicist. Social science can help to explain the roadblocks and challenges facing academics in their early careers in astrophysics, and to tackle the systemic issues that inhibit young scientists, specifically those who are not the dominant identity in the field, from achieving a level of status.
In astrophysics, there is a sense of prestige that is ascribed to the field itself, as an academic practice that exists at a higher level above other forms of knowledge. It is possible that some astrophysicists do not trust social science methods to help them understand the systemic issues that result from discrimination, inequity, and how structural obstacles prevent astrophysics from becoming a field full of diverse individuals. Developing a sense of trust in the social sciences and humanities might be a way of tackling this challenge.
P.B.: In media coverage around environmental harm, the problem lies in storytelling that is decontextualised, and does not leave any room for differentiated senses of responsibility and vulnerabilities. For empowerment to come from the bottom up, it is necessary to develop an ethics of storytelling that foregrounds marginalised and silenced perspectives, speaks to a differentiated sense of harm, and clearly attributes responsibility
for the minimisation of harm. Storytelling should foreground lived experiences of other ways of being that are already providing pathways for solutions. New environmental storytellers should be empowered, and new spaces for storytelling should be expanded.
Good examples of this are the documentary films produced by the ‘Pollution Stories’ project.2 The film Delhi, 2.5 looks at the experiences of younger residents of the city. It focuses on two young people in the city: one from a more affluent, middle-class background, and one from a poorer, out-of-city, industrial area. The narrative demonstrates that while there are shared experiences of harm that these two young people suffer, there are vast differences in the ability of these young people and their families to mitigate that environmental harm.
Another film from the project, More Than Smoke: Stubble, the Farmer’s Dilemma focuses on agricultural crop burning, and the storytelling perspective is deliberately shifted away from the middle-class, urban point of view to that of the farmers. What is uncovered is a more complex narrative of a food system on the point of breakdown, showing linkages between climate change, food production and air pollution. The mitigation and solution of these problems requires systemic, complex thinking and a shifting of perspectives to allow complex storytelling. In telling the story from the perspective of the farmers, their awareness of these issues is highlighted, as well as their ways of working with nature, which are largely left out from the more dominant media storytelling.
The film City Moves focuses on mobility justice within the city. Desirable urban space is often defined by a narrow, middle-class outlook of a certain kind of green aesthetic. The film disrupts this outlook by bringing in the perspectives of a Muslim housewife from a working-class background and a carpenter who uses a bicycle to go to work in the city of Delhi. The city is shown through their eyes, and the difficulty that they have in navigating the city in a non-motorised way is highlighted. This dislodges some of the very embedded green aesthetics and the middle-class politics of visibility that is in play around the air pollution narrative, and, more broadly, the imagination of what a sustainable city looks like.
In summary, data and evidence are a very crucial part of environmental storytelling in the media, but they need to go hand in hand with an ethics of storytelling which brings in the experiences and perspectives of marginalised populations, who are often the majority and more vulnerable members of the community. It is crucial to demand this of the new generation of storytellers. But of course, structural and systemic hindrances still need to be overcome. We need to create more resources and space for new, transformative, evidence-driven narratives. There needs to be greater infrastructural support, training and capacity building for this kind of storytelling.
L.S.: An important contribution of contemporary theory about disability is the idea that disability is a relational construct.20 Disability is not something that you have inside you but rather something that emerges from your relationship with an environment. The classic example is that if someone in a wheelchair looks for a job in a building where there are staircases and no ramps and lifts, the disability is located somewhere in the relationship between them and the environment. Mobility is a key part of how we are rethinking disabilities – who can go where and on what basis? It is not a question of impairment to the body.
A second contribution of a disability theory that is very important, is understanding the distinction between disability as an identity and how disability affects what you can and can’t do. If you look at the history of censuses, they used to ask questions like, “Are you deaf, blind, or crippled?” Because of that line of questioning, we thought that there were quite low rates of disability.
The Washington Group on Disability Statistics (which was formed as a United Nations Statistical Commission City Group) has refashioned how we ask questions about disability21, with questions like “Do you have difficulty doing this?” or “Do you have a lot or little?” in various domains. As a result of this new way of collecting evidence, the global rates of disability have gone up, not because people have changed, but because researchers are asking questions in different ways. That is important in terms of including people and providing the resources that people need to be able to participate on an equal basis to others within society.
Disability brings a new perspective to how we think about the environment, both physical and online, which is the concept of universal design. If we change the environment in such a way that it is good for people with impairments, it is usually good for other people as well. For example, if you have lifts or ramps, you are designing a city with kerb cuts and so on; it is good for people who use wheelchairs, but it is also good for people with young children. This example reminds us how environments themselves can be disabling.
sharing perspectives on evidence: Concluding thoughts
M.I. and A.F.: The conversation so far has offered several perspectives on what evidence looks like, how it can be deployed by those in power, and how it might also contribute to emancipatory projects. All these perspectives are rooted in the specific disciplinary traditions and theoretical frameworks shaping the knowledge projects held by each of our participants. Although limited to the stances of our four co-authors, this Structured Conversation represents a multidisciplinary conversation, and we are struck by how this has in turn created an opportunity for each researcher to listen to the disciplinary perspectives of the others. This offers a possibility to reflect on what it means to consider evidence bases from disciplines outside of those in which we were trained, and also to think more openly about what the role of listening could and should be in relation to the democratisation of knowledge. How can researchers from a variety of disciplinary positions orient themselves towards ideas of listening when building evidence bases?
M.K.: Most people do not have enough capacity to listen and cognitively compute the wealth of evidence and information we receive. A way to get around that, as a researcher, is to have a brilliant team. But that means you need the money to pay for that team. So, we are back to the discussion of how to get a grant or a post? How do you bring talented people in? How do you have a diverse team so that you are exposed to all these things that you ought to listen to?
S.K.: Imagining a more democratised structure within a hierarchy of physics and astrophysics almost seems fantastical, but it helps to try and imagine what this would look like. What comes to mind is those who enter astrophysics and are positioned immediately as the so-called ‘ontological others’ (those who are neurodiverse, those who have so-called ‘hidden disabilities’, those who are from cultural backgrounds that are not commonly represented within astrophysics, those who are first-generation graduates; those from low-income backgrounds, etc.) and if there is a way in which these individuals can find support from the structure, can be provided with an environment where they are listened to, where their concerns, as far as discrimination or a lack of access to the funding that they need to thrive within the field, are heard. All of these challenges that ontological others face within the field should be taken seriously by those who already operate within the existing power structures.
As a result, we would be able to move towards a more democratised academic hierarchy. As long as those who are in power seek only to hold on to their power and use it to wield authority over the scientists who are developing their careers, this disadvantageous structure will not change, and academia will remain a broken system that privileges only a few. Democratisation requires a complete restructuring of the entire academic system, and all hands on deck are required for such a process.
P.B.: Transdisciplinarity is key to overcoming some of these hierarchies of knowledge and the siloed thinking that often stifles solutions to the problems. In environmental communication, we can develop ways of working together that disrupt hierarchies of knowledge and create multilayered storytelling. Methods based on listening and collaborative narrative are pathways for creating a more equal space of understandings. Where can we create those spaces? Where is the funding, money and policy support for creating those spaces?
L.S.: A key question for disability studies is always the question of accessibility: who has access to what and on what basis? These are technical but also attitudinal questions. What disability research brings to transdisciplinarity is a more general question: who is allowed to be
here in this conversation? Who is thought to have knowledge? If we get disability right, it helps us to think about other ways of exclusion, so one could argue we should always start there.
One of the things that is not talked about much is the prejudices of people from certain scientific disciplines about other scientific disciplines. This is also misinformation, and comes from the way that the academy is organised. People from different fields are organised to be strangers to one another and are incentivised to disrespect other disciplines. We should think about how we can resist our own socialisation and reproduction of interdisciplinary competition and prejudice.
M.I. and A.F.: This Structured Conversation has explored some perspectives on what evidence is from the macro to the micro, from the perspectives of four researchers based in four disciplines. The discussion has revealed how evidence is contested, multifaceted, layered and indeed variable. This requires us to continue expanding ways of listening across disciplinary boundaries and sharing perspectives on the data that we are gathering, the status that it has in our disciplines, as well as the status that it may take on in other disciplines. Questions of visibility and listening will remain key in terms of thinking about how evidence can be deployed in emancipatory and progressive ways.
Declarations
We have no competing interests to declare. We have no AI or LLM use to declare. All authors read and approved the final manuscript. L.S., as Editor-in-Chief, was screened from the assessment of this paper.
r eferences
1. Betancur B, Planchart RF, Buergenthal T. From madness to hope: The 12-year war in El Salvador: Report of the Commission on the Truth for El Salvador. El Salvador: Commission on the Truth for El Salvador; 1993.
2. Bisht P, Kidwai S, Giraud E, Devi S. Storytelling for environmental change [webpage on the Internet]. No date [cited 2025 Feb 23]. Available from: https://pollutionstories.org/stories-2/
3. Roychowdhury A, Somvanshi A, Kaur S. 2023 – the crossroad: Year end analysis of PM2.5 pollution in Delhi [document on the Internet]. c2023 [cited 2025 Feb 23]. Available from: https://www.cseindia.org/Report-Jan3-4-Endof-2023-state-of-air-pollution.pdf
4. World Health Organization WHO). WHO Global air quality guidelines: Particulate matter (PM2.5 and PM10), ozone, nitrogen dioxide, sulfur dioxide and carbon monoxide. 1st ed. Geneva: WHO; 2021.
5. Schneider M, Dasappa P, Khan N, Khan A. Measuring disability in censuses: The case of South Africa. Alter. 2009;3(3):245–265. https://doi.org/10.101 6/j.alter.2009.04.002
6. Charlton JI. Nothing about us without us: Disability oppression and empowerment. Berkeley, CA: University of California Press; 2004. https://doi .org/10.1525/california/9780520207950.001.0001
7. International Criminal Tribunal for the former Yugoslavia. Karadžić (IT-955/18) [webpage on the Internet]. No date [cited 2025 Aug 14]. Available from: https://www.icty.org/en/case/karadzic
8. International Criminal Tribunal for the former Yugoslavia. Mladić (IT-09-92) [webpage on the Internet]. No date [cited 2025 Aug 14]. Available from: https://www.icty.org/en/case/mladic
9. Milanovic M. Karadzic trial chamber finds no genocide in Bosnia but for Srebrenica [webpage on the Internet]. EJIL: Talk! 2012 June 28 [cited 2025 Aug 14]. Available from: https://www.ejiltalk.org/karadzic-trial-chamber-find s-no-genocide-in-bosnia-but-for-srebrenica/
10. Kaiser J. Astronomer Geoff Marcy booted from National Academy of Sciences in wake of sexual harassment. Science. 2021 May 27 [cited 2024 Dec 03]. https://doi.org/10.1126/science.abj7157
11. Biography.com editors. Jocelyn Bell Burnell biography [webpage on the Internet]. c2014 [updated 2021 Mar 29; cited 2024 Dec 03]. Available from: https://www.biography.com/scientists/jocelyn-bell-burnell
12. Khan AA, Kumar P, Gulia S, Khare M. A critical review of managing air pollution through airshed approach. Sustain Horiz. 2024;9, Art. #100090. https://doi. org/10.1016/j.horiz.2024.100090
13. Downing AS, Kumar M, Andersson A, Causevic A, Gustafsson Ö, Joshi NU, et al. Unlocking the unsustainable rice-wheat system of Indian Punjab: Assessing alternatives to crop-residue burning from a systems perspective. Ecol Econ. 2022;195, Art. #107364. https://doi.org/10.1016/j.ecolecon.2 022.107364
14. Syed S. More than just smoke: Stubble, the farmer’s dilemma [video on the Internet]. Storytelling for Environmental Change. 2023. Available from: https ://vimeo.com/865976342
15. Guttikunda S, Jawahar P. Can we vacuum our air pollution problem using smog towers? Atmosphere. 2020;11(9), Art. #922. https://doi.org/10.339 0/atmos11090922
16. Rotzoll M, Richter P, Fuchs P, Hinz-Wessels A, Topp S, Hohendorf G. The first national socialist extermination crime: The T4 program and its victims. Int J Ment Health. 2006;35(3):17–29. https://doi.org/10.2753/IMH0020-7411350302
17. Meekosha H. Decolonising disability: Thinking and acting globally. Disabil Soc. 2011;26(6):667–682. https://doi.org/10.1080/09687599.2011.602860
18. International Criminal Court. Al-Werfalli case [webpage on the Internet]. No date [cited 2025 Aug 14]. Available from: https://www.icc-cpi.int/libya/al-werfalli
19. Flatow I. Where are the black physicists? [podcast] Science Friday. 2022 March 04 [cited 2025 Aug 14]. Available from: https://www.sciencefriday.co m/segments/black-physicists/
20. Thomas C. Rescuing a social relational understanding of disability. Scand J Disabil Res. 2004;6(1):22–36.
21. Madans JH, Loeb ME, Altman BM. Measuring disability and monitoring the UN Convention on the Rights of Persons with Disabilities: The work of the Washington Group on Disability Statistics. BMC Public Health. 2011; 11(Suppl 4), Art. #S4. https://doi.org/10.1186/1471-2458-11-S4-S4
AuTHORS: Dhisha Narismulu1
Marietjie Botes1
AFFILIATION:
1School of Law, University of KwaZulu-Natal, Durban, South Africa
CORRESPONDENCE TO:
Dhisha Narismulu
EMAIL: dhish.n@gmail.com
DATES:
Received: 25 Feb. 2025
Revised: 19 June 2025
Accepted: 29 July 2025
Published: 29 Sep. 2025
HOW TO CITE:
Narismulu D, Botes M. Emergency abortion in South Africa: Legal access, implementation, and the role of sexual violence. S Afr J Sci. 2025;121(9/10), Art. #20802. https: //doi.org/10.17159/sajs.2025/20802
ARTICLE INCLuDES:
☒ Peer review
☐ Supplementary material
DATA AVAILAbILITY:
☐ Open data set
☐ All data included
☐ On request from author(s)
☐ Not available
☒ Not applicable
EDITORS:
Floretta Boonzaier
Leslie Swartz
KEYWORDS: emergency medical treatment, abortion services, South African Constitution, National Health Act, reproductive rights, healthcare ethics, conscientious objection
FuNDING: None
Emergency abortion in South Africa: Legal access, implementation, and the role of sexual violence
Rape has historically been used as a weapon of war, inflicting profound physical, psychological and social harm on survivors while destabilising communities. The intersection of conflict-related sexual violence and restricted access to abortion care exacerbates the suffering of survivors, particularly in addressing unwanted pregnancies, stigma and long-term health consequences. Despite international legal frameworks such as the Geneva Conventions and the Convention on the Elimination of All Forms of Discrimination Against Women (CEDAW) recognising the importance of comprehensive reproductive health care, including abortion, significant gaps in implementation persist, leaving survivors without the necessary care. This article concludes that abortion as emergency health care is critical for addressing the needs of survivors, ensuring their rights to dignity, autonomy and health. In South Africa, constitutional provisions, supported by the Choice on Termination of Pregnancy Act (CTOP Act) and the National Health Act (NHA), provide a robust legal framework that mandates access to emergency abortion care, even in cases of conscientious objection. Placing these findings in a broader context, this article underscores the importance of integrating legal, ethical and medical guidelines to operationalise emergency abortion care effectively. Strengthening healthcare systems through practitioner training, advocacy, and the removal of systemic barriers is essential to upholding survivors’ rights. These insights have broader implications for global efforts to provide equitable and rights-based reproductive health care in humanitarian and conflict settings.
Significance:
A common weapon of war, rape inflicts profound physical, psychological and social harm on survivors and their communities. Often occurring in settings with restricted access to abortion care, acts of rape bypass the protections offered by international legal frameworks, thereby exacerbating the suffering of the survivor. By reviewing these frameworks alongside the robust South African legal framework for abortion care, we underscore the importance of integrating legal, ethical and medical guidelines to operationalise emergency abortion care effectively.
Introduction
Sexual violence has long been used as a weapon of war and domination, devastating lives and communities with its far-reaching physical, psychological and social consequences.1 From the colonisation of the Americas, where European powers frequently used rape and sexual violence to terrorise and control Indigenous populations2, the Rape of Nanking3, and the Partition of India4 to modern conflicts such as the Rwandan Genocide5 and the wars in Bosnia6, Syria7, Myanmar8, Ukraine9, and the Democratic Republic of Congo10, the strategic use of sexual violence has served to humiliate, exert power and disrupt social structures. In colonial contexts, particularly during the conquest of Native American peoples, sexual violence was a tool of conquest, used to assert racial and cultural superiority and to enforce submission. This historical legacy underscores the continuity of gender-based violence as a means of domination in both colonial and contemporary conflict settings to destabilise populations and assert control over women’s bodies. Beyond the immediate trauma, survivors often face ongoing challenges, including unwanted pregnancies, stigma and limited access to reproductive health care.
Access to abortion, as an essential component of emergency health care, is critical for addressing the needs of survivors of conflict-related sexual violence. International legal frameworks – including the Geneva Conventions11, Convention on the Elimination of All Forms of Discrimination Against Women (CEDAW)12, and UN Security Council resolutions13 – recognise this need and underscore the importance of comprehensive reproductive health care for survivors. However, the implementation of these protections remains inconsistent, and is often hindered by restrictive laws, stigma and resource constraints, leaving many women and girls without the care they urgently require.
In South Africa, the legal framework enshrines the right to emergency health care, including abortion, through constitutional provisions and legislation such as the Choice on Termination of Pregnancy Act (CTOP Act)14 and the National Health Act (NHA)15. These laws provide a robust foundation for addressing abortion as emergency health care, balancing the rights of patients and healthcare providers. Furthermore, the integration of mental health care and protections for minors ensures a comprehensive approach to reproductive health care, particularly in crisis situations.
Despite South Africa’s progressive legal framework that explicitly recognises the right to reproductive health care, including abortion in emergency contexts, significant barriers to access persist. While instruments such as the Constitution16, the CTOP Act and the NHA provide strong textual guarantees, their implementation remains uneven, particularly for women facing structural vulnerability, such as survivors of sexual violence. In practice, access to abortion services is often constrained by provider reluctance, vague interpretations of legal thresholds for emergency, and the absence of accountability mechanisms.17 This article addresses a key research problem: the disconnect between the legal recognition of abortion as emergency health care and its realisation in clinical settings. This article provides a narrative legal review which explores the historical and contemporary use of rape
2025 https://doi.org/10.17159/sajs.2025/20802
as a weapon of war, the international legal and humanitarian responses to abortion as emergency health care, and South Africa’s national legal framework. It also provides practical guidelines for healthcare practitioners to navigate these complex medical and ethical situations. By examining these intersecting issues, we highlight the critical need for accessible, rights-based abortion care in emergencies and the broader implications for global and national healthcare systems.
Sexual violence as a driver of emergency abortions
Rape has long been used as a weapon of war to terrorise and destabilise populations, humiliate enemies, and exert control over women’s bodies.1 Notable historical examples include the Japanese military’s use of “comfort women” during World War II and the mass rapes by occupying forces, including during the Rape of Nanking (1937–1938).18 During the partition of India (1947), widespread sexual violence occurred that targeted women across religious divides, with an estimated 75 000–100 000 women being abducted and raped.19 Pakistani forces raped an estimated 200 000–400 000 women during the Bangladesh Liberation War (1971) using sexual violence as a strategy to undermine the nationalistic aspirations of Bengalis.20 Modern examples include the systematic mass rape of Bosniak women by Serbian forces during the Bosnian War (1992–1995), often in ‘rape camps’, to ethnically cleanse territories.21 Survivors of rape during the Bosnian War often had no access to abortion services due to stigma and restrictive laws. Some organisations provided clandestine abortions, while others advocated for broader access to emergency reproductive care. Between 100 000 and 250 000 women were raped during the Rwandan Genocide (1994), often with the intention of impregnating Tutsi women to create a ‘Hutu’ generation.22 In this regard, the International Criminal Tribunal for Rwanda recognised rape as a crime of genocide and a crime against humanity in the case of Prosecutor v. Jean-Paul Akayesu.23 Whilst the judgment does not directly address abortion, it highlights the systematic nature of sexual violence in conflict. In Prosecutor v. Dragoljub Kunarac, the International Criminal Tribunal for the Former Yugoslavia classified rape as torture and a war crime, emphasising its devastating impact on survivors, including forced pregnancies.24 Conflict in the Democratic Republic of the Congo (1998–present) also resulted in widespread sexual violence, crowning it the “rape capital of the world”25. Similarly, reports of rape as a weapon of war have emerged from conflicts in Syria, Myanmar (targeting Rohingya women), the Ukraine (targeting Ukrainian civilians by Russian forces), and Ethiopia (Tigray region).26 Rohingya women in Myanmar who survived these instances of systematic rape fled to Bangladesh, where humanitarian organisations provided post-rape care, including abortions. However, the lack of consistent access to safe abortion care compounded the survivors’ trauma. It is thus clear that the impact of such violence extends beyond physical trauma, including unwanted pregnancies, stigma and long-term mental health consequences.
The historical and contemporary use of rape as a weapon of war underscores the need for comprehensive health care, including access to abortion. International legal frameworks and humanitarian guidelines (discussed below) recognise abortion as part of emergency medical care for survivors of conflict-related sexual violence. However, case studies highlight significant gaps in implementation due to stigma, restrictive laws and resource challenges. Strengthening legal and policy frameworks globally is essential to ensure that survivors receive the care they need.
While the South African legal framework offers robust protection for access to emergency health care, including abortion, it is essential to examine how these rights are interpreted and implemented in practice by healthcare providers. Legal instruments such as the Constitution16, the NHA15, and the CTOP Act14 provide clear mandates, but the realisation of these rights is often shaped by the attitudes, discretion and constraints faced by healthcare workers. Empirical studies have shown that, despite the legal obligation to provide emergency abortion care, many providers experience uncertainty or invoke conscientious objection, even in cases where the patient’s life or health is at risk.27 These patterns reveal a gap between the law and lived experiences, which warrants closer scrutiny in both historical and contemporary contexts.
Historically, South Africa’s transition from the restrictive abortion regime under the apartheid-era Abortion and Sterilisation Act to the more progressive CTOP Act in 1996 marked a radical legal shift but not an immediate transformation in provider behaviour. Early implementation studies found widespread provider hesitancy due to moral, religious or professional discomfort.28 More recent research continues to reveal regional disparities and systemic delays in accessing emergency abortion, particularly in under-resourced rural clinics.29 Factors such as limited provider training, insufficient awareness of legal obligations, bureaucratic inefficiencies, and pervasive stigma continue to inhibit full realisation of reproductive rights. These constraints are compounded by the lack of formal accountability mechanisms to monitor and enforce legal obligations under the CTOP Act and NHA.30 Understanding these socio-political and institutional dynamics is critical for evaluating both the strengths and the shortcomings of South Africa’s current emergency abortion framework.
Abortion and international reproductive health law
International regulatory frameworks recognise abortion as a critical aspect of emergency health care in conflict situations, particularly for addressing the consequences of sexual violence and conflict-related pregnancies. Under international humanitarian law, the Geneva Conventions, more specifically Convention (IV) relative to the Protection of Civilian Persons in Time of War (Fourth Geneva Convention), addresses the protection of civilians during armed conflicts, including provisions related to sexual violence and medical care.31 Article 27 explicitly prohibits acts of sexual violence against civilians and states: “Women shall be especially protected against any attack on their honour, in particular against rape, enforced prostitution, or any form of indecent assault.”31 This provision underscores the obligation of parties to a conflict to protect women from sexual violence, recognising such acts as serious violations of international humanitarian law. However, while the Fourth Geneva Convention mandates the provision of medical care to civilians affected by conflict, it does not specifically address abortion services. The Convention emphasises the general duty to ensure medical attention and care for the wounded and sick without adverse distinction but does not explicitly mention abortion as a component of emergency health care. In this regard, Gaggioli emphasises the legal and humanitarian challenges faced by women and girls who become pregnant as a result of rape in armed conflicts, including the potential pursuit of unsafe abortion practices that may endanger their lives and health.32 For these purposes, it is important to address these issues from both humanitarian and legal perspectives, advocating for the provision of comprehensive medical care, including access to safe abortion services, to uphold the rights and well-being of survivors.
Further, in the realm of international human rights law, CEDAW further strengthens the protection of women in conflicts.33 Although CEDAW does not explicitly address rape as a weapon of war or abortion as emergency health care in its original text, its enshrined principles and subsequent interpretations by the CEDAW Committee provide a framework for addressing these critical issues. CEDAW defines discrimination against women broadly, including acts that impair or nullify women’s enjoyment of human rights and fundamental freedoms. Article 1 of the Convention sets this foundational definition, while Article 12 specifically mandates state parties to eliminate discrimination in health care and ensure equal access to health services, including family planning. Additionally, Article 16 calls for the elimination of discrimination in matters relating to marriage and family relations, which may extend to protecting women from forced pregnancies resulting from sexual violence in conflict settings. The CEDAW Committee has expanded upon the Convention’s provisions through General Recommendations. General Recommendation 19 (1992) explicitly recognises gender-based violence, including rape, as a form of discrimination against women.34 It also emphasises that sexual violence during armed conflict disproportionately affects women and constitutes a violation of their fundamental rights. Similarly, General Recommendation 30 (2013) on women in conflict situations acknowledges the use of rape as a weapon of war and urges States to take concrete steps to prevent such violence, prosecute perpetrators, and provide comprehensive healthcare services to survivors, including sexual and reproductive health
services.35 Further, General Recommendation 24 (1999) on women and health highlights the need for States to ensure women’s access to reproductive health care, including safe abortion where permitted by law and emphasises that restrictive laws on abortion and inadequate access to health care violate women’s rights.36 The CEDAW Committee has consistently interpreted the Convention to require States to provide safe abortion services, particularly for survivors of rape, incest, and in cases where the mother’s life or health is at risk. Recommendation 35 (2017) explicitly addresses sexual violence during conflict and highlights the necessity of reparative justice measures, including access to essential healthcare services such as abortion.34 Although not conflict related, the case of LC v. Peru underscores the denial of abortion as a violation of human rights under CEDAW and sets a precedent for recognising abortion as necessary medical care in emergencies.37
Similarly, UN Security Council Resolution 1325 (2000) acknowledges the disproportionate impact of armed conflict on women and girls and emphasises the importance of addressing sexual violence as part of post-conflict recovery and ensuring that women have access to the health care they need.38 The World Health Organization (WHO) also provides a critical perspective on abortion in conflict settings. According to its Guidelines on Safe Abortion (2022), women who experience rape during conflict are entitled to comprehensive medical care, which includes access to safe abortion services.39 The WHO recognises abortion as essential for addressing both the physical and psychological consequences of conflict-related pregnancies, framing it as an integral component of emergency health care. International policy initiatives reflect these principles in practice, with humanitarian organisations advocating for and providing abortion care in conflict zones. Organisations such as Médecins Sans Frontières (MSF) and the International Rescue Committee (IRC) emphasise the inclusion of safe abortion services as part of emergency medical care in humanitarian settings.40 These initiatives demonstrate a commitment to ensuring that women affected by conflict receive the medical care they need, including access to abortion, as a matter of dignity, justice and essential health rights.
What constitutes emergency health care in South Africa?
While South Africa is not a country experiencing armed conflict, the international legal and humanitarian frameworks discussed above provide an important normative foundation for understanding abortion as a component of emergency medical care. These global standards, developed in response to sexual violence in times of war, establish principles of bodily autonomy, reproductive justice and non-discriminatory access to health care that are equally relevant in non-conflict settings. Survivors of rape and sexual violence in South Africa may face severe psychological and physical harm, stigma and barriers to care that render abortion a time-sensitive and medically necessary intervention. Thus, although the nature and scale of emergencies may differ, the underlying ethical imperative, to provide immediate, dignified and comprehensive care, remains the same. The following section examines how these imperatives are legally codified and operationalised within South Africa’s constitutional and statutory framework, with particular attention to how emergency abortion care is defined and implemented in a peacetime but unequal health system.
A fundamental socio-economic right provided for in the Constitution of the Republic of South Africa is Section 27, which provides access to health care, food, water and sanitation.16 Being a progressively realisable right, the attainment of these rights is dependent on reasonable legislative and other measures, as well as available resources. Whilst access to general health care is thereby qualified and not immediately realisable, section 27(3) does, however, provide that no person in the country may be denied emergency medical treatment. The South African Constitution thus guarantees the right to access healthcare services, including reproductive health care, under Section 27(1). In cases involving abortion, this provision ensures that life-threatening pregnancies must be treated as emergencies. Furthermore, Section 12(2) upholds the rights to bodily and psychological integrity, empowering individuals to make decisions about reproduction. These rights are supported by Section 11, which enshrines the right to life. It must, however, be noted that these rights must also be balanced in terms of the so-called limitations clause
(Section 36) which allows for balancing competing rights, such as a healthcare provider’s conscientious objection, with patients’ rights.
Section 5 of the NHA supports or reinforces this constitutional mandate by providing that no one may be refused emergency medical treatment by a healthcare worker, provider or establishments.15 This means that an obligation is borne by all health establishments, public and private, to render emergency treatment, irrespective of the patient’s ability to pay for such services. Practically, it would require all health establishments to render sufficient medical assistance to stabilise a patient, after which they would be entitled to transfer the patient to an appropriate facility. In abortion-related emergencies, the NHA ensures stabilisation of the patient before transfer to an appropriate facility if necessary. In addition, through its preamble, the NHA also acknowledges that health care in South Africa is to be rendered with due consideration being given to Section 27(3) of the Constitution.
Key to enforcing Section 27(3) of the Constitution is a clear understanding of what a medical emergency constitutes. Whilst the right to health care is provided for in international conventions, no formal definition of a medical emergency is found in these laws. In South Africa, this concept was defined by the Constitutional Court in Soobramoney v Minister of Health (Kwazulu Natal).41 The court found that a medical emergency constituted a “dramatic, sudden situation or event which is of a passing nature in terms of time. There is the same suddenness and at times even an element of unexpectedness in the concept of emergency medical treatment.” Based on this definition, it may be understood therefore that any patient who presents with a medical condition which constitutes a rapid change or threat to their health and life should be deemed to be a medical emergency. Accordingly, they should be treated expeditiously and rendered the appropriate treatment so as to uphold Sections 27(1) and (3) of the Constitution, including Section 11 – the right to life. No further criteria are set out for what may constitute an emergency, other than that it must be of a nature that could threaten the person’s health status and life.
Abortion as emergency health care in South Africa
Abortions were legalised in South Africa in 1996 through the promulgation of the CTOP Act.14 This Act was brought about as a result of the implementation of the South African National Health Plan, which sought to restructure public health care and consequently redress gender inequality and the reproductive rights of women, in democratic South Africa.42
The CTOP Act operationalises constitutional rights by allowing terminations of pregnancy under specific conditions. It specifies three scenarios for legal abortions, ranging from elective terminations within the first 12 weeks to cases of severe risk to the mother or foetus beyond 20 weeks. The CTOP Act limits conscientious objection by healthcare providers, particularly in emergencies in which the patient’s life or health is at risk. Violations of the CTOP Act’s provisions carry significant legal penalties, ensuring accountability for denying care.
In the case of Christian Lawyers Association v Minister of Health, the court addressed the constitutionality of the CTOP Act.43 The Christian Lawyers Association contended that the Act violated Section 11 of the South African Constitution, which guarantees the right to life, by permitting abortions. The court dismissed this claim, ruling that constitutional rights do not extend to foetuses, thereby upholding the Act’s provisions. Regarding abortion as emergency health care, the court’s decision did not specifically focus on this aspect. The judgment primarily centred on the broader constitutional validity of the Act and the applicability of the right to life to foetuses. Consequently, the case did not provide detailed guidance on the provision of abortion services in emergency medical situations. However, the CTOP Act itself outlines the circumstances under which abortions may be performed, including provision for emergency situations, which ensures that abortions are accessible as a necessary medical intervention in emergencies to protect the health and life of the woman.
The CTOP Act defines the termination of pregnancy as “the separation and expulsion by medical or surgical means, of the contents of the uterus of
a pregnant woman”14. It applies to women of all ages, provided that their need to terminate is compliant with the conditions provided for in Section 2(1) which provides that a pregnancy may be terminated in one of three situations: (1) upon the request of the pregnant woman during the first 12 weeks of the pregnancy’s gestation period; (2) upon the request of the pregnant woman between the 13th and 20th week of the gestation period provided that, upon consultation with the pregnant woman, a medical practitioner is of the opinion that the continued pregnancy poses a risk of injury to the woman’s mental or physical health, presents a substantial risk that the foetus could suffer severe mental or physical abnormalities, would significantly impact upon the economic or social circumstances of the pregnant woman, or stems from an act of rape or incest (our emphasis); and (3) upon the request of the pregnant woman after the 20th week of the gestation period if, after consultation with another medical practitioner or a registered midwife, a medical practitioner is of the opinion that the continued pregnancy poses a risk of injury to the foetus, could result in the severe malformation of the foetus, or could endanger the life of the woman. Save for a termination requested within the first 12 weeks of the gestation period during which time a registered midwife may carry out the termination, all terminations during any other time must be undertaken by a medical practitioner.
Whilst the CTOP Act does not provide healthcare practitioners with a conscience clause, or a clause providing them with the ability to avoid rendering medical services on the grounds of their personal beliefs, Section 15(1) of the Constitution does offer them a refusal mechanism as it provides all persons with the right to freedom of conscience, religion and belief. This right may be limited, however, where the situation constitutes a medical emergency and where the available healthcare practitioners are employed by the state. Therefore, where a woman’s pregnancy constitutes a medical emergency demanding termination of such a pregnancy, and where no other facilities are available to carry out the termination, state-employed healthcare workers may have their rights to freedom of conscience, religion and belief (Section 15(1)) limited to the extent that they are obligated to assist in carrying out the required termination. This limitation may be justified in terms of the so-called Limitations Clause (Section 36) of the Constitution. The termination will be deemed to be an emergency in any situation in which the continued pregnancy poses a severe danger to the health or life of the woman and/or the foetus. Common causes of such emergencies include where the pregnant woman suffers from illnesses such as pulmonary hypertension, severe preeclampsia, cancer or severe kidney disease.44 Ectopic pregnancies and the prognosis of lethal foetal abnormalities may also constitute such emergencies.45 In these circumstances, the termination of pregnancy will also be carried out irrespective of the gestational age of the foetus.
While the provisions discussed above primarily relate to situations in which the foetus will not survive the termination of pregnancy, some scholars argue that these principles could also apply to emergency caesarean sections resulting in live births, particularly when the pregnant person is a minor.46 As noted earlier, the CTOP Act defines termination of pregnancy broadly as the separation and expulsion of the contents of the uterus, without specifying whether the foetus must be non-viable. This definition leaves room for interpretation and may, in emergency situations involving minors, justify medically necessary interventions such as caesarean sections, even if the foetus is born alive.
Section 129 of the Children’s Act in South Africa outlines the consent requirements for medical treatment and surgical operations involving children.47 It establishes the circumstances under which children can consent to their own medical care, as well as when parental or guardian consent is required. The Act specifies that children aged 12 years or older may consent to their own medical treatment and to the treatment of their child, provided they are sufficiently mature and have the mental capacity to understand the benefits, risks and social implications of the treatment. Similarly, children aged 12 or older may consent to surgical operations on themselves and their child, but this must be done with the assistance of a parent or guardian. For children under the age of 12, or those 12 or over who lack sufficient maturity or mental capacity, a parent, guardian or caregiver must provide consent for medical treatment or surgical procedures. In cases of emergency, where immediate medical treatment or surgical intervention is necessary to save the child’s life or
prevent serious health consequences, the Act allows for exceptions to the usual consent requirements. In such situations, the superintendent of a hospital or the person in charge may provide the necessary consent if obtaining parental or guardian consent is not feasible. These provisions aim to balance the rights of children to participate in healthcare decisions with the need for adult guidance and protection, particularly in cases involving significant medical interventions.
On the other hand, the CTOP Act allows that the termination of pregnancy may be provided to all pregnant persons, irrespective of their age, and without the consent of any other person. As such, a pregnant minor can obtain an abortion based solely on their own consent, without the consent of their parent(s) or guardian(s). It has been contended that this benefit also extends to situations in which a pregnant minor intends to deliver a live child but requires an emergency caesarean section in order to do so.46 In these circumstances, the requirement to obtain the consent of a parent or guardian will be overridden by the provisions of the CTOP Act, thereby allowing the pregnant minor to obtain the necessary surgical intervention, including the ‘termination’ of pregnancy via caesarean section. McQuoid-Mason did warn that this option would be available only to pregnant minors with a gestation period of more than 20 weeks when the foetus is viable, and the continued pregnancy would pose a risk of injury to the foetus or risk the life of the pregnant minor.46 It may be understood that where a pregnant minor elects to use this option for whichever reason, that such choice should be construed as them exercising their right to an early, safe and legal termination of pregnancy. The CTOP Act thus enables pregnant minors to consent to abortions without parental involvement, ensuring that their reproductive autonomy is respected, and this principle also extends to emergency caesarean sections in life-threatening situations. However, this autonomy raises ethical questions about the capacity and maturity required for informed decision-making in such cases.
The CTOP Act also permits healthcare providers to exercise conscientious objection, allowing them to decline participation in abortion procedures due to personal beliefs. However, this right is not absolute. In emergency situations in which a pregnant patient’s life or health is at immediate risk, healthcare practitioners are legally obligated to provide the necessary care, regardless of personal objections. This ensures that the patient’s right to life and health is prioritised over the provider’s personal beliefs. In addition, while Section 15(1) of the Constitution protects healthcare providers’ rights to freedom of conscience, this right is limited when a medical emergency arises. The Limitations Clause (Section 36) justifies compelling state-employed practitioners to provide abortion services if refusal would endanger a patient’s life.
The Mental Health Care Act (MHCA)48, in conjunction with the CTOP Act, provides for critical assistance to women in South Africa who experience rape or sexual violence, particularly when they suffer from mental health issues as a result and require an abortion as emergency health care. These laws collectively ensure access to necessary health care, uphold patient dignity, and protect the rights of individuals with mental health conditions. Survivors of rape or sexual violence often experience severe psychological consequences, including post-traumatic stress disorder, depression, anxiety or suicidal ideation. The MHCA ensures that these women receive appropriate mental health care and support services. The Act also mandates that healthcare providers offer treatment that respects the survivor’s dignity and autonomy while ensuring the mental health condition does not impair access to necessary care. In this regard, the CTOP Act permits abortion up to 20 weeks if the pregnancy poses a risk to the woman’s mental health, a common outcome of rape or sexual violence. Beyond 20 weeks, abortion is allowed if the pregnancy poses a severe threat to the woman’s life or health (including mental health), or foetal viability. The MHCA ensures that women suffering from mental health conditions receive appropriate care and can access abortion services when needed. If the survivor lacks the capacity to consent due to severe mental illness, the healthcare provider can act in the patient’s best interest or involve a guardian or curator to facilitate access to abortion. For survivors facing immediate psychological crises, such as suicidal ideation or severe trauma, the MHCA allows for urgent intervention. In such cases, abortion may be considered part of emergency health care under the CTOP Act, ensuring the woman’s life
and health are safeguarded. Both Acts emphasise the survivor’s rights to dignity, autonomy and appropriate medical care. The laws together create a framework where mental health care and reproductive rights intersect to provide holistic support to survivors of sexual violence.
Practical recommendations for medical practitioners
Abortion as medical emergency treatment in South Africa is firmly grounded in both domestic law, international guidelines and best practices. Medical practitioners have a legal and ethical duty to provide necessary care in such situations, prioritising the patient’s life and health over personal beliefs. By following the practical recommendations below, practitioners can ensure that their actions align with the legal framework while upholding the dignity, autonomy and rights of patients.
1. Recognise medical emergencies
• Understand that emergencies include conditions that pose immediate risks to a woman’s physical or mental health or her life.
• Refer to the Constitutional Court’s definition of a medical emergency as “dramatic, sudden situations threatening health or life”.
• Be alert to cases of sexual violence that may result in severe trauma or health complications, including unwanted pregnancies.
2. Ensure timely stabilisation
• Prioritise the stabilisation of the patient’s health and prevent further deterioration.
• If unable to provide the necessary care, arrange an immediate transfer to a higher-level facility equipped to perform required interventions.
3. Fulfil legal obligations
• Comply with Section 27(3) of the South African Constitution and Section 5 of the NHA, which mandate emergency medical treatment.
• In emergencies, provide abortion care regardless of conscientious objections, as outlined in the CTOP Act.
• Balance the rights of healthcare practitioners to conscientious objection with the patient’s right to emergency health care, particularly in state facilities.
4. Obtain and respect informed consent
• Clearly explain the medical procedure, risks and implications to the patient.
• For minors, ensure they understand the procedure and respect their right to consent under the CTOP Act without parental involvement.
• When a patient lacks capacity to consent (due to severe mental health issues), act in their best interest with appropriate legal consultation if necessary.
5. Provide mental health support
• Recognise the psychological impact of rape and sexual violence on survivors, including post-traumatic stress disorder, depression and anxiety.
• Collaborate with mental health professionals to ensure the survivor receives holistic care, including abortion if mental health risks justify the procedure.
6. Document thoroughly
• Maintain detailed records of the medical condition, treatment provided, consent process, and justifications for medical decisions.
• Ensure documentation aligns with legal and institutional policies for accountability and continuity of care.
7. Ensure access for minors
• Understand that minors are entitled to abortion care under the CTOP Act without parental consent.
• Be aware of additional safeguards, such as providing guidance to ensure they understand the implications of their decisions.
8. Advocate for training and protocols
• Advocate for regular training to keep healthcare practitioners updated on legal, ethical, and clinical guidelines for emergency abortion care.
• Establish clear institutional protocols for managing abortionrelated emergencies, including rapid response mechanisms and referral systems.
9. Address stigma and resource constraints
• Work to reduce stigma associated with abortion care, especially in emergency contexts.
• Advocate for adequate resources, including trained personnel and medical supplies, to ensure timely and effective care.
10. Engage in advocacy and policy reform
• Contribute to institutional and public discussions on improving access to emergency abortion care.
• Advocate for policies that address systemic barriers, such as restrictive laws and lack of resources, that hinder care for survivors of sexual violence.
Conclusion
Rape as a weapon of war continues to inflict profound and multifaceted harm on individuals and communities worldwide. Beyond the immediate physical and psychological trauma, conflict-related sexual violence often leads to unwanted pregnancies, compounding the long-term impact on survivors. In such circumstances, access to safe abortion services emerges as an essential component of emergency health care, ensuring that survivors’ rights to dignity, autonomy and health are upheld. International legal frameworks, such as the Geneva Conventions, CEDAW, and UN Security Council resolutions increasingly recognise the need for comprehensive reproductive health care, including abortion, in conflict settings. However, gaps in implementation – due to stigma, restrictive laws and inadequate resources – persist, leaving many survivors without the care they urgently need.
South Africa’s legal framework, underpinned by the Constitution, the CTOP Act and the NHA, offers critical protections for abortion as emergency healthcare. These provisions, bolstered by international guidelines, mandate that healthcare practitioners prioritise the health and rights of women and minors, even in the face of conscientious objections. Moreover, the integration of mental health considerations ensures a holistic approach to addressing the needs of survivors of sexual violence.
Healthcare practitioners play a pivotal role in operationalising these legal protections. By identifying emergencies, prioritising stabilisation, and respecting patient autonomy, practitioners can bridge the gap between legal mandates and practical implementation. The need for continuous training, clear protocols, and advocacy efforts is essential to overcome barriers such as stigma and resource limitations.
Ultimately, the provision of safe abortion as emergency health care reflects not only a legal obligation but also a moral imperative to support survivors of conflict-related sexual violence. Strengthening global and domestic frameworks and ensuring their effective implementation is crucial to safeguarding the rights, dignity and well-being of survivors in the face of systemic and individual acts of violence.
This article has demonstrated that while South Africa’s legal framework –anchored in the Constitution, the CTOP Act and the NHA – formally recognises abortion as a component of emergency health care, significant
gaps remain in its practical implementation. These gaps are shaped not only by legal ambiguities or provider conscientious objection, but also by broader systemic and institutional failures, including uneven service provision, lack of enforcement mechanisms and socio-political stigma. By situating the South African context within international legal norms, and grounding the analysis in both historical and current healthcare practices, this article underscores the urgent need for legal accountability, clearer operational guidelines and improved support for both patients and providers. Emergency abortion care is not just a clinical issue but a matter of reproductive justice, demanding coordinated legal, ethical and public health responses. Future reforms must prioritise structural equity, service delivery oversight and community-informed care models to ensure that the rights enshrined in law are fully realised in practice.
Data availability
There are no data pertaining to this article.
Declarations
We have no competing interests to declare. We have no AI or LLM use to declare.
Authors’ contributions
D.N.: Conceptualisation, writing – original draft, writing – review and editing. M.B.: Conceptualisation, writing – original draft, writing – review and editing, supervision. Both authors read and approved the final manuscript.
References
1. Kirby P. How is rape a weapon of war? Feminist international relations, modes of critical explanation and the study of wartime sexual violence. Eur J Int Relat. 2013;19(4):797–821. https://doi.org/10.1177/1354066111427614
2. Walter D. Colonial violence: European empires and the use of force. Oxford: Oxford University Press; 2017.
3. Brook T. The Tokyo judgment and the rape of Nanking. J Asian Stud. 2001; 60(3):673–700. https://doi.org/10.2307/2700106
4. Brass PR. The partition of India and retributive genocide in the Punjab, 1946–47: Means, methods, and purposes 1. J Genocide Res. 2003;5(1):71–101. https://doi.org/10.1080/14623520305657
5. Taylor CC. Sacrifice as terror: The Rwandan Genocide of 1994. Abingdon: Routledge; 2020.
6. Hansen L. Gender, nation, rape: Bosnia and the construction of security. Int Fem J Politics. 2000;3(1):55–75. https://doi.org/10.1080/14616740010019848
7. Banwell S. Security, peace and development: Unpacking discursive constructions of wartime rape and sexual violence in Syria. Int J Peace and Dev Stud. 2018;9(2):15–30. https://doi.org/10.5897/IJPDS2018.0318
8. Alam M, Wood EJ. Ideology and the implicit authorization of violence as policy: The Myanmar military’s conflict-related sexual violence against the Rohingya. J Glob Secur Stud. 2022;7(2), Art. #ogac010. https://doi.org/1 0.1093/jogss/ogac010
9. Boesten J. Sexual violence as a weapon of war in Ukraine. BMJ. 2022;377, Art. #o1172. https://doi.org/10.1136/bmj.o1172
10. Meger S. Rape of the Congo: Understanding sexual violence in the conflict in the Democratic Republic of Congo. J Contemp Afr Stud. 2010;28(2):119–135. https://doi.org/10.1080/02589001003736728
11. Directorate General of Human Rights and Legal Affairs, European Council. Overview of legal protection against sexual violence afforded to women during situations of armed conflict. Ad Hoc Committee on Preventing and Combating Violence against Women and Domestic Violence (CAHVIO). Strasbourg:Directorate General of Human Rights and Legal Affairs, European Council; 2009. Available from: https://rm.coe.int/1680593fc6
12. United Women, United Nations. Convention on the Elimination of All Forms of Discrimination against Women (CEDAW) [webpage on the Internet]. c1979 [cited 2025 Jun 18]. Available from: https://www.un.org/womenwatch/daw/ cedaw/text/econvention.htm
13. United Nations Security Council. Resolution 2272 (2016). New York: UN Security Council; 2016 March 11. Available from: https://docs.un.org/en/S /RES/2272(2016)
14. Republic of South Africa. Choice on Termination of Pregnancy Act 92 of 1996. Available from: https://www.gov.za/sites/default/files/gcis_document/20140 9/act92of1996.pdf
15. Republic of South Africa. National Health Act 61 of 2003. Available from: https://www.gov.za/sites/default/files/gcis_document/201409/a61-03.pdf
16. The Constitution of the Republic of South Africa 1996. Available from: https://www.gov.za/documents/constitution/constitution-republic-south-afri ca-1996-04-feb-1997
17. De Londras F, Cleeve A, Rodriguez MI, Farrell A, Furgalska M, Lavelanet AF. The impact of provider restrictions on abortion-related outcomes: A synthesis of legal and health evidence. Reprod Health. 2022;19(1):95. https://doi.org/1 0.1186/s12978-022-01405-x
18. Wui Ling C. Walking the long road in solidarity and hope: A case study of the Comfort Women Movement’s deployment of human rights discourse. Harv Hum Rts J. 2009;22:63. Available from: https://heinonline.org/HOL/Page?hand le=hein.journals/hhrj22&div=6&g_sent=1&casa_token=&collection=journals
19. Ali RU. Hearts divided: A social overview of the partition of Punjab, 1947. J Res Soc Pakistan. 2020;57(1), Art. #233 Available from: https://pu.edu.pk /images/journal/history/PDF-FILES/17_57_1_20.pdf
20. Ranjan A. Women in war zones: Rape at the time of Bangladesh Liberation War. In: Ranjan A, Hashmi T, Abbas M, editors. The aftermath of the Bangladesh Liberation War of 1971. London: Routledge; 2024. p. 73–79. https://doi.org/10.4324/9781003463627-6
21. Snyder CS, Gabbard WJ, May JD, Zulcic N. On the battleground of women’s bodies: Mass rape in Bosnia-Herzegovina. Affilia. 2006;21(2):184–195. https://doi.org/10.1177/0886109905286017
22. Totten S. The plight and fate of females during and following the 1994 Rwandan genocide. In: Totten S, editor. Plight and fate of women during and following genocide. New York: Routledge; 2017. p. 107–136. https://doi.org /10.4324/9781351298162-7
23. Prosecutor v. Jean-Paul Akayesu. International Criminal Tribunal for Rwanda (Appeals Chamber), Tanzania. Case number ICTR-96-4-A. Judgment decision date:1 June 2001.
24. Prosecutor v. Dragoljub Kunarac. International Tribunal for the Prosecution of Persons Responsible for Serious Violations of International Humanitarian Law. Case number MICT-15-88-ES.1. 2024
25. Committed in the Territory of the Former Yugoslavia since 1991 (Appeal Chamber). Case no.: IT-96-23& IT-96-23/1-A. Judgement decision date: 12 June 2002.
26. Mkhize N. Critical consideration of measures to curb the use of sexual violence in armed conflict in the Democratic Republic of the Congo. Afr Insight. 2021;50(4):19–36. https://hdl.handle.net/10520/ejc-afrins_v50_n4_a2
27. De Londras F, Cleeve A, Rodriguez MI, Farrell A, Furgalska M, Lavelanet AF. The impact of ‘conscientious objection’ on abortion-related outcomes: A synthesis of legal and health evidence. Health Policy. 2023;1(129), Art. #104716. https://doi.org/10.1016/j.healthpol.2023.104716
28. Harries J, Cooper D, Strebel A, Colvin CJ. Conscientious objection and its impact on abortion service provision in South Africa: A qualitative study. Reprod Health. 2014;11, Art. #16. https://doi.org/10.1186/1742-4755-11-16
29. Amnesty International. South Africa: Barriers to safe and legal abortion in South Africa. London: Amnesty International; 2017. Available from: https://w ww.amnesty.org/en/documents/afr53/5423/2017/en/
30. Pickles C. A promising future? Verfassungsblog: On Matters Constitutional. 2023 January 27. https://doi.org/10.17176/20230130-203017-0
31. United Nations. Convention (IV) relative to the protection of civilian persons in time of war (Fourth Geneva Convention) [document on the Internet]. c1949 [cited 2024 Nov 01]. Available from: https://www.un.org/en/genocidepreven tion/documents/atrocity-crimes/Doc.33_GC-IV-EN.pdf
32. Gaggioli G. Sexual violence in armed conflicts: A violation of international humanitarian law and human rights law. Int Rev Red Cross. 2014;96(894):503–538. https://doi.org/10.1017/S1816383115000211
https://doi.org/10.17159/sajs.2025/20802
33. United Nations. Convention on the elimination of all forms of discrimination against women New York [webpage on the Internet]. c1979 [cited 2025 Jun 18]. https://www.ohchr.org/en/instruments-mechanisms/instruments/conve ntion-elimination-all-forms-discrimination-against-women
34. United Nations. Committee on the Elimination of Discrimination against Women. General recommendation no. 35 on gender-based violence against women, updating general recommendation no. 19. 2017 July 14. Available from: https://www.right-to-education.org/sites/right-to-education.org/files/re source-attachments/CEDAW_C_GC_35_8267_E.pdf
35. United Nations. Committee on the Elimination of Discrimination against Women General recommendation no. 30 on women in conflict prevention, conflict and post-conflict situations. 2013 October 18. Available from: https://www.ohchr.org/Documents/HRBodies/CEDAW/GComments/CEDAW .C.CG.30.pdf
36. United Nations. CEDAW General recommendation no. 24: Article 12 of the Convention (Women and Health) [document on the Internet]. c1999 [cited 2025 Jun 18]. Available from: https://www.refworld.org/legal/general/cedaw/1999/en /11953#:~:text=3.,large%20number%20of%20non%2Dgovernmental
37. L.C. v. Peru, CEDAW, U.N. Doc. CEDAW/C/50/D/22/2009 (2011).
38. United Nations Security Council. S/RES/1325. Security Council Resolution on women and peace and security [document on the Internet]. c2000 [cited 2025 Jun 18]. Available from: https://peacemaker.un.org/sites/default/files/document/ files/2022/09/scresolutionwomenpeacesecuritysres13252000english0.pdf
39. World Health Organization (WHO). Abortion care guideline [document on the Internet]. c2002 [cited 2025 Jun 18]. Available from: https://iris.who.int/bitst ream/handle/10665/349316/9789240039483-eng.pdf?sequence=1
40. Chiang C. Reproductive health needs in complex humanitarian emergencies: An analysis of Medecins Sans Frontieres’ programs in the Democratic Republic of the Congo [master’s paper]. Chapel Hill, NC: University of North Carolina; 2011. https://doi.org/10.17615/axdw-v679
41. Soobramoney v Minister of Health Kwazulu-Natal 1998 (1) SA 765 (CC).
42. Hodes R. The culture of illegal abortion in South Africa. J S Afr Stud. 2016; 42(1):79–93. https://doi.org/10.1080/03057070.2016.1133086
43. Christian Lawyers’ Association of South Africa v Minister of Health (Reproductive Health Alliance as Amicus Curiae) 1998 (4) SA 1113 (T).
44. Shah S. Hypertensive disorders in pregnancy. In: Sachdeva M, Miller I, editors. Obstetric and gynecologic nephrology. Cham: Springer; 2019. p. 11–23. https://doi.org/10.1007/978-3-030-25324-0_2
45. Marion LL, Meeks GR. Ectopic pregnancy: History, incidence, epidemiology, and risk factors. Clin Obstet Gynaecol. 2012;55(2):376–386. https://doi.org/ 10.1097/GRF.0b013e3182516d7b
46. McQuoid-Mason DJ. Can the consent provisions in the Choice on Termination of Pregnancy Act, which do not require children to be assisted by a parent or guardian, be used for live births by caesarean section in emergency situations? S Afr J Bioeth Law. 2018;11(1), Art. #44.
47. Republic of South Africa. Children’s Act 38 of 2005.
48. Republic of South Africa. Mental Health Care Act 17 of 2002.
AuTHOR: Teresa A. Coutinho1,2,3
AFFILIATIONS:
1Department of Biochemistry, Genetics and Microbiology, University of Pretoria, Pretoria, South Africa
2Centre for Microbial Ecology and Genomics, University of Pretoria, Pretoria, South Africa
3Forestry and Agricultural Biotechnology Institute, University of Pretoria, Pretoria, South Africa
CORRESPONDENCE TO: Teresa Coutinho
EMAIL: teresa.coutinho@up.ac.za
DATES:
Received: 25 Nov. 2024
Revised: 01 July 2025
Accepted: 07 July 2025
Published: 29 Sep. 2025
HOW TO CITE:
Coutinho TA. Bacterial fruit tree quarantine pathogens – a threat to biosecurity in South Africa. S Afr J Sci. 2025;121(9/10), Art. #20644. https://doi.org/10.17159 /sajs.2025/20644
Bacterial fruit tree quarantine pathogens –a threat to biosecurity in South Africa
Quarantine bacterial plant pathogens present a serious threat to the biosecurity of South Africa’s fruit tree industry, posing significant risks to agricultural productivity, trade and biodiversity. Pathogens such as Candidatus Liberobacter asiaticus, Xanthomonas citri pv. citri, Erwinia amylovora and Xylella fastidiosa can cause widespread economic losses in fruit crops, including citrus, apples, pears, grapes and olives. Managing these pathogens is challenging due to their ability to spread rapidly, often by the movement of infected plant material and/or by insect vectors. Limited diagnostic capabilities, few chemical control options, and the emergence of pathogen resistance also hamper effective management. This review highlights the importance of an integrated approach should an incursion occur, which would initially involve eradication, improved surveillance and public awareness. Strengthening these biosecurity practices is essential in safeguarding the agricultural sector and ensuring continued fruit trade viability.
Significance:
• This review highlights the significant threat posed by quarantine bacterial fruit tree pathogens to South Africa’s agricultural biosecurity. These pathogens endanger essential fruit crops, and an outbreak could lead to severe losses, trade restrictions, and socio-economic impacts.
• The review also highlights the challenges that would likely be faced if an incursion should occur. It advocates for an integrated management approach including eradication, surveillance, public awareness, and robust phytosanitary measures, legislative support and inter-agency collaboration. This approach could ensure that we safeguard the agricultural sector and mitigate potential crises.
Introduction
Throughout history, biological invasions have been linked to human activities.1 Globalisation and international trade in the 20th century have intensified the movement of pathogens, increasing the risk of their introduction into new environments. In these locations, pathogens can find suitable hosts and environments conducive to infection, resulting in epidemics. Climate change further exacerbates the problem, as changing temperatures and precipitation patterns can create favourable conditions for the proliferation of these pathogens and their vectors.2
Since 1878, European nations have legislated laws limiting the international movement of plants.1 In South Africa, the government recognised the importance of preventing the entry of quarantine pests in 1948, with the appointment of Dr SJ du Plessis as the ‘Chief of Quarantine’. Today, the phytosanitary regulatory system is governed by the Agricultural Pest Act 1983 (Act No. 36 of 1983) and its regulations. South Africa is also a signatory to the World Trade Organization Agreement on the Application of Sanitary and Phytosanitary Measures (WTO-SPS Agreement)3 and the International Plant Protection Convention (IPPC)4. The Agreement grants member countries the right to apply sanitary and phytosanitary measures necessary for the protection of human, animal and plant health. The purpose of the IPPC is to secure coordinated, effective action to prevent and to control the introduction and spread of pests and pathogens of plants and plant products.
Plant biosecurity is critical to protecting agricultural productivity, biodiversity and the national economy. Fruit tree production in South Africa is increasingly threatened by the emergence of bacterial pathogens, especially those classified as quarantine pathogens, i.e. “pathogens of potential economic importance to the area endangered thereby and not yet present there [classified as A1 quarantine pathogens by the European Plant Protection Organisation (EPPO)], or present but not widely distributed and being officially controlled [A2 quarantine pathogens]”5. Their appearance would significantly impact on tree health and yields, and have the potential to destroy these agricultural sectors. Their presence will also lead to trade restrictions, as countries could impose stringent phytosanitary import requirements and/or phytosanitary measures to prevent the introduction and establishment of foreign pathogens in non-affected countries. The introduction and spread of pests and pathogens in Africa have already caused significant economic and environmental consequences in numerous countries over recent decades.6 The introduction of a quarantine pathogen would destabilise agricultural economies, harm food security, and erode the competitiveness of African agricultural exports.
The production of citrus and pome fruits contributes significantly to food security, employment and export revenue in South Africa. These two agricultural sectors together employ approximately 200 000 people annually. In the 2021/2022 season, over 2 MT of citrus fruit and 1.8 MT of pome fruit were produced for both local consumption and the export market.7 Approximately 77%, 45% and 50% of citrus, apples and pears, respectively, were exported in this same season. The production of table olives and olive oil is a growing market in the country. In the 2021/2022 season, 1400 tons of table olives and 1.5–2.0 million litres of olive oil were produced, with a small percentage exported to Namibia and Botswana.8 These commodities thus play a key role in South Africa’s agricultural economy. This review explores the threat posed by Candidatus Liberobacter asiaticus, Xanthomonas citri pv. citri, Erwinia amylovora and Xylella fastidiosa to plant biosecurity in South Africa, highlighting their potential impact and the phytosanitary measures needed to mitigate risks. The review does not comprehensively discuss the biology, ecology, epidemiology and management of the diseases as there are numerous recent reviews already published on these topics.
2025 https://doi.org/10.17159/sajs.2025/20644
Huanglongbing
Huanglongbing (HLB), or citrus greening, is caused by Candidatus Liberobacter asiaticus (CLas) and is the most destructive disease of citrus because of its ability to spread rapidly and cause severe damage to citrus production and fruit quality, and the difficulty involved in its control. The disease has devastated the Florida citrus industry, with a reported incidence of 100%.9 No control of this disease has been found, beyond preventing the trees from becoming infected.
Pathogens and their vector
Candidatus Liberobacter asiaticus (CLas), Candidatus L. africanus (CLaf) and Candidatus L. americanus (CLam) cause HLB. They are Gramnegative, unculturable Alphaproteobacteria belonging to the Rhizobiaceae. As CLaf and its associated vector, the African citrus psyllid Trioza erytreae, are already present in South Africa, the focus of this review is on CLas and its vector, the Asian citrus psyllid (ACP), Diaphorina citri.
Both psyllid species, T. erytreae and ACP, have been shown to vector CLas.10 Although no transmission tests have been undertaken, CLas has been detected in other psyllid species, Cacophylla citrisuga11 and Diaphorina communis12. Neither of these two species is reported to be present in South Africa.
ACP is a phloem-feeding insect that thrives when soft, young shoots are present and at temperatures between 20 °C and 27 °C that favour its reproduction.13 Acquisition of the bacterium and transmission efficiency vary with environmental conditions, feeding duration, life cycle stage and plant tissue type14 and with the pathogen population in new shoots15 ACP is reported to maintain CLas, in a persistent manner, for 12 weeks16, covering the approximate 90-day lifespan of the psyllid17
Hosts
Natural hosts of CLas are species in the Rutaceae, with Valencia sweet oranges, mandarins, tangelos and grapefruit being the most susceptible18, while Eureka lemons, Persian limes and Carrizo citranges are more tolerant19. No resistant seedlings or scion-rootstock combinations have been identified for use in commercial citrus production.20
Although Murraya exotica and Swinglea glutinosa have been shown to be hosts of ACP21, in HLB-endemic areas, they are considered unimportant alternative hosts of the pathogen22. However, M. exotica, together with Citrus aurantifolia, have been described as “preferred hosts” of ACP.18 In South Africa, M. exotica is classified in the National Environmental Management: Biodiversity Act 10 of 2004 (NEMBA) category 1b23, i.e. invasive species which must be controlled and, wherever possible, removed and destroyed. It is, however, still commercially available as an ornamental plant locally.
Various non-Rutaceae hosts have been shown experimentally to become infected with CLas; for example, dodder (Cuscuta spp.) can transmit CLas to periwinkle plants (Catharanthus roseus), tobacco (Nicotiana tabacum)24 and tomato (Lycopersicon esculentum).25 Pithecellobium lucidum is regarded as an opportunistic host of HLB in China.26
Symptoms
The bacterium colonises the phloem, leading to chlorosis of veins and adjacent tissues, followed by blotching (mottling) of the leaf, premature leaf loss, twig dieback, feeder rootlet and lateral root decay, and decline in vigour, ultimately leading to tree death.27 Affected trees are stunted, multiple flowers appear off-season, most of which fall off, and fruit is small and irregularly shaped with a rind that is thick, pale and remains green at the bottom. The fruit has a bitter taste. ACP and CLas thrive above 30 °C, and, at these temperatures, CLas reaches high titres in trees, favouring acquisition and transmission by ACP. Environmental stress, extreme temperatures and moisture adversely affect HLB-infected trees.28
Distribution and means of movement between countries
HLB is causing significant economic losses and tree death in citrusproducing regions across Asia, the Americas and Africa. In Africa, CLas has only been reported to occur in Ethiopia and Kenya.29 ACP, however,
is reported to be present in Kenya, Tanzania, Ethiopia, Nigeria, Benin and Ghana.29 As HLB and ACP are present in Kenya, natural spread is expected to follow host plant corridors through Mozambique into South Africa, Zimbabwe or Eswatini.30 Movement of the vector is greater in spring and summer, and it is able to disperse at least 2 km within 12 days.31
Human-mediated activities, such as the illegal movement of plant material, are a serious risk for the spread of CLas and ACP, and this means of dispersal has already been implicated in the long-distance transmission of HLB. Thus, phytosanitary and quarantine measures need to be strictly enforced to restrict the movement of citrus plants in the entire region. One of the challenges will be detecting and removing citrus trees grown for own use in rural and urban areas.
CLaf has been located on the citrus seed coat32, but appears not to be seed-transmitted. Seedlings do not develop typical HLB symptoms from infected seed and the pathogen has not been found in seedlings germinated from HLB-affected seed.32 Thus seed transmission, if it occurs, does not appear to play a significant role in CLas dispersal.
Threat to the South African citrus industry
HLB is a regulated disease in South Africa and, as such, the citrus industry – notably Citrus Research International and the South African Department of Agriculture – have put together a HLB/ACP Action Plan.33 This Plan is led by a steering committee and its objectives are to ensure preparedness, surveillance and a response should an incursion occur. Ongoing surveillance and monitoring efforts along the borders of South Africa, Mozambique, Zimbabwe, Eswatini, Botswana and Zambia are routinely taking place.34
Numerous models have been used to predict the potential distribution of CLas and ACP in different climate change scenarios. They are generally continent or country focused. In one study, moderate and extreme climate scenarios were modelled in Africa, and large areas of western, eastern and sub-Saharan Africa, including South Africa, were found to be suitable for the establishment of CLas35 and ACP36
Management
There are no curative methods to control HLB. If an incursion of either CLas and/or ACP enters a new region, the first immediate action is to determine the extent of the outbreak. Thereafter, efforts should be directed towards preventing as many trees as possible from becoming infected by eliminating infected trees and keeping the ACP population as low as possible. Also, only healthy, disease-free certified trees should be planted. This strategy implemented in Brazil resulted in their ability to maintain citrus production and the competitiveness of the industry.37 One of the reasons the outbreak in Florida reached 100% incidence was because the growers did not remove infected trees to eliminate inocula, but rather focused on employing nutritional programmes to improve tree health.8 Improved fertigation did not result in decreased HLB.
Citrus canker
Citrus canker, especially Asiatic canker caused by Xanthomonas citri pv. citri (Xcc), is a major threat to sustainable crop production and food security worldwide. All commercial citrus cultivars are affected by the disease, and there is no strategy to minimise the spread of the pathogen in orchards. The introduction of the pathogen into a country where it is absent has national and international trade implications. Thus, efforts to eradicate the disease in the USA, New Zealand, UK and South Africa have been attempted, in some cases successfully, but in others it has reappeared.
Pathogens
Initially, there were five pathovars of X. citri, namely, citri, aurantifolii (pathotypes B, C, D) and citrumelo (pathotype E). Pathotypes D and E were later shown to belong to other causal agents of citrus diseases. They are members of the Xanthomonadaceae (Gammaproteobacteria). As the most aggressive pathovar is Xcc38, this pathogen will be the focus of this review.
Hosts
Citrus canker is most severe on grapefruit, some sweet oranges, Mexican limes, lemons, trifoliate oranges, the pointed leaf hystrix, and their hybrids used for rootstocks.38 Resistant cultivars are calamondin, kumquats and mandarins. In a study by Licciardello et al.39, 32 ornamental species within the Rutaceae were artificially inoculated with Xcc. The majority exhibited no symptoms or a weak reaction to Xcc. The most susceptible species were Eremocitrus glauca and Murraya ovatifoliolata, neither of which is widely grown in South Africa.
Symptoms
Symptoms of citrus canker include dieback, erumpent lesions on the leaves, stems and fruit, defoliation, premature fruit drop, and reduced fruit quality.39,40 A water-soaked margin develops around necrotic lesions.39 The abaxial (bottom) surface of the leaf develops necrotic lesions while lesions on the adaxial (top) surface are oily, water-soaked brown spots with a distinct yellow halo. Host cell expansion (hypertrophy) and cell division (hyperplasia) occur, leading to raised blisters. The erupting epidermis due to these activities is a key diagnostic feature of the disease, and lesions occur on leaves, stems and fruits.41 Wounding by the Asiatic citrus minor (Phyllocnistis citrella) significantly increases symptom severity.42 The disease is most severe under humid, warm, cloudy conditions with wind and rainfall. Ideal temperatures for growth of the bacterium are between 25 °C and 30 °C.38 Symptoms can appear after 4–7 days under ideal conditions, but may take longer (i.e. more than 60 days) when these conditions are not ideal.43
Eradication of citrus canker in South Africa
Two incursions of citrus canker occurred in South Africa. The first was in the 1905/1906 growing season when Marsh grapefruit trees were imported from Florida and planted in the government’s experimental orchard in Bela Bela (Limpopo Province). The disease spread in the orchard to orange and lemon trees. All infected trees were removed and burnt, and the disease was eventually eradicated from the farm. In 1916, a severe outbreak occurred in two nurseries in the North West Province when infected nursery stock was obtained from the government orchard. All the trees were destroyed.44 During the 1917/1918 season, infected Citrus trifoliata seedlings were imported from Japan by growers. The eradication campaign was implemented in 1917 with all infected trees destroyed; trees were not allowed to be planted within 4.8 km of an infected orchard without a permit. Strict quarantine and restrictions on replanting were imposed, and, 10 years after this outbreak, the areas were declared free of the pathogen.45 Inadvertent re-introduction is “highly likely” despite the quarantine restrictions that are in place.46 Citrus canker has been eradicated from Australia at “least five times”37
Distribution and means of movement between countries
Citrus canker is present in Asia, Africa, South America and parts of the USA. In Africa, the disease is present in Burkina Faso, the Comoros, the Democratic Republic of the Congo, Côte d\'Ivoire, Ethiopia, Gabon, Madagascar, Mali, Mauritius, Réunion, Senegal, Seychelles, Somalia, Sudan and Tanzania.46 It was formerly found in Mozambique.47
Citrus canker can be introduced into new areas through the movement of infected citrus fruits and propagative materials. These means of introduction have been suggested as the source of the pathogen in Brazil48 and the USA49 from Japan. Human-assisted dispersal has played a role in the distribution of the disease.37 In urban areas, backyard citrus is a major source of inoculum.37
Threat to the South African citrus industry
It has been nearly 100 years since citrus canker was eradicated in South Africa, and to our knowledge it has never reappeared. This means that the import restrictions put in place by the South African Department of Agriculture have been successful. However, for this to continue to be the case, laws pertaining to introductions, greater stringency at customs for the illegal importation of plant material, and surveillance will need to be put in place and maintained.
Management
As with the majority of bacterial plant diseases, a curative strategy to eradicate citrus canker is not an option. Where the disease is already present, management strategies rely on cultural practices and phytosanitary practices.49 In a new area or country, once the causal agent is identified by a specialist in the field, an eradication campaign should immediately be implemented. This will mean the immediate destruction of infected trees, which, in South Africa, may be complicated by the presence of trees in subsistence and urban gardens. Collaborative strategies between the South African Department of Agriculture, the Agricultural Research Council, the citrus industry and the growers will be essential.
Fire blight
Fire blight, caused by Erwinia amylovora, is a highly destructive, complex disease of apples (Malus domestica), pears (Pyrus communis) and other related species in the Rosaceae. In countries where fire blight occurs, outbreaks are often sporadic, with disease development rapidly occurring, leading to the loss of the entire orchard.50 The ability of the pathogen to spread rapidly makes it a difficult disease to manage. It can cause extensive losses in fruit yields and lead to trade restrictions on fruit exports. Fire blight also affects the longevity and productivity of fruit trees, further exacerbating the economic burden on growers and increasing management expenses.
Pathogen
The causal agent of fire blight is Erwinia amylovora, a member of the Erwiniaceae and Gammaproteobacteria. It is Gram negative.
Hosts
In the Rosaceae, most of the hosts of E. amylovora are in the subfamily Maloideae, with a few belonging to the subfamilies Rosoideae and Amygdaloideae 51 Besides numerous ornamental hosts, apricot, plum, loquat, quince trees and Rubus species are also hosts of this pathogen.52 However, plum and apricot trees, amongst others, are considered to be non-hosts.52 Erwinia amylovora has also been detected in non-Rosaceae hosts, especially in the undergrowth of orchards and in weeds.53 They have been suggested as probable sites for multiplication and dispersion of the pathogen.
Symptoms
Symptoms occur on all above-ground parts of the tree, including blossoms, fruit, leaves, shoots, branches, trunks, and, when the rootstock is susceptible, near the graft union.54 When numerous shoots are infected, the tree appears to be burnt due to its blighted appearance. The bacteria may progressively invade the rest of the tree from the infected flowers and shoots. Infected bark becomes darker than normal and when the outer bark is removed, the inner tissue is water-soaked, often with reddish streaks that later turn dark brown to black. As disease progression slows, lesions become sunken and sometimes cracked at the margins, forming a canker.53 During periods of high humidity, the tissue that the pathogen has invaded produces a milky sticky exudate composed of E. amylovora cells encapsulated with an exopolysaccharide matrix.
Erwinia amylovora may be present in trees that appear to have no apparent fire blight symptoms.55 The pathogen also transitions from an epiphytic stage on the plant surface (flowers, leaves and shoots) to an endophytic phase within the host tissue.56 The pathogen can grow in a wide range of temperatures ranging from 4 °C to 37 °C, with an optimum of 28 °C.57 Blossom blight epidemics only occur when temperatures are above 18 °C. Infections are more severe when conditions are humid or after rain58, allowing the pathogen population to reach a specific cell density before infection can occur50 Erwinia amylovora cells can also enter a viable but not culturable state to withstand unsuitable environmental conditions.5
Distribution and means of movement between countries
Fire blight was first described in the USA in 1780; thereafter it was detected in Canada in the 1800s.52 It was identified in New Zealand in 1919 – the only country in the Southern Hemisphere where the disease
now occurs. It is present in over 50 countries. In Africa, it occurs in Algeria, Egypt, Morocco and Tunisia.52
Australia is the only country that has successfully eradicated fire blight. In 1997, symptoms were observed on Cotoneaster in the Royal Botanic Gardens in Melbourne and diagnostic tests confirmed the causal agent as E. amylovora.59 An intensive eradication programme was undertaken, and national surveys conducted for three years following the detection of the pathogen have confirmed the absence of the disease in all Australian states.60
Long-distance spread of E. amylovora is through the movement of budwood or infected plant material. Local spread of the disease is due to the exudates produced by infected trees, which are easily transported by birds, insects, wind or rain. Fruit is not considered a means of introducing the pathogen into a new area or country.61 Erwinia amylovora has been shown to survive and to be transmitted by the Mediterranean fruit fly (Ceratitis capitata)62 and other insects. Honeybees (Apis spp.) visiting infected flowers are responsible for inter-flower transmission during bloom63. Pollen from plants such as hawthorn64 and apple54 have been reported to harbour E. amylovora cells.
Threat to the South African pome fruit industry
In 1975, Erskine65 recognised the threat posed by fire blight and described how the introduction of the pathogen into South Africa could be prevented. His recommendations included imposing strict quarantine regulations on the importation of nursery stock. In a study on the potential invasion risk levels of fire blight into apple orchards worldwide, South Africa was found to be highly suitable based on climate suitability models.66
Management
The most effective method of keeping fire blight out of South Africa is to impose or keep imposing strict phytosanitary measures on the importation of apple and pear scions and seedlings. If fire blight appears, management options are limited, and an eradication campaign should immediately be implemented. Surveys and continuous monitoring in areas at high risk must take place.
Diseases caused by Xylella fastidiosa
Xylella fastidiosa, the cause of olive quick decline syndrome, Pierce’s disease of grapevine, almond, coffee and oleander leaf scorch, citrus variegated chlorosis and diseases on other nut and shade trees, is considered to be one of the most dangerous plant pathogens in the world. Its emergence in Europe has resulted in substantial economic losses. Its presence in the olive groves of Apulia, Italy in 2013, for example, caused a socio-economic disaster.67 About 40% of the citrus trees growing in Brazil are affected by citrus variegated chlorosis, and annual losses can be as high as USD120 million.68
Pathogen
Xyllela fastidiosa is a xylem-limited Gammaproteobacterium in the family Xanthomonadaceae. Four distinct subspecies have been described: (1) X. fastidiosa subsp. pauca, causing olive quick decline syndrome, citrus variegated chlorosis and coffee leaf scorch, (2) X. fastidiosa subsp. fastidiosa causing Pierce's disease of grapevine, (3) X. fastidiosa subsp. multiplex causing almond leaf scorch and other diseases on nut and shade trees and (4) X. fastidiosa subsp. sandyi causing oleander leaf scorch.69 Some subspecies appear to be host specific while others can infect several plant hosts.70 Xyllela fastidiosa can engage in interstrain recombination, and this can result in new strains with host ranges different from the parent strains.71
Vectors
Two xylem-sap feeding insects are able to vector X. fastidiosa: the sharpshooter leafhoppers (Cicadellidae, subfamily Cicadellinae) and spittlebugs (Cercopoidea, families Aphrophoridae, Ceropidae and Clastopteridae).72 The pathogen is persistent but non-circulative in non-moulting adult insect vectors and is propagated within vectors, which allows them to transmit the bacterium for months after acquisition
from an infected plant.73 There is no vector–bacterial strain specificity.74 The natural dispersal of the pathogen is by the insect vectors only.
Hosts
Xyllela fastidiosa can infect both dicotyledonous and monocotyledonous plants. These include economically important agricultural and ornamental plants.70 The pathogen can also establish non-symptomatic associations with many plants as a commensal endophyte.70 The list of plants associated with this pathogen includes more than 350 species.
Symptoms
Symptoms caused by X. fastidiosa are highly variable and depend on the host plant, bacterial strain and environmental conditions, which include the growing conditions of the plant and its phenological state.75 The most common symptoms are marginal necrosis and scorching of leaves, leaf wilt, premature defoliation and tree decline, which includes stunting of shoots and twigs.75
Distribution and means of movement between countries
Xylella fastidiosa occurs over a wide range of climatic zones. Until the 2010s, the pathogen was only known to occur in the Americas. It first appeared in southern Italy in 2013 in olive trees76, thereafter spreading to other parts of Italy, France, Spain and Portugal. It is known to occur in Iran, Israel, Lebanon and Taiwan.
Xyllella fastidiosa is unable to spread by contact, air diffusion, or by seed, except pecan.77 Natural spread is by the insect vector, which can be transported by wind over long distances. The pathogen is also spread by trade and movement of infected plants, and this is an important risk factor for local and global spread.
Threat to the South African olive and other fruit industries
If any one of the diseases caused by X. fastidiosa should occur in South Africa, it is highly unlikely that successful eradication would be possible. Thus far, no eradication efforts have been successful in any part of the world where new incursions have occurred. This is due to several factors, including the long latent period (1–10 months, depending on the host), and an extremely broad host range.78 Climate change prediction models have suggested that the severity of Pierce's disease of grapevine might switch from low/moderate to high in some of the most economically important grapevine growing regions of the world, including South Africa.79
Management
Once plants are infected with X. fastidiosa, there is no effective treatment. Current options to minimise spread include removal of infected plants, severe pruning and control of the insect vectors with insecticides. Suppressing pathogen populations and reducing transmission of the vectors is currently the only option.
Measures to prevent the entry of quarantine pathogens into South Africa
Phytosanitary regulations, including disease-free certification schemes, are in place to prevent the entry of contaminated seed, propagative material (cuttings and rooted seedlings/cuttings), tubers, rhizomes, bulbs and scions into South Africa. These measures have thus far prevented the entry of all four bacterial pathogens, but continuous monitoring of potential hosts needs to be enforced. Those pathogens vectored by insects are more difficult to regulate. Both CLas and X. fastidiosa can potentially enter the country with their vectors by crossing our borders unimpeded. Again, monitoring their hosts for possible signs of either the vector and/or pathogens is essential, especially in bordering neighbouring countries.
Eradication strategies necessary for the prevention of establishment of quarantine pathogens
Eradication of quarantine or exotic plant pathogens involves the removal of all infected plant material in a specific area. This would include the
destruction of large numbers of infected plants and those deemed to be at risk, including alternative hosts within quarantine zones. This process can cause both economic and social conflict, as was observed with olive quick decline syndrome in Italy.70 Quarantine restrictions are enforced, which includes prohibitions on planting susceptible hosts, movement of host material, equipment, soil and produce. There is a loss of market access which can cost a specific industry millions of rands. Guidelines for managing these incursions are set out in the South African Emergency Plant Pest Response Plan.80 The plan aims to offer an “effective rapid response to the detection, identification and mitigation of an emergency plant pest incursion in South Africa”.
Eradication campaigns face numerous challenges, which is why many are unsuccessful. These challenges can include incomplete eradication of the pathogen due to hidden foci of infection, and natural re-invasions and re-introduction by short- or long-distance movement of infected material from contaminated areas. The time between introduction and identification of the causal agent and/or vector can also allow inoculum to accumulate to a point at which eradication or even containment is impossible. However, despite these challenges, campaigns to eradicate fire blight and citrus canker in Australia and citrus canker in South Africa have been successful.
Conclusion
Quarantine bacterial fruit tree pathogens are a significant threat to plant biosecurity in South Africa, with potentially devastating consequences for agriculture, trade and the environment. Addressing this threat requires a comprehensive approach that includes improved surveillance, diagnostics, quarantine measures, research and education. By strengthening plant biosecurity measures, South Africa can protect its agricultural sector, safeguard biodiversity and ensure the continued prosperity of its farming communities.
Data availability
There are no data pertaining to this article.
Declarations
I am an Associate Editor of the South African Journal of Science. I have no AI or LLM use to declare.
References
1. Santini A, Liebhold A, Migliorini D, Woodward S. Tracing the role of human civilization in the globalization of plant pathogens. ISME J. 2018;12:647–652. https://doi.org/10.1038/s41396-017-0013-9
2. Lahlali R, Mohammed T, Laasli SE, Gachara G, Ezzouggari R, Belabess R, et al. Effects of climate change on plant pathogens and host-pathogen interactions. Crop Environ. 2024;3(3):159–170. https://doi.org/10.1016/j.c rope.2024.05.003
3. World Trade Organization (WTO). The WTO agreement on the application of sanitary and phytosanitary measures (SPS Agreement) [webpage on the Internet]. No date [cited 2024 Oct 11]. Available from: https://www.wto.org/ english/tratop_e/sps_e/spsagr_e.htm
4. Food and Agriculture Organization of the United Nations. International Plant Protection Convention [webpage on the Internet]. No date [cited 2024 Oct 11]. Available from: https://www.ippc.int/en/
5. European and Mediterranean Plant Protection Organization (EPPO). EPPO activities on plant quarantine [webpage on the Internet]. No date [cited 2025 Jul 01]. Available from: https://www.eppo.int/ACTIVITIES/quarantine_activities
6. Msiska KK. Plant pest introductions and their spread: Call for action or just watch? An African perspective. EPPO Bulletin. 2019;49:301–305. https://do i.org/10.1111/epp.12586
7. South African National Agricultural Marketing Council (NAMC). South African fruit tree flow no. 47. Pretoria: NAMC; 2022. Available from: https://www.n amc.co.za/wp-content/uploads/2022/12/SA-Fruit-Flow-Report-Issue-47-Se pt-2022-Final.pdf
8. SAOlive. Olive and olive oil factsheet [document on the Internet]. c2022 [cited 2024 Oct 11]. Available from: https://www.saolive.co.za/wp-content/uploads /2022/02/SA-Olive-Factsheet.pdf
9. Graham J, Gottwald T, Setamou M. Status of Huanglongbing (HLB) outbreaks in Florida, California and Texas. Trop Plant Pathol. 2020;45:265–278. https:/ /doi.org/10.1007/s40858-020-00335-y
10. Lallemand J, Fos A, Bové JM. Transmission de la bacteria associé á la formeafricaine do la maladie du “greening” par le psylleasiatique Diaphorina citri Kuwauama [Transmission of the bacteria associated with the African form of greening disease by the Asian psyllid Diaphorina citri Kuwauama]. Fruits. 1986;41:341–343.
11. Cen Y, Zhang LP, Xia YH, Guo J, Deng X, Zhou W, et al. Detection of ‘Candidatus Liberobacter asiaticus’ in Cacopsylla (Psylla) citrisuga (Hemiptera: Psyllidae). Fla Entomol. 2012;95:304–311. https://doi.org/10.1653/024.095.0210
12. Donovan NJ, Beattie GA, Chambers GA, Holford P, Engelzou A, Hardy S, et al. First report of ‘Candidatus Liberobacter asiaticus’ in Diaphorina communis. Australas Plant Dis Notes. 2012;7:1–4. https://doi.org/10.1007/s13314-011-0031-9
13. Hussain M, Bano S, Qasim M, Gao J, Arthurs SP, Wang L, et al. Association between temperature and reproductive fitness of Diaphorina citri infected with Candidatus Liberibacter asiaticus. Agronomy. 2022;12, Art. #815. https://do i.org/10.3390/agronomy12040815
14. Wu F, Huang J, Xu M, Fox EGP, Andrew G, Beattie C, et al. Host and environmental factors influencing ‘ Candidatus Liberibacter asiaticus’ acquisition in Diaphorina citri . Pest Manage Sci. 2018;74:2738–2746. https://doi.org/10.1002/ps.5060
15. Lopes SA, Luiz DQBF, Martins EC, Fassini CG, Sousa MC, Barabosa JC, et al. ‘Candidatus Liberobacter asiaticus’ tiers in citrus and acquisition rates by Diaphorina citri are decreased by higher temperatures. Plant Dis. 2013;97: 1563–1570. https://doi.org/10.1094/PDIS-11-12-1031-RE
16. Hung TH, Hung SC, Chen CN, Hsu MS, Su HJ. Detection by PCR of ‘Candidatus Liberobacter asiaticus’, the bacterium causing citrus Huanglongbing in vector psyllids: Application to the study of vector-pathogen relationships. Plant Pathol. 2004;53:96–102. https://doi.org/10.1111/j.1365-3059.2004.00948.x
17. Lin SJ, Ke YF, Tao CC. [Bionomics observation and integrated control of citrus psylla, Diaphorina citri Kuwayama]. J Hortic Soc China. 1973;19:234–242. Chinese.
18. Halbert SE, Manjunath KL. Asian citrus psyllids (Sternorrhyncha: Psyllidae) and greening disease of citrus: A literature review and assessment of risk in Florida. Fla Entomol. 2004;87:330–353. https://doi.org/10.1653/0015-4040 (2004)087[0330:ACPSPA]2.0.CO;2
19. Folimonova SY, Robertson CJ, Garnsey SM, Gowda S, Dawson WO. Examination of the responses of different genotypes of citrus to Huanglongbing (citrus greening) under different conditions. Phytopathology. 2009;99:1346–1354. https://doi.org/10.1094/PHYTO-99-12-1346
20. Da Graça JV, Douhan GW, Halbert SE, Keremane ML, Lee RF, Vidalakis G, et al. Huanglongbing: An overview of a complex pathosystem ravaging the world’s citrus. J Integr Plant Biol. 2016;58:373–387. https://doi.org/10.1111/jipb.12437
21. Alves GR, Dini A, Parra J. Biology of the Huanglongbing vector Diaphorina citri (Hemiptera: Liviidae) on different host plants. J Econ Entomol. 2014; 107:691–696. https://doi.org/10.1603/ec13339
22. Cifuentes-Arenas JC, Beattie GAC, Peňa L, Lopes SA. Murraya paniculata and Swinglea glutinosa as short-term transient hosts of ‘Candidatus Liberibacter asiaticus’ and implications for the spread of Huanglongbing. Phytopathology. 2019;109:2064–2073. https://doi.org/10.1094/PHYTO-06-19-0216-R
23. NEMBA Invasive Species Lists [webpage on the Internet]. Pretoria: National Invasive Species Advocacy Programme; 2021 [cited 2024 Oct 23]. Available from: https://invasives.org.za/nemba-alien-and-invasive-species-regulationsand-lists/
24. Garnier M, Bové JM. Transmission of the organism associated with citrus greening disease from sweet orange to periwinkle by dodder. Phytopathology. 1983;73:1358–1363. https://doi.org/10.1094/Phyto-73-1358
25. Duan YP, Gottwald T, Zhou LJ, Gabriel DW. First report of dodder transmission of ‘Candidatus Liberobacter asiaticus’ to tomato (Lycopersicon esculentum). Plant Dis. 2008;92:831. https://doi.org/10.1094/PDIS-92-5-0831C
26. Fan G-C, Cai ZJ, Weng QY, Ke C, Liu B, Zhou LJ, et al. First report of a new host (Pithecellobium lucidum Benth) of the citrus Huanglongbing bacterium, Candidatus Liberobacter asiaticus. In: Burns JK, Graham JH, Gottwald TR, editors. 2nd International Conference on Huanglongbing; 2011 January 10–14; Orlando, Florida, USA. St. Paul, MN: Plant Management Network; 2011. p. 137.
27. Bové JM. Huanglongbing: A destructive, newly-emerging, century-old disease of citrus. J Plant Pathol. 2006;88:7–37.
28. Wang N, Trivedi P. Citrus Huanglongbing: A newly relevant disease presents unprecedented challenges. Phytopathology. 2013;103:652–665. https://doi. org/10.1094/PHYTO-12-12-0331-RVW
29. European and Mediterranean Plant Protection Organization (EPPO). ‘Candidatus Liberibacter asiaticus’ [webpage on the Internet]. c2024 [cited 2024 Oct 03]. Available from: https://gd.eppo.int/taxon/LIBEAS
30. Fourie P, Kirkman W, Carstens E, Hattingh V. What can we do to prevent HLB?. In: Proceedings of the12th CRI Citrus Research Symposium; 2024 August 18–21; Central Drakensberg, South Africa. Nelspruit: Citrus Research International; 2024.
31. Lewis-Rosemblum H, Martini X, Tiwari S, Stelinski LL. Seasonal movement patterns and long-range dispersal of Asian citrus psyllid in Florida citrus. J Econ Entomol. 2015;108:3–10. https://doi.org/10.1093/jee/tou008
32. Hilf ME. Colonization of citrus seed coats by ‘Candidatus Liberobacter asiaticus’: Implications for seed transmission of the bacterium. Phytopathology. 2011;101:1242–1250. https://doi.org/10.1094/PHYTO-11-10-0323
33. South African action plan for Huanglongbing and Asian citrus psyllid –preparedness, early detection and rapid response [document on the Internet]. c2019 [cited 2024 Nov 18]. Available from: https://www.citrusre s.com/wp-content/uploads/2023/11/Action-Plan-for-HLBACP-v1.6_March2023.pdf
34. Kirkman W, Carstens E, Fourie P, Hattingh V. Status of Asian citrus greening (Huanglongbing, HLB) and its primary vector, the Asian citrus psyllid (ACP). In: Proceedings of the 12th CRI Citrus Research Symposium; 2024 August 18–21; Central Drakensberg, South Africa. Nelspruit: Citrus Research International; 2024.
35. Ajene IJ, Khamis F, van Asch B, Pietersen G, Rasowo BA, Ekesi S, et al. Habitat suitability and distribution potential of Liberibacter species (“Candidatus Liberibacter asiaticus” and “Candidatus Liberibacter africanus”) associated with citrus greening disease. Divers Distrib. 2020;26:575–588. https://doi.o rg/10.1111/ddi.13051
36. Aidoo OF, Souza PGC, da Silva RS, Santana PA Jr, Picanço MC, Kyerematen R, et al. Climate-induced range shifts of invasive species (Diaphorina citri Kuwayama). Pest Manag Sci. 2022;78:2534–2549. https://doi.org/10.100 02/ps6886
37. Bassanezi RB, Lopes SA, de Miranda MP, Wulff NA, Volpe HXL, Ayres AJ. Overview of citrus Huanglongbing spread and management strategies in Brazil. Trop Plant Pathol. 2020;45:251–264. https://doi.org/10.1007/s4085 8-020-00343-y
38. Gottwald TR, Graham JH, Schubert TS. Citrus canker: The pathogen and its impact. Plant Health Prog. 2002;3:1. https://doi.org/10.1094/PHP-2002-08 12-01-RV
39. Licciardello G, Caruso P, Bella P, Boyer C, Smith MW, Provost O, et al. Pathotyping citrus ornamental relatives with Xanthomonas citri pv. citri and X. citri pv. aurantifolii refines our understanding of their susceptibility to these pathogens. Microorganisms. 2022;10, Art. #986. https://doi.org/10.3390/ microorganisms10050986
40. Shahbaz E, Ali M, Shafiq M, Atiq M, Hussain M, Balal RM, et al. Citrus canker pathogen, its mechanism of infection, eradication, and impacts. Plants. 2023;12, Art. #123. https://doi.org/10.3390/plants12010123
41. Gabriel D, Gottwald TR, Lopes SA, Wulff NA. Bacterial pathogens of citrus: Citrus canker, citrus variegated chlorosis and Huanglongbing. In: Talon M, Caruso M, Gmitter FG, editors. The genus citrus. Sawston: Woodhead Publishing; 2020. p. 371–389. https://doi.org/10.1016/B978-0-12-81216 3-4.00018-8
42. Christiano RSC, Dalla Pria M, Jesus WC, Para JRP, Amorim L, Bergamin Filho A. Efffect of citrus leafminor damage, mechanical damage and inoculum concentration on severity of symptoms of Asiatic citrus canker in Tahiti lime. Crop Prot. 2007;26:59–65. https://doi.org/10.1016/j.cropro.2006.03.016
43. Koizuma M. Citrus canker: World situation. In: Timmer LW, editor. Citrus canker: An international perspective. Gainesville, FL: Institute of Food and Agricultural Science, University of Florida; 1985. p. 2–7.
44. Doidge EM. The origin and cause of citrus canker in South Africa. Union Dept Agric Sci Bull. 1916;8:20.
45. Doidge EM, Thel D. The successful eradication of citrus canker in South Africa. Farm SA. 1938;13:400.
47. de Carvalho MC. Pests and diseases of citrus fruits and treatments recommended in Sofala and Tete. Gazeta do Agricultor. 1974;26:162–191.
48. Behlau F. An overview of citrus canker in Brazil. Trop Plant Pathol. 2021;46:1–12. https://doi.org/10.1007/s40858-020-00377-2
49. Gottwald TR, Hughes G, Graham JH, Sun X, Riley T. The citrus canker epidemic in Florida: The scientific basis for regulatory eradication policy for an invasive species. Phytopathology. 2001;91:30–34. https://doi.org/10.10 94/PHYTO.2001.91.1.30
50. Momol MT, Aldwinckle HS. Genetic diversity and host range of Erwinia amylovora. In: Venneste JL, editor. The disease and its causative agent, Erwinia amylovora. Wallingford: CABI; 2000. p. 55–72. https://doi.org/10.10 79/9780851992945.0055
51. Pedroncelli A, Puopolo G. This tree is on fire: A review on the ecology of Erwinia amylovora, the causal agent of fire blight disease. J Plant Pathol. 2023;106:823–827. https://doi.org/10.1007/s42161-023-01397-y
52. Venneste J. Erwinia amylovora (fireblight) [webpage on the internet]. In: CABI Compendium. Wallingford: CABI; 2008. https://doi.org/10.1079/cabicompe ndium.21908
53. Weiβhaupt S, Köhl S, Hinze M, Ernst M, Schmid A, Voegele RT. Alternative inoculum sources for fire blight: The potential role of fruit mummies and nonhost plants. Plant Pathol. 2016;65:480–483. https://doi.org/10.1111/ppa.1 2431
54. Eastgate JA. Erwinia amylovora: The molecular basis of fireblight disease. Mol Plant Pathol. 2000;1:325–329. https://doi.org/10.1046/j.1364-3703.20 00.00044.x
55. De la Peňa-Baca DA, Romo-Chacón A, Rios-Velasco C, Olivas-Orozco GI, de Jesús Orselas-Paz J, Acosta-Muňiz CH. Primary inoculum of Erwinia amylovora: Alternative sources and viable but non-culturable state: A review. J Plant Dis Prot. 2023;130:143–155. https://doi.org/10.1007/s41348-022-0 0674-9
56. Zeng Q, Pulawska J, Schachterie J. Early events in fire blight detection and pathogenesis of Erwinia amylovora. J Plant Pathol. 2021;103(suppl 1):513–524. https://doi.org/10.1007/s42161-20-00675-3
57. Santander RD, Biosca EG. Erwinia amylovora psychrotrophic adaptations: Evidence of pathogenic potential and survival at temperate and low environmental temperatures. PeerJ. 2017;5, e3931. https://doi.org/10.7 717/peerj.3931
58. Santander RD, Oliver JD, Biosca EG. Cellular, physiological, and molecular adaptive responses of Erwinia amylovora to starvation. FEMS Microbiol Ecol. 2014;88:258–271. https://doi.org/10.1111/1574-6941.12290
59. Rodoni BC, Kinsella M, Gardner R, Gillings M, Geider K. Detection of Erwinia amylovora, the causal agent of fire blight, in the Royal Botanic Gardens, Melbourne, Australia. Acta Hortic. 1999;489:169–170. https://doi.org/10.1 7660/ActaHortic.1999.489.25
60. Rodoni BC, Gardner R, Giles R, Cole M, Wimalajeewa S, van der Zwet T. National surveys did not detect Erwinia amylovora on host plants in Australia. Acta Hortic. 2002;704:55–61. https://doi.org/10.17660/ActaHortic.2002.590.3
61. Roberts RG, Hale CN, van der Zwet T, Miller CE, Redlin SC. The potential for spread of Erwinia amylovora and fire blight via commercial apple fruit: A critical review and risk assessment. Crop Prot. 1998;17:19–28. https://doi.o rg/10.1016/S0261-2194(98)80008-2
62. Ordax M, Piquer-Salcedo JE, Santander RD, Sabater-Muñoz B, Biosca EG, López MM, et al. Medfly Ceratitis capitata as potential vector for fire blight pathogen Erwinia amylovora: Survival and transmission. PLoS One. 2015;10, e0127560. https://doi.org/10.1371/journal.pone.0127560
63. Parker KG. Fire blight: Overwintering, dissemination and control of the pathogen. New York Agric Exp Stn Mem. 1936:193.
64. Wilson M, Sigee DC, Epton HAS. Erwinia amylovora infection of hawthorn blossom. I: The anther. J Phytopathol. 1989;127:1–14. https://doi.org/10.11 11/j.1439-0434.1989.tb04499.x
https://doi.org/10.17159/sajs.2025/20644
65. Erskine JM. Preventing the entry of dangerous plant diseases into South Africa – the fire blight threat. S Afr J Sci. 1975;71:265–269.
66. Vieira RDA, Ramos ZRS, da Silva RS, Ebel J, de Borba PTD. Potential risk levels of invasive fire blight in apple orchards around the world. J Agric Sci. 2020;12:17–31. https://doi.org/10.5539/jas.v12n11p17
67. Saponari M , Giampetruzzi A, Loconsole G, Boscia D, Saldarelli P. Xylella fastidiosa in olive in Apulia: Where we stand. Phytopathology. 2019;109:175–186. https://doi.org/10.1094/PHYTO-08-18-0319-FI
68. Bové JM. Huanglongbing and the future of citrus in São Paulo State, Brazil. J Plant Pathol. 2012;94:465–467.
69. Schuenzel EL, Scally M, Stouthamer R, Nunney L. A multigene phylogenetic study of clonal diversity and divergence in North American strains of the pathogen, Xyllela fastidiosa. Appl Environ Microbiol. 2005;71:3832–3839. https://doi.org/10.1128/AEM.71.7.3832-3839.2005
70. Rapicavoli J, Ingel B, Blanco-Ulate B, Cantu D, Roper C. Xylella fastidiosa: An examination of a re-emerging plant pathogen. Mol Plant Pathol. 2018; 19:786–800.
71. Nunney L, Vickerman DB, Bromley RE, Russell SA, Hartman JR, Morano LD, et al. Recent evolutionary radiation and host plant specialization in the Xylella fastidiosa subspecies native to the United States. Appl Environ Microbiol. 2013;79: 2189–2200. https://doi.org/10.1128/AEM.0308-12
72. Severn HHP. Spittle-insect vectors of Pierce’s disease virus. II: Life history and virus transmission. Hilgardia. 1950;19:357–382.
73. Hill BL, Purcell AH. Acquisition and retention of Xylella fastidiosa by an efficient vector, Graphocephala atropunctata. Phytopathology. 1995;85:209–212. https://doi.org/10.1094/PHYTO-85-209
74. Damsteegt VD, Brlansky RH, Phillips PA, Roy A. Transmission of Xylella fastidiosa, causal agent of citrus variegated chlorosis, by the glassy-winged sharpshooter, Homalodisca coagulata. Plant Dis. 2006;90:567–570. https:// doi.org/10.1094/PD-90-0567
75. European and Mediterranean Plant Protection Organization (EPPO). Xylella fastidiosa. In: EPPO Global database [database on the Internet]. c2002 [cited 2024 Oct 03]. Available from: https://gd.eppo.int/taxon/XYLEFA
76. Saponari M, Boscia D, Nigro F, Martelli GP. Identification of DNA sequences related to Xylella fastidiosa in oleander, almond and olive trees exhibiting leaf scorch symptoms in Apulla (Southern Italy). J Plant Pathol. 2013;95, Art. #668. https://doi.org/10.4454/JPP.V9513.035
77. Cervantes K, Hilton AE, Stamler RA, Heerema RJ, Bock C, Wang X, et al. Evidence for seed transmission of Xylella fastidiosa in pecan (Carya illinoinensis). Front Plant Sci. 2022;13, Art. #780335. https://doi.org/ 10.3389/fpls.2022.780335
79. Godefroid M, Cruaud A, Streito J-C, Rasplus J-Y, Rossi J-P. Forecasting future range shifts of Xylella fastidiosa under climate change. Plant Pathol. 2022;71(9):1839–1848. https://doi.org/10.1111/ppa.13637
80. South African Department of Agriculture, Land Reform and Rural Development (DALRRD). The South African Emergency Plant Pest Response Plan. Pretoria: DALRRD; 2013. Available from: https://www.nda.gov.za/images/Branches/A gricProducHealthFoodSafety/PlantProductionHealth/PlantHealth/Early-Warni ng-Systems/SA-Emergency-Plant-Pest-Response-Plan/The%20South%20Af rican%20Emergency%20Plant%20Pest%20Response%20Plan.pdf
https://doi.org/10.17159/sajs.2025/20644
AuTHORS:
Zusiphe Mbelebele1
Lelethu Mdoda1
Samuel S. Ntlanga1 Nyarai Mujuru2
Yanga Nontu3
AFFILIATIONS:
1Discipline of Agricultural Economics, University of KwaZulu-Natal, Pietermaritzburg, South Africa
2Department of Agricultural Economics and Extension, University of Fort Hare, Alice, South Africa
3Department of Agriculture, University of Zululand, KwaDlangezwa, South Africa
CORRESPONDENCE TO: Lelethu Mdoda
EMAIL:
MdodaL@ukzn.ac.za
DATES:
Received: 24 July 2024
Revised: 20 May 2025
Accepted: 21 May 2025
Published: 29 Sep. 2025
HOW TO CITE:
Mbelebele Z, Mdoda L, Ntlanga SS, Mujuru N, Nontu Y. Medicinal plant cultivation and smallholder welfare in Amatole, South Africa: A propensity score analysis. S Afr J Sci. 2025;121(9/10), Art. #18738. https://doi.org/10.17159/sajs. 2025/18738
ARTICLE INCLuDES:
☒ Peer review
☐ Supplementary material
DATA AVAILAbILITY:
☐ Open data set
☐ All data included
☒ On request from author(s)
☐ Not available
☐ Not applicable
EDITORS: Teresa Coutinho Lindah Muzangwa
KEYWORDS: medicinal plants, smallholder farmers, household welfare, Amatole District Municipality
FuNDING: South African National Research Foundation
Medicinal plant cultivation and smallholder welfare in Amatole, South Africa: A propensity score analysis
The sustainable use of medicinal plants by smallholder farmers in the Amatole District Municipality in the Eastern Cape Province, South Africa, plays a vital role in rural livelihoods. Despite challenges such as limited inputs, capital, institutional support and market access, the cultivation of medicinal plants significantly contributes to smallholder welfare. However, research valuing this production remains limited. We therefore assessed the welfare effects of smallholder participation in medicinal plant cultivation in Amatole. Primary data were collected from 150 smallholder farmers using structured questionnaires and a multi-stage stratified sampling technique. Descriptive statistics, binary logistic regression and propensity score matching were used for analysis. Findings indicate that female farmers dominate medicinal plant production, with an average age of 44 and 10 years of schooling. The average household size was six, with family labour supporting production. The average farm size was 1 hectare. Extension services played a key role in improving farmers’ knowledge. Participation was profitable, with an average monthly household income of ZAR19 091.72 and a return on investment of 0.71. Binary logistic regression showed that gender, household size, experience, extension visits and environmental protection positively influenced participation, while age and education had negative effects. Propensity score matching results revealed a significant positive impact of cultivation on farmers’ welfare, with an increase of ZAR5624.64 in farm returns at the 5% significance level. To enhance outcomes, we recommend targeted policies that improve funding, extension services and support for female and experienced farmers. Scaling up medicinal plant cultivation can improve rural livelihoods and advance sustainable development in the Amatole District Municipality.
Significance:
This study highlights the crucial role of female farmers in medicinal plant cultivation, with most participants being women, with an average age of 44 years and over 10 years of schooling. Their involvement aligns with traditional caregiving roles and household health responsibilities. A binary logistic regression shows that household size and farming experience positively influenced participation, while higher education had a negative effect on participation. Using propensity score matching, we found that cultivation significantly improved household welfare. These results support the promotion of inclusive, gender-sensitive policies to strengthen medicinal plant value chains and enhance the livelihoods of rural smallholder farmers.
Introduction
Medicinal plants are internationally acknowledged and valued components of health supplements and medications.1 2 In developing countries, raw medicinal plants are more easily accessible in rural areas than in urban areas; they often reach urban areas through rural smallholder farmers in pursuit of markets.3 4 Omotilewa et al.5 acknowledged the involvement of smallholder farmers in poverty reduction and the eradication of hunger in Africa through the production of medicinal plants. Smallholder farms are precisely small farms that are alleged to have a household-intensified technical labour force to maximise production while minimising costs. In sub-Saharan Africa, smallholder farmers produce on land smaller than 2 ha, often characterised by their adoption of local methods, using native skills and experiences that are passed down for generations.6 South African smallholder farmers often live in rural settlements, which are regions that are richly endowed with fauna and flora. Medicinal plants form part of this biodiversity that surrounds these settlements and have been harvested extensively by the smallholder community as a traditional medicine for domestic use or as a product to sell.7-9
For centuries, rural communities have relied on medicinal plants as a primary source of natural healing, deeply embedding these plants within local healthcare practices. According to Umeta Chali et al.10, smallholder farmers in rural areas are the principal custodians of Indigenous knowledge related to medicinal plants, playing a key role in preserving these resources as part of their cultural heritage. The cultivation of medicinal plants not only aids in the conservation of biodiversity but also provides smallholder farmers with opportunities to generate additional income.11 In low-resource settings, where access to modern health care may be limited or prohibitively expensive, medicinal plants remain particularly significant. They serve as essential remedies for a wide range of ailments and contribute to reducing dependency on costly pharmaceutical drugs. Most notably, smallholder subsistence farmers who cultivate these plants within their local ecosystems, are central to sustaining this practice. Their efforts bridge the gap between agriculture and traditional medicine, reinforcing both economic resilience and community health. Thus, medicinal plant cultivation stands at the confluence of ecological conservation, rural health care and livelihood enhancement.12 13
Understanding the impact of medicinal plant cultivation on household welfare is critically important for several reasons. From an economic standpoint, growing medicinal plants provides smallholder farmers with a valuable
means of income diversification, helping to reduce income volatility and strengthen household financial stability.14 Furthermore, the expansion of medicinal plant production generates local employment opportunities, thereby fostering broader socio-economic development within rural communities. According to Petelka et al.15, the income derived from medicinal herbs enables households to afford essential needs such as health care, food and education, thus ultimately contributing to an improved standard of living. In addition to its economic and social benefits, the cultivation of medicinal plants plays a vital role in biodiversity conservation.3 Smallholder farmers often possess deep, context-specific knowledge of native plant species and their ecological requirements. By cultivating these plants, they contribute to the preservation of local flora and the safeguarding of genetic diversity. Moreover, sustainable medicinal plant farming practices have environmental benefits, including enhanced soil quality and reduced ecological degradation.16-18 These contributions align with broader goals of ecological sustainability and support the creation of healthier, more resilient rural ecosystems.
Nevertheless, planting medicinal plants is not an easy venture. Smallholder farmers encounter several difficulties, such as limited inputs, lack of technical expertise and poor market accessibility. They could also face the problem of excessive harvesting and destruction of local ecosystems.12 In addition to these challenges, the unregulated nature of, as well as quality control within, the medicinal plant market expose smallholder farmers to market risks, which affect their income stability. Therefore, it is important to investigate these challenges so that appropriate interventions can be put in place for smallholder farmers who are striving to develop income streams from medicinal plants.
Hence, we sought to assess the effect of merchandising these curative plants as a trade commodity on the welfare of smallholder farmers. There is a lack of evidence in the literature on the impact of utilising medicinal plants for profit on livelihood enhancement. Because the industry is unregulated, data on the employment rate, income generated and measures of available resources in the wild, are inconclusive. Therefore, the aim of this study was to supplement the prevailing literature and investigate the effects of the production of medicinal plants on household welfare.
Methodology
Conceptual framework for medicinal plant production involvement
Figure 1 illustrates the interlinkage of the factors that affect the production and sustainable use of medicinal plants by smallholder farmers. These factors signify a pivotal contribution to the outcomes (farm returns) that arise from the association of smallholder farmers in the production or wild harvesting of medicinal plants. These plants often play a pivotal role
as remedial agents in the societies where smallholder farmers live. The contribution of smallholder farmers to the production and sustainable use of medicinal plants is highly influenced by socio-economic and institutional factors, market dynamics and information availability.
Figure 1 begins by illustrating the key challenges faced by smallholder farmers in the cultivation and utilisation of medicinal plants. Many of the factors identified are general determinants that commonly influence smallholder farmers’ participation in various agricultural activities, but their impact is uniquely pronounced or shaped by the context of medicinal plant production. These challenges significantly hinder progress in the development and livelihood improvement of these farmers. Critical issues such as limited access to land, inadequate agricultural knowledge (both indigenous and technical), market dynamics, information availability, and poor access to market information serve as major barriers to the effective production and sustainable extraction of medicinal plants from the wild. Such constraints make it particularly difficult for smallholder farmers to domesticate and commercialise high-value medicinal species such as (Agathosma betulina (buchu), Aloe ferox (Cape aloe), Artemisia afra (African wormwood), Sutherlandia frutescens (cancer bush), Pelargonium sidoides (African geranium), Sceletium tortuosum (kanna) and Sclerocarya birrea (marula). The lack of resources for essential operational activities, including harvesting and marketing, further exacerbates the problem. When these challenges are clearly defined and persist within the communities in which smallholder farmers operate, they generate adverse externalities that weaken the positive effects of medicinal plant production on household welfare. As a result, benefits such as improved health care, increased income, and better living standards are undermined due to the unavailability of the necessary support systems and infrastructure. High-value medicinal plants hold immense potential to transform the livelihoods of smallholder farmers, given their strong market demand and international significance. Their integration into rural farming systems can bring substantial economic and social benefits. Therefore, it is imperative to implement effective conservation strategies aimed at protecting species diversity. Such measures will ensure that smallholder farmers can continue to benefit from medicinal plants in a sustainable and equitable manner. The cultivation of medicinal plants and the conservation of natural resources are closely interconnected. As smallholder farmers engage in cultivating medicinal plants, they reduce the pressure on wild plant populations, which are often overharvested and at risk of extinction. Cultivation provides a sustainable alternative that supports biodiversity by promoting the regeneration and protection of native species. Additionally, farmers who participate in medicinal plant production tend to develop a stronger appreciation for environmental stewardship, as the long-term viability of their crops depends on healthy ecosystems. Thus, medicinal plant cultivation not only enhances livelihoods but also contributes directly to the conservation of plant species and natural habitats.
Figure 1: Conceptual framework of smallholder production of medicinal plants.
Description of the study
The study was conducted in the Amatole District Municipality (ADM) of the Eastern Cape Province of South Africa (latitude: 32.55895; longitude: 27.45919). The district municipality is situated in the former Transkei region, with predominantly rural settlements and some periurban settlements.19 The majority of residents are involved in agriculture to maintain a basic livelihood. The study area is rich with natural resources across succulent grazing grasslands, forests, and marine life.20 The climate of the ADM is similar throughout most of the region, but differs in some areas depending on their distance to the ocean.21 The temperature fluctuates between the thresholds of 7 °C to 10 °C in the adequately dry and cool season, with a possibility of being snowy, and from 18 °C to 24 °C in the favourably humid season with hot weather. Adequate rainfall is expected in October and March, making them the rainiest months, and rainfall ranges from 750 mm to 1050 mm per annum.21,22 Figure 2 shows the study area.
The ADM is classified as a Category C2 Municipality that is made up of six local municipalities: Amahlathi, Great Kei, Mbashe, Mnquma, Ngqushwa and Raymond Mhlaba. The ADM is home to a population of approximately 1.7 million people whose racial distribution is 91% African, 3% coloured and 6% white23 24 and gender distribution is 52% female and 48% male24. The Amatole District Municipality Integrated Development Plan estimations suggest that 54% of the population survives below the poverty line and 66% make a living through social welfare grants because of high levels of unemployment.25
Data collection methods and sampling techniques
We used a quantitative research approach and an exploratory research design. We employed a cross-sectional design in which the data from smallholder medicinal plant farmers were obtained at a given point in time, and were careful not to repeat the targeted sample. This research design is suitable for a descriptive study and the determination of the connections among and between characteristics of each participant. The data were composed of numerous variables such as social demographics, the profitability of medicinal plants, challenges to adoption, production, and welfare. This approach is also cost-effective in terms of financial resources and very considerate of time.26 According to Sharma27, a sampling frame is defined as a list of units of the population from which the study sample will be drawn. The population of medicinal plants in the ADM was unknown, which is why we opted to use the Cochrane sample size formula to calculate the study sample size. The sampling frame for this study was unknown, as the medicinal plant farmers were not registered. Data about the performance level of the smallholder medicinal plant farmers was unknown. Hence, we used Cochrane’s proportion to sample size calculator to estimate the
sample size for the study. From the information collected, we identified the municipalities where medicinal plants are produced and the communities with an abundance of medicinal plant farmers. We depended on extension and advisory officers for assistance in finding medicinal plant farmers in the various communities of the ADM. The enumerators who were involved in the study were residents of the area.
A multi-stage sampling technique was employed to select participants for the study. A total of 150 smallholder farmers were carefully chosen to ensure the generation of credible and unbiased results. The multi-stage stratified sampling procedure employed in this research was designed to ensure that the sample accurately reflected the diversity of farming practices in the study area, with a particular focus on the cultivation of medicinal plants. This approach was structured in three stages to select a representative sample of smallholder farmers, ensuring that the study’s findings would be reliable, valid and free from bias. Stage 1 involved the purposive selection of study sites, wards and villages in the ADM. This was a critical step, as it ensured the inclusion of areas where smallholder farmers were actively involved in medicinal plant production. The second stage involved dividing farmers into three distinct strata based on their primary farming activities: Stratum A – farmers engaged in medicinal plant production, Stratum B – crop farmers and Stratum C – livestock farmers.
Stratification was used to ensure that the diversity of farming practices in the study area was adequately represented, and allowed a focus on medicinal plant production, the primary area of interest. The final stage involved randomly selecting 125 farmers from Stratum A (medicinal plant farmers) and 25 farmers from Stratum B (non-medicinal plant farmers). This step was essential for ensuring that the sample size met the study’s requirements while maintaining a representative distribution of participants. The random selection within each stratum minimised selection bias and allowed for a balanced comparison between medicinal and non-medicinal plant farmers. The random sampling method ensured that each farmer within the strata had an equal chance of being selected, providing a statistically sound basis for the findings and enhancing the generalisability of the results. The study’s sample size was 150 smallholder plant farmers. Cochran’s proportionate to size sampling methodology was used to determine the required sample size. The calculated sample size is shown in Equation 1: n1 = Z 2 p(1 p) e 2 = 1.95 × 0.5 × 0.5 (0.08) 2 = 150
Equation 1
where n is the required sample size; Z is the confidence level at 95% (standard value of 1.96); p is the estimate of smallholder medicinal plant farmers, which is at 0.89 (this was an assumption that 89% of smallholder
farmers participate in the production of indigenous medicinal plants in the study area); q is the weighting variable given by 1-p; e2 is the margin of error at 5% (standard value of 0.05). The study used 125 medicinal plant farmers as participants, and 25 were non-participants. The selection of 125 medicinal plant farmers and 25 non-medicinal plant farmers allowed the study to focus primarily on the group of interest (medicinal plant farmers) while still incorporating a comparison group of non-participants in medicinal plant production. This design enabled the research to offer a nuanced understanding of the factors affecting medicinal plant farming and provided a comprehensive view of the agricultural landscape in the region.
This study relied on primary data collected directly from smallholder farmers engaged in agricultural activities, with a particular focus on those cultivating medicinal plants. Data collection was conducted through a combination of self-administered questionnaires and face-to-face interviews with those who volunteered to participate. Interviews were carried out in locations where smallholder farmers involved in medicinal plant production were accessible, continuing until the target sample size of 150 respondents was achieved. A well-structured questionnaire served as the primary data collection instrument. To ensure clarity and cultural relevance, three trained enumerators (fluent Xhosa, the local language) were responsible for administering the questionnaire. Their ability to communicate effectively in the respondents’ native language enhanced understanding and accuracy in responses and contributed to more valid responses as farmers could express their views and experiences accurately in their own language. The enumerators were thoroughly trained in both the content of the questionnaire and effective data collection techniques. Training also emphasised ethical considerations, neutrality during interviews, and cultural sensitivity.
Prior to full deployment, the questionnaire was tested on 10% of the sample (15 farmers) to assess its reliability and ensure that the questions were clear, relevant and appropriate for the field conditions. The pilot test was to assess its clarity, consistency and relevance in the field. This pilot test helped identify ambiguous or confusing items, which were subsequently revised to improve the reliability and user-friendliness of the instrument. Feedback from the pilot test informed minor adjustments to improve the instrument’s effectiveness. Validity was established through the careful design of the questionnaire, which was developed based on relevant literature, expert consultation and alignment with the study objectives. The questionnaire was structured to capture all essential variables related to smallholder participation in medicinal plant production and its impact on household welfare, ensuring comprehensive and relevant data collection. The data collection period spanned from July to August 2023. The collected data were farmers’ demographic characteristics, type and use of medicinal plants they farmed, challenges they faced, factors affecting their participation in the production of medicinal plants, and the effect of participation in the production of medicinal plants on their household welfare. This timeline was strategically chosen to align with the agricultural calendar, ensuring the availability and responsiveness of participants. The combination of trained local enumerators, a well-tested questionnaire, and a structured approach to interviews contributed to the overall reliability and validity of the data collected. During data entry and cleaning, consistency checks were performed to identify and correct potential errors or outliers. This step ensured that the data set used for analysis was both accurate and reliable.
Empirical model specification
budgetary technique
We employed the gross margin method to estimate the profitability of medicinal plants cultivated by smallholder farmers in the ADM. Gross margin, defined as the difference between gross income and total variable costs, is widely recognised in agricultural economics for its simplicity and effectiveness in assessing enterprise feasibility, especially when comparing ventures with similar capital and labour inputs.28,29 This method has also been successfully applied by Thibane30 to evaluate the economic viability of broiler production in the same district, revealing positive profitability among smallholder farmers. Despite its advantages, gross margin analysis does have limitations: it assumes linear relationships between inputs and outputs,
overlooks interdependence among enterprises, and is typically short term in focus due to its reliance on periodic budgeting.28 Nevertheless, given the widespread use of this method and the lack of proper record-keeping among many smallholder farmers, we selected gross margin as the most suitable and practical tool for estimating profitability. Consequently, the budgetary technique adopted assessed both the profitability and its key determinants in the production of medicinal plants in the region.31 Equation 2 was used to calculate the gross margin:
GM(π) = ∑ (TRi TVCi)
Equation 2
where GM is the mean gross margin per medicinal plant, TR is the total revenue from the production of medicinal plant i measured in terms of TVC, the total variable cost of production of medicinal plant i, measured in terms of direct and indirect costs. Costs included hired labour, transport, water for irrigation, seeds, chemicals and fertiliser.
The total revenue, which is equivalent to the gross income of each medicinal plant, was calculated using Equation 3:
TRi = Pi × Qi
Equation 3
where Pi is the farmgate price of medicinal plants and Qi is the total quantity produced.
The total variable cost was calculated from Equation 4:
TVC = ∑ i=1 2 (Kit + Sit + Lit)
Equation 4
where Kit is the expenditure on seed, Sit is the total expenditure on fertiliser and Lit is the total labour expenditure in each enterprise.
Following the calculation of the gross margin, we proceeded to determine the return per rand invested by dividing the gross margin by the total variable costs. This metric was deemed important for evaluating not only the production costs but also the overall efficiency of the medicinal plant enterprises.32 The return per rand invested serves as a key indicator of how effectively a business converts investment into profit, with higher values reflecting greater profitability per unit of investment. A higher return signifies that more profit is generated for every rand invested, indicating a more efficient and financially viable enterprise.
R eturn per R and Invested = Gross Margin Total Variable Cost Equation 5
We then calculated the net farm income, which is the difference between gross margin and fixed costs, with production costs deducted from the farm’s gross margin. According to Tshiame33 and Alabi et al.32, it is significant to include net farm income in the profit estimation of medicinal plant farming by smallholder farmers as it considers the farmer’s production cost.
Gross Margin = Total Revenue (TR ) Total Variable Cost (TVC) Equation 6
NFI = GM TFC
Equation 7
where NFI is the net farm income or profit, GM is the gross margin and TFC is the total fixed costs of the farm.
Logit model
We used the logit model to evaluate the factors influencing the participation of smallholder farmers in medicinal plant production. The logit model facilitates a statistical valuation of the effect of numerous variables on a dependent variable of a bilateral nature. The dependent variable can be expressed at two levels: 1 (medicinal plant participant) and 0 (non-participant).34 The weakness of linear probability models makes the use of ordinary least squares null and void.35 According to Jaza et al.36, the logit or probit model could be more applicable to this
research as the dependent variable (participation of smallholder farmers in producing medicinal plants) is qualitative, the explanatory variables are a combination of continuous and explanatory variables and the sample size is fairly manageable (N = 150).
Using the logit over the probit model is a matter of preference. The logit model offers the option to save the predicted values automatically, whereas probit cannot compute the predicted value of the probability. For this reason, the logit model was deemed suitable for this study. Jaza et al.36 stated that the logit model uses the maximum likelihood estimation method to calculate the logit of the possibility of the occurrence of the event, for instance, the natural log of the likelihood ratio of accomplishing one or the other alternative (e.g. participation of smallholder farmers in producing medicinal plants). By indicating P as the probability of attaining an alternative from the prognosticators X1 to X12, the arithmetical composition of the binary logit model applied in this study is conveyed as:
8
where P is the probability that the farmer produces medicinal plants, 1-P is the probability that the farmer does not produce medicinal plants, Y is the farmers’ group (with 1 = medicinal plant participant, 0 = non-participant), α is the intercept term (constant), β1, β2, β3, β4,… denotes the slope coefficient and X1, X2, X3, X4,… the explanatory or independent variables.
Propensity score matching
We implemented propensity score matching (PSM) to assess the effects of farmers’ participation in the production of medicinal plants on household welfare. PSM is a good method to improve the capability of the regression to accumulate precise causal evaluations through its non-parametric method to stabilise covariates between the participant and non-participant groups.37 To measure impact estimation, numerous econometric techniques were considered, such as reflexive comparison, instrumental variable methods, matching methods, and difference-indifference methods. PSM is particularly suitable when the primary goal is to estimate the causal impact of a treatment (in this case, participation in medicinal plant production by smallholder farmers) on an outcome, such as household welfare. PSM creates a control group that is statistically similar to the treatment group based on observable characteristics, thereby allowing for a credible comparison. PSM assumes that selection for treatment is based on observable variables (a conditional independence assumption). PSM provides a straightforward and transparent method to match participants with non-participants who have similar characteristics, making the comparison more intuitive and easier to interpret. It avoids the need for identifying exclusion restrictions (variables that affect selection but not outcome), which are often required in the Heckman model and can be difficult to justify empirically. In this study, we had access to rich observable data, such as age, gender, education, household size, farming experience and access to extension services, which are likely to influence both participation and outcomes.
PSM avoids this duality by directly comparing outcomes between matched individuals, thereby reducing dependence on parametric assumptions. PSM is widely used in impact evaluation and policy analysis, especially in agricultural and development economics, where the goal is to assess how a particular intervention or activity (like medicinal plant farming) affects participants. The method aligns well with the study’s objective of estimating the average treatment effect on the treated, providing clearer policy-relevant insights. We employed the use of matching methods to compare the effects of producing medicinal plants on the social welfare of participants and non-participants with relatable socio-economic background features. Matching solely controls for changes in the observable characteristics and biases are expected to occur, emerging from unobserved variables that have the potential to influence participation in the programme.38 The average effect of treatment on the treated (ATT) is calculated using Equation 939:
where yli symbolises the farm revenue for ith smallholder farmers generated through the production of medicinal plants, y0i is the income of the smallholder farmers who are not participating in the production of medicinal plants, and Di is a treatment gauge equal to 1 (sustainable production of medicinal plants) and 0 (otherwise). It was difficult to estimate what farm income would have been, given that there was no participation in the sustainable production of medicinal plants. Therefore, a key problem was that of estimating the suitable counterfactual: y i|Di = 0) For reasons emanating from the self-selection of non-random farmers, comparison between non-participants and participants is prone to generating biased estimates. An appropriate control group of non-participants who had related, comparable demographics to participants was constructed through the use of PSM.38 Empirically, the PSM technique adopts two stages. Firstly, a probability (Pr) model is created to evaluate each smallholder farmer’s likelihood p(xi) to participate in the production of medicinal plants, assuming their prevailing characteristics, xi39:
10
Secondly, the ATT of production of medicinal plants on household welfare of smallholder farmers (yi) is predicted, taking into account the matched observations of participants and non-participants as illustrated by Equation 11:
ATT psm = E [ yl |Di = 1, p(xi) ] E [ y0i| Di = 0, p(x )]
Equation 11
where ATTpsm estimates the mean variance of medicinal plant participants matched with non-participants of similar socio-dynamics who reside in the same district.34
Data
Table 1 illustrates the data collected from smallholder farmers in the study area.
Findings and discussion
Socio-economic
demographics of smallholder farmers in ADM
The effect of participating in the production of medicinal plants on the household welfare of smallholder farmers was measured through smallholder farmers who produce or extract medicinal plants to exchange them in the market for cash incentives. The 150 medicinal plant farmers who were interviewed revealed that 125 farmers had taken the initiative to sell the medicinal plants, and 25 of the farmers acknowledged only the production and use of curative plants and did not participate in selling their produce in market streams. Table 2 shows the socio-economic characteristics of the smallholder farmers in this study.
The majority (67%) of medicinal plant farmers in our study were women, who had an average age of 44 years. Similar findings were shared by Khoza et al.40 41, who reported that women are responsible for farming in rural households. Our results also revealed that the medicinal plant farmers spent more than 10 years in school, placing them in a good position to understand the farm operation and easily accumulate knowledge about the health benefits. These results are similar to those of Bonokwane and Ololade42, who realised that farmers with orthodox schooling are more than willing to put into practice modern technological innovations and upscale their production efficiency. Household size was used as the proxy for family labour in this study, as smallholder farmers rely on family labour for farm operations. The majority of households had an average of five members per household and owned land smaller than a hectare. This means that smallholder farmers must use self-labour in their farming activities to reduce labour costs. This is a worrisome factor in the progressive development of smallholder farming. Mazibuko43 also highlighted that insufficient family labour is a limiting factor in smallholder production. Further, the results show that medicinal plant farmers had more than 10 years of experience
Table 1: Definition, measurement and summary statistics of variables used
Education Actual years spent in school Continuous +/
Marital status
Household size
Member of association
Location (originally from the study site)
Married = 1
Single = 0 Dummy +/
Actual number in the household Continuous +/
Yes = 1 No = 2 Dummy +/
Yes = 1 No = 0 Dummy +/
Employment Categorical Categorical +/ Level of income Actual amount Categorical +/
Extension Number of visits by the extension officer Continuous +/
Challenges faced by farmers
Economic value of high-value medicinal plants
Effects of producing medicinal plants
Categorical Categorical +/
Categorical Categorical +/
Categorical Categorical +/
in production. This means that they possessed a superior understanding of the production, challenges and health benefits of these remedial plants.
Measuring the profitability of medicinal plant farming in ADM
We analysed the profitability of smallholder medicinal plant enterprises based on key financial indicators such as total revenue, total variable costs and gross margins to assess the economic viability of cultivating specific medicinal plant species under smallholder conditions. By examining returns on investment and cost-efficiency, we provide insights into which crops offer the greatest financial returns and sustainability potential. The results are shown in Table 3
The data presented in Table 3 reveal important insights into the profitability of smallholder medicinal plant enterprises. Gross margins and the return per rand invested (RRI = gross margin/total variable cost) indicate that all four medicinal plant enterprises are profitable at varying levels, with Artemisia afra (Umhlonyane) emerging as the most lucrative. It boasts the highest gross margin (ZAR7320.62) and an impressive RRI of 2.77, indicating that for every rand spent on variable costs, a return of ZAR2.77 is achieved. This contrasts sharply with Aloe candelabrum (Ikhala), which has the lowest RRI at 1.10, suggesting a slimmer margin of
profitability. While Aloe candelabrum generates the highest total revenue (ZAR21 750.52), its high variable costs (ZAR10 350.69) significantly reduce its relative profitability. The other two species, Bulbine abyssinica (Intelezi) and Elephantorrhiza elephantina (Intolwane), demonstrate moderate profitability, with RRIs of 1.18 and 1.67, respectively, suggesting they are viable but not the most efficient options. Taking a broader financial view, the total gross margin for all enterprises combined is ZAR26 872.46. After subtracting total fixed costs of ZAR7780.74, the net farm income stands at ZAR19 091.72. These results are in line with those of Mdoda and Obi20 and Thibane30, who also observed similar trends of profitability and viability in investing in medicinal plant production.
This net farm income gives a return on investment of 0.71, which means that for every rand invested in both variable and fixed costs, the enterprise returns 71 cents in net profit. While this return on investment reflects a positive return, it also signals room for improvement, particularly in managing input costs and scaling the more profitable species. The high RRI of Artemisia afra suggests that a strategic focus on expanding its production, while perhaps minimising less efficient crops like Aloe candelabrum, could significantly enhance overall farm profitability. Additionally, the relatively low fixed cost burden (just under 30% of gross margin) suggests that smallholders can maintain or improve profitability with careful resource allocation and crop selection.
Factors influencing participation in the production of medicinal plants
We used a logit regression to estimate the contributing factors that influence the participation of smallholder farmers in the space of medicinal plant production in the ADM. Table 4 shows the outcomes evaluated through the use of regression and the fitness of the model. The Pseudo-R2 is the main indicator to note, in addition to the likelihood ratio chi-square, which is imperative for estimating the level of appropriateness that the model is ordered to suitably structure on assessed likelihoods. Per this study, the log-likelihood of -194.007 and a p-value of 0.0000 designates that the model is statistically significant. The R2 (83%) and the adjusted R2 (78%) suggest a good model fit.
Our findings highlight the significant role of a farmer’s age in medicinal plant production. The age variable was found to have a negative impact on participation, with the coefficient being statistically significant at the 1% level. Specifically, as a farmer’s age increases, the likelihood of participating in the production of medicinal plants decreases. This trend can likely be attributed to the physical decline that often accompanies ageing, leading to reduced strength and mobility, which are essential for the physically demanding tasks involved in farming. Such factors may have implications for the future sustainability of medicinal plant production. This finding aligns with the work of Rubhara and Mudhara44, who noted that older farmers often experience a decline in physical stamina, which affects their participation in the production of medicinal plants as well as their productivity. Naturally, younger individuals tend to be more physically capable than their older counterparts.
Being female was found to have a positive influence on participation in the production of indigenous medicinal plants, with the effect being significant at the 1% level. This suggests that an increase in the number of female participants is likely to boost the output of medicinal plants, which in turn would enhance household welfare. These results are consistent with the findings of Assefa et al.45, who observed that men were less likely to engage in farming activities, whereas women demonstrated a stronger drive to participate. Therefore, in the ADM, women emerge as more reliable and economically viable contributors to the production of medicinal plants compared to their male counterparts. The education variable was found to have a negative coefficient, significant at the 5% level. This suggests that each additional year of schooling increased the likelihood of smallholder farmers participating in medicinal plant production. However, this relationship may be influenced by a perception among highly educated individuals, who often view raw medicinal plants as a commodity associated with poverty and may thus avoid engaging with them. This attitude could hinder the growth of medicinal plant production among smallholder farmers. These findings align with those of previous studies, which indicate that educated individuals are
in the econometric model
Table 2: Socio-economic demographics of smallholder farmers who participate in producing and selling medicinal plants and those who only produce but do not sell
more likely to embrace medicinal plants when they are processed into more commercially acceptable forms. As a result, this reluctance may lead to reduced participation in medicinal plant cultivation as farmers pursue higher levels of education.2 46 47
Household size was significant at 5% and had a positive coefficient, meaning that there was a positive relationship between an increase in household size and participation. An increase in the number of household members who assist with farming activities is likely to increase participation in the production of medicinal plants. These results are compatible with those of Mdoda et al.48 who noted that a growth in household size means an intensification in labour. Therefore, the advantage of saving on casual labour consolidates a farmer’s choice to participate in medicinal plant production to improve their welfare.
Farming experience was established to have a positive influence on participation in the production of medicinal plants, significant at 1%. This suggests that a higher level of experience creates a good chance of a positive stimulus on participation in the production of medicinal plants
https://doi.org/10.17159/sajs.2025/18738
by smallholder farmers. This result is similar to those of Yeshiwas et al.12 who found that experience is a cornerstone to a productive smallholder medicinal plant farm, because experienced farmers are more likely to make informed decisions based on experience.
Extension services had a positive coefficient, which is statistically significant at 5%. Therefore, there was a positive correlation between the intensification of extension services and an increase in participation in productivity in the ADM. An increase in agricultural knowledge is likely to positively influence the participation of farmers in the production of medicinal plants. These results resemble those of Nwafor et al.49 who noted that extension and advisory services are a great booster for rural medicinal plant farmers through dedicated implementation of knowledge and skills by extension officers. Close mentorship by extension officers increases farmers’ capacity to make informed decisions and solidifies their confidence to participate in medicinal plant production.
The variable representing the protection of natural resources had a positive coefficient and is statistically significant at the 1% level. This suggests
Plants produced (Xhosa name)
Table 3: Profitability of medicinal plant enterprises of smallholder production
Number
a strong positive relationship between smallholder farmers’ participation in the production of medicinal plants and efforts to conserve natural resources. In essence, as natural resources are more effectively protected from degradation or extinction, smallholder farmer participation tends to increase. These findings are consistent with the work of Astutik et al.2, Yeshiwas et al.12 and Nwafor et al.49, who observed that enhanced conservation practices play a critical role in preserving species diversity. The preservation of biodiversity ensures a more reliable supply of medicinal plant materials, thereby encouraging greater involvement from smallholder farmers. Put simply, the more abundant and secure the natural resources, the more sustainable and appealing medicinal plant cultivation becomes for rural farmers.
Effects of participation on household welfare
We aimed to assess the effect of smallholder farmers participating in medicinal plant production on household welfare using PSM. By comparing participants and non-participants, the analysis evaluated changes in factors such as capital, labour, seed quality and cultivated land size. PSM techniques, including nearest neighbour and kernel matching, were applied to ensure a balanced comparison between treatment and control groups. The results indicate that medicinal plant cultivation had a measurable effect on the welfare of participating households (Table 5).
The analysis of the treatment’s impact on household welfare using two different matching methods (kernel matching and nearest-neighbour matching) provides consistent evidence of a positive and statistically significant effect of medicinal plant production on smallholder farmers’ welfare. Under the kernel matching method, the average treatment effect on the treated was estimated at 5624.64, with a standard error of 4912.56 and a p-value of 0.021. This indicates that, on average, treated households participating in the production of medicinal plants experience a welfare gain of approximately ZAR5625 as compared to similar untreated households that do not participate in the production of medicinal plants, with the effect being statistically significant at the 5% level. Despite the relatively high standard error, which implies some degree of variability in the estimate, the low p-value supports the robustness of the positive impact. This signifies that growth in the production of medicinal plant enterprises resulted in an improvement in farm returns and the welfare of farmers through the betterment of their standard of living through increased farm revenues. The nearest-neighbour matching method yielded a slightly higher average treatment effect on the treated of ZAR6472.69 with a standard error of
Number of observations = 150, matches requested = 7, treatment model = logit
**p < 0.05; ***p < 0.001
5472.69, denoting statistical significance at the more stringent 1% level. This suggests an even stronger level of confidence in the positive welfare effect of the treatment. While both methods confirm a beneficial impact, the nearest-neighbour approach indicates a higher magnitude of effect and stronger statistical significance, albeit with slightly increased variability. Taken together, these findings reinforce the conclusion that the intervention has a meaningful and statistically credible effect on improving household welfare outcomes. Therefore, unwillingness to participate in the production of medicinal plants can be substantial. This result is similar to that of Nyang’au et al.38 who revealed that the production of medicinal plants affects the welfare of smallholder farmers, and their rate of participation in medicinal plant production increases when they discover an increase in farm revenue.
Conclusion and recommendations
We investigated the effects of producing medicinal plants on the household welfare of smallholder farmers of the Amatole District Municipality in Eastern Cape, South Africa. Medicinal plants are critical assets that are indigenous to the rural areas where smallholder farmers live. This study underscores the significant positive impact of medicinal plant production on the household welfare of smallholder farmers in the Amatole District. The logistic regression results revealed that female gender, larger household size, greater farming experience, more frequent extension visits, and a strong commitment to natural resource protection all significantly increased the likelihood of participation, while age and higher levels of education reduced it. Furthermore, the PSM analysis confirmed a statistically significant and positive impact of medicinal plant cultivation on household welfare, with participating farmers experiencing welfare gains ranging from ZAR5624 to ZAR6472. This underscores the economic and social value of promoting medicinal plant farming as a viable strategy for improving livelihoods, enhancing food and health security, and supporting sustainable rural development in the region. Therefore, scaling up participation in medicinal plant production presents a promising pathway to bolster smallholder resilience and contribute to broader rural development goals.
Our findings indicate several important policy directions to enhance the adoption and benefits of medicinal plant cultivation among smallholder farmers. These findings highlight the importance of targeted policy interventions that support traditionally underrepresented yet highly motivated groups, such as women and experienced farmers, while enhancing extension services and integrating environmental sustainability into agricultural strategies. As younger and female farmers show higher participation rates, targeted interventions such as training, input subsidies and access to credit should prioritise these groups to maximise engagement and productivity. Given the positive influence of farming experience, policies should promote knowledge-sharing platforms and mentorship programmes, allowing experienced farmers to pass on traditional and technical know-how. Strengthening agricultural extension services is also critical; well-resourced and frequent extension visits focused on medicinal plants can significantly boost adoption. Furthermore, the strong link between natural resource protection and participation highlights the need to integrate
Table 4: Estimates of determinants of farmers’ participation in the production of medicinal plants
Table 5: Effects of farmers’ participation in the production of medicinal plants on household welfare
environmental conservation into agricultural policy, encouraging sustainable land use alongside crop diversification. The inverse relationship between education and participation suggests a need to rethink formal education by embedding agroecological knowledge and the value of traditional crops into rural curricula. Large households, which may benefit from internal labour availability, should be supported through group-based incentives that enhance their productive capacity. Finally, the overall positive impact of medicinal plant cultivation on smallholder welfare indicates its potential as a strategic tool in rural development, poverty alleviation and biodiversity conservation initiatives.
Acknowledgements
We are grateful to the smallholder farmers in the Amatole District Municipality for availing themselves for this study. We also are grateful to the enumerators and extension officers who assisted in gathering data from the farmers in the study area.
Funding
We acknowledge the South African National Research Foundation for funding this research.
Data availability
Data can be made available from the corresponding author if there is substantial motivation.
Declarations
We have no competing interests to declare. No AI or LLM tools were used in this study. Ethical clearance was obtained from the University of KwaZulu-Natal’s Humanities and Social Science Research Ethics Committee (HSSREC/00005086/2022). Approval to conduct research in the study area was granted by the Amatole District Municipal Institute of Learning. Respondents signed an informed consent form in their home language confirming their voluntary and confidential participation; they were free to withdraw at any time.
Authors’ contributions
Z.M.: Conceptualisation, methodology, investigation, sample analysis, formal analysis, validation, data curation, writing – original draft, writing – review and editing. L.M.: Methodology, sample analysis, formal analysis, validation, writing – original draft, writing – review and editing, supervision, project leadership, project administration, funding acquisition. S.S.N.: Conceptualisation, methodology, investigation, formal analysis, validation, data curation, writing – original draft, writing –review and editing. N.M.: Methodology, sample analysis, validation, data curation, writing – original draft, writing – review and editing. Y.N.: Methodology, formal analysis, validation, data curation, writing – review and editing, supervision, project leadership, project administration, funding acquisition. All authors read and approved the final version.
References
1. Chen SL, Yu H, Luo HM, Wu Q, Li CF, Steinmetz A. Conservation and sustainable use of medicinal plants: Problems, progress, and prospects. Chin Med. 2016;11, Art. #37. https://doi.org/10.1186/s13020-016-0108-7
2. Astutik S, Pretzsch J, Kimengsi JN. Asian medicinal plants’ production and utilization potentials: A review. Sustainability. 2019;11(19), Art. #5483. http s://doi.org/10.3390/su11195483
3. Susanti R, Zuhud EAM. Traditional ecological knowledge and biodiversity conservation: The medicinal plants of the Dayak Krayan people in Kayan Mentarang National Park, Indonesia. Biodiversitas. 2019;20(9):2764–2779. https://doi.org/10.13057/biodiv/d200943
4. Nwafor I, Nwafor C, Manduna I. Constraints to cultivation of medicinal plants by smallholder farmers in South Africa. Horticulturae. 2021;7(12), Art. #531. https://doi.org/10.3390/horticulturae7120531
5. Omotilewa OJ, Panja P, Vega-Ortiz C, McLennan J. Evaluation of enhanced coalbed methane recovery and carbon dioxide sequestration potential in high volatile bituminous coal. J Nat Gas Sci Eng. 2021;91, Art. #103979. https:// doi.org/10.1016/j.jngse.2021.103979
6. Chiaka JC, Zhen L, Yunfeng H, Xiao Y, Muhirwa F, Lang T. Smallholder farmers’ contribution to food production in Nigeria. Front Nutr. 2022;9, Art. #916678. https://doi.org/10.3389/fnut.2022.916678v
7. Quiroz D, Towns AM, Legba SI, Swier J, Brière S, Sosef M, et al. Quantifying the domestic market in herbal medicine in Benin, West Africa. J Ethnopharmacol. 2014;151(3):1100–1108. https://doi.org/10.1016/j.jep.2013.12.019
8. Mukherjee PK. Quality control and evaluation of herbal drugs: Evaluating natural products and traditional medicine. Amsterdam: Elsevier; 2019.
9. Khan NA, Ahmed S, Farooqi IH, Ali I, Vambol V, Changani F, et al. Occurrence, sources and conventional treatment techniques for various antibiotics present in hospital wastewaters: A critical review. TrAC Trends Anal Chem. 2020;129, Art. #115921. https://doi.org/10.1016/j.trac.2020.115921
10. Umeta Chali B, Melaku T, Berhanu N, Mengistu B, Milkessa G, Mamo G, et al. Traditional medicine practice in the context of COVID-19 pandemic: Community claim in Jimma Zone, Oromia, Ethiopia. Infect Drug Resist. 2021;14:3773–3783. https://doi.org/10.2147/IDR.S331434
11. Jadhav CA, Vikhe DN, Jadhav RS. Global and domestic market of herbal medicines: A review. Res J Sci Technol. 2020;12(4):327–330. http://dx.do i.org/10.5958/2349-2988.2020.00049.2
12. Yeshiwas Y, Tadele E, Tiruneh W. The dynamics of medicinal plants utilization practice nexus its health and economic role in Ethiopia: A review paper. Int J Biodivers Conserv. 2019;11(1):31–47. https://doi.org/10.5897/IJBC2018.1201
13. Xiong Y, Long C. An ethnoveterinary study on medicinal plants used by the Buyi people in Southwest Guizhou, China. J Ethnobiol Ethnomed. 2020;16(1), Art. #446. https://doi.org/10.1186/s13002-020-00396-y
15. Petelka J, Plagg B, Säumel I, Zerbe S. Traditional medicinal plants in South Tyrol (northern Italy, southern Alps): Biodiversity and use. J Ethnobiol Ethnomed. 2020;16, Art. #74. https://doi.org/10.1186/s13002-020-00419-8
16. Ganie AH, Tali BA, Khuroo AA, Reshi ZA, Nawchoo IA. Impact assessment of anthropogenic threats to high-valued medicinal plants of Kashmir Himalaya, India. J Nat Conserv. 2019;50, Art. #125715. https://doi.org/10.1016/j.jnc .2019.125715
17. Scartazza A, Mancini ML, Proietti S, Moscatello S, Mattioni C, Costantini F, et al. Caring local biodiversity in a healing garden: Therapeutic benefits in young subjects with autism. Urban For Urban Green. 2020;47, Art. #126511. https://doi.org/10.1016/j.ufug.2019.126511
18. Gowthami R, Sharma N, Pandey R, Agrawal A. Status and consolidated list of threatened medicinal plants of India. Genet Resour Crop Evol. 2021; 68(6):2235–2263. https://doi.org/10.1007/s10722-021-01199-0
19. Mujuru NM, Obi A. Effects of cultivated area on smallholder farm profits and food security in rural communities of the Eastern Cape Province of South Africa. Sustainability. 2020;12(8), Art. #3272. https://doi.org/10.3390/su12083272
20. Mdoda L, Obi A. Analysis of profitability of smallholder irrigated food plots in the Eastern Cape Province of South Africa. J Agribusiness Rural Dev. 2019;53(3):225–232. https://doi.org/10.17306/J.JARD.2019.01265
21. Thinyane Z. The role of non-timber forest products (NTFPs) in the livelihoods of communities in Alfred Nzo District Municipality, Eastern Cape Province [thesis]. Alice: University of Fort Hare; 2019.
22. Marume U, Chimonyo M, Dzama K. Some insights into the reproductive performance, selection criteria, production and market constraints in communal goat production systems of South Africa. Sci Res Essays. 2013; 8(30):1448–1458. https://doi.org/10.5897/SRE12.501
23. Afolayan AJ, Wintola OA. Dietary supplements in the management of hypertension and diabetes – a review. Afr J Tradit Complement Altern Med. 2014;11(3):248–258. https://doi.org/10.4314/ajtcam.v11i3.35
24. Mudemba R, Taruvinga A, Zhou L. An assessment of community’s perceptions of IK-based handicrafts in Amathole District Municipality, South Africa. Int J Soc Sci Humanit. 2018;8(3):82–85. http://dx.doi.org/10.18178ijssh.2018.939
25. Amatole District Municipality. Integrated development plan 2016 [document on the Internet]. c2016 [cited 2024 Jan 27]. Available from: https://www.ec secc.org/documentrepository/informationcentre/2015-2016-idp-final-10-06
https://doi.org/10.17159/sajs.2025/18738
26. Spector PE. Do not cross me: Optimizing the use of cross-sectional designs. J Bus Psychol. 2019;34(2):125–137. https://doi.org/10.1007/s10869-018-09 613-8
27. Sharma G. Pros and cons of different sampling techniques. Int J Appl Res. 2017;3(7):749–752.
28. Mdoda L. Market participation and value chain integration among smallholder homestead and irrigated crop farmers in the Eastern Cape Province of South Africa [master’s dissertation]. Alice: University of Fort Hare; 2017.
29. Mdoda L, Gidi LS. Impact of land ownership in enhancing agricultural productivity in rural areas of Eastern Cape Province. S Afr J Agric Ext. 2023;51(2):1–23. https://doi.org/10.17159/2413-3221/2023/v51n2a11553
30. Thibane Z. Economic and market analysis of smallholder farmers’ broiler production in the Amatole District Municipality, Eastern Cape, South Africa [doctoral dissertation]. Pietermaritzburg: University of KwaZulu-Natal; 2022.
31. Mauki D, Richard U, Kilonzo M. Influence of elevation gradient and plant species composition on soil organic carbon in Mount Rungwe Forest Reserve, Tanzania. Environ Sustain Ind. 2023;19, Art. #100291. https://doi. org/10.1016/j.indic.2023.100291
32. Alabi OO, Safugha GF, Aluwong JS. Cost efficiency and profitability analysis of rice (Oryza sativa) production among smallholder farmers in Federal Capital Territory, Nigeria. Aust J Sci Technol. 2023;7(1):1–8.
33. Tshiame MI. Productivity and profitability measures of emerging farm enterprises in the Mpumalanga Province [thesis]. Pretoria: Tshwane University of Technology; 2013.
34. Szafraniec-Siluta E, Zawadzka D, Strzelecka A. Application of the logistic regression model to assess the likelihood of making tangible investments by agricultural enterprises. Procedia Comput Sci. 2022;207:3894–3903. https:/ /doi.org/10.1016/j.procs.2022.09.451
35. Mokhnenko A, Babenko V, Naumov O, Perevozova I, Fedorchuk O. Mathematicallogistic model of integrated production structure of food production. In: Sokolov O, Zholtkevych G, Yakovyna V, Tarasich Yu, Kharchenko V, Kobets V, et al., editors. Proceedings of the 16th International Conference ICTERI 2020: Volume II: Workshops; 2020 October 06–10; Kharkiv, Ukraine. ICTERI; 2020. p. 446–454. Available from: http://dspace.tnpu.edu.ua/bitstream/123456789/16742/1/article _ICTERI_2020.pdf
36. Jaza FAJ, Tsafack PP, Kamajou F. Logit model of analysing the factors affecting the adoption of goat raising activity by farmers in the non-pastoral centre region of Cameroon. Tropicultura. 2018;36(1):54–62.
37. Aku A, Mshenga P, Afari-Sefa V, Ochieng J. Effect of market access provided by farmer organizations on smallholder vegetable farmer’s income in Tanzania. Cogent Food Agric. 2018;4(1), Art. #1560596. https://doi.org/10. 1080/23311932.2018.1560596
38. Nyang’au P, Muriithi B, Marubu R, Bwire J, Onyimbo N, Irungu J. Effect of participation in commercial production of medicinal plants through community-based conservation groups on farm income at Kakamega forest, Kenya. J Sustain For. 2020;39(6):543–562. https://doi.org/10.1080/105498 11.2019.1689145
39. Kabunga N, Ghosh S, Griffiths JK. Can smallholder fruit and vegetable production systems improve household food security and nutritional status of women?: Evidence from rural Uganda. IFPRI Discussion Paper 01346.. 2014. https://doi.org/10.2139/ssrn.2483967
40. Luan DX. Motivation and barriers to access to formal credit of primary cinnamon producers from the perspective of value chain development in Northwestern Vietnam. J Agribusiness Dev Emerg Econ. 2020;10(2):117–138. https://doi.org/10.1108/JADEE-01-2019-0003
41. Khoza TM, Senyolo GM, Mmbengwa VM, Soundy P. Socio-economic factors influencing smallholder farmers’ decision to participate in agro-processing industry in Gauteng Province, South Africa. Cogent Social Sci. 2019;5(1), Art. #1664193. https://doi.org/10.1080/23311886.2019.1664193
42. Bonokwane LP, Ololade OO. Socio-economic factors affecting smallholder farmers’ willingness to adopt biodigester technology in South Africa. J Energy South Afr. 2022;33(1):10–20. https://doi.org/10.17159/2413-3051/2022/v 33i1a8860
43. Mazibuko NL. Selection and implementation of climate smart agricultural technologies: Performance and willingness for adoption [doctoral dissertation]. Pietermaritzburg: University of KwaZulu-Natal; 2018.
44. Rubhara T, Mudhara M. Commercialization and its determinants among smallholder farmers in Zimbabwe: A case of Shamva District, Mashonaland Central Province. Afr J Sci Technol Innov Dev. 2019;11(6):711–718. https:// doi.org/10.1080/20421338.2019.1571150
45. Assefa W, Kewessa G, Datiko D. Agrobiodiversity and gender: The role of women in farm diversification among smallholder farmers in Sinana District, Southeastern Ethiopia. Biodivers Conserv. 2022;31:2329–2348. https://doi. org/10.1007/s10531-021-02343-z
46. Tefera BN, Kim YD. Ethnobotanical study of medicinal plants in the Hawassa Zuria District, Sidama Zone, Southern Ethiopia. J Ethnobiol Ethnomed. 2019;15, Art. #25. https://doi.org/10.1186/s13002-019-0302-7
47. Sidiq RSS, Achmad RW. Gender aspects in remote indigenous community empowerment program in Indonesia. J Adv Res Dyn Control Syst. 2020; 12(6):2104–2109.
48. Mdoda L, Obi A, Ncoyini-Manciya Z, Christian M, Mayekiso A. Assessment of profit efficiency for spinach production under small-scale irrigated agriculture in the Eastern Cape Province, South Africa. Sustainability. 2022;14(5), Art. #2991. https://doi.org/10.3390/su14052991
49. Nwafor JI, Aniukwu JK, Anozie BO, Ikeotuonye AC, Okedo-Alex IN. Pregnant women’s knowledge and practice of preventive measures against COVID-19 in a low-resource African setting. Int J Gynaecol Obstet. 2020;150(1):121–123. https://doi.org/10.1002/ijgo.13186
https://doi.org/10.17159/sajs.2025/18738
AuTHORS: Florence N. Nworah1,2
Nancy C. Igwebuike2 3
Ifeoma F. Chukwuma1 2
Chigozie P. Odo1 3 4
Ozoemena E. Eje1 3 5
AFFILIATIONS:
1Pharmacology Unit, Department of Biochemistry, University of Nigeria, Nsukka, Enugu State, Nigeria
2Department of Genetics and Biotechnology, University of Nigeria, Nsukka, Enugu State, Nigeria
3COVE-UP Analytical Laboratories, University of Nigeria, Nsukka, Enugu State, Nigeria
4Department of Chemistry and Biochemistry, University of South Carolina, Columbia, South Carolina, USA
5Department of Chemistry, Federal College of Education (Technical), Isu, Ebonyi State, Nigeria
CORRESPONDENCE TO: Ozoemena Eje
EMAIL: ozoemena.eje.pg01794@unn.edu.ng
DATES:
Received: 18 Sep. 2024
Revised: 11 Mar. 2025
Accepted: 13 May 2025
Published: 29 Sep. 2025
HOW TO CITE:
Nworah FN, Igwebuike NC, Chukwuma IF, Odo CP, Eje OE. Radical scavenging and antioxidant properties of green zinc oxide nanoparticles from Anacardium occidentale leaves. S Afr J Sci. 2025;121(9/10), Art. #20104. https: //doi.org/10.17159/sajs.2025/20104
ARTICLE INCLuDES:
☒ Peer review
☐ Supplementary material
DATA AVAILAbILITY:
☐ Open data set
☐ All data included
☒ On request from author(s)
☐ Not available
☐ Not applicable
EDITOR: Philani Mashazi
KEYWORDS: green synthesis, nanoparticles, characterisation, antioxidant, Anacardium occidentale
FuNDING: None
Radical scavenging and antioxidant properties of green zinc oxide nanoparticles from Anacardium occidentale leaves
Nanotechnology has become a focal point of interest on the road to disease intervention due to its vast applications in biomedicine and biotechnology. In this study, we evaluated the antioxidant properties of zinc oxide nanoparticles (ZnONPs) synthesised from Anacardium occidentale leaf extracts. The ZnONPs were characterised using UV-Visible and Fourier transform infrared (FTIR) spectroscopy, X-ray diffraction (XRD), scanning electron microscopy with energy dispersive X-ray (SEM-EDX), transmission electron microscopy (TEM) and gas chromatography-flame ionisation detection (GC-FID). Maximum UV-Vis spectra absorption revealed a prominent peak at 364–365 nm. The FTIR showed characteristic peaks at 3202 cm-1, with the O-H functional vibration of carboxylic acids, and 1197 cm-1, confirming the C-O stretch of alcohols. The absorption band of Zn tetrahedral coordination and Zn-O occurred at 869 cm-1 and 731–820 cm-1, respectively. The ZnONPs particle size was 17.19 nm while SEM-EDX revealed the crystalline nature and elemental compositions of the ZnONPs. TEM showed particle size distribution to be within 10–29 nm, while GC-FID revealed the presence of flavonoids, alkaloids and polyphenolic compounds. ZnONPs exhibited high antioxidant properties using 2,2-diphenyl-1-picrylhydrazyl, 2,2′-azino-bis-(3-ethylbenzothiazoline-6sulfonic, nitric oxide, thiobarbituric acid reactive substances, and ferric reducing antioxidant potential. Our findings show that A. occidentale leaves are a promising source of bioreductants for green synthesis, while the robust antioxidant properties exhibited by the ZnONPs are favourable in biomedical applications.
Significance:
This study shows a simple, cost-effective and eco-friendly approach for the synthesis of zinc oxide nanoparticles (ZnONPs) for therapeutic purposes. The utilisation of Anacardium occidentale leaves as a source of reducing agents for the capping and stabilisation processes makes it robust as plants are rich in bioactive compounds that possess a high therapeutic index. Antioxidant property assessment showed high scavenging activities for DPPH, ABTS and nitric oxide. Meanwhile, the ferric-reducing antioxidant power and the lipid peroxidation quenching properties exhibited by the ZnONPs would be favourable in controlling inflammation, with efficient permeation of the nanoparticles into targeted regions.
Introduction
The emergence of nanotechnology introduced a paradigm shift in tackling disease conditions from the use of conventional molecules and antibiotics with lower surface area. The drawbacks that accompany bulky drug agents in disease intervention, such as low permeability to body tissues and targeted organs, diffusion restriction, low surface area to volume ratio, and off-target delivery could be circumvented by the use of nanosize active agents. Nanoparticles are those materials with unique characteristic diameters in the range of 1–100 nm1, although some nanomaterials or nanocomposites synthesised from biological polymers could have larger particle sizes up to 200 nm. Particles at the nanosize level exhibit unique properties due to increased surface area, a band gap of 3.3 eV, increased binding energy, and improved conduction resulting from an accumulation of higher surface energy and increased adherence. Therefore, nanomaterials have found applications in several fields and industries, such as the environment2, agriculture, food, electronics, optics, biotechnology, biomedical, pharmaceuticals, wastewater treatment3, optoelectronics, and antimicrobial agents4
Two major approaches – top-down and bottom-up – are used in nanoparticle synthesis. Nanoparticles can be organic or inorganic and are classified based on their dimensions that lie within the nanosize range. Organic nanoparticles include lipid nanoparticles (micelles, liposomes and nanocapsules), dendrimers, hybrids, nanospheres and compact polymerics.5 Several metal oxide nanoparticles, including zinc oxide (ZnO), have been synthesised using chemical-based bottom-up strategies such as sol gelling, homogeneity-precipitation, organic-metal synthesis, spray pyrolysis, microwaving, and thermal evaporation, among others. However, these methods are hazardous, laborious, and expensive, thereby limiting their applications. This compelled the need to develop more efficient, environmentally friendly, non-toxic, and biocompatible strategies for the production of nanosized materials. ZnO is a promising and thermostable metallic oxide nanoparticle with broad applicability due to its unique antioxidant and anti-inflammatory properties. Besides optical, chemical sensing, semiconductor, electrical conductivity and piezoelectric properties, the mixture of ZnO nanoparticles (ZnONPs) and a chitosan hydrogel exhibits a high capacity for absorbing wound exudates, enables the production of haemostatic blood clots, and exhibits antimicrobial properties with no cytotoxicity. This surface modification and the intrinsic physicochemical properties of ZnONPs determine how hazardous or safe they could be.6 Balaure et al.7 found that a collagen wound dressing containing ZnONPs and 1% orange essential oil exhibited rapid wound closure, also inhibited bacterial growth, and had excellent biocompatibility both in vitro and in vivo.
Research Article
https://doi.org/10.17159/sajs.2025/20104
Alternatively, green synthesis is an aspect of green chemistry that offers a promising and low-cost approach to manipulating and fabricating nanoparticles by utilising materials from plants, animals and microorganisms. Plants are mostly used in green synthesis because of their abundance of phytochemicals such as flavonoids and polyphenolic compounds that are used as therapeutics in the maintenance of health and treatment of ailments. Various parts of plants (stems, roots, fruits, seeds, calluses, peels, leaves and flowers) are utilised in biological approaches to synthesise metallic nanoparticles of diverse shapes and sizes.8 During the synthesis of nanoparticles, these secondary metabolites are involved in the capping and stabilisation phase, and – through electrostatic interaction and conventional hydrogen bonding – the metal ion as the nucleus keeps initiating nucleation with other bioactive compounds, including carbohydrates and amino acids.1 The exact modality of plant-mediated synthesis of nanomaterial is vague and not known because of the diverse nature of the phytochemical constituents of plant material. It has been reported that the antioxidant properties of polyphenolic bioactives make them suitable reductants, which also enhances the stability of nanoparticles during synthesis.9
The plant Anacardium occidentale (cashew) is found globally and belongs to the family Anacardiaceae (Figure 1). It is mostly grown in the Western parts of Africa, particularly in Dormaa Ahenkro in the Brong-Ahafo Region of Ghana and in Nigeria as a cash crop. Anacardium occidentale species have shown some ethnopharmacological benefits, especially in the treatment of several ailments due to their antidiabetic, anti-inflammatory, antibacterial, antifungal and antioxidant properties. Bioactive compounds from A. occidentale crude extracts possess a considerable therapeutic index in their bulky state; nevertheless, utilisation of this plant’s leaves as a reducing agent source in the synthesis of metal-mediated nanoparticles could enhance their potential for use as efficient therapeutics. Different biological agents have been used to synthesise nanoparticles over the years; a variety of prokaryotes and eukaryotes are employed in the process of synthesis to create metallic nanoparticles10, and viruses, fungi, algae and plants have also been used11
One of the widely used metallic nanoparticles that has garnered significant attention in the biomedical industries is zinc oxide nanoparticles due to their wide applications. Previous studies have demonstrated that ZnONPs synthesised from Citrus sinensi12, Justicia adhatoda13, Lycopersicon esculentum14, Chlamydomonas reinhardtii15, Agathosma betulina16 , Arthrospira platensis17, Moringa olifera18 , Ocin tenuiflorum19 and others have exhibited antioxidant properties both in vitro and in vivo and could be harnessed in the treatment of inflammation, cancer and infectious diseases, as well as in medical devices16. Synthesising nanosize biomolecules using bioactive compounds from A. occidentale leaf
extracts would improve their efficacy in effective disease targeting. The biotechnological and applied microbiological uses of nanoparticles have grown as a result of their unique characteristics, such as large surface area, bioactivity, bioavailability, and bio-absorption.20 In some fields of research – such as drug and gene delivery, cancer therapy, and imaging of cellular compartments – experts have referred to nanoparticles as a wonder of modern medicine. To the best of our knowledge, the different in vitro antioxidant models used in assessing the antioxidant properties of ZnONPs have not been reported in any work. In addition, the use of gas chromatography-flame ionisation detection (GC-FID) in elucidating the possible capping and stabilising bioactive compounds makes this study unique. We explored the synthesis and spectroscopic characterisation of ZnONPs from A. occidentale leaves and evaluated the antioxidant properties which would contribute to revolutionalising disease treatment in the field of nanomedicine globally.
Materials and methods
Collection of plant material
Fresh leaves of Anacardium occidentale were gathered on 10 March 2024 in Ezimo in the Udenu Local Government Area of Enugu State, Nigeria. The leaves were then air dried at room temperature and ground into a fine powder using a Corona Manual Heavy Metal Grinder.21
Chemicals and reagents
All the chemicals used for this experiment were pure and analytical grade. Zinc sulfate, sodium hydroxide, 2,2-diphenyl-1-picrylhydrazyl (DPPH), thiobarbituric acid (TBA), potassium bromide (KBr), acetic acid, iron sulfate (FeSO4), methanol, 2,2’-azino-bis-ethylbenzothiazoline-6sulfonic (ABTS) acid, sodium dodecyl sulfate (SDS) and trichloroacetic acid (TCA) are products of Sigma Aldrich (USA); sulfanilic acid, naphthyl ethylenediamine dihydrochloride, sodium nitroprusside, phosphomolybdic acid, sodium phosphate, ammonium molybdate, potassium ferric cyanide, ferric chloride and ammonium ferric sulfate were obtained from Molychem, India (British Drug House); ascorbic acid (AA) was obtained from Qualikems, India; and tetraoxosulfate (IV) acid (H2SO4) was obtained from Fluka, Germany.
Equipment and apparatus
All equipment used was obtained either from the Department of Biochemistry’s laboratory unit at the University of Nigeria, Nsukka: electronic balance, spectrophotometer, temperature-controlled water bath, oven (BINDER Forced Air Circulation Oven, Germany); or COVE-UP Analytical Laboratories, University of Nigeria: centrifuge (Vickas Ltd,
https://doi.org/10.17159/sajs.2025/20104
Figure 1: Anacardium occidentale leaves
England), magnetic stirrer (LabTech MSH-200D Digital Magnetic Stirrer, Germany), spatula, conical flasks, beakers, magnetic bar. Nano Research Laboratories, University of Nigeria provided the UV3600-UV-vis-NIR Spectrophotometer; Ahmadu Bello University, Zaria, Nigeria provided the Nicolet 6700 FT-IR (Thermo Scientific; Oxford Inca Penta FeTX3 EDS instrument connected to Carl Zeiss EVO MA, Rigaku Mini-flex II system using nickel filtered CuKα radiation); and Springboard Laboratories, Awka, Anambra State, Nigeria provided the GC-FID (Alginate Technology).
Preparation of plant material
The hot-percolation approach, as described by Nduka et al.22, was adopted to extract the bioactive compounds from the ground leaves. Briefly, 60 g of the ground leaves of A. occidentale was weighed into 1 L of deionised water and heated for 40 min at 100 °C with continuous stirring. Then, after cooling, the solid residues were separated via filtration through a cheesecloth to obtain the clear filtrate and further centrifuged at 5000 rpm for 10 min. The clearer top layer rich in bioactive compounds from the A. occidentale leaves was carefully decanted into a clean container for further use in the synthesis of ZnONPs.
A.
occidentale mediated synthesis of ZnONPs
ZnONPs were synthesised from the prepared plant extracts using a slightly modified method adapted from Nduka et al.22 The freshly prepared 100 mM ZnSO4 solution was mixed with the plant extract in the ratio of 1:3 by slowly dropping the ZnSO4 from a burette into a beaker containing the extract whilst stirring continuously with a magnetic stirrer. ZnONP formation was confirmed by a noticeable colour change in the solution, with the nanoparticles precipitating at the bottom of the flask. To purify the ZnONPs, the solution was centrifuged at 172.9 x g for 15 min using a low-speed centrifuge (Vickas Ltd, England). The resulting pellet was then re-dispersed in deionised water and dried in the oven at 50 °C for 24 h. The nanoparticles were stored in a container inside a desiccator containing silica gel to maintain stability and prevent moisture absorption.
Spectroscopic characterisation of A. occidentale ZnONPs
ultraviolet-Visible spectroscopy
UV-Vis spectroscopy is a technique used to monitor the optimum conditions for forming ZnONPs by analysing the optical interaction of the particles through surface plasmon resonance. After 1:10 dilution of the crude extract of A. occidentale and ZnSO4 solution, it was transferred into a quartz cuvette and subjected to a UV-VIS spectrophotometer within the wavelength range of 200–1100 nm. The energy band gap was estimated from the spectra.22 23
Fourier-transform infrared spectroscopy
The functional groups of the synthesised ZnONP were evaluated using a Fourier-transform infrared (FTIR) spectrometer (Nicolet 6700 FT-IR, Thermo Scientific) whose wavenumber ranged from 4000 cm-1 to 450 cm-1 The sample for FTIR analysis was prepared by grinding the ZnONPs with a KBr pellet. The power “On” button of the instrument and the computer were turned on for 10–15 min to achieve system warm-up. Thereafter, the “MicroLabs PC window” and the “Start” circuits were closed to initiate the sampling operation, followed by the selection of the operation method of “Absorbance or transmittance”. Before placing the samples, the organic solvent was used to clean the crystal and the “Next” icon was selected to check the crystal and collect the background reading. A 10 mg sample of A. occidentale ZnONP was placed on the crystal and pressed to form a pellet. Then, the alignment of the sample was checked to ensure proper sampling, the sample identity was coded, the “Next” button was clicked, then right-clicked to pick the peaks, and the peaks were selected and labelled, before “Run” was selected for analysis.
Scanning electron microscopy
The morphology and the elements present in the synthesised ZnONPs were evaluated using scanning electron microscopy coupled with energy dispersive X-ray spectroscopy (SEM-EDX). Briefly, A. occidentale
ZnONPs were placed on a double adhesive sample stub and coated by a sputter coater (model Q150R, Quorum Technologies) with 5 nm of gold, taken to the chamber of the SEM machine and viewed through NaVCaM for focusing and adjustment.24 It was then transferred to SEM mode and focused as the resolution was automatically adjusted. Thereafter, the structural appearance of different magnifications was captured and the EDX revealed the elements present.
X-ray diffraction spectroscopy
The crystallographic structures of the A. occidentale ZnONPs were analysed using X-ray spectroscopy. Briefly, A. occidentale ZnONPs were finely ground, homogenised, and compressed in a flat sample holder. Smooth adjustment for analysis was made by creating a smooth and flat surface on the ZnONP and mounting it on the X-ray diffraction (XRD) cabinet.25 The XRD vibration and signal patterns were recorded using CuKα radiation with a wavelength (λ) of 1.5406 Armstrong, a voltage and current of 40 kV and 30 mA, respectively. The 2θ angular range spanned from 4° to 75°, with a step size of 0.026261° and a counting time of 8.67 seconds per step. The intensity of diffracted light was recorded as the ratio of the peak intensity to the highest peak (relative intensity = I/I1 x 100). Particle size was estimated using Scherer’s formula (Equation 1):
Particle size (nm) = Kλ βCosθ Equation 1
where K = shape factor = 0.95, λ = CuKα with a wavelength of 1.5406 Å (0.154 nm), θ = Bragg’s angle of diffraction in radians and β = full width at half maximum of the diffraction peak.
Transmission electron microscopy
The size and shape of the phytosynthesised ZnONPs were determined by transmission electron microscopy (TEM). The TEM images were obtained using a Philips Tecnai10 transmission electron microscope. Before analysis, ZnONPs were sonicated for 5 min, and a drop of appropriately diluted sample was placed onto a carbon-coated copper grid. The electron micrographs were used to investigate the surface features of the phytosynthesised ZnONPs.26 27 The unique morphology of the microwave-generated ZnONPs and the particle size distributions were visualised from the TEM images.
GC-FID and phytochemical analysis of A. occidentale ZnONPs
To ascertain the bioactive and phytochemical compounds involved in the capping process for the synthesis of ZnONPs from A. occidentale, the ZnONP extract was washed three times with 10 mL of 10% v/v ethanol aqueous solution. The solution was dried using anhydrous sodium sulfate and the solvent was evaporated. The sample was solubilised in 1000 uL of pyridine, of which 200 uL was transferred to a vial for analysis. The phytochemical analysis was performed using a Buck M910 gas chromatograph equipped with a flame ionisation detector. A syringe was used to draw 0.1 mL of the extract and inject it into the gas chromatograph. The sample is separated in the GC column as each analyte passes through the flame, fuelled by hydrogen and zero air, which ionises the carbon atoms and detects the bioactive compounds.28
Evaluation of antioxidant properties of A. occidentale ZnONPs
Lipid peroxidation inhibition
The potential for lipid peroxidation inhibition of A. occidentale ZnONP was evaluated through the presence of thiobarbituric acid reactive substances (TBARs), as described by Ohkowa et al.29 Different concentrations of A. occidentale ZnONPs (1.39–12.5 mg/mL) were prepared and 500 μL of 10% v/v egg yolk and 50 μL of a 70 mM solution of FeSO4 were added to induce peroxidation of lipids. A 1.5 mL solution of 20% acetic acid, 1.5 mL of 0.8% TBA in 1.1% SDS, and 50 μL of 20% TCA were added and the solution was vigorously shaken for proper mixing and heated at 95 ºC for 1 h after incubation for 30 min at room temperature. The absorbance
https://doi.org/10.17159/sajs.2025/20104
was recorded using a spectrophotometer at 532 nm against the blank. The level of peroxidation quench was evaluated using Equation 2:
C E C × 100
Equation 2
where C is the control (without extract) and E represents (Abs532+TBAAbs532-TBA).
Estimation of DPPH radical scavenging activity
Different concentrations of A. occidentale ZnONPs were pipetted into test tubes as described above and 1.5 mL of methanolic 0.18 mM DPPH solution was added and thoroughly mixed. The samples were then taken into a dark cupboard for 30 min and the absorbances were read at 517 nm against the blank.30 The DPPH radical scavenging property was calculated using Equation 3:
Determination of ferric-reducing power
The ability to reduce ferric ions to ferrous ions was evaluated by adding 1 mL of 1.0% potassium ferric cyanide into a test tube containing 0.5 mL of 0.1 M sodium phosphate buffer (pH 6.6) and 1 mL of 0.5% TCA and centrifuging at 4000 rpm after incubation at 50 °C for 20 min. The supernatant was diluted with an equivalent volume of distilled water, 0.1 mL of freshly prepared ferric chloride was added, and the absorbance read was at 700 nm against the blank.33
Statistical analyses
Statistical Package for Social Sciences (SPSS) version 23 was used to obtain the descriptive statistics, and the IC50 values were calculated from the dose-response curve using Origin Pro 2024b software.
Results and discussion
UV-Vis spectroscopy of A. occidentale ZnONPs
Determination of AbTS* radical scavenging property
The ABTS* radical scavenging property was ascertained as described by Pejin and Bogdanović-Pristov31 with slight modification. Different concentrations of A. occidentale ZnONPs, as described above, were taken into test tubes. The ABTS* radical was produced by the addition of potassium persulfate and allowed to stand for 24 h in the dark. Then 1 mL of the radical solution was added to varying concentrations of the ZnONPs, and allowed to stand in the dark for 30 min. Absorbance was recorded at 730 nm using a spectrophotometer (Spectrumlab 23A, England) at room temperature. The percentage scavenging activity was estimated, as in the case of DPPH.
Evaluation of nitric oxide scavenging
Nitric oxide scavenging activity (NOSA) was evaluated as outlined by Jagetia and Baliga32. Briefly, nitric oxide (NO) was generated using 2 mL of 10 mM aqueous solution of sodium nitroprusside at physiological pH. Varying concentrations of A. occidentale ZnONPs were then pipetted into the test tubes. After 150 min, 0.5 mL of Griess solution was added and the samples were left to stand for 30 min, after which absorbance was measured at 540 nm.
The first sign of a successful ZnONP synthesis was the brown precipitate that appeared when the plant extract was added to zinc sulfate. The UV-Vis spectra revealed a pronounced absorption peak around 364–365 nm. Notably, the ZnONP, NaOH-assisted ZnONP, and the extract demonstrated peak absorption at a wavelength of 365 nm, with abundance (a.u) values of 3.313, 2.038 and 0.745, respectively, confirming the effective synthesis of ZnONPs using the aqueous extract of A. occidentale. In contrast, the zinc sulfate solution exhibited its maximum absorption at 364 nm, with a value of 1.264. The surface plasmon resonance of the synthesised NPs is responsible for the solution’s gradual change in colour. The primary cause of the bioreduction of Zn2+ to Zn0 could be the phytochemicals found in A. occidentale leaf extracts.34 In this study, there was a progressive surface plasmon resonance band appearance between 370 nm and 400 nm, indicating ZnONP formation (Figure 2), while the absorbance peak at 380 nm was the maximum value. Sharmila et al.35 published similar results with an absorption peak for ZnONPs of 380 nm. This could be attributed to the presence of phytochemicals such as proteins, alkaloids, flavonoids and phenolics found in the A. occidentale leaf extract which functioned as biological reductants and are important in the formation of ZnONPs.36 Similar findings were reported for seaweed extract and Madar latex ZnONPs which showed maximum absorption at 365 nm and 368 nm, respectively.36 Additionally, ZnONPs produced from zinc acetate, zinc sulfate and zinc nitrate exhibited characteristic peaks at 334 nm, 338 nm and 361 nm, respectively, with decreased absorbance values.10 Sutradha and Saha37
Figure 2: Ultraviolet spectra of the extract, zinc solution and zinc oxide nanoparticles (ZnNPs).
found that green-synthesised ZnONPs from tomato (Lycopersicon esculentum) displayed absorption peaks at 322 nm and 334 nm in UV-Vis spectral analysis. ZnONPs synthesised using seaweed absorbed light maximally at 384 nm; however, 373 nm was where the bulky zinc oxide absorbed what could be attributed to a wider energy band gap.38
The functional group identification of the stabilising reductants involved in the synthesis of ZnONPs was analysed using FTIR spectroscopy.39,40
The distinctive peak vibration at 3201 cm-1 is an O-H bond with phenol and alcohol functional groups. The peak at 2113 cm-1 represents a C≡C stretch with alkynes as a functional group. Also, the vibrational peaks at 1602 cm-1 depict an N H bond which shows the presence of a primary amine group due to the presence of peptide moieties from the leaf of A. occidentale (Figure 3). An N O asymmetric stretch indicates the nitro compounds group at 1520 cm-1 and a 1442 cm-1 vibration reveals a C C stretch (in-ring) which belongs to the aromatic group. The peak 1319 cm-1 represents a C O stretch showing the presence of functional groups like alcohols, carboxylic acids, esters and ethers. The vibrational peaks 1088 cm-1 and 1025 cm-1 fit the C N stretch attributed to the characteristic functional group of aliphatic amines. The peak 868 cm-1 represents the C H “oop” of the aromatic and Zn-O bonding functional group. Moreover, 820 cm-1 and 730 cm-1 correspond to the C Cl stretch and the alkyl halides functional group and Zn. The phenolic and the amide vibrations of phytocompounds (alkaloids, flavonoids and phenolics) and proteins could be responsible for nanoparticle stabilisation after capping.41 Rao and Gautam15 synthesised ZnO nanoflowers using Chlamydomonas reinhardtii and observed a peak at
3437 cm–1 due to O-H vibration, with shifts in the amide I and II peaks indicating ZnO nanoflower formation. Similarly, ZnONPs synthesised using Malus pumila showed peaks at 1018 cm-1 due to C-O stretching of amino acids, and peaks at 528, 475 and 429 cm-1 due to the hexagonal phase of ZnONPs.42 For Juglans regia mediated ZnONPs, peaks at 575, 468 and 435 cm-1 were attributed to the hexagonal phase of ZnONPs.42 43
The EDX analysis revealed the elemental compositions with atomic and weight concentrations: carbon (87.20% and 79.59%), nitrogen (9.03% and 9.61%), zinc (1.08% and 5.37%), sodium (1.39% and 2.42%), sulfur (0.48% and 1.16%), aluminium (0.25% and 0.51%), potassium (0.12% and 0.36%), magnesium (0.17% and 0.32%), phosphorus (0.11% and 0.27%), silicon (0.12% and 0.25%) and chlorine (0.05% and 0.14%) (Table 1 and Figure 4). The variations of these elements may be attributed to possible compositions of A. occidentale which were also involved in the capping and stabilisation stage during nanoparticle formation.44 Hence, zinc appeared to be in lower abundance compared to carbon due to the presence of phytocompounds that were involved in the reduction of Zn2+ to Zn0. Similar outcomes were attained when ZnONPs were synthesised using seaweed, and EDX imaging revealed a pure form of the nanoparticle.43 The EDX analysis of phytosynthesised ZnONPs from Malus pumila extract showed the main components as zinc (60.5%), oxygen (33.04%) and carbon (6.46%), whereas Juglans regia derived ZnONPs contained zinc (22.27%), oxygen (61.66%) and carbon (16.07%).42 The SEM image of the nanoparticle shows the semi-crystalline nature of the ZnONPs at three magnifications: x 500, x 1000 and x 2000 (Figure 5).
Figure 4: The energy dispersive X-ray spectrum of zinc oxide nanoparticles.
X-ray diffraction analysis, displayed in Figure 6, revealed peaks at 2θ values of 18.78, 20.58, 21.88, 26.34, 29.26, 33.94, 35.78, 38.02, 39.7, 41.24, 44.22, 53.0, 64.54 and 68.87°, matching the characteristic peaks of pure ZnO and confirming its semi-crystalline nature (Figure 6). Using Debye–Scherrer’s formula, the average particle size was calculated to be 17.19 nm, while the individual particle sizes are represented in a histogram (Figure 7). Additionally, the average Bragg angle and the full width at half maximum were found to be 38.38° and 0.508, respectively. This is in agreement with the XRD pattern reported by Kumar et al.45 Similar research on ZnONPs from Citrus sinensis found average crystal sizes of 24.3, 22.6 and 12.7 nm for different extract concentrations.9 Rao and Gautam15 described the X-ray diffraction pattern of ZnONPs as having a hexagonal wurtzite structure with lattice constants a = 3.239 Å and c = 5.203 Å, which were in agreement with the standard. Various Bragg reflections at 31.78° (100), 34.48° (002), 36.38° (101), 47.78° (102), 56.58° (110), 62.98° (103), 68.08° (112) and 69.18° (201) were observed. The average crystallite size was 21 nm, slightly higher than that reported in the present study. Similar results were observed during the synthesis of ZnONPs using seaweed extract and Madar latex, with particles being spherical and 40 nm in size.41 The crystallite sizes of ZnONPs synthesised using Malus pumila and Juglans regia extracts were reported to be 46.41 nm and 90.80 nm, respectively.42 The TEM analysis showed predominantly monodispersed spherical shapes ranging in size from 20 nm to 100 nm; the mean particle sizes at 20, 50 and 100 nm magnifications were 18.256, 17.977 and 17.999 nm, while the overall and average particle size was 18.07 nm (Figure 8) which coincided with the XRD value. The GC-FID analysis of the ZnONPs showed the presence of flavonoids (flavone, epicatechin, tangeretein, hesperidin, butein, apigenin, myricetin, naringenin and daidzein), polyphenolics (ellagic acid and vanillic acid) and alkaloids (lunamarin) (Table 2). These bioactive compounds participated in the capping and stabilisation of the synthesised nanoparticles.21
Antioxidant properties of A. occidentale ZnONPs
The antioxidant activity of the green-synthesised ZnONPs was evaluated using different models – TBARS, DPPH, NOSA and ABTS – as summarised in Table 3. The TBARS were analysed to ascertain the lipid peroxidation inhibitory properties of A. occidentale ZnONPs. When inhibition occurs, the decrease in the level of malondialdehyde formation is diagnostic for
Table 1: Energy dispersive X-ray elemental analysis of zinc oxide nanoparticles
Figure 5: Scanning electron micrographs of Anacardium occidentale zinc oxide nanoparticles at three magnifications: (A) x 500, (B) x 1000 and (C) x 2000.
antioxidant and lipid peroxidation inhibition.29 This study revealed that A.occidentale ZnONPs exhibited the highest inhibitory potential at 3.13 mg/mL; the IC50 value (the concentration of A. occidentale ZnONPs needed to cause 50% peroxidation) was 5.84 mg/mL. In terms of scavenging of the stable free radical, DPPH, the nanoparticles achieved 86.07 ± 2.4% scavenging of free radicals via abstraction of electron(s) from the gigantic ring of the toxic compound, with an IC50 value of 2.0 mg/mL. This cleavage of the structure ameliorates the toxicity of the radical through the collapsing of its structure, which was qualitatively indicated by the colour change from purple to yellow by the product of diphenylpicrylhydrazine due to its hydrogen-donating ability forming a stable diamagnetic molecule.46 These pronounced antioxidative properties could be due to the wide range of phytochemical content (e.g. phenolics, alkaloids, flavonoids, tannins, saponins and terpenoids) in A. occidentale leaf extracts, which were involved as both stabilisation and capping agents during the synthesis of ZnONPs. Similar results were reported by Sharmila et al.35 for ZnONPs mediated by plant extracts.
ABTS*+ radical scavenging activities of A. occidentale ZnONPs rely on quenching the stable coloured radicals, which shows how efficient radical scavenging occurs.47 The concentrations of 3.13 mg/mL and 12.50 mg/ mL exhibited absolute (100%) scavenging properties, with an IC50 value of 0.75 mg/mL. The percentage of inhibition of nitrite (NO*) mopping up was decreased with increased ZnONP concentration as the maximum percentage was 70.20 ± 1.1% and the IC50 was 2.80 mg/mL. Hydrogen and electron-withdrawing or donating bioactive compounds would contribute to the competition with oxygen, thereby decreasing the production of nitrite ions.48 It has been reported that ZnONPs enhance antioxidant activity to mop up free radicals and prevent the incidence of oxidative and nitrosative stress.46-49 Other in vitro models used for antioxidant assessment of the ZnONPs was ferric-reducing antioxidant potential, which occurred in a concentration-dependent manner with 4.31–4.72 mg/g AAE compared to 0.54–0.83 mg/g AA (Figure 9). The deeper the bluish colouration as a result of antioxidants’ electron donation at low pH, the greater the conversion of ferric ions to utilisable ferrous ions.47 50 51
Figure 6: X-ray diffractogram of Anacardium occidentale zinc oxide nanoparticles.
Figure 7: The individual peak particle sizes of Anacardium occidentale zinc oxide nanoparticles.
8: Transmission electron microscopy images of Anacardium occidentale zinc oxide nanoparticles.
Table 2: Summary of gas chromatography–flame ionisation detector analysis of zinc oxide nanoparticles
9: Ferric-reducing antioxidant power of zinc oxide nanoparticles (ZnONPs).
In conclusion, the results of this study reveal that ZnONPs synthesised from A. occidentale leaf extracts show excellent antioxidant properties using an in vitro model of ferric-reducing antioxidant power. The nanoparticles also showed free radical scavenging properties on DPPH, ABTS, NOSA and lipid peroxidation inhibition (TBARS). ZnONP formation was confirmed using UV-Vis spectroscopic absorption at 364–365 nm. The functional groups, morphology-elemental compositions and particle size(s) were analysed using FTIR, SEM-EDX, XRD and TEM spectroscopic techniques. Based on the antioxidant activities exhibited, ZnONPs could be harnessed for biomedical applications. Moreover, the green synthesis process is economical in terms of energy, time and simplicity and achieves high yields, making it suitable for large-scale production of nano-crystalline zinc oxide.
Data availability
The data supporting the results of this study are available upon request to the corresponding author.
Declarations
We have no competing interests to declare. We have no AI or LLM use to declare.
https://doi.org/10.17159/sajs.2025/20104
Authors’ contributions
F.N.N.: Conceptualisation, supervision, resources, validation, writing –review and editing. N.C.I.: Investigation, formal analysis, writing – original draft. I.F.C.: Data curation, formal analysis, validation, writing – review and editing. C.P.O.: Conceptualisation, data curation, validation, writing – review and editing. O.E.E.: Conceptualisation, methodology, project management, investigation, data curation, writing – original draft, validation, formal analysis, writing – review and editing. All authors read and approved the final version.
References
1. Essien ER, Atasie VN, Nwude DO, Adekolurejo E, Owoeye FT. Characterisation of ZnO nanoparticles prepared using aqueous leaf extracts of Chromolaena odorata (L.) and Manihot esculenta (Crantz). S Afr J Sci. 2022;118(1–2), Art. #11225. https://doi.org/10.17159/sajs.2022/11225
2. Chen J, Guo Y, Zhang X, Liu J, Gong P, Su Z, et al. Emerging nanoparticles in food: Sources, application, and safety. J Agric Food Chem. 2023;71(8):3564–3582. https://doi.org/10.1021/acs.jafc.2c06740
3. Zahra Z, Habib Z, Chung S, Badshah MA. Exposure route of TiO2 NPs from industrial applications to wastewater treatment and their impacts on the agroenvironment. Nanomaterials. 2020;10(8), Art. #1469. https://doi.org/10.33 90/nano10081469
Figure
4. Islam F, Shohag S, Uddin MJ, Islam MR, Nafady MH, Akter A, et al. Exploring the journey of zinc oxide nanoparticles (ZnO-NPs) toward biomedical applications. Materials. 2022;15(6), Art. #2160. https://doi.org/10.3390/ma15062160
5. Ojo OA, Olayide II, Akalabu MC, Ajiboye BO, Ojo AB, Oyinloye BE, et al. Nanoparticles and their biomedical applications. Biointerface Res Appl Chem. 2021;11(1):8431–8445. https://doi.org/10.33263/BRIAC111.84318445
6. Sudheesh Kumar PT, Lakshmanan VK, Anilkumar TV, Ramya C, Reshmi P, Unnikrishnan AG, et al. Flexible and microporous chitosan hydrogel/nano ZnO composite bandages for wound dressing: In vitro and in vivo evaluation. ACS Appl Mater Interfaces. 2012;4(5):2618–2629. https://doi.org/10.1021/am3 00292v
7. Balaure PC, Holban AM, Grumezescu AM, Mogoşanu GD, Bălşeanu TA, Stan MS, et al. In vitro and in vivo studies of novel fabricated bioactive dressings based on collagen and zinc oxide 3D scaffolds. Int J Pharm. 2019;557:199–207. https://doi.org/10.1016/j.ijpharm.2018.12.063
8. Kuppusamy P, Yusoff MM, Maniam GP, Govindan N. Biosynthesis of metallic nanoparticles using plant derivatives and their new avenues in pharmacological applications – An updated report. Saudi Pharm J. 2016;24(4):473–484. https ://doi.org/10.1016/j.jsps.2014.11.013
9. Shivaji K, Monica ES, Devadoss A, Kirubakaran DD, Dhas CR, Jain SM, et al. Synthesizing green photocatalyst using plant leaf extract for water pollutant treatment. In: Green photocatalysts. Cham: Springer; 2020. p. 25–46. https:/ /doi.org/10.1007/978-3-030-15608-4_2
10. Hasan S. A review on nanoparticles: Their synthesis and types. Res J Recent Sci. 2015;2277:2502.
11. Pandit C, Roy A, Ghotekar S, Khusro A, Islam MN, Emran TB, et al. Biological agents for synthesis of nanoparticles and their applications. J King Saud Univ Sci. 2022;34(3), Art. #101869. https://doi.org/10.1016/j.jksus.2022.101869
12. Luque PA, Soto-Robles CA, Nava O, Gomez-Gutierrez CM, Castro-Beltran A, Garrafa-Galvez HE, et al. Green synthesis of zinc oxide nanoparticles using Citrus sinensis extract. J Mater Sci Mater Electron. 2018;29:9764–9770. https://doi.org/10.1007/s10854-018-9015-2
13. Pachaiappan R, Rajendran S, Ramalingam G, Vo DV, Priya PM, Soto-Moscoso M. Green synthesis of zinc oxide nanoparticles by Justicia adhatoda leaves and their antimicrobial activity. Chem Eng Technol. 2021;44(3):551–558. https://doi.org/10.1002/ceat.202000470
14. Vijayakumar S, Vaseeharan B, Sudhakaran R, Jeyakandan J, Ramasamy P, Sonawane A, et al. Bioinspired zinc oxide nanoparticles using Lycopersicon esculentum for antimicrobial and anticancer applications. J Cluster Sci. 2019;30:1465–1479. https://doi.org/10.1007/s10876-019-01590-z
15. Rao MD, Gautam P. Synthesis and characterization of ZnO nanoflowers using Chlamydomonas reinhardtii: A green approach. Environ Prog Sustain Energy. 2016;35(4):1020–1026. https://doi.org/10.1002/ep.12315
16. Thema FT, Manikandan E, Gurib-Fakim A, Maaza M. Single phase bunsenite NiO nanoparticles green synthesis by Agathosma betulina natural extract. J Alloys Compd. 2016;657:655–661. https://doi.org/10.1016/j.jallcom.2015.09.227
17. El-Belely EF, Farag MM, Said HA, Amin AS, Azab E, Gobouri AA, et al. Green synthesis of zinc oxide nanoparticles (ZnO-NPs) using Arthrospira platensis (Class: Cyanophyceae) and evaluation of their biomedical activities. Nanomaterials. 2021;11(1), Art. #95. https://doi.org/10.3390/nano11010095
18. Abel S, Tesfaye JL, Nagaprasad N, Shanmugam R, Dwarampudi LP, Krishnaraj R. Synthesis and characterization of zinc oxide nanoparticles using moringa leaf extract. J Nanomater. 2021;2021(1), Art. #4525770. https://doi.org/10 .1155/2021/4525770
19. Bala Chennaiah M, Kumar KD, Kumar BS, Tanneeru SR. Characterisation of zinc oxide nanoparticles-herbal synthesised coated with Ocimum tenuiflorum Adv Mater Process Technol. 2022;8(suppl2):466–477. https://doi.org/10.10 80/2374068X.2021.1934642
20. Mabrouk M, Elkhooly TA, Amer SK. Actinomycete strain type determines the monodispersity and antibacterial properties of biogenically synthesized silver nanoparticles. J Genet Eng Biotechnol. 2021;19(1), Art. #57. https://doi.org /10.1186/s43141-021-00153-y
21. Shrinet K, Singh RK, Chaurasia AK, Tripathi A, Kumar A. Bioactive compounds and their future therapeutic applications. In: Natural bioactive compounds. London: Academic Press; 2021. p. 337–362. https://doi.org/10.1016/B97 8-0-12-820655-3.00017-3
22. Nduka FO, Onwurah IN, Obeta CJ, Nweze EJ, Nkwocha CC, Ujowundu FN, et al. Effect of nickel oxide nanoparticles on bioethanol production by Pichia kudriavzveii IFM 53048 using banana peel waste substrate. Environ Technol. 2024;45(16):3283–3302. https://doi.org/10.1080/09593330.2023.2215450
23. Numbere A, Gbarakoro TN, Eberechukwu MM. Investigation of the use of mangrove and nypa palm parts as tools for remediating polluted soils in the Niger Delta, Nigeria. Int J Plant Soil Sci. 2022;34(19):226–239. https://doi.o rg/10.9734/ijpss/2022/v34i1931107
24. Goldstein A, Veres P, Burns E, Briggs MS, Hamburg R, Kocevski D, et al. An ordinary short gamma-ray burst with extraordinary implications: Fermi-GBM detection of GRB 170817A. Astrophys J Lett. 2017;848(2), Art. #L14. https ://doi.org/10.3847/2041-8213/aa8f41
26. Bunaciu AA, Aboul-Enein HY, Hoang VD. Vibrational spectroscopy used in polymorphic analysis. TrAC Trends Anal Chem. 2015;69:14–22. https://doi.o rg/10.1016/j.trac.2015.02.006
27. Imran Din M, Rani A. Recent advances in the synthesis and stabilization of nickel and nickel oxide nanoparticles: A green adeptness. Int J Anal Chem. 2016;2016(1), Art. #3512145. https://doi.org/10.1155/2016/3512145
28. Nwiloh BI, Uwakwe AA, Akaninwor JO. Phytochemical screening and GC-FID analysis of ethanolic extract of root bark of Salacia nitida L. Benth. J Med Plants Stud. 2016;4(6):283–287.
29. Ohkawa H, Ohishi N, Yagi K. Assay for lipid peroxides in animal tissues by thiobarbituric acid reaction. Anal Biochem. 1979;95(2):351–358. https://doi. org/10.1016/0003-2697(79)90738-3
30. Singh RP, Chidambara Murthy KN, Jayaprakasha GK. Studies on the antioxidant activity of pomegranate (Punica granatum) peel and seed extracts using in vitro models. J Agric Food Chem. 2002;50(1):81–86. https://doi.or g/10.1021/jf010865b
31. Pejin B, Bogdanović-Pristov J. ABTS cation scavenging activity and total phenolic content of three moss species. Hem Ind. 2012;66(5):723–726. https://doi.org/10.2298/HEMIND120131022P
32. Jagetia GC, Baliga MS. The evaluation of nitric oxide scavenging activity of certain Indian medicinal plants in vitro: A preliminary study. J Med Food. 2004;7(3):343–348. https://doi.org/10.1089/jmf.2004.7.343
33. Alachaher FZ, Dali S, Dida N, Krouf D. Comparison of phytochemical and antioxidant properties of extracts from flaxseed (Linum usitatissimum) using different solvents. Int Food Res J. 2018;25(1):75–82.
34. Kushwaha AS, Kumar A, Kumar R, Srivastava SK. A study of surface plasmon resonance (SPR) based biosensor with improved sensitivity. Photonics Nanostruct Fundam Appl. 2018;31:99–106. https://doi.org/10.1016/j.photonics.2018.06.003
35. Sharmila G, Thirumarimurugan M, Muthukumaran C. Green synthesis of ZnO nanoparticles using Tecoma castanifolia leaf extract: Characterization and evaluation of its antioxidant, bactericidal and anticancer activities. Microchem J. 2019;145:578–587. https://doi.org/10.1016/j.microc.2018.11.022
36. Nagarajan S, Arumugam Kuppusamy K. Extracellular synthesis of zinc oxide nanoparticle using seaweeds of gulf of Mannar, India. J Nanobiotechnol. 2013;11, Art. #39. https://doi.org/10.1186/1477-3155-11-39
37. Sutradhar P, Saha M. Green synthesis of zinc oxide nanoparticles using tomato (Lycopersicon esculentum) extract and its photovoltaic application. J Exp Nanosci. 2016;11(5):314–327. https://doi.org/10.1080/17458080.2 015.1059504
38. Lim YJ, Choi YE, Kang SW, Kim DY, Lee SH, Hahn YB. Vertical alignment of liquid crystals with zinc oxide nanorods. Nanotechnology. 2013;24(34), Art. #345702. https://doi.org/10.1088/0957-4484/24/34/345702
39. Eid MM. Characterization of nanoparticles by FTIR and FTIR-microscopy. In: Mallakpour S, Hussain CM, editors. Handbook of consumer nanoproducts. Singapore: Springer; 2022. p. 1–30. https://doi.org/10.1007/978-981-15-6 453-6_89-1
40. Stoia M, Istratie R, Păcurariu C. Investigation of magnetite nanoparticles stability in air by thermal analysis and FTIR spectroscopy. J Therm Anal Calorim. 2016;125:1185–1198. https://doi.org/10.1007/s10973-016-5393-y
https://doi.org/10.17159/sajs.2025/20104
41. Akintelu SA, Folorunso AS. A review on green synthesis of zinc oxide nanoparticles using plant extracts and its biomedical applications. BioNanoSci. 2020;10:848–863. https://doi.org/10.1007/s12668-020-00774-6
42. Mirza AU, Kareem A, Nami SA, Bhat SA, Mohammad A, Nishat N. Malus pumila and Juglen regia plant species mediated zinc oxide nanoparticles: Synthesis, spectral characterization, antioxidant and antibacterial studies. Microb Pathog. 2019;129:233–241. https://doi.org/10.1016/j.micpath.201 9.02.020
43. Azizi S, Ahmad MB, Namvar F, Mohamad R. Green biosynthesis and characterization of zinc oxide nanoparticles using brown marine macroalga Sargassum muticum aqueous extract. Mater Lett. 2014;116:275–277. https ://doi.org/10.1016/j.matlet.2013.11.038
44. Mahendra C, Murali M, Manasa G, Ponnamma P, Abhilash MR, Lakshmeesha TR, et al. Antibacterial and antimitotic potential of bio-fabricated zinc oxide nanoparticles of Cochlospermum religiosum (L.). Microb Pathog. 2017;110:620–629. https://doi.org/10.1016/j.micpath.2017.07.051
45. Kumar SS, Venkateswarlu P, Rao VR, Rao GN. Synthesis, characterization and optical properties of zinc oxide nanoparticles. Int Nano Lett. 2013;3(1), Art. #30. https://doi.org/10.1186/2228-5326-3-30
46. Mirza S, Hussaini AA, Öztürk G, Turgut M, Öztürk T, Tugay O, et al. Photocatalytic and antibacterial activities of ZnO nanoparticles synthesized from Lupinus albus and Lupinus pilosus plant extracts via green synthesis approach. Inorg Chem Commun. 2023;155, Art. #111124. https://doi.org/1 0.1016/j.inoche.2023.111124
47. Gülçin Ì, Şat İG, Beydemir Ş, Elmastaş M, Küfrevioǧlu Öİ. Comparison of antioxidant activity of clove (Eugenia caryophylata Thunb) buds and lavender (Lavandula stoechas L.). Food Chem. 2004;87(3):393–400. https://doi.org/ 10.1016/j.foodchem.2003.12.008
48. Faisal S, Jan H, Shah SA, Shah S, Khan A, Akbar MT, et al. Green synthesis of zinc oxide (ZnO) nanoparticles using aqueous fruit extracts of Myristica fragrans: Their characterizations and biological and environmental applications. ACS Omega. 2021;6(14):9709–9722. https://doi.org/10.1021 /acsomega.1c00310
49. Elufioye TO, Unachukwu CC, Oyedeji AO. Anticholinesterase and antioxidant activities of Spilanthes filicaulis whole plant extracts for the management of Alzheimer's disease. Curr Enzyme Inhib. 2019;15(2):103–113. https://doi.or g/10.2174/1573408015666190730113405
50. Vijayakumar N, Bhuvaneshwari VK, Ayyadurai GK, Jayaprakash R, Gopinath K, Nicoletti M, et al. Green synthesis of zinc oxide nanoparticles using Anoectochilus elatus, and their biomedical applications. Saudi J Biol Sci. 2022;29(4):2270–2279. https://doi.org/10.1016/j.sjbs.2021.11.065
51. Kandiah M, Chandrasekaran KN. Green synthesis of silver nanoparticles using Catharanthus roseus flower extracts and the determination of their antioxidant, antimicrobial, and photocatalytic activity. J Nanotechnol. 2021; 2021(1), Art. #5512786. https://doi.org/10.1155/2021/5512786
https://doi.org/10.17159/sajs.2025/20104
AuTHORS: Jessica Harris1 Sebnem Er1
AFFILIATION:
1Statistical Sciences Department, University of Cape Town, Cape Town, South Africa
CORRESPONDENCE TO: Sebnem Er
EMAIL: sebnem.er@uct.ac.za
DATES:
Received: 26 June 2024
Revised: 05 Feb. 2025
Accepted: 22 May 2025
Published: 29 Sep. 2025
HOW TO CITE:
Harris J, Er S. Pineapple fruit detection and size determination in a juicing factory in the Eastern Cape, South Africa. S Afr J Sci. 2025;121(9/10), Art. #18277. https: //doi.org/10.17159/sajs.2025/18277
Pineapple fruit detection and size determination in a juicing factory in the Eastern Cape, South Africa
This research presents a deep learning approach to determine pineapple size from images, to identify the instances of pineapples, and subsequently to extract fruit dimensions. This was achieved by first detecting pineapples in each image using a Mask region-based convolutional neural network (Mask R-CNN), and then extracting the pixel diameter and length measurements and the projected areas from the detected mask outputs. Various Mask R-CNNs were considered for the task of pineapple detection. The best-performing detector (Model 4: COCO Fliplr Res50) made use of MS COCO starting weights, a ResNet50 CNN backbone, and horizontal flipping data augmentation during the training process. This model achieved a validation AP@[0.5:0.05:0.95] of 0.914 and a test AP@[0.5:0.05:0.95] of 0.901, and was used to predict masks for an unseen data set containing images of pre-measured pineapples. The distributions of measurements extracted from the detected masks were compared to those of the manual measurements using two-sample Z-tests and Kolmogorov–Smirnov tests. There was sufficient similarity between the distributions, and it was therefore established that the reported method is appropriate for pineapple size determination in this context.
Significance:
• The methods we applied are traditional CNN models. Our main contribution is testing the application of different starting weights with multiple augmentation techniques used under different CNN backbones, ultimately comparing seven different model specifications of Mask R-CNNs.
• We have validated the results against manually measured fruits using statistical techniques and show that fruit size can be confidently determined from images instead of manual measurement, which is very labour and time intensive.
• The method developed is currently being used within a factory.
Introduction
In recent years, there has been an increased interest in the use of machine vision approaches in fruit industries.1,2 Object detection has played a crucial role in precision agriculture, enabling automated fruit counting, disease detection and yield estimation. Recent advancements in deep-learning-based object detection methods have significantly improved accuracy and efficiency in agricultural settings. Our study focused on the use of machine vision systems for fruit detection and measurement, particularly those making use of convolutional neural networks (CNNs).1
The development of a non-destructive pineapple fruit size determination approach based on images would be valuable in allowing the factory to obtain representative size data.1 This, in turn, would allow for a better understanding of the relationship between fruit size and juicing efficiency, which would better position factories to incentivise farmers to deliver optimally sized fruit by including a size-related factor into the pricing scheme.1
Fruit size is described by weight, or by some dimensional parameter such as length, diameter, volume, circumference, projected area, or some combination of these.1,3,4 In-field, size determination allows for yield prediction5,6 and can be used as a parameter in predicting optimum harvest time1,4. However, there is also a need for size determination post-harvest.1 Post-harvest size determination is important in several contexts, such as sorting fresh market fruits into size groups for packaging purposes, and for assigning prices.1 4 In the context of this work, the data were collected from a pineapple juicing factory in the Eastern Cape of South Africa, where size determination is not linked to any sorting activity, as all fruits are homogenised in the juicing process.1 However, the first processing step involves peeling of the pineapples, and it should be noted that the peelers remove a set width of peel from each pineapple, regardless of fruit size.1 Theoretically, this means that there is greater wastage with small fruits, as a larger percentage of the fruit is removed by the peeler.1 Hence, larger pineapple fruits with a lower ratio of peel to flesh are expected to have a higher juice yield per kilogram of fruit. In the context of this work, size determination is a necessary step towards being able to quantify the relationship between fruit size and juice yield.1
Considering the main aims of this study, there were two tasks that needed to be accomplished.1 The first task involved the training and evaluation of a pineapple detector, while the second task involved determining the fruit size based on the object mask output of the detector.1 Given these two tasks, two separate image data sets were used in this work.1
Methodology
The first task involved pineapple detection from images – an object detection problem. The goal of object detection is to locate all object instances in an image from a list of predefined classes.1,7 Hence, the problem involved both predicting the category and drawing a bounding box around each object in an image.1 A bounding box is the minimum-sized rectangular border that fully encloses an object and indicates its location within an image.1 Figure 1 illustrates the bounding box coordinates (x,y,w,h) of the object of interest in an image, including the (x, y)
coordinates of the centre of the box, as well as the height (h) and width (w) of the box.1 By convention, the top left corner of the image has (x, y) coordinates of (0, 0).1
While classification and localisation problems tend to have only one object per image, object detection problems may have multiple objects and multiple classes represented in a single image.1,8 If one of those objects appears in a given input image, an object detector should draw a bounding box around the object and predict the category of the object.1,7 In this study, we had multiple objects from a single class.
The methods of object detection were based on CNNs that work particularly well for processing data with a grid-like topology such as images1,9, where the same feature needs to be detected in multiple places within the grid1,10. Just like a fully connected feed-forward neural network, CNNs consist of an input layer, several hidden layers and an output layer, which are shown in stages in Figure 2. Colour images of dimensions (nH [0] × nW [0] × nC [0]), where H and W denote height and width, and C represents the red, green and blue (RGB) channels, are input into the network (l = 0, , L the layer is denoted with a superscript [0]). Fully connected feed-forward neural networks are not well suited to image classification, because an image of size 970 x 605 RGB has around 1.76 million pixel values as inputs to the network, which results in a large number of weights to be optimised, especially the weights from the input to the next layer. This process requires a very large data set with known classes, which is very impractical for an image classification problem. Moreover, such fully connected neural networks are prone to overfitting, which needs to be avoided by strict regularisation. CNNs, on the other hand, take advantage of image characteristics, such as spatial connectivity, to improve the overfitting and regularisation issues of fully connected feed-forward neural networks. The images pass through a series of sequential processing steps in the hidden layers1,11, which are also called
convolutional and pooling layers and perform feature extraction, while the fully connected layer is responsible for classification1,12
Convolutional layer
The convolution of the input image is implemented by using K filters of size f × f × nC [l], where f is the height and width of the filters, which are smaller than the input image. While filter weights can be predefined by the researcher, they are often the hyperparameters which are learned using back propagation. After the filtering, padding of zeros is applied to the input image by appending p rows and columns to retain the original image size and to prevent the width and the height of the output from shrinking at each layer. Finally, stride (s), the number of horizontal or vertical pixel steps a filter makes over the input matrix, is used to reduce the number of parameters learned. After this process of the convolution of an input image, the linear activations in the feature map are passed through a non-linear activation. Typical activation functions are sigmoid, hyperbolic tangent (tanh), rectified linear activation (ReLU) and Leaky ReLU functions used to solve the problem of vanishing gradients.9 The training time for the ReLU activation function has been found to be much shorter than those for the sigmoid and tanh functions.13
Pooling layer
The height and the width of the output of the convolutional layer are reduced by the pooling layer in all the channels independently, by aggregating the low-level features over a small neighbourhood defined by the window size and the stride, which are the predefined parameters of the pooling process. The main purpose of the pooling layer is to speed up computation as well as to prevent overfitting. The most frequently used pooling functions are maximum and average pooling functions.1 The representation is then flattened into a vector before the fully connected layer.1
Article
Figure 1: An image containing an object of interest (left), and the same image with a bounding box drawn around the object (right).
Figure 2: Structure of a convolutional neural network, showing the different types of layers and the dimensions of the data at each stage. Inspired by Gu et al.14
fully connected
Fully connected layer
The elements of the flattened vector are the nodes in one layer which are fully connected to the next layer. As in the fully connected neural networks, matrix multiplication is applied to the flattened vector.
Softmax layer
Finally, in the case of a classification task, a softmax layer with N nodes is used to classify images into one of N categories.1,13
The weights in the trainable filters are optimised using a backpropagation method which includes forward and backward propagation and weight update stages. The weights are initialised, generating a predicted class which is then compared to the actual classes using a loss function. The derivative of the loss function for each weight is computed via the chain rule to guide the weight update using gradient descent or other variations of gradient descent such as stochastic gradient descent, root mean square propagation (RMSProp), and adaptive moment estimation (Adam optimiser). Irfan et al.15 showed that Adam optimiser is superior in a classification problem, followed by RMSProp and stochastic gradient descent. The ultimate goal is to find the optimal weights that minimise the loss function. The process is repeated until a predefined number of iterations is reached or the change in loss function is negligible.
In this study, the number of objects per image was not known beforehand; therefore, a standard CNN could not be used for object detection, as it would have had a fixed-length output.1 However, the CNNs can be adapted, and therefore used for tasks other than classification. One such task is object detection.1 While classification identifies a single main object in an image, object detection and instance segmentation both involve identifying all individual objects of interest in an image containing multiple objects.1 In object detection, objects are classified and localised using bounding boxes, whereas in instance segmentation, all pixels belonging to an object are identified.1
Object detection frameworks
There are two major types of detection frameworks: region-based (twostage) and unified (one-stage) frameworks.1 7 Region-based frameworks (R-CNN, Fast R-CNN (RFCNN), Faster R-CNN, Mask R-CNN, Feature Pyramid Network (FPN), Relation Networks, Faster R-CNN+++, Deformable RFCNN, Cascade R-CNN, DCNv2+Faster R-CNN, PANet15) are referred to as two-stage frameworks as they involve first generating category-independent region proposals before applying a classifier to determine the category labels of the proposed regions.1 In contrast, one-stage detectors – You Only Look Once (YOLO)14,16-18 and its versions (YOLOv2-v8)19, single shot detection (SSD)20,21, Deconvolutional Single Shot Detector (DSSD), RetinaNet, M2Det, DCN, DCNv2, NAS-FPN, CornerNet512, EfficientDet and Fast-D – feed forward in a single pass1. As such, one-stage frameworks are often faster and more suited to online processing. Several review papers have been published that compare object detection frameworks in terms of advantages and disadvantages.20,22 However, an earlier study showed that one-stage frameworks had lower accuracy than two-stage frameworks.23
In our study, fruit detection and size determination were required for fruit quality evaluation. However, as no online sorting was required, a higher accuracy was desirable. As such, we used a two-stage detector. One of the earlier two-stage detectors is region-based CNN (R-CNN) that combines region proposals with CNNs.8,24 R-CNNs use a region proposal network to extract around 2000 region proposals from an input image. The rectangular window around each region is warped to 227 x 227 pixels before a large CNN is used to compute features for each region.1 Finally, each region is classified using class-specific linear support vector machines, and bounding box regression is used to update the bounding box coordinates.1
Another commonly used two-stage detector – Fast R-CNN – arose from extending R-CNN. With this detector, instead of processing each region of interest separately, the whole image is run through the CNN, resulting in a convolutional feature map that corresponds to the whole image.1 25 Fast R-CNN processes the entire input image with a CNN to produce a feature map. Region proposals are projected onto the feature map and resized using a region of interest pooling layer. Each region of interest
feature vector is passed through fully connected layers before branching into two output layers: one a softmax classifier and another that provides class-specific updated bounding box coordinates.1
While all the object detection methods discussed up to this point identify located objects using a bounding box, Mask R-CNN takes it a step further by predicting a pixel-level object mask indicating the location of each object.1,26 This is done by including a branch, in parallel to the one that performs bounding box regression and classification, which outputs a binary mask for each region of interest. As our main aim was to detect fruit size, we used Mask R-CNN, which predicts a pixel-level object mask indicating the location of each object.1 26
Fruit detection and classification
Several studies have applied CNN variants to detect occluded fruits, fruits on trees and fruits under low-light conditions, with the majority of studies focusing on apples, citrus and tomatoes. Fu et al.27 employed two Faster R-CNN based architectures (ZFNet and VGG16) for apple detection on trees with and without background trees. An average precision (AP) of 0.893 was achieved with VGG16 on the original images, and removing background trees improved the AP values. Fuentes et al.28 used SSD MobileNet to detect seedlings using data from six crops and four types of trays. The accuracy results for different types of crops and trays ranged from 57% to 96%. A study by Yang et al.29 proposed the BCo-YOLOv5 network model for fruit detection in orchards, with extensive experiments on citrus, apple and grape detection. Using YOLOv5s as the base model, the bidirectional cross-attention mechanism is integrated between the backbone and neck networks to strengthen feature relationships and to improve the low accuracy of fruit detection when the fruit is covered by leaves or the fruit target is too small. Yang et al.29 showed that the adapted method of the BCo-YOLOv5 network can effectively detect citrus, apple and grape targets in fruit images, with a 97.70% mean AP after training and testing. A survey study by Espinoza et al.30 outlined the different aspects of deep learning in the analysis of fruit images.
Research on the pineapple fruit industry has included crown detection, detection of ripe pineapples, fruit classification and pineapple quality detection. Cuong et al.31 used an improved version of the YOLO-v4 algorithm to determine when the pineapples were ripe. They used 5 000 000 pineapples harvested from a pineapple farm in Vietnam’s central region and achieved a 98.26% accuracy. Syazwani et al.32 used artificial neural networks and various machine-learning classifiers to identify and recognise the pineapple’s crown images and to count the fruits obtained from aerial images. They showed that an effective image analysis of the pineapples could be achieved with high accuracy (94.4%). Kanjanawattana et al.33 demonstrated the use of AlexNet to classify pineapples into four different sweetness levels from photos and achieved an accuracy of 91.78% and an F1 score of 92.31%. Liu et al.34 proposed an improved YOLO-v3 model by adding modifications on the backbone network and compared the detection result of this method against YOLOv3, Faster-RCNN and Mobilenet-SSD, showing that the improved YOLOv3 model performed the best. Chang et al.35 proposed the use of YOLO-v2 for detecting harvestable (ripe and ripening) and unharvestable (unripe) pineapples from single pineapple image data collected in the field for offline training. The proposed method achieved an accuracy of 95%. Most of these studies achieved high accuracy rates with different detectors and backbones used. These studies show that YOLO and its versions are the most commonly tested algorithms in fruit detection problems with varying environments and lighting conditions. Despite advancements, object detection in agriculture still faces the challenges of high computational cost and limited generalisation to new environments due to data set related differences. Apart from these, the lack of explainability and the high cost of implementation of these models limit the use of these deep learning methods by farmers. In recent years, we have seen many advancements in improving pineapple detection and classification methods, such as the integration of RGB images with thermal imagery with the use of unmanned aerial vehicles that can collect RGB, thermal and hyperspectral data.36 The high computational cost is dealt with through the use of lightweight models such as YOLO-v8 for mobile deployment. Furthermore, there have been attempts to remove the domain dependency by knowledge transfer from different fruit data
https://doi.org/10.17159/sajs.2025/18277 Research Article
sets. In light of these advances, there are still very limited use cases in South Africa in the pineapple industry. The aim of this research was to raise awareness of the accurate use of these automated systems.
Data
The image data used in this study came from a pineapple juicing factory in the Eastern Cape of South Africa, where two conveyor belts carry the fresh pineapples into the factory for processing.1 Video footage was collected during March–June 2020 using two progressive scan CMOS cameras (Hikvision DS-2CD2145FWD-I(S)) located above the two conveyor belts (Camera A and Camera B) delivering pineapples to the factory and positioned directly overhead and parallel to the belts to prevent perspective distortion.1 VLC Media Player37 was used to extract images from the video footage and the OpenCV library38 was used to crop the images to a size of 970 x 605 pixels1. In total, 160 images of size 970 x 605 pixels were extracted from the video footage.
These 160 images were randomly split into training, validation and test sets, ensuring that each set contained an equal number of images from each camera.1 A 70/20/10 per cent split was chosen for the training, validation and test sets.1 Due to resource limitations, only one validation set was used, rather than cross-validation. All images in the training set contained at least one fruit, and a total of 2138 pineapples were then manually labelled using the open-source VGG Image Annotator39 – a tool used to draw polygon shapes around objects (Figure 3)1
In all cases, the polygon tool was used at 2.5x level zoom. VGG Image Annotator39 is a convenient tool as it runs in a web browser and does not require any installation or setup. The final output is a json file with the coordinates of each polygon shape. These polygon shapes are used to define the pixel-level binary masks required for training a Mask R-CNN: points located within the polygon are set to a value of one, indicating that an object is present at that location in the image, while pixels outside the polygon are set to zero.1
The number of pineapples per image varied between 2 and 30, with the number of pineapples per image being fairly similar throughout the three subsets.1 As the main aim of this research was to determine pineapple fruit size from images, it was necessary to assess whether the fruit size obtained from images was sufficiently similar to the fruit size obtained by manual measurement of each pineapple.1 Hence, for evaluation of the size determination approach, we obtained images of 120 pineapples that had previously been manually measured.1 The 120 pineapples had been pre-measured manually using a calliper system. The length and width of each fruit were recorded, as well as the weight, which was
measured using a balance (CAS PR PLUS, accurate to 0.002 kg) for further evaluation.1
Implementation
Several instance segmentation models were considered in this work. The pineapple detection performance was assessed with respect to transfer learning using pretrained COCO and ImageNet weights, the choice of CNN backbone and data augmentation techniques.1
Transfer learning using pretrained COCO and ImageNet weights
In computer vision tasks, it has become common practice to pretrain a CNN on a large data set and then transfer the learned features to a new task that has a smaller number of labelled examples40 and fine tune it for the new task.1 In many cases, starting weights are readily available for different network architectures, particularly those pretrained on the ImageNet41 and MS COCO42 databases, which are commonly used in image recognition tasks1. ImageNet, for example, contains 1000 object classes and more than 1.2 million images43, while MS COCO contains 1.5 million object instances from more than 330k images1 44. Neural network architectures that perform well on a given computer vision task often perform well on other computer vision tasks, as many of the features learned during training, particularly lower-level features, are applicable across multiple applications.1 Tuning an existing architecture using its pretrained weights instead of random weight initialisations can reduce the time and computation requirements.1 In this study, these pretrained weights were used to initialise the parameters of the network before training on a new task. While low-level features are likely to be similar across different data sets, higher-level features learned by deeper layers in the CNN network are more specific to the task at hand.1 40 45 Therefore, the performance of an object detector is affected by the similarity of the new target classes to the base classes used for pretraining.1 45 In this study, we initially investigated the performance of the models with COCO and ImageNet weights and thereafter decided which weights to use with different suitable networks (backbones).1
Choice of CNN backbone
A CNN backbone is the feature extraction part of the network which takes an input image and extracts features before passing them to later layers. There are various types of backbones specific to object detection and instance segmentation, such as AlexNet, VGGs, ResNets, Inceptions, Xception, DenseNets, Inception-ResNet, ResNeXt, SqueezeNet, MobileNet, EfficientNet, RegNet, and many others.46,47 Differences, and advantages and disadvantages of each network are detailed in Elharrouss et al.46 The choice of CNN backbone is mainly decided based on the Matterport Mask
Figure 3: Screenshot showing annotation using the open source VGG Image Annotator tool.39 Polygons were drawn around each pineapple visible in the image.1 Two sections of the conveyor belt are visible in each frame.1
R-CNN48 implementation1. In this work, ResNet-50 and ResNet-101 CNN backbones were chosen.1 A ResNet is a residual network, characterised by residual blocks containing shortcut connections that perform identity mapping.1 49 Prior to the introduction of ResNet, very deep networks suffered from a problem of vanishing gradients, which resulted in deeper networks having higher training errors than their shallower counterparts.1 However, the introduction of residual blocks ensures that information from earlier layers is retained.1,49 ResNet-50 and ResNet-101 have similar structures, with both employing the concept of residual blocks; however, ResNet-50 has 50 layers, while ResNet-101 has 101 layers.1 The models initialised with COCO weights were implemented with ResNet-50 and ResNet-101 backbones. Thereafter, data augmentation techniques were applied to the chosen weights and CNN backbone.1
Data augmentation techniques
Data augmentation techniques are applied in cases in which not much labelled training data is available.1 This is a common method to avoid overfitting on the available data to artificially enlarge the data set, and the variability thereof, using label preserving transformations13 40 and can be performed using a Python library such as imgaug (image augmentation for machine learning experiments).1 Frequently used augmentation techniques include horizontal mirroring, random cropping, rescaling and colour shifting.1,40 Distortions to the colour channel help the model become more resistant to changes in illumination.1 While it is possible to use data augmentation to expand the data set with copies of the augmented versions, it is preferable to randomly augment the data with each training epoch.1 40 We investigated the effect of Gaussian blurring and noise, horizontal flipping and colour shifting augmentation techniques1 and discuss the performance of the different models considered using validation and test sets in the next section.
Results and discussion
The aim of the first task in this study was to train an instance segmentation model to effectively localise pineapples within images.1 To this end, several Mask R-CNN models, as described in Table 1, were considered and were assessed using several evaluation metrics such as multitask loss, intersection over union (IoU) and AP.
During the training of Mask R-CNN, a multitask loss is defined for each region of interest. The multitask loss (Equation 1) is the combination of the losses associated with the tasks of classification (Lcls), localisation (Lbbox) and instance segmentation (Lmask)1 25:
L = Lcls + Lbbox + Lmask
IoU is another metric that can be used to describe how similar the predicted bounding box is to the groundtruth bounding box. IoU is defined as the ratio between the intersection (∩) and union (∪) of the predicted bounding box (BP) and the groundtruth bounding box (BGT), as shown in Equation 21 50 51:
IOU = Area { BP ∩ BGT} Area { BP ∪ BGT}
Equation 2
where 0 ≤ IoU ≤ 1. The IoU is essentially a measure of the overlap of the predicted bounding box and the groundtruth bounding box.1 A perfect detection would have an IoU of one, while a predicted bounding box that does not overlap at all with the groundtruth bounding box will have an IoU of zero.1 The IoU is used to determine whether a detection is a true positive or false positive.51 A predicted bounding box is considered to be a true positive if the IoU is greater than some user-defined threshold, usually at least 0.5.1 50 For a given IoU threshold, the true positive (TP) and false positive (FP) predictions can be used to determine the recall (Equation 3) and precision (Equation 4)1:
R ecall = TP TP + FN
Precision = TP TP + FP
Equation 3
Equation 4
Recall is the true positive rate divided by the ratio of true positive predictions to the number of actual (groundtruth) positives, while precision is a measure of how many of the positive predictions are true positives.1 Each predicted bounding box has an associated confidence level, which can be used to rank the output.1 50 A precision/recall curve can then be computed from the ranked output.1 50 The AP summarises the shape of the precision/recall curve.1 50 The MS COCO Benchmark challenge averages the AP over a range of IoU values, from 0.50 to 0.95 at intervals of 0.05, denoted as AP@[0.50:0.05:0.95]. This rewards detectors with better localisation. In this work, the MS COCO metric was used to evaluate the performance of object detectors.1
To investigate the effect of employing different CNN backbones, a combination of the previous implementation structures was investigated.1 The setup of different models is provided in Table 1
The first three models in Table 1 have no augmentation applied to the data sets. The main decision is based on starting weights and CNN backbone. The training and validation losses associated with Model 2, initialised with COCO pretrained weights, are considerably lower than those of Model 1, which was initialised with ImageNet weights.1 This may be due, in part, to the fact that the ImageNet data set has an average of only 1.5 objects per image, while the COCO data set has an average of 7.3 objects per image, which is more comparable to the average number of objects per image in the pineapple data set (an average of 13.4 pineapples per image).1
The AP performance of the two models on the validation set is summarised in Table 2.1 Both models have a ResNet101 CNN backbone without data augmentation and performed well in terms of AP@0.51. However, the COCO-initialised model, COCO NoAug Res101,
Table 1: Different model specifications for the investigation of different convolutional neural network (CNN) backbones1
1
5 COCO_GaussNB_Res50
flip
Res50 Gaussian noise and blur
6 COCO_Colour_Res50 COCO Res50 Lightening and darkening
7 COCO_All_Res50
of the above
Table 2: Validation average precision (AP) summary of two Mask region-based convolutional neural networks (R-CNNs) for pineapple detection trained using different transfer learning procedures.1 Model 1 was initialised with ImageNet starting weights, while Model 2 was initialised with MS COCO starting weights.1
IoU, intersection over union
Table 3: Validation average precision (AP) summary of two Mask region-based convolutional neural networks (R-CNNs) for pineapple detection with different CNN backbones.1 Model 2 has a ResNet101 backbone, while Model 3 makes use of ResNet50 architecture.1 Both models were initialised with MS COCO starting weights and did not employ data augmentation.1
IoU, intersection over union
achieved an AP@[0.50:0.05:0.95] value of 0.892, compared to the ImageNet-initialised model, ImageNet NoAug Res101, which achieved an AP@[0.50:0.05:0.95] value of 0.860.1 As the MS COCO features were better suited to the task of identifying pineapples, these were chosen as starting weights for all subsequent networks.1
A comparison of the AP performance of Model 2 (COCO NoAug Res101) and Model 3 (COCO NoAug Res50) (Table 3) shows that both models performed well in terms of AP@0.5.1 Interestingly, Model 3 (COCO NoAug Res50) performed almost as well as its larger counterpart in terms of AP@[0.50:0.05:0.95] (Table 3), achieving a value of 0.884, compared to Model 2 (COCO NoAug Res101), which achieved an AP@ [0.50:0.05:0.95] value of 0.892.1 As Model 3, with its smaller CNN backbone, had comparable performance to that of the larger network, it was chosen for subsequent steps in this work.1 The remainder of the models considered were initialised using MS COCO starting weights and a Res50 CNN backbone with different augmentation techniques, such as horizontal flip, Gaussian noise and blur, lightening and darkening, and all the augmentation methods applied together. The use of data augmentation resulted in a decrease in both training and validation set losses, although all augmentation strategies appear to have a similar performance (Figure 4).1
A summary of the average training and validation set losses in Table 4 shows that Model 4 (COCO Fliplr Res50) had the lowest training loss and validation loss, on average.1 All models had a ResNet50 CNN backbone and were initialised with MS COCO starting weights.1 The average training and validation losses were calculated across all 30 epochs.1 For each model, the minimum validation loss is reported, together with the epoch in which the minimum value was achieved.1
Table 5 confirms that Model 4 had the best performance, with an AP@[0.50:0.05:0.95] of 0.914.1 Model 3 (COCO NoAug Res50) was considered the best model that did not make use of data augmentation, while Model 4 (COCO Fliplr Res50) was identified as the overall best pineapple detector considered in this work, based on validation AP values.1 As such, the performance of these two models on the withheld test set was evaluated.1 The pineapple detector Model 3 (COCO NoAug Res50) achieved a test AP@0.50 of 0.997 and a test AP@[0.50:0.05:0.95] of 0.874.1 However, as expected, Model 4 (COCO Fliplr Res50) improved upon this, achieving a test AP@[0.50:0.05:0.95] of 0.901.1
As Model 4 (COCO Fliplr Res50) was determined to be the best pineapple detector considered in this work, it was the model chosen for determining the size of pineapples from images.1 As such, Model 4
(COCO Fliplr Res50) was used to predict masks for pineapples in the previously unseen data set of pineapple images to post-validate the size determination approach.1 Two approaches to size determination were employed.1 The first approach involved extracting the diameter and length of pineapples from the predicted masks. In this approach, the Mask R-CNN trained to identify pineapples was used to predict masks for pineapples in the previously unseen data set of pineapple images.1 The model outputs a binary mask for each detected object and OpenCV library’s38 findContours() function was first used to extract the coordinates of the points describing the polygon outline of the binary mask.1 After the coordinate extraction, the minAreaRect() function was used to find the diameter and length measurements of each fruit by fitting a minimum area rotated rectangle to the mask.1 The dimensions obtained by manual measurement using callipers were compared to the dimensions extracted from the predicted object masks by visual inspection and by performing a Z-test and a two-sample Kolmogorov–Smirnov test.1 Beyond visual assessments which revealed similarity, for both the fruit diameter and fruit length, two-sample Z-tests were used to indicate whether the mean of the dimensions obtained by manual measurement was equal to the mean of the dimensions extracted from the predicted object masks.1 The two-sample Z-tests for both the mean diameter and mean length had very high p-values (p >> 0.10), indicating that there is not enough evidence to suggest that the two population means are different.1
To further investigate whether the distribution of predicted fruit dimensions was the same as the distribution of actual, hand-measured dimensions, we considered the empirical cumulative distribution functions shown in Figure 51. Visually, the empirical cumulative distribution functions for the predicted measurements seem similar to those of the actual measurements.1
A two-sample Kolmogorov–Smirnov test was performed to compare the measured and the predicted distributions of both the pineapple diameter and the length measurements. The two-sample Kolmogorov–Smirnov test showed that the distributions of the measured and predicted diameters were found to have a Kolmogorov–Smirnov value of 0.083, and a p-value of 0.801.1 As the Kolmogorov–Smirnov test had a high p-value (p >> 0.10), there is not enough evidence to reject the null hypothesis that the two distributions are equal.1 According to this test, the difference between the two distributions is not significant enough to say that they are explicitly different.1 The two-sample Kolmogorov–Smirnov test showed that the distributions of the measured and predicted lengths were found to have a Kolmogorov–Smirnov value of 0.058, and a p-value of 0.987.1 The high p-value indicates that there is not enough
Figure 4: Training and validation set losses for Mask region-based convolutional neural networks (R-CNNs) employing different data augmentation strategies.1 Training losses are shown in the top panel, while validation losses are shown in the bottom panel. Models 4–7 were trained using data augmentation and had lower training and validation losses than Model 3, which did not make use of data augmentation.1
Table 4: Summary of training and validation set losses for Mask region-based convolutional neural networks (R-CNNs) using different data augmentation strategies1
7 COCO_All_Res50
evidence to reject the null hypothesis that there is no difference between the two distributions.1 Therefore, from both tests we conclude that the measured and predicted diameters and lengths are similar.
The second approach to size determination involved finding the projected area of each fruit.1 As the mask output of the Mask R-CNN model contains a binary mask for each object instance, this can be achieved by summing pixels over each mask layer.1 To evaluate this method, the
pixel area of the detected mask was compared to the pixel area of the hand-labelled groundtruth mask.1 As the groundtruth mask is labelled by a human using VGG Image Annotator39, this method gives an indication of the best human performance in terms of determining fruit size from images.1 Moreover, as the predicted masks are being compared to the groundtruth masks rather than the actual fruit measurements, differences in metrics should not arise due to the orientation problem when some pineapples stand upright.1 In these cases, the longitudinal
Table 5: Validation average precision (AP) summary of Mask region-based convolutional neural network (R-CNN) pineapple detectors employing different data augmentation strategies during training.1 All models had a ResNet50 CNN backbone and were initialised with MS COCO starting weights. For each model, the weights associated with the epoch with lowest validation loss were used to determine the AP.1
5: Empirical cumulative distribution functions for the scaled diameter (left) and scaled length (right).1 The dimensions obtained by manual measurement using callipers are shown by the blue lines, while the dimensions obtained from the predicted object masks are shown in orange.1
section of the pineapple is not visible, resulting in underestimation of length measurements.1 Hence, in these kinds of images, comparison of the projected areas is useful, as the groundtruth area gives an indication of what the human performance would be in this task of determining fruit size from images.1
Similar tests have been applied to projected area comparisons and the two-sample Z-test for projected area had a fairly high p-value (p > 0.10), indicating that there is not enough evidence to reject the null hypothesis that the two population mean areas are equal.1 A two-sample Kolmogorov–Smirnov test showed that the distributions of the groundtruth and predicted projected areas were found to have a very small Kolmogorov–Smirnov value (0.117) with a high p-value (0.389)1
As the p-value is large, there is no strong evidence to indicate that the two distributions are not the same. The results achieved in this study were satisfactory; however, there were a few limitations, as discussed below.1
Summary and conclusion
We have presented an approach1 to determine pineapple size from images, using Mask R-CNN to identify the instances of pineapples and subsequently extract fruit dimensions using the OpenCV library38 Several Mask R-CNNs were trained on the pineapple data set. Analysis of transfer learning showed that Model 2 (COCO NoAug Res101), initialised with MS COCO features, performed better than Model 1 (Imagenet NoAug Res101), which was initialised with ImageNet weights.1 Both ResNet101 and ResNet50 CNN backbones were considered for the Mask R-CNN pineapple detector.1 It was found that Model 3, with the smaller ResNet50 backbone, performed almost as well as its larger counterpart.1 The pineapple detector Model 3 (COCO NoAug Res50) achieved a
satisfactory performance, with a validation AP@[0.50:0.05:0.95] of 0.884 and a test AP@[0.50:0.05:0.95] of 0.874.1 This performance was, however, improved upon by including data augmentation.1 Model 4, which made use of horizontal flipping during the training process (COCO Fliplr Res50), achieved a validation AP@[0.50:0.05:0.95] of 0.914 and a test AP@[0.50:0.05:0.95] of 0.901.1 Model 4 (COCO Fliplr Res50), having been identified as the best performing detector, was then used to predict masks for pineapples in the previously unseen data set of pineapple images, to post-validate the size determination approach.1 The distributions of the predicted fruit dimensions were found to be equal to the manually measured fruits using two-sample Kolmogorov–Smirnov tests.1 It was, therefore, established that this method is appropriate for pineapple size determination, in this context.1
While the results achieved in this work were satisfactory, there were a few limitations.1 Firstly, cameras were not installed at the same height as each other from the conveyor.1 If these heights were adjusted, the size determination accuracy could be increased.1 Secondly, a relatively small data set was used to train the Mask R-CNNs to detect pineapples.1 Additionally, these data were acquired using convenience sampling during a short period of time, due to delays associated with the start of the COVID-19 pandemic in 2020.1 While convenience sampling was used in this work, future work could employ an experimental design approach, incorporating data from different seasons, as well as night shifts.1 Utilising training data obtained throughout the year might provide a detector that is more robust to variation in seasonal colour changes.1 Finally, the training data could be extended to include different lighting conditions and examples of foreign objects that are sometimes deposited onto the conveyor belts along with the fruit.1 Foreign objects may damage the peeler, resulting in downtime
Figure
that negatively affects operating efficiency.1 If this could be implemented on a real-time basis, an auto-stop function could be incorporated to avoid damage to equipment.1 In future work, the size data obtained from images could be used in conjunction with information about the growing conditions of the pineapple plants to better understand the factors that affect fruit size, and to allow for more accurate yield predictions.1
Acknowledgements
We thank the factory Summerpride Foods (Pty) Ltd. in East London, South Africa, for installing the cameras and for their assistance throughout the data collection process. We also thank the reviewers for their invaluable insights, corrections and contributions that hugely improved the paper.
Data availability
The codes and the data sets generated and/or analysed during the current study are available in the ‘measure-pineapple’ Github repository: https://github.com/Jess-cah/measure-pineapple
Declarations
We have no competing interests to declare. We have no AI or LLM use to declare. This paper is based on a published master’s thesis1
Authors’ contributions
J.H.: Conceptualisation, methodology, investigation, sample analysis, formal analysis, validation, data curation, project leadership, project administration, writing – original draft, writing – review and editing. S.E.: Supervision, project leadership, project administration, writing – original draft, writing – review and editing. Both authors read and approved the final manuscript.
References
1. Harris J. Object detection and size determination of pineapple fruit at a juicing factory [master’s thesis]. Cape Town: University of Cape Town; 2021. https: //open.uct.ac.za/handle/11427/35596
2. Naranjo-Torres J, Mora M, Hernandez-Garcia R, Barrientos RJ, Fredes C, Valenzuela A. A review of convolutional neural network applied to fruit image processing. Appl Sci. 2020;10(10), Art. #3443. https://doi.org/10.3390/ap p10103443
3. Blasco J, Aleixos N, Molto E. Machine vision system for automatic quality grading of fruit. Biosyst Eng. 2003;85(4):415–423. https://doi.org/10.1016/ S1537-5110(03)00088-6
4. Moreda G, Ortiz-Canavate J, Garcia Ramos FJ, Ruiz-Altisent M. Nondestructive technologies for fruit and vegetable size determination – A review. J Food Eng. 2009;92(2):119–136. https://doi.org/10.1016/j.jfoodeng.2008. 11.004
5. Moonrinta J, Chaivivatrakul S, Dailey MN, Ekpanyapong M. Fruit detection, tracking, and 3D reconstruction for crop mapping and yield estimation. In: Proceedings of the 11th International Conference on Control Automation Robotics & Vision; 2010 December 7–10; Singapore. Singapore: IEEE; 2010. p. 1181–1186. https://doi.org/10.1109/ICARCV.2010.5707436
6. Koirala A, Walsh KB, Wang Z, McCarthy C. Deep learning for real-time fruit detection and orchard fruit load estimation: Benchmarking of ’MangoYOLO’. Precis Agric. 2019;20(6):1107–1135. https://doi.org/10.1007/s11119-01 9-09642-0
7. Liu L, Ouyang W, Wang X, Fieguth P, Chen J, Liu X, et al. Deep learning for generic object detection: A survey. Int J Comput Vision. 2020;128(2):261–318. https://doi.org/10.1007/s11263-019-01247-4
8. Girshick R, Donahue J, Darrell T, Malik J. Rich feature hierarchies for accurate object detection and semantic segmentation. In: O’Connor L, editor. Proceedings of the 2014 IEEE Conference on Computer Vision and Pattern Recognition; 2014 June 23–28; Columbus, OH, USA. Los Alamitos, CA: IEEE; 2014. p. 580–587. https://doi.org/10.1109/CVPR.2014.81
9. Goodfellow I, Bengio Y, Courville A. Deep learning. Cambridge, MA: MIT Press; 2016.
10. Trask AW. Grokking deep learning. Shelter Island, NY: Manning; 2019.
11. Wu J. Introduction to convolutional neural networks [document on the Internet]. c2017 [cited 2024 Jun 26]. Available from: https://project.inria.fr /quidiasante/files/2021/06/CNN.pdf
12. Zhao X, Wang L, Zhang Y, Han X, Deveci M, Parmar M. A review of convolutional neural networks in computer vision. Artif Intell Rev. 2024;57(4), Art. #99. https://doi.org/10.1007/s10462-024-10721-6
13. Krizhevsky A, Sutskever I, Hinton GE. ImageNet classification with deep convolutional neural networks. Commun ACM. 2017;60(6):84–90. https:// doi.org/10.1145/306538
14. Gu J, Wang Z, Kuen J, Ma L, Shahroudy A, Shuai B, et al. Recent advances in convolutional neural networks. Pattern Recognit. 2018;77:354–377. https:// doi.org/10.1016/j.patcog.2017.10.013
15. Irfan D, Gunawan TS. Comparison of SGD, RMSprop, and Adam optimization in animal classification using CNNs. In: Proceedings of the 2nd International Conference on Information Science and Technology Innovation; 2023 February 24–25; Yogyakarta: International Conference on Information Science and Technology Innovation (ICoSTEC); 2023. p. 45–51. Available from: https://icostec.respati.ac.id
16. Redmon J, Divvala S, Girshick R, Farhadi A. You only look once: Unified, real-time object detection. In: O’Conner L, editor. Proceedings of the 29th IEEE Conference on Computer Vision and Pattern Recognition; 2016 June 26 – July 01;Las Vegas, NV, USA. Los Alamitos, CA: IEEE; 2016. p. 779–788. https://doi.org/10.1109/CVPR.2016.91
17. Redmon J, Farhadi A. YOLO9000: Better, faster, stronger. In: O’Conner L, editor. Proceedings of the 30th IEEE Conference on Computer Vision and Pattern Recognition; 2017 July 21–26;. Honolulu, HI, USA. Los Alamitos, CA: IEEE; 2017. p. 7263–7271. https://doi.org/10.1109/CVPR.2017.690
18. Redmon J, Farhadi A. YOLOv3: An incremental improvement [preprint]. arXiv1804.02767; 2018. https://doi.org/10.48550/arXiv.1804.02767
19. Terven J, Córdova-Esparza DM, Romero-González JA. A comprehensive review of YOLO architectures in computer vision: From YOLOv1 to YOLOv8 and YOLO-NAS. Mach Learn Knowl Extr. 2023;5(4):1680–1716. https://doi. org/10.3390/make5040083
20. Lohia A, Kadam KD, Joshi RR, Bongale AM. Bibliometric analysis of onestage and two-stage object detection. Libr Philos Pract. 2021; Art. #4910. Available from: https://digitalcommons.unl.edu/cgi/viewcontent.cgi?article= 9123&context=libphilprac
21. Liu W, Anguelov D, Erhan D, Szegedy C, Reed S, Fu CY, et al. SSD: Single shot multibox detector. In: Leibe B, Matas J, Sebe N, Weiling M, editors. Proceedings of the 14th European Conference on Computer Vision; 2016 October 11–14;Amsterdam, the Netherlands. Cham: Springer; 2016. p. 21–37. https://doi.org/10.1007/978-3-319-46448-0_2
22. Kaur R, Singh S. A comprehensive review of object detection with deep learning. Digit Signal Process. 2023;132, Art. #103812. https://doi.org/10. 1016/j.dsp.2022.103812
23. Huang J, Rathod V, Sun C, Zhu M, Korattikara A, Fathi A. Speed/accuracy trade-offs for modern convolutional object detectors. In: O’Conner L, editor. Proceedings of the 30th IEEE Conference on Computer Vision and Pattern Recognition; 2017 July 21–26; Honolulu, HI, USA. Los Alamitos, CA: IEEE; 2017. p. 7310–7311. https://doi.org/10.1109/CVPR.2017.351
24. Girshick R, Donahue J, Darrell T, Malik J. Region-based convolutional networks for accurate object detection and segmentation. IEEE Trans Pattern Anal Mach Intell. 2015;38(1):142–158. https://doi.org/10.1109/TPAMI.201 5.2437384
25. Girshick R. Fast R-CNN. In: O’Conner L, editor. Proceedings of the 2015 IEEE International Conference on Computer Vision (ICCV); 2015 December 11–18; Santiago, Chile. Los Alamitos, CA: IEEE; 2015. p. 1440–1448. https://doi.or g/10.1109/ICCV.2015.169
26. He K, Gkioxari G, Dollar P, Girshick R. Mask R-CNN. In: O’Conner L, editor. Proceedings of the 2017 IEEE International Conference on Computer Vision (ICCV); 2017 October 22–29; Venice, Italy. Los Alamitos, CA IEEE; 2017. p. 2961–2969. https://doi.org/10.1109/ICCV.2017.322
27. Fu L, Majeed Y, Zhang X, Karkee M, Zhang Q. Faster R-CNN-based apple detection in dense-foliage fruiting-wall trees using RGB and depth features for robotic harvesting. Biosyst Eng. 2020;197:245–256. https://doi.org/10. 1016/j.biosystemseng.2020.07.007
Research Article
https://doi.org/10.17159/sajs.2025/18277
28. Fuentes-Peñailillo F, Carrasco Silva G, Pérez Guzmán R, Burgos I, Ewertz F. Automating seedling counts in horticulture using computer vision and AI. Horticulturae. 2023;9(10), Art. #1134. https://doi.org/10.3390/horticultura e9101134
29. Yang R, Hu Y, Yao Y, Gao M, Liu R. Fruit target detection based on BCo‐YOLOv5 model. Mobile Inf Syst. 2022;2022, Art. #8457173. https://doi.org/10.115 5/2022/8457173
30. Espinoza S, Aguilera C, Rojas L, Campos PG. Analysis of fruit images with deep learning: A systematic literature review and future directions. IEEE Access. 2023;12:3837–3859. https://doi.org/10.1109/ACCESS.2023.3345 789
32. Syazwani RW, Asraf HM, Amin MM, Dalila KN. Automated image identification, detection and fruit counting of top-view pineapple crown using machine learning. Alexandria Eng J. 2022;61(2):1265–1276. https://doi.org/10.101 6/j.aej.2021.06.053
33. Kanjanawattana S, Teerawatthanaprapha W, Praneetpholkrang P, Bhakdisongkhram G, Weeragulpiriya S. Pineapple sweetness classification using deep learning based on pineapple images. J Image Graphics. 2023; 11(1):47–52. https://doi.org/10.18178/joig.11.1.47-52
34. Liu TH, Nie XN, Wu JM, Zhang D, Liu W, Cheng YF, et al. Pineapple (Ananas comosus) fruit detection and localization in natural environment based on binocular stereo vision and improved YOLOv3 model. Precis Agric. 2023;24(1):139–160. https://doi.org/10.1007/s11119-022-09935-x
35. Chang CY, Kuan CS, Tseng HY, Lee PH, Tsai SH, Chen SJ. Using deep learning to identify maturity and 3D distance in pineapple fields. Sci Rep. 2022;12(1), Art. #8749. https://doi.org/10.1038/s41598-022-12096-6
36. Rodriguez-Vazquez J, Fernandez-Cortizas M, Perez-Saura D, Molina M, Campoy P. Overcoming domain shift in neural networks for accurate plant counting in aerial images. Remote Sens. 2023;15(6), Art. #1700. https://do i.org/10.3390/rs15061700
37. VideoLAN. VLC media player [software]. Version 3.0.9.2. Paris: VideoLAN; 2020. Available from: https://www.videolan.org/
38. Alekhin A, Aleksei T, Alexander N, Tulegenov A, Golubev A, Khakimova A, et al. OpenCV version 3.4.10 [software]. Available from: https://github.com /opencv/opencv
39. Dutta A, Zisserman A. The VIA annotation software for images, audio and video. In: Amsaleng L, Huet B, Larson M, editors. Proceedings of MM’19: The 27th ACM International Conference on Multimedia; 2019 October 21–25; Nice, France. New York: Association for Computing Machinery; 2019. p. 2276–2279. https://doi.org/10.1145/3343031.3350535
40. Bargoti S, Underwood J. Deep fruit detection in orchards. In: Okamura A, editor. 2017 IEEE International Conference on Robotics and Automation (ICRA); 2017 May 29 – June 03. Singapore: IEEE; 2017. p. 3626–3633. http s://doi.org/10.1109/ICRA.2017.7989417
41. Deng J, Dong W, Socher R, Li LJ, Li K, Fei-Fei L. ImageNet: A large-scale hierarchical image database. In: Proceedings of the 2009 IEEE Conference on Computer Vision and Pattern Recognition; 2009 June 20–25; Miami, FL, USA. Los Alamitos, CA: IEEE; 2009. p. 248–255. https://doi.org/10.1109/C VPR.2009.5206848
42. Lin TY, Maire M, Belongie S, Hays J, Perona P, Ramanan D, et al. Microsoft coco: Common objects in context. In: Proceedings of the 13th European Conference on Computer Vision; 2014 September 6–12; Zurich, Switzerland. Cham: Springer; 2014. p. 740–755. https://doi.org/10.1007/978-3-319-10 602-1_48
43. Fei-Fei L, Deng J, Russakovsky O, Berg A, Li K. ImageNet [homepage on the Internet]. c2020 [cited year 2020 Apr 01]. Available from: https://www.ima ge-net.org/
44. Lin TY, Patterson G, Ronchi MR, Cui Y, Maire M, Belongie S, et al. COCO: Common objects in context [homepage on the Internet]. c2015 [cited 2020 Apr 01]. Available from: https://cocodataset.org/#home
45. Yosinski J, Clune J, Bengio Y, Lipson H. How transferable are features in deep neural networks? In: Ghahramani Z, Welling M, Cortes C, Lawrence N, Weinberger KQ, editors. Proceedings of Advances in Neural Information Processing Systems 27 (NIPS 2014); 2014 December 08–13. Montréal, Canada. Red Hook, NY: Curran Associates, Inc; 2014. p. 1–9. Available from: https://proceedings.neurips.cc/paper_files/paper/2014/file/532a2f85b6977 104bc93f8580abbb330-Paper.pdf
46. Elharrouss O, Akbari Y, Almadeed N, Al-Maadeed S. Backbones-review: Feature extractor networks for deep learning and deep reinforcement learning approaches in computer vision. Comput Sci Rev. 2024;53, Art. #100645. https://doi.org/10.1016/j.cosrev.2024.100645
47. Haruna Y, Qin S, Chukkol AH, Yusuf AA, Bello I, Lawan A. Exploring the synergies of hybrid convolutional neural network and Vision Transformer architectures for computer vision: A survey. Eng Appl Artif Intell. 2025;144, Art. #110057. https://doi.org/10.1016/j.engappai.2025.110057
48. Abdulla W. Mask R-CNN for object detection and instance segmentation on Keras and TensorFlow [software]. Version 2.1; 2017. Available from: https:// github.com/matterport/Mask_RCNN
49. He K, Zhang X, Ren S, Sun J. Deep residual learning for image recognition. In: O’Conner L, editor. Proceedings of the 2016 IEEE Conference on Computer Vision and Pattern Recognition; 2016 June 26 – July 01; Las Vegas, NV, USA. Los Alamitos, CA: IEEE; 2016. p. 770–778. https://doi.org/10.1109/ CVPR.2016.90
50. Everingham M, Van Gool L, Williams CK, Winn J, Zisserman A. The Pascal visual object classes (VOC) challenge. Int J Comput Vision. 2010;88(2):303–338. https://doi.org/10.1007/s11263-009-0275-4
51. Rezatofighi H, Tsoi N, Gwak J, Sadeghian A, Reid I, Savarese S. Generalized intersection over union: A metric and a loss for bounding box regression. In: O’Conner L, editor. Proceedings of the 2019 IEEE/CVF Conference on Computer Vision and Pattern Recognition; 2019 June 16–20; Long Beach, CA, USA. Los Alamitos, CA: IEEE; 2019. p. 658–666. https://doi.org/10.11 09/CVPR.2019.00075
https://doi.org/10.17159/sajs.2025/18277 Research Article
Authors:
Aidan Bossert1,2
Katie M. Watson1
Andrew Ndhlovu1 2 Sophie von der Heyden1 2
AFFILIAtIoNs:
1Evolutionary Genomics Group, Department of Botany and Zoology, Stellenbosch University, Stellenbosch, South Africa 2School for Climate Studies, Stellenbosch University, Stellenbosch, South Africa
CorrEsPoNDENCE to: Sophie von der Heyden
EMAIL: svdh@sun.ac.za
DAtEs:
r eceived: 08 Aug. 2024
r evised: 26 May 2025
Accepted: 04 June 2025
Published: 29 Sep. 2025
hoW to CItE:
Bossert A, Watson KM, Ndhlovu A, von der Heyden S. Ex-situ mariculture can support the restoration of the endangered seagrass Zostera capensis. S Afr J Sci. 2025;121(9/10), Art. #19767. https: //doi.org/10.17159/sajs.2025/19767
South African National Research Foundation (NRF) Marine and Coastal Research grant (UID 136488), Sasol-NRF collaborative grant (UID 138614)
Ex-situ mariculture can support the restoration of the endangered seagrass Zostera capensis
Seagrass meadows face ongoing declines and are increasingly targeted for restoration. Traditional in-situ restoration techniques involve trade-offs between restoration success and donor meadow impacts. To overcome these challenges, we provide the first assessment of ex-situ mariculture of the endangered seagrass Zostera capensis to support its restoration in South Africa. Seagrass cores with diameters of 5 cm and 10 cm, including their sediment, were harvested and grown in mariculture pools for 195 days. Changes in seagrass leaf length (cm) and shoot density (cm2) were monitored and the effect of core size on these morphometrics was investigated. Core size had a significant effect on seagrass shoot density and leaf length, as smaller cores had lower shoot densities and leaf lengths over time, suggesting that larger cores might be more effective to maximise seagrass cover during ex-situ mariculture. Overall, shoot densities saw limited increases for the first nine days, followed by a large percentage increase between days 9 and 24, before growth remained steady until peak shoot density was reached between days 100 and 124. Leaf lengths gradually increased until peaking between days 100 and 124. This study successfully demonstrates the proof of concept that ex-situ mariculture can sustainably upscale Z. capensis restoration by increasing the amount of plant material available for re-transplantation. To build on the work presented here, we provide a framework, incorporating guidance from published literature, to advise future seagrass restoration trials.
significance:
Seagrass restoration often involves trade-offs between the volume of seagrass harvested for translocation, restoration success and impacts on donor sites. Ex-situ mariculture reduces disturbance to donor sites and increases restoration scalability by increasing transplantable seagrass biomass beyond that which was initially collected. The first successful proof of this concept for the endangered Zostera capensis is presented to illustrate how seagrass mariculture will prove to be an important tool for maintaining seagrass meadows into the future.
Introduction
Globally, seagrass populations are declining due to cumulative anthropogenic pressures, resulting in an estimated loss of ~19% of their global extent.1 Concerningly, population loss and habitat disturbance reduce seagrass ecosystem service provision.2 As such, management strategies aimed at restoring seagrass meadows are urgently needed3, with effective in-situ restoration, via transplantation, shown to be possible4. For example, the largest seagrass restoration project was completed in Virginia, USA, where 7 km2 of Zostera marina meadows were restored.5 Advances in seagrass restoration may support seagrass ecosystem service provision, with Lange et al.6 suggesting that restored Z. marina meadows are capable of storing ~33 g C/m2 per year post-restoration, whilst McSkimming et al.7 found that faunal richness and abundance of restored Amphibolis antarctica meadows was comparable to that of healthy natural meadows one year post-transplantation.
Unlike rehabilitation, which refers to the natural recolonisation and establishment of seagrass meadows, restoration has been defined by Tan et al.4 as active intervention aimed at returning degraded habitats to a state which resembles the natural condition, and often involves the physical planting of seagrasses and/or their seeds. In this study, the term seagrass restoration was used to encompass the physical growth and re-planting of seagrass material into habitats from which seagrasses had been lost. Despite the successful implementation of in-situ seagrass restoration projects (see, for example, Lange et al.6 and Watson et al.8), some projects require large amounts of seagrass biomass to be harvested, which can damage donor meadows and, in the case of unsuccessful transplantation, negatively impact overall seagrass cover.9 As such, there is a trade-off between the amount of seagrass harvested for transplantation, restoration success and the impact on donor sites.10
Ex-situ seagrass mariculture provides an ecologically sustainable means to optimise and upscale seagrass restoration by increasing the amount of plant material available for transplantation through the growth of seagrass in aquarium facilities10, which minimises disturbance to donor sites by reducing the amount of donor material collected (Figure 1). Previous ex-situ seagrass growth experiments have predominantly focused on germinating new plants from seeds or cuttings, whilst using increased leaf length (cm) and relative shoot density to characterise successful growth.11-13 Monitoring changes in leaf length and shoot density is important, as these growth metrics can serve as an indication of the future ecosystem service provisioning capacity of seagrass post transplantation. For example, increased canopy complexity (leaf length and shoot density) can reduce hydrodynamic energy, thus minimising sediment resuspension, improving water filtration and forming muddy carbon-capturing soils.14 Despite studies providing evidence for the successful ex-situ propagation and growth of some seagrass species from seeds, such as Enhalus acoroides11 and Posidonia australis12, this method is not feasible for species lacking an abundant and consistent supply of seeds. As such, the ex-situ mariculture of such species, including Zostera capensis, will rely on the cultivation of harvested plant material from in-situ seagrass meadows. Thus far, to our knowledge,
Figure 1: Ex-situ mariculture, in comparison to in-situ translocation, allows for the sustainable upscaling of seagrass restoration by increasing the amount of plant material available for transplantation, whilst minimising damage to the donor.
ex-situ mariculture of wild harvested seagrass has only been employed for Z. marina15, and it remains unclear whether it is a viable strategy for seagrasses elsewhere globally.
In southern Africa, anthropogenic stressors have led to localised extinctions of the endangered Cape dwarf-eelgrass, Z. capensis.16 17 Further, a population loss of 33% (~742 ha) in South Africa16 18 highlights the need for interventions through restoration to reverse population declines and preserve seagrass ecosystem services.15 Seagrass restoration in southern Africa has little evidence and support, with only three recent studies, with variable outcomes.8,9,19 Transplantation of three different core sizes in two South African estuaries by Mokumo et al.9 resulted in failed transplantation efforts, due to flooding and likely sedimentation of transplantation sites during winter, with no transplants surviving after 12 weeks. In contrast, Amone-Mabuto et al.19 in Maputo Bay, Mozambique and Watson et al.8 in Langebaan Lagoon, South Africa showed survival and spread of transplanted cores over 18 months. Interestingly, Z. capensis has rarely been observed with seeds, and it is likely that this seagrass strongly relies on asexual reproduction.16,20,21
In this article, we present the first attempt of ex-situ seagrass mariculture for Z. capensis globally, by testing the potential for using mariculture as a means to upscale and optimise Z. capensis restoration practices, via ex-situ growth of donor seagrass material. Beyond testing a basic proof of concept, we also assessed the effect of core size on seagrass shoot density and leaf length change over time. We hypothesised that seagrass cores would increase in shoot density and leaf length over time, and, because Amone-Mabuto et al.19 found that larger cores exhibited increased survival rates, we expected larger cores to have higher shoot densities and leaf lengths. Finally, we used the results of this study and those of previous restoration trials, both in South Africa and elsewhere internationally, to develop a framework that can guide future seagrass mariculture efforts globally.
Methods
Seagrass collection study site
Seagrass plants were collected from monospecific intertidal meadows of Z. capensis at Langebaan Lagoon (33°08’42.3”S, 18°03’43.0”E; Figure 2), situated in the cool-temperate bioregion along the South African west coast.16 Langebaan Lagoon is an important conservation area in the West Coast National Park, recognised nationally and internationally as a Marine Protected Area and Ramsar Site22 23 , supporting one of the largest seagrass populations in South Africa (~335 ha24). Zostera capensis cover has declined across the lagoon,
with a prolonged loss of ~38% between 1960 and 2009.25 Declines are likely linked with the construction of the adjoining Saldanha Bay Harbour26, including the associated dredging practices, which altered the hydrodynamics of the lagoon and increased the sediment load in the water column27. At local scales, habitat disturbance from bait harvesting and trampling, particularly from kite surfing, are the main drivers of seagrass loss.25
Harvesting donor seagrass material
Intertidal seagrass cores were collected from Centre Banks (Figure 2), as this site has a relatively stable and expansive area of seagrass which has experienced minimal fluctuations in population size over the last 8 years.24 Cores were randomly harvested at 5 m intervals during low tide, using two polyvinyl chloride (PVC) corers (Supplementary figure 1a) of 5 cm and 10 cm diameters, each to a depth of 10 cm, with 24 samples per core size collected (n = 48 cores in total). Cores were placed into plastic pots lined with 100% cotton cloth, which were then placed into plastic planting containers (20 cm x 15 cm x 10 cm) and filled with unvegetated sediment from the donor site (Supplementary figure 1b). All pots and sediment-filled containers were transported to the mariculture facility at Stellenbosch University (Supplementary figure 1c).
Mariculture design and seagrass growth assessments
At the mariculture facility, which was housed in a covered greenhouse, four pools (INTEX®, W 1.2 m x L 1.2 m) were filled to a depth of 40 cm with 250 L of artificial seawater (Red Sea Salt) and 50 L of seawater collected from Langebaan Lagoon, to supply the plants with nutrients from their in-situ microbiome. The sediment-filled planting containers were then placed into the pools (Figure 3a). Each pool housed 12 planting containers, with six planting containers per core size (n = 48 cores in total, 24 per core size; Figure 3b). Salinity was maintained at 35 PSU and monitored twice a week using a handheld Red SeaTM Seawater refractometer. Each pool contained four ViaAqua aquarium glass heaters (150 W) to ensure that water temperature did not fall below 21 °C; Thermochron iButtons were used to monitor water temperature (which ranged from 21 °C to 25 °C). Mesocosm conditions broadly reflected those experienced by the plants in their natural environment. Each pool was provided with five Dophin® C1600 Canister Filters and water pumps for aeration and filtration, which were cleaned weekly. Algae and dead leaves were removed by hand each week and a 20% water change (water purified through reverse osmosis made into a saline mixture of 35 PSU with Red Sea Salt) was performed. Additional light was provided by LEAF plant lights which were set to emit full spectrum
light (~303 μmol/m2s) for a 12:12 h light cycle. Seagrass growth was monitored for a period of 195 days, using measures of leaf length and shoot density. Here, we loosely use growth to describe changes over time in both shoot density and maximum mean leaf length. Leaf length was calculated by averaging the measurements of three of the longest leaves for each container, whilst shoot density was determined as the number of shoots per square centimetre. A monitoring protocol was established: at first, monitoring was conducted weekly for the first 53 days (except for between days 9 and 24), thereafter, monitoring was performed fortnightly for the remainder of the cultivation period (except for between days 100 and 124).
Statistical analyses
All statistical analyses were conducted using R Studio (version 4.3.2).28 Prior to analyses, tests for normality and homoscedasticity were carried out using residual diagnostic plots as well as Shapiro–Wilk and Levene’s tests, respectively. To investigate the effect of core size on seagrass shoot density (number of shoots per square centimetre) and leaf length (cm) across all pools, linear mixed models were performed using the lmer function in the Lme4 package (version 1.1-35.4).29 The optimal model structure was determined by selecting the model with the lowest Akaike’s information criterion (AIC) value, following an assessment using
the anova function. The optimal model included the response variables core size and pool as fixed factors, and the random effects of monitoring timepoint (number of days since transplantation as monitoring was temporally staggered post-transplantation) and planting container, as well as the interactive effect of core and pool. The main effects and the interactive effect of the model were assessed, with the ggplot2 package used for all graphical presentations.
r esults
Seagrass shoot density and mean leaf length changes over time
The first nine days of the experiment saw limited shoot density increases, followed by a large percentage increase between days 9 and 24, before growth remained steady until peak shoot density was reached between days 100 and 124. Similarly, leaf length demonstrated consistently gradual increases until maximum growth was reached between days 100 and 124, despite a decrease between days 31 and 39 and a large increase between days 53 and 68. Average seagrass shoot density for the 5 cm diameter cores was initially 0.04 ± 0.02 shoots/cm2 (Figure 4a) and showed a ~200% increase (Figure 4b) in 100 days to reach 0.12 ± 0.07 shoots/cm2, decreasing to 0.06 ± 0.04 shoots/cm2
Figure 2: Location of the donor site at Centre Banks (orange triangle; 33°08’42.3”S, 18°03’43.0”E) in Langebaan Lagoon. Inset: Location of Langebaan Lagoon in South Africa. Data from Watson24
Figure 3: Mariculture facility experimental setup (a), with a depiction of the spatial arrangement of seagrass core sizes (b).
4: Mean changes in seagrass shoot density (a) and leaf length (c) as well as the relative percentage changes in seagrass shoot density (b) and leaf length (d) from one monitoring period to the next, across a 195-day period.
at the end of the experiment. Comparatively, average shoot density for the 10 cm diameter cores was initially 0.05 ± 0.02 shoots/cm2 (Figure 4a) and demonstrated a ~300% increase (Figure 4b) to reach 0.20 ± 0.12 shoots/cm2 after 100 days, but also decreased to 0.08 ± 0.06 shoots/cm2 at the end of the experiment. The mean seagrass leaf length of the 5 cm and 10 cm diameter core sizes started at 12.94 ± 3.52 cm and 14.11 ± 3.33 cm, respectively (Figure 4c), before increasing by ~167% to 34.59 ± 5.04 cm and ~154% to 35.90 cm ± 3.33, respectively, after 100 days (Figure 4d), with both decreasing towards the end of the experiment to 19.35 cm ± 6.09 and 20.65 cm ± 6.70, respectively. Overall, both shoot counts and leaf lengths indicated peak growth was achieved between 100 and 124 days, after which shoot count and leaf length declined until the end of the experiment on day 195 (Supplementary figure 2 and Supplementary figure 3).
Effect of core size
Core size had a significant (p < 0.005, X2 = 8.50, d.f. = 1) effect on seagrass shoot density (Supplementar y table 1), as smaller cores had lower shoot densities over time in comparison to larger cores (Figure 4). Further, the effect of pool (p < 0.005, X2 = 38.55, d.f. = 3) and the interactive effect of pool and core size (p < 0.005, X2 =15.82, d.f. = 3) also had significant effects on seagrass shoot density. Additionally, core size had a significant effect (p = 0.04, X2 = 4.08, d.f. = 1) on seagrass leaf length (Supplementary table 2), as smaller cores were shown to have slightly smaller average leaf lengths; however, smaller cores did on average experience higher percentage increases in leaf length over time compared with larger cores (Figure 4). There was also a significant effect of pool (p < 0.005, X2 = 93.07, d.f. = 3) on leaf length, but the interactive effect of core size and pool had no significant effect on leaf length (p = 0.21, X2 = 4.56, d.f. = 3).
Discussion
Ex-situ mariculture of Zostera capensis: Proof of concept
Globally, seagrass populations continue to decline1, including Z. capensis in South Africa16 18, with urgent management intervention required to halt and reverse population losses. Previous in-situ restoration attempts have involved a trade-off between restoration success and impacts on donor sites, but ex-situ mariculture reduces disturbance to donor sites and increases restoration scalability by cultivating more seagrass biomass than that which was initially collected. Our work demonstrates a proof of
concept of successful ex-situ Z. capensis mariculture, which found that Z. capensis plants, grown under controlled conditions, reach maximum growth between 100 and 124 days. Our results are further promising, given that plants grown under mariculture conditions can be ‘hardened’ to suit the conditions of the restoration site and have been found to exhibit better survivability than plants transplanted directly from donor meadows.30
Changes in leaf length and shoot density
Initially, the first 9 days of the experiment saw limited increases in shoot density, with some of the 5 cm cores even losing shoots, potentially linked to the disruption of the rhizosphere and microbiome, after collection and acclimation to mariculture conditions.31 Subsequently, shoot density spiked between days 9 and 24, before growth remained steady until days 100–124. This consistent growth is likely a result of the plants capitalising on stable mariculture conditions, where temperature and light availability were controlled and physical disturbances were removed, compared to the more variable conditions in situ. Changes in leaf length followed a similar trend, despite a decrease from day 31 to 39, as growth was consistent until days 100–124. Steady increases in leaf length, with a spike in growth between days 53 and 68, could indicate seagrass plants transitioning from an intertidal morphotype to a subtidal morphotype. Seagrasses of the Zosteraceae family are known to exhibit plasticity to changing environmental conditions, with Manassa et al.32 demonstrating the ability of Zostera muelleri to acclimate to changes in light and tidal exposure. The sustained increases in leaf length observed during the course of our experiment could thus be a result of the plants adapting to reduced light availability once permanently submerged. Interestingly, periods of peak shoot density increases correspond with periods of least leaf length growth and vice versa (Figure 4), potentially alluding to a trade-off between investment in lateral (shoot density) and vertical (leaf length) growth. It is possible that seagrass plants prioritised lateral growth at the beginning of the experiment (days 1 – 24) to capitalise on stable mariculture conditions before investing resources to sustain leaf growth.
Core size affects ex-situ seagrass growth
Investigating the effect of core size on seagrass growth is key to enhancing the efficiency of ex-situ restoration, given the balance between reducing core size to minimise disturbance to donor meadows and maximise restoration success.10 Our results suggest that larger cores
Figure
performed better than smaller cores, but further investigation is required to determine whether these differences persist following transplantation. This finding is consistent with that of an in-situ study by van Keulen et al.33 in Western Australia, where larger core sizes (10 cm and 15 cm diameters) for Amphibolis griffithii showed significantly greater survival and growth post-transplantation in comparison to 5 cm diameter cores. Similar results were also observed in studies on Syringodium isoetifolium34 and recently for Z. capensis in Mozambique19. Larger cores likely secure intact apical meristems and rhizomes, including the associated microbiome interactions and nutrients, which may enable faster and more persistent growth post-transplantation35, although this remains poorly understood.
Limiting factors inhibiting Z. capensis growth
After peak seagrass growth between days 100 and 124, there was a decline in shoot densities and leaf lengths until the termination of the experiment on day 195 (Figure 4). Such a decline could be driven by nutrient deficiencies, resulting from our approach of using a closed-system aquarium design, given the inland position of Stellenbosch and the logistical challenges of transporting large volumes of seawater or sediment into our aquarium setup. Nutrient availability is an important part of seagrass growth and development, with Unsworth et al.36 showing that nutrient additions of nitrogen, phosphorus and potassium (amongst others) led to a twofold increase in seagrass shoot emergence and leaf length. Additionally, the rhizosphere microbiome is known to be important for seagrass metabolite and nutrient exchange, but bacterial communities associated with seagrass microbiomes are often disturbed or removed when seagrass plants are uprooted during the transplantation process.31 As such, it is possible that the disturbance of the microbiome during seagrass field collection and subsequent aquarium conditions might alter the capacity for seagrass nutrient uptake ex situ and be limiting seagrass growth beyond 124 days.
A framework for future seagrass restoration
The development of an effective means of upscaling seagrass restoration has recently been cited as a top priority for the advancement of seagrass conservation.37 Ex-situ mariculture of the endangered Z. capensis presents an opportunity to maximise restoration attempts, without unnecessarily adversely affecting donor meadows, especially given the variable outcomes of previous restoration trials.8,9 To build on the work presented here, we provide a framework to incorporate current guidance from published literature on seagrass restoration, and identify research gaps, which when addressed will improve restoration practices. The framework is organised into four phases: selection of
recipient and donor sites, optimising ex-situ mariculture, selecting appropriate transplantation techniques, and effective monitoring of restoration success (Figure 5).
1. selection of recipient and donor sites
Sites that have incurred sustained seagrass losses, but for which the stressors causing such losses have been mediated or removed, should be identified and prioritised for restoration4, with comprehensive data on historical changes in seagrass persistence, loss, gain and recovery important to consider24. Ultimately, the success of a restoration project will depend on the management of stressors and whether a site can be returned to a favourable state for restoration, or whether the environment has been too drastically altered to sustain seagrass.4 Once priority sites have been identified, information on the environmental drivers (such as light attenuation, sediment type, temperature and nutrient availability) affecting past and present seagrass distributions may be incorporated into habitat suitability models to determine if these sites will be receptive to restoration.24 This is particularly important within a South African context, where Z. capensis is found in 37 estuaries, each with different environmental, ecological and evolutionary dynamics16, which require a site-specific rather than a general approach to restoration.
Collecting site-specific donor plant material is important, as locally adapted plants are believed to be best suited to the conditions of the site being restored.38 Selecting subtidal or intertidal seagrass ecotypes for restoration may also influence restoration success, as Wegoro et al.34 noted a strong effect of depth in the restoration of S. isoetifolium; survival decreased with increased depth (due to decreased light availability). In South Africa, the consideration of evolutionary and population dynamics is a strong determinant of donor and source populations, as Z. capensis has defined population structure, even at small spatial scales (i.e. <50 km39). This is driven by low dispersal between populations along South Africa’s high-energy coastline, which likely prevents genetic mixing, particularly in the absence of a strong seed base, resulting in unique population-specific signals. As such, moving cores between estuaries should be considered only as a last resort and in the worst-case scenario, in which populations have gone extinct.
2. optimising ex-situ mariculture
This study has shown that Z. capensis plants can successfully be grown ex situ for transplantation but that the mariculture process requires further optimisation. For example, the use of open-water circulatory systems could stabilise the mariculture nutrient balance, whilst additional
Figure 5: A framework for the advancement of future Zostera capensis restoration trials in South Africa, with considerations regarding site selection and donor material, leading to a successful restoration effort that can be monitored over time.
nutrients could be added to plant sediments to improve seagrass growth rates.36 The cultivation period can also be altered to ensure optimal growth. For example, Zhang et al.13 suggested that a 3–4 week cultivation period is best for land-based Z. marina mariculture, as the growth and survival of re-transplanted Z. marina plants was significantly reduced after a longer duration (9 weeks) of laboratory cultivation. However, if the land-based cultivation period is too short, then plants could be susceptible to physiological stress and increased energy requirements after transplantation into the field.40 Given that peak Z. capensis ex-situ leaf length and shoot density were observed between 100 and 124 days (14–17 weeks), it is recommended that future studies should terminate the cultivation period at this point in anticipation of re-transplantation. Despite these promising preliminary results, our study focused solely on plants collected from one site. Further studies, incorporating plants from other South African estuaries, are required before the long-term viability of mariculture as a restoration technique can be determined.
Developing an appropriate transplantation method is an important consideration for maximising restoration impacts. Transplanted seagrass cores are known to have increased survivability post-transplantation in comparison to anchored shoots, as they minimise post-transplantation stress by reducing the effects of stochastic disturbance events.8 Furthermore, the use of cores as opposed to anchored shoots involves a trade-off between achieving increased transplant resilience, as cores retain more of their microbiome, and reducing donor meadow disturbance. As such, the use of smaller cores reduces impacts on donor meadows, whilst allowing for increased transplant resilience.41 However, smaller cores have been shown to have reduced in-situ survivability when compared to larger cores9 19 33 34, unless they are planted at high densities (five to nine cores per 25 cm2)41. Additionally, Watson et al.8 also showed that compact planting patterns (i.e. dense and bullseye) promote long-term Z. capensis transplant persistence. The timing of transplantation should also be considered, with Mokumo et al.9 showing that seasonality impacts the survivability of transplanted seagrass cores, as flooding during periods of high rainfall will hinder seagrass restoration in estuarine environments. Considering these findings in the context of the work presented here, we recommend that future studies investigate optimal planting density for transplanting 10-cm-diameter ex-situ-grown Z. capensis cores in compact patterns outside the rainy season.
4. Monitoring seagrass restoration success
Monitoring the persistence and change in area cover of re-transplanted seagrass is important to quantify project effectiveness, with the Seagrass Restoration Handbook15 indicating that a long-term monitoring strategy (>5 years) is fundamental to assessing restoration success. It is recommended that structural (leaf length and shoot density), functional (increases in faunal richness) and genetic monitoring be incorporated into a comprehensive monitoring programme, in which successful restoration is assessed based on threshold values and quality ratios outlined in the Seagrass Restoration Handbook.15 Assessing these metrics will strengthen insights into restoration success.5 For example, genetic monitoring of changes in population allele frequencies can provide insights into the potential evolutionary resilience of restored seagrass populations and the consequences of reproductive processes following restoration.38 Within a South African context, assessing all aforementioned metrics is likely to be too resource-intensive to implement at scale. Further, given that seagrass restoration in South Africa is in its infancy, we recommend, for comparability as well as applicability, that future studies adopt a similar monitoring protocol to Mokumo et al.9 and Watson et al.8 Priority metrics to guide restoration success should include biannual assessment of survivability and change in area cover, in addition to monitoring the fate of transplant holes in the donor meadows to better understand the impact of seagrass collection.
Acknowledgements
We thank SANParks for providing a permit to collect the seagrass cores. We acknowledge Richard Carkeek, Taariq Logday, Tiaan Engelbrecht, Frederick Mokumo, Olivia Jones, Hannelie Bossert and Francois Bossert for assisting with sample collection and the mariculture setup.
Funding
This work was supported by a South African National Research Foundation (NRF) Marine and Coastal Research grant (UID: 136488) and a Sasol–NRF collaborative grant (UID 138614).
Data availability
All data pertaining to this study are available on the von der Heyden Lab GitHub page at https://github.com/vonderHeydenLab/Z.capensis-maric ulture-langebaan
Declarations
We have no competing interests to declare. We have no AI or LLM usage to declare. A permit to collect seagrass and sedimentary cores within the West Coast National Park was granted by SANParks (CRC/2023-2024/018--2023/V1).
Authors’ contributions
A.B.: Conceptualisation, methodology, writing – original draft, writing –review and editing, project leadership. K.W.: Conceptualisation, writing –review and editing, supervision. A.N.: Conceptualisation, writing – review and editing, supervision. S.v.d.H.: Methodology, writing – review and editing, supervision, project leadership, project administration, funding acquisition. All authors read and approved the final manuscript.
r eferences
1. Dunic JC, Brown CJ, Connolly RM, Turschwell MP, Côté IM. Long-term declines and recovery of meadow area across the world’s seagrass bioregions. Glob Change Biol. 2021;27(17):4096–4109. https://doi.org/1 0.1111/gcb.15684
2. do Amaral Camara Lima M, Bergamo TF, Ward RD, Joyce CB. A review of seagrass ecosystem services: Providing nature-based solutions for a changing world. Hydrobiologia. 2023;850(12–13):2655–2670. https://doi.or g/10.1007/s10750-023-05244-0
3. Unsworth RKF, McKenzie LJ, Collier CJ, Cullen-Unsworth LC, Duarte CM, Eklöf JS, et al. Global challenges for seagrass conservation. Ambio. 2019; 48(8):801–815. https://doi.org/10.1007/s13280-018-1115-y
4. Tan YM, Dalby O, Kendrick GA, Statton J, Sinclair EA, Fraser MW, et al. Seagrass restoration is possible: Insights and lessons from Australia and New Zealand. Front Mar Sci. 2020;7, Art. #00617. https://doi.org/10.3389 /fmars.2020.00617
5. Oreska MPJ, McGlathery KJ, Wiberg PL, Orth RJ, Wilcox DJ. Defining the Zostera marina (eelgrass) niche from long-term success of restored and naturally colonized meadows: Implications for seagrass restoration. Estuaries Coast. 2021;44(2):396–411. https://doi.org/10.1007/s12237-020-00881-3
6. Lange T, Oncken NS, Svane N, Steinfurth RC, Kristensen E, Flindt MR. Large-scale eelgrass transplantation: A measure for carbon and nutrient sequestration in estuaries. Mar Ecol Prog Ser. 2022;685:97–109. https://d oi.org/10.3354/meps13975
7. McSkimming C, Connell SD, Russell BD, Tanner JE. Habitat restoration: Early signs and extent of faunal recovery relative to seagrass recovery. Estuar Coast Shelf Sci. 2016;171:51–57. https://doi.org/10.1016/j.ecss.2016.01.028
8. Watson KM, Pillay D, von der Heyden S. Using transplantation to restore seagrass meadows in a protected South African lagoon. PeerJ. 2023;11, e16500. https://doi.org/10.7717/peerj.16500
9. Mokumo MF, Adams JB, von der Heyden S. Investigating transplantation as a mechanism for seagrass restoration in South Africa. Restor Ecol. 2023;31(7), e13941. https://doi.org/10.1111/rec.13941
10. van Katwijk MM, van Tussenbroek BI, Hanssen SV, Hendriks AJ, Hanssen L. Rewilding the sea with domesticated seagrass. BioScience. 2021;71(11):1171–1178. https://doi.org/10.1093/biosci/biab092
11. Li H, Liu J, Che X. Establishing healthy seedlings of Enhalus acoroides for the tropical seagrass restoration. J Environ Manage. 2021;286, Art. #112200. https://doi.org/10.1016/j.jenvman.2021.112200
12. Statton J, Cambridge ML, Dixon KW, Kendrick GA. Aquaculture of Posidonia australis seedlings for seagrass restoration programs: Effect of sediment type and organic enrichment on growth. Restor Ecol. 2013;21(2):250–259. https:/ /doi.org/10.1111/j.1526-100X.2012.00873.x
https://doi.org/10.17159/sajs.2025/19767
13. Zhang Y, Zhao X, Tu Z, Yan W, Zhao Q, Zhang P. Propagating eelgrass (Zostera marina) from cuttings in land–sea combination systems: A novel method to improve the sustainability of seagrass restoration. Restor Ecol. 2024;32(4), Art. e14103. https://doi.org/10.1111/rec.14103
14. Mazarrasa I, Samper-Villarreal J, Serrano O, Lavery PS, Lovelock CE, Marbà N, et al. Habitat characteristics provide insights of carbon storage in seagrass meadows. Mar Pollut Bull. 2018;134:106–117. https://doi.org/10.1016/j.ma rpolbul.2018.01.059
15. Gamble C, Debney A, Glover A, Bertelli C, Green B, Hendy I, et al. Seagrass restoration handbook. London: Zoological Society of London; 2021. Available from: https://catchmentbasedapproach.org/learn/seagrass-restoration-hand book/
16. Adams JB. Distribution and status of Zostera capensis in South African estuaries — A review. S Afr J Bot. 2016;107:63–73. https://doi.org/10.10 16/j.sajb.2016.07.007
17. Adams JB, van der Colff D. Official interim publication of Zostera capensis Red List assessment [webpage on the Internet]. c2018 [cited 2024 Feb 10]. Available from: http://redlist.sanbi.org/species.php?species=4111-1
18. Raw JL, van Niekerk L, Chauke O, Mbatha H, Riddin T, Adams JB. Blue carbon sinks in South Africa and the need for restoration to enhance carbon sequestration. Sci Total Environ. 2023;859, Art. #160142. https://doi.org/10 .1016/j.scitotenv.2022.160142
19. Amone-Mabuto M, Hollander J, Lugendo B, Adams JB, Bandeira S. A field experiment exploring disturbance-and-recovery, and restoration methodology of Zostera capensis to support its role as a coastal protector. Nor J Bot. 2023;2023(1), e03632. https://doi.org/10.1111/njb.03632
20. von der Heyden S, Mofokeng R, Adams J, Midgley G, Pillay D, Watson K, et al. Nine decades of research on Zostera capensis: From foundational science to conservation and resilience. Mar Ecol Prog Ser. 2024;748:197–212. https://doi.org/10.3354/meps14711
21. Combrink CA, Henriques R, Jackson MJ, von der Heyden S. Conservation implications of strong population structure despite admixture in an endangered african seagrass. Aqua Conserv. 2024;34(12), e70012. https: //doi.org/10.1002/aqc.70012
22. Ramsar Sites Information Service. Langebaan [webpage on the Internet]. c2001 [cited 2023 Apr 17]. Available from: https://rsis.ramsar.org/ris/398
23. South African National Parks. West Coast National Park: Park management plan (2013-2023) [document on the Internet]. c2013 [cited 2024 Apr 20]. Available from: https://rris.biopama.org/node/18472?language=en
24. Watson K. Exploring the restoration of Zostera capensis in Langebaan Lagoon: Ecological, molecular and physiological perspectives [PhD thesis]. Stellenbosch: Stellenbosch University; 2024. https://scholar.sun.ac.za/hand le/10019.1/130629
25. Pillay D, Branch GM, Griffiths CL, Williams C, Prinsloo A. Ecosystem change in a South African marine reserve (1960–2009): Role of seagrass loss and anthropogenic disturbance. Mar Ecol Prog Ser. 2010;415:35–48. https://doi .org/10.3354/meps08733
26. Angel A, Branch GM, Wanless RM, Siebert T. Causes of rarity and range restriction of an endangered, endemic limpet, Siphonaria compressa. J Exp Mar Biol Ecol. 2006;330(1):245–260. https://doi.org/10.1016/j.jembe.2005 .12.031
27. Erftemeijer PLA, Riegl B, Hoeksema BW, Todd PA. Environmental impacts of dredging and other sediment disturbances on corals: A review. Mar Pollut Bull. 2012;64(9):1737–1765. https://doi.org/10.1016/j.marpolbul.2012.05.008
28. R Core Team. A language and environment for statistical computing [software]. Version 4.4.0; 2024. Available from: https://www.R-project.org
29. Bates D, Maechler M, Bolker B, Walker S. lme4: Linear mixed-effects models using “Eigen” and S4 [software]. Version 1.1–35.4; 2024. Available from: https://CRAN.R-project.org/package=lme4
30. Nguyen HM, Hong UVT, Ruocco M, Dattolo E, Marín-Guirao L, Pernice M, et al. Thermo-priming triggers species-specific physiological and transcriptome responses in Mediterranean seagrasses. Plant Physiol Biochem. 2024;210, Art. #108614. https://doi.org/10.1016/j.plaphy.2024.108614
31. Wang L, English MK, Tomas F, Mueller RS. Recovery and community succession of the Zostera marina rhizobiome after transplantation. Appl Environ Microbiol. 2021;87(3):e02326–e02420. https://doi.org/10.1128/A EM.02326-20
32. Manassa RP, Smith TM, Beardall J, Keough MJ, Cook PLM. Capacity of a temperate intertidal seagrass species to tolerate changing environmental conditions: Significance of light and tidal exposure. Ecol Indic. 2017;81:578–586. https://doi.org/10.1016/j.ecolind.2017.04.056
33. van Keulen M, Paling EI, Walker CJ. Effect of planting unit size and sediment stabilization on seagrass transplants in Western Australia. Restor Ecol. 2003;11(1):50–55. https://doi.org/10.1046/j.1526-100X.2003.00036.x
34. Wegoro J, Pamba S, George R, Shaghude Y, Hollander J, Lugendo B. Seagrass restoration in a high-energy environment in the Western Indian Ocean. Estuar Coast Shelf Sci. 2022;278, Art. #108119. https://doi.org/10.1016/j.ecss.2 022.108119
35. Uhrin AV, Hall MO, Merello MF, Fonseca MS. Survival and expansion of mechanically transplanted seagrass sods. Restor Ecol. 2009;17(3):359–368. https://doi.org/10.1111/j.1526-100X.2008.00376.x
36. Unsworth RKF, Rees SC, Bertelli CM, Esteban NE, Furness EJ, Walter B. Nutrient additions to seagrass seed planting improve seedling emergence and growth. Front Plant Sci. 2022;13, Art. #1013222. https://doi.org/10.3 389/fpls.2022.1013222
37. Nordlund LM, Unsworth RKF, Wallner‐Hahn S, Ratnarajah L, Beca‐Carretero P, Boikova E, et al. One hundred priority questions for advancing seagrass conservation in Europe. Plants People Planet. 2024;6(3):587–603. https://d oi.org/10.1002/ppp3.10486
38. Pazzaglia J, Nguyen HM, Santillán-Sarmiento A, Ruocco M, Dattolo E, MarínGuirao L, et al. The genetic component of seagrass restoration: What we know and the way forwards. Water. 2021;13(6), Art. #829. https://doi.org/ 10.3390/w13060829
39. Smit S, Henriques R, Jackson M, Taylor R, Vivier L, von der Heyden S. Eelgrass Zostera capensis populations in KwaZulu-Natal, South Africa, harbour distinct genomic signals despite limited geographical distance. Afr J Mar Sci. 2023;45(4):259–264. https://doi.org/10.2989/1814232X.2023. 2263503
40. Evans SM, Sinclair EA, Poore AGB, Bain KF, Vergés A. Assessing the effect of genetic diversity on the early establishment of the threatened seagrass Posidonia australis using a reciprocal‐transplant experiment. Restor Ecol. 2018;26(3):570–580. https://doi.org/10.1111/rec.12595
41. Matheson FE, Mackay G, Middleton C, Griffiths R, Eyre R, Smith J, et al. Restoring the seagrass Zostera muelleri with transplants: Small cores are as effective as larger plots. New Zeal J Mar Fresh Res. 2022;57(4):467–479. https://doi.org/10.1080/00288330.2022.2054829
https://doi.org/10.17159/sajs.2025/19767
AuTHORS: Joyce Sewry1
Emily Coyte2
Leanne Williams2
Aidan Barker2
Shubham Suryawanshi2
Dudley E. Shallcross3 4 Michael T. Davies-Coleman1,4
AFFILIATIONS:
1Department of Chemistry, Rhodes University, Makhanda, South Africa
2Learning Science, Bristol, United Kingdom
3School of Chemistry, University of Bristol, Bristol, United Kingdom
4Department of Chemistry, University of the Western Cape, Cape Town, South Africa
CORRESPONDENCE TO: Joyce Sewry
EMAIL: j.sewry@ru.ac.za
DATES:
Received: 26 Sep. 2024
Revised: 06 June 2025
Accepted: 09 June 2025
Published: 29 Sep. 2025
HOW TO CITE:
Sewry J, Coyte E, Williams L, Barker A, Suryawanshi S, Shallcross DE, et al. Smart Worksheets to probe and support scientific numeracy proficiency of first-year chemistry students. S Afr J Sci. 2025;121(9/10), Art. #20172. https: //doi.org/10.17159/sajs.2025/20172
Smart Worksheets to probe and support scientific numeracy proficiency of first-year chemistry students
The transition to university-level chemistry often reveals numeracy skills gaps that can hinder student confidence and academic success. Online learning tools can help characterise and address these gaps. This study introduces a Scientific Numeracy Smart Worksheet (SNSW) resource to characterise and address the numeracy-based strengths and weaknesses of a large cohort of first-year chemistry students at a South African university. We also investigated student usage and perceptions of this educational resource. The SNSW integrates core mathematical concepts with subject-specific contexts, features high levels of feedback, value randomisation, and an auto-solve feature for struggling students. It was offered as formative support for chemistry students near the start of their university journey. Usage and performance analytics from consenting students were used to study overall and section-level SNSW performance, while an anonymous questionnaire explored student perceptions. Students performed well at ‘Displaying numbers’ (85%) and ‘Rearranging and solving equations’ (84%). The lowest scoring sections were ‘Graphs’ (64%) and ‘Averages and spread of data’ (72%). ‘Scientific units’ showed the highest auto-solve percentage. Students who repeated the SNSW scored significantly higher and used the auto-solve feature significantly less on the second attempt (both p < 0.001) and scored higher in quantitative components of their end-of-module assessment, but not significantly so (p = 0.082). The questionnaire indicated high student rating for the SNSW (8.2/10), with most students finding it helpful and at the appropriate level. Providing supportive and diagnostic resources can help students develop numeracy skills and identify areas for personal improvement. Instantaneous data, generated from each student engagement with SNSW, can assist staff to develop educational strategies to target specific transitional skill deficiencies.
Significance:
Learners at secondary schools and university students alike struggle with basic numeracy concepts, such as ratios and proportions, graphs and SI units. First year chemistry curricula are full, with little time spent on revising content from school. The SNSW is a means of solving this problem. Students work through the worksheets at their own pace and receive immediate feedback. This research highlights both the gaps in students’ numeracy skills, and a corrective intervention by first-year chemistry lecturers.
Introduction
Globally, the transition from secondary school physical science to university scientific disciplines such as chemistry can be challenging for many students.1-4 Central to the challenges facing first-year university chemistry students, is an expectation that they enter university with sufficient adaptable mathematical proficiency to cope with the basic mathematical demands of tertiary level chemistry.2 3 First-year chemistry curricula in South African universities, in common with first-year chemistry curricula at universities around the world, require the application of general mathematical skills (including basic algebra, statistics and elementary calculus) to calculate concentrations, quantify rates of reactions and enthalpy, measure pH, etc.2 In this paper, we use the general term ‘scientific numeracy’ to describe the transferable mathematics skill set, acquired from a secondary school education, that should enable first-year university chemistry students to engage critically with the mathematical content of chemistry in order to solve problems at the interface of mathematics and chemistry.
In countries where the majority of students enter English-medium universities from multilingual and diverse cultural backgrounds, such as South Africa, the challenge of first-year chemistry is not limited to a perceived inadequate scientific numeracy proficiency transferred from secondary school. Difficulties in understanding the technical language specific to the discourse of chemistry5 and lingering negative attitudes to chemistry inherited from inadequate secondary school experiences, can contribute to a low self-confidence in chemistry as they enter a first-year chemistry course4. Being cognisant of the multifaceted complexity of student engagement with chemistry in South African universities, we used a Scientific Numeracy Smart Worksheet (SNSW) to both probe and support the basic scientific numeracy proficiency of a cohort of first-year chemistry students shortly after they entered Rhodes University (Makhanda, South Africa).
Smart Worksheets (SWs) from LearnSci are used as a novel, online, interactive teaching and learning support and assessment tool. LearnSci’s SWs are individually randomised to present each student with a unique but consistent experience. The SWs are structured so that students can, depending on the question type, either select options from a drop-down menu or enter their own values. The questions are a mixture of multiple choice or calculation with numerical entry. When a SW question is answered, the student receives an immediate response confirming whether the submitted answer is correct or incorrect. For incorrect answers, students receive instant, formative feedback to guide further attempts at the question. The prompt availability of this formative, ‘tutor-like’ feedback has proved to be a valuable instrument to support learning in practical6 and theoretical2 chemistry and pharmacology7. Available points decrease with each successive attempt, allowing differentiation between students and the monitoring of
2025 https://doi.org/10.17159/sajs.2025/20172
student progression. Students are able to use an auto-solve option after an unsuccessful attempt, which only provides the correct answer and removes available marks for that question, thereby discouraging excessive usage. Students can review their attempts and feedback via a timeline mode, which staff can also access for review. SWs can integrate with online grade centres and grade books, and thus can be readily reviewed by teaching staff. The SW data, generated from a cohort of students’ combined attempts at SWs, can instantly identify common gaps in understanding and highlight the general misconceptions shared by a large number of students. These data can subsequently facilitate effective and focused follow-up teaching and learning interventions to the benefit of the student cohort.2
Research objectives
The aim of this study was twofold: to investigate the SNSW as a diagnostic tool and as a learning support tool. Accordingly, we aimed firstly to quantitatively probe the scientific numeracy proficiency in a large cohort of Rhodes University chemistry students, early in their university journey. Secondly, we investigated the performance of students who attempted the SNSW multiple times, both in terms of SNSW score and end-of-semester summative assessments. We additionally obtained student feedback on the value of the SNSW as a supportive learning tool.
Educational context
Cohort and module context
The first-year chemistry course (Chemistry 1) is a two-semester general chemistry course (CHEM101 and CHEM102), taken by all first-year pharmacy students and most students registered for a BSc degree. The course includes topics that require a strong background in numeracy (e.g. equilibrium, thermodynamics, kinetics) and inorganic and organic chemistry, for which there is less of a requirement for scientific numeracy proficiency. The first two weeks of the course introduce the basic building blocks of chemistry, e.g. atomic structure, the periodic table, SI units, stoichiometry, per cent composition and the ideal gas laws.
In 2024, 378 students registered for the course, of which 39% were pharmacy students and 52% were BSc 1 students. The other 9% were second-year science students (some repeating first-year chemistry, others taking it for the first time), and included 13 Extended Studies students, plus a small number of students from the Faculties of Humanities and Commerce.
Only students who achieve more than 50% for mathematics and 60% for physical sciences in their secondary school-leaving exams can apply for entry into a BSc degree. For a degree in pharmacy (BPharm), the minimum requirement is 60% for mathematics, consistent with the overall higher entry level for a pharmacy degree. Only 17.1% of the 2023 Grade-12 school learners who wrote the South African physical science National Senior Certificate examinations achieved 60+%, while 27.5% passed the National Senior Certificate mathematics examinations with 50+%.8 Therefore, the students volunteering for this study represent the relatively small number of South African high school graduates able to achieve these pass rates in both of these two subjects. Most of the BSc students intend to major in biochemistry and microbiology, while some continue with chemistry and a small number go on to major in other life sciences, e.g. botany and zoology. Over the past three decades, lecturers of the Chemistry 1 course have anecdotally reported that students struggle with applying basic numeracy within a chemistry context. It is perceived that first-year chemistry students cannot convert SI units, have no ‘feel’ for the size of very large or very small numbers (exponents of 10) and cannot use ratios and proportions. As Chemistry 1 is a feeder course for pharmacy and all the life sciences, the curriculum content requirements are many, with limited time available to revisit basic numeracy. Thus, there is an ongoing requirement for student self-study, in order to reinforce and test their numeracy skills and access help when needed. In addition, the majority (62%) of the 2024 BSc and BPharm student cohort at Rhodes University required financial assistance from the National Student Financial Aid Scheme. Several studies have shown that the academic success of many South African students is often negatively impacted by their low socio-economic status, usually concomitant with a disadvantaged basic education prior to university entry.9 Therefore, the importance of creating a supportive tertiary learning and teaching environment that provides multiple opportunities for students from diverse socio-economic backgrounds to achieve academic success, cannot be overemphasised.
Scientific Numeracy Smart Worksheet
While the SNSW was originally developed between UK academics and LearnSci programmers, the SNSW used in the study was modified by a first-year Rhodes chemistry lecturer, in collaboration with LearnSci. The modified SNSW aligns the expected transferable scientific numeracy skills from the South African physical science and mathematics school curricula with six different numeracy skills deemed important for successful completion of the first-year chemistry course at Rhodes University (Figure 1). The modified SNSW is designed to help South
https://doi.org/10.17159/sajs.2025/20172
Figure 1: Topics covered within the six sections of the Scientific Numeracy Smart Worksheet. The sections are almost equal in length, each with a total of 20 available marks.
African students develop and practise a wide range of quantitative skills which will support them in their degree, whether that is chemistry, pharmacy or another field.
Students commonly struggle to apply numerical skills to scientific contexts2-4, therefore the majority of questions have scientific contexts included. However, subject-specific knowledge is not required for successful completion of the worksheet; the focus is on the quantitative aspects. Example questions are shown in Figure 2. Nearly all questions have controlled randomised components (e.g. input values or ordering of questions), to make each student attempt a unique but consistent experience.
Implementing the Smart Worksheet
The SNSW was made readily accessible on the university’s Learning Management System. In a lecture at the start of the 2024 academic year, students were informed about the SNSW resource and that completion was a course requirement, with the marks associated with the exercise contributing to their final assessment mark. This was to guarantee engagement with the SNSW, given that students do not always participate in optional formative assessments.10 A different lecturer (not involved in this research) informed the students about the research project and distributed consent forms to prevent students feeling obligated to the researcher. The information letter and a copy of the consent form were also placed on the Learning Management System. Reminders of the survey and SNSW were sent by email. Students were expected to complete the SNSW in their own time and were given 3 weeks and a maximum of three attempts, with the score for each attempt recorded.
Research methods
Overall study design
To determine student usage, performance and views of the SNSW, we combined usage analytics and a student questionnaire. Ethical approval was obtained from Rhodes University’s Human Ethics Committee (approval no. 2023-7534-8234). Students were provided with paper opt-in forms, which included permission for their SNSW results to be used in this study. Only the data of students who consented were used.
Usage and performance analytics
Smart Worksheets have the capability of capturing each student’s online progress and achievement as they proceed through the worksheet, both of which are saved and made available to the lecturer or tutor. These data, known as usage and performance analytics, provide detailed insights into how students are using these resources, and form the crux of the research findings emanating from this study.
We studied the usage and performance analytics at a section level, to see how students responded to each topic. These data included the
proportion of questions students answered on average, the scores gained on questions attempted, and the frequency of the auto-solve feature. We also compared first and second attempts amongst students who repeated the SNSW and checked for associations between SNSW engagement (in terms of number of attempts) and end-of-module scores.
In studying the student cohort’s overall engagement with the SNSW, we can get a sense of the suitability of the resource in terms of challenge and support offered. In addition, we can gain a deeper understanding of the relative strengths and weaknesses of students tackling the six topic areas within the resource, to identify potential areas where further support may be required.
Questionnaire design and deployment
The questionnaire accompanying the SNSW was designed to gain insights into student perceptions of the SNSW resource, including how challenging they found it, how helpful they found each section and how much they would recommend it to others. Many factors can influence these perceptions; therefore, the questionnaire also asked students about numeracy confidence levels before using the worksheet, the main device which they used to complete the resource, and their gender, to evaluate if these parameters were associated with different student perceptions of the SNSW resource. To encourage broad participation, the questionnaire was kept anonymous and short, and each question was optional. The questionnaire, including introductory information and the opt-in consent confirmation, is available in the supplementary material
The questionnaire was released to students for 3 weeks during February and March 2024, using the SurveyMonkey online platform. The availability of the questionnaire overlapped with the final 2 weeks of SNSW access and for a further week after SNSW access closed. Students were made aware of the questionnaire via emails and in in-person teaching sessions.
Quantitative analysis was carried out in IBM SPSS Statistics version 25.
Results and discussion
Analytics findings
A total of 210 students, representing 56% of the cohort, opted in to analytics reporting on their findings and submitted at least one SNSW attempt. We report the usage and performance analytics here, both overall and by section.
Section-level performance
Average percentage of attempted questions, mean score on attempted questions and use of the auto-solve feature for each of the six SNSW sections are shown in Table 1. Questions left blank by students are not included in the mean and auto-solve percentage calculations, rather than
Source: LearnSci (reproduced with permission)
and solving equations’ section.
Figure 2: Example questions from the Scientific Numeracy Smart Worksheet in (A) the ‘Ratio and percentage’ section and (B) the ‘Rearranging
scoring them as zero. This is to better represent student performance in attempted questions.
On average, across all attempts, students completed 94.6% of the SNSW, although this somewhat decreased across the six sections. ‘Displaying numbers’ (Section 1) was completed by 98.2% of the students, whereas ‘Graphs’ (Section 6) was completed by 91.8%. Sections 2–5 had completion percentages in between these values.
The overall mean score on attempted questions was 77.0%, although this varied quite considerably amongst the sections. The highest score (85.8%) was for ‘Displaying numbers’, then ‘Rearranging and solving equations’ at 84.3%. Students had the most difficulty with ‘Graphs’, scoring a mean of 64.5%. A more granular look at the question-level results revealed that, whilst most students were able to identify graph types and label graph axes without difficulty, they struggled greatly with identifying outliers and suitable axis ranges for graphs. They also found determining the slope and y-intercept of a provided scatter plot with a trendline to be challenging. The next lowest scoring sections were ‘Averages and spread of data’, and ‘Scientific units’, although the scores were markedly higher than ‘Graphs’, at 72.2% and 75.9%, respectively. Within these sections, students obtained the lowest marks when asked to calculate medians, variance and standard deviations in ‘Averages and spread of data’, compared with calculating means, modes and ranges and identifying high and low accuracy and precision. In ‘Scientific units’, making unit conversions especially involving compound units (e.g. mg.mL–1) appeared to be particularly challenging, compared with questions on unit prefixes in isolation, and even compared with broader calculation questions involving unit conversions.
Use of the auto-solve feature is another indicator of a student’s struggle with numeracy questions, and also varied among SNSW sections. In general, sections with higher scores also saw lower auto-solve scores, which is intuitive given that auto-solving forfeits available marks for the solved question. However, there were some exceptions to this trend: the level of auto-solving in the ‘Graphs’ section was fairly low given the lowest mean scores; this is likely because of the unique presence in this section of a complex question type which grades groups of answers input at once, but which cannot be auto-solved. By contrast, the ‘Scientific units’ section had particularly high auto-solve rates relative to score. The majority of auto-solves in this section were centred around unit conversion questions, especially with compound units. These questions may have represented a particularly sharp increase in difficulty, leading to a high proportion of students requesting the correct answer after making a number of incorrect attempts at answering the questions.
Identifying student strengths and weaknesses in these topic areas is useful for future support, for example, by knowing where to put future emphasis in teaching sessions. Additionally, this could inform adjustments to the SNSW, providing a little more scaffolding or support
in these question areas. This will help ensure the difficulty level of the worksheet is balanced, while maintaining a sufficient challenge for learning and skills development.
Performance improvement from multiple attempts
Students were permitted up to three attempts at the SNSW, in order to encourage more practice and skills development. It is important to note that students were required to submit the whole worksheet (at any level of completion) before they could embark on a subsequent attempt. The highest mark obtained from their attempts was used for their final assessment mark. Of the 210 students who consented to the study, 41 made at least two attempts at the resource. Only six completed the worksheet three times, so only their first two attempts are considered here. Table 2 shows the overall comparisons between the two attempts. See the supplementary material for the section-level breakdowns.
Students scored higher on their second attempt than on the first. For students who made two or more attempts, first attempts scored 70.6% on average and second attempts scored 82.0%, an increase of 11.4 percentage points (%pt). This increase brings the mean score of this group from sizeably below the overall mean of 77.0% mentioned earlier, to markedly above it. The increase between attempts was highly statistically significant, as determined by a two-tailed paired t-test: t(40) = 7.109, p < 0.001. Scores increased across all sections, with the highest improvements in ‘Ratio and percentages’ (15.5 %pt increase) and ‘Graphs’ (14.5 %pt increase). All sections saw an increase of 8.9% or higher. As nearly all questions have randomisation components, values could not be copied directly from previous attempts, or from their peers. Therefore, this score increase is likely to represent an enhanced ability to solve the numeracy problems, perhaps using the feedback provided or their own additional learning to improve their performance.
In addition, students completed more of the SNSW on their second attempt, with an increase of 6.9 percentage points from 87.4% to 94.3% on average for overall completion, but this was not statistically significant: t(40) = 1.327, p = 0.192. However, there were variations in the Completion% changes among SNSW sections, whereby the increases in Completion% were generally higher in the later sections. ‘Displaying numbers’ (Section 1) was actually slightly reduced in completion, by 1.0 %pt, and ‘Ratio and Percentage’ (Section 2) completion increased by just 1.0 %pt. The biggest increases in completion were in ‘Graphs’ (Section 6) and ‘Averages and spread of data’ (Section 4), both at 11.8 %pt increase. In the second attempt, all sections had a mean completion of over 91%. Motivations behind this differential behaviour are not clear, but could be investigated further in future research.
The auto-solve feature was used much less during second attempts, decreasing from 10.5% down to 5.2%. This reduction of 5.4 %pt was highly statistically significant: t(40) = 4.857, p < 0.001. Given the score increase, this reduction in use is partly due to students not needing to use the feature as they answered more questions correctly after fewer attempts. It could also indicate that students were more willing to persevere and to use the feedback provided to answer the questions. While not all sections showed a relationship between auto-solve use
Table 2: Comparison between the first and second attempts of students who used the Scientific Numeracy Smart Worksheet two or more times (n = 41)
5.
Table 1: Section-level Scientific Numeracy Smart Worksheets usage and performance of all consenting students
decrease and score increase, there was an association at the highest and lowest ends. The biggest decrease in the use of auto-solve was in ‘Ratio and percentages’, from 12.5% to 5.1%. This section also showed the biggest increase in scores as described previously. Students were completing more questions themselves whilst marks were available, thereby obtaining a higher score.
Overall, repeating the SNSW was associated with higher completion, higher mean scores on attempted questions and a reduced use of the auto-solve feature.
Worksheet engagement vs exam attainment
Student scores in the quantitative components of their end-of-module chemistry assessment were compared against engagement with the SNSW in terms of number of attempts (Figure 3). Because of the low sample sizes of students using the Smart Worksheet 0 or 3 times, only 1 vs 2 attempts were statistically compared. Students who engaged twice with the SNSW, regardless of performance, went on to score higher (50.8%) than those who made one attempt (46.5%), although this was not quite statistically significant: t(202) = 1.75, p = 0.082. The majority of students who consented to the study attempted the sheet only once, potentially limiting the statistical power of the comparison. The increase may indicate improved numerical confidence and abilities from repeated engagement, with the potential to transfer into other assessment contexts. However, it is also possible that students who engage more deeply with the SNSW are more engaged with their studies generally, and so there may be other factors at play. Nevertheless, as noted previously, the first attempt of students who went on to make two or more attempts was on average lower than the overall mean score. This would therefore not suggest an initial strength of numeracy skills in this group, but, as shown, there was an improvement in performance with SNSW usage.
Questionnaire findings
In total, 196 students, representing 47% of the cohort, answered the online consent question, of which 177 consented and proceeded to the questions. As all subsequent questions were optional, some students skipped some questions, but all questions received at least 136 responses, except the free-text question, for which 39 responses were received.
Overall SNSW rating
Students generally rated the SNSW highly, with a mean of 8.2 when asked, “On a scale of 1 to 10, how much would you recommend the
scientific numeracy resource to other students on a similar course?”
The most common ratings were 10 (29%) and 8 (26%) (Figure 4). This suggests that the students found the SNSW a useful learning experience.
Perceived challenge level
The majority of students considered the SNSW to be pitched at an appropriate level of difficulty, with 51.8% of respondents answering “about right for me” when asked their thoughts on the overall challenge level of the SNSW. Only 7.2% of students said the resource was either “much too difficult” or “much too easy”. The second common response was “a little too difficult”, as answered by 33.8% of students, suggesting that the worksheet was providing a level of challenge to this sub-set of students.
However, difficulty rating did not have a significant association with SNSW rating (one-way ANOVA with Games-Howell post-hoc tests, p > 0.106). This suggests that students found the SNSW similarly valuable, whether they found it challenging, not challenging enough or about right.
Helpfulness of each section
Students were asked, “How helpful were the following sections of the scientific numeracy resource to you, in terms of practising the topic and identifying your strengths and weaknesses?” Positive responses were received for each section, with the most valued section being ‘Scientific units’: 95.7% of students rated this section “very helpful” or “fairly helpful” (Figure 5). Interestingly, this was also the section with the greatest use of the auto-solve feature, as described earlier, so perhaps students found the auto-solve helpful in support of their learning.2
The ‘Graphs’ section had the lowest rating, although 74.4% of students still found it “very helpful” or “fairly helpful”. This was the section for which students gained the lowest score, as described earlier. Therefore, the difficulty of this section might have been such that students became somewhat overwhelmed, reducing the section’s perceived helpfulness. The South African school mathematics curriculum introduces basic statistics (mean, median and mode) in Grade 7, bar graphs in Grade 8, and scatter plots in Grade 9.11 Logarithms, plus their graphical representations, are only covered towards the end of the Grade 12 mathematics syllabus.12 These data-handling concepts, however, form only a minor part of the South African school mathematics curriculum and are seldom emphasised. Difficulty with graphs is not limited to South African students2 13, and an increased focus on graphs in first-year
3: Scores in quantitative components of the end-of-module chemistry assessment, against the number of Scientific Numeracy Smart Worksheet attempts, as (A) a bar chart with means and (B) a box plot with medians.
Figure
practical sessions at Rhodes University was an immediate positive outcome of the implementation of the SNSW.
Numeracy confidence levels
Numeracy confidence levels were reasonably high amongst student respondents, as the most common answer (56.9%) to “Before starting the scientific numeracy resource, how confident did you feel about your numeracy/mathematical skills?” was “fairly confident”. However, over a quarter (25.7%) considered themselves to be “not very confident”, and 9.7% said they were “not at all confident” about their mathematical skills. Only 7.6% considered themselves “very confident” in this area.
To compare student confidence levels with the SNSW rating, the responses were re-coded into two groups: lower confidence (“not at all” and “not very” confident) and higher confidence (“fairly” and “very” confident). This merging was done because of the small response numbers for the highest and lowest confidence levels. The lower confidence group rated the SNSW more highly than the higher confidence group (8.48 vs 8.02), although this difference was not statistically significant: t(133) = 1.553, p = 0.123. Overall, the SNSW was favoured comparably by students,
whether they felt confident about their mathematical skills or not. Interestingly, a previous South African study highlighted the disparity between over-confidence, stemming from prior performance in school physical science and mathematics subjects, and actual performance in first-year university chemistry. This disparity could explain the lack of correlation between confidence and experience of the SNSW.14
Device used to complete the SNSW
While three-quarters of students (75.2%) completed the SNSW on desktop or laptop computers, there was a significant minority using mobile devices (20.4%). The remaining students reported using a tablet or a mix of devices. Students’ ratings of the SNSW were very similar between those who used a desktop/laptop (8.26) and those who used a mobile device (8.21), suggesting that the device used did not significantly affect their learning experience.
Gender
Most (65.2%) of the survey respondents were women, 31.9% were men and the remainder were non-binary, other or preferred not to say. This ratio is approximately representative of the gender ratio of the cohort, so
Figure 5: Student perceptions of helpfulness for each Scientific Numeracy Smart Worksheet section.
Figure 4: Frequency histogram of student ratings of the Scientific Numeracy Smart Worksheet.
there did not appear to be a bias in responses from one gender. Female students rated the resource slightly more highly than male students on average (8.30 vs 8.02), but the difference was not statistically significant: t(130) = 0.869, p = 0.386. The scientific numeracy resource was therefore helpful to both male and female students.
Free-text comments
When asked for further comments about their experiences of the SNSW, 39 students contributed responses. These responses were grouped by topic area (Table 3) for qualitative review.
The responses were broadly positive, describing its helpfulness or their enjoyment of the SNSW, including helping to identify areas of unfamiliarity, strength or weakness in general terms, and the specific area in which they improved, particularly significant figures, units and graphs.
One criticism concerned the length of the SNSW. Because there are many topic areas to cover in scientific numeracy, omitting questions would create gaps in the coverage and fewer practice opportunities. The resources could be split, but keeping them together creates cohesion and allows for overall reporting. To prevent students feeling overwhelmed, they could be encouraged to take breaks between sections, with the automatic save feature highlighted, so they know that they do not need to complete each section at one time.
Some students commented on how the SNSW helped refresh material covered in previous learning, and two more highlighted the connection with other parts of the course. Others mentioned that it was challenging, in a positive context.
Limitations of the study
Although the large cohort meant this study achieved a high sample size, not all students consented to analytics usage or completed the questionnaire, limiting its potential. Furthermore, most students completed the SNSW only once, limiting some statistical comparisons. The cohort’s varied entry requirements and subject interest might also impact the interpretation of these data. Additionally, allowing students to complete the SNSW independently may have introduced uncontrolled variables that cannot be incorporated into the analysis of these data, limiting available understanding of student behaviours. Finally, some students found the SNSW lengthy, which may have also impacted completion rates.
Table 3: Topic areas of free-text comments provided in the student questionnaire mentioned by two or more students, with example quotes
Topic area (number of responses) Example student quote
Helpfulness or enjoyment (11)
Identifying areas of unfamiliarity, strengths or weaknesses (9)
Practice makes perfect, the scientific numeracy was helpful to me.
It helped me realise that there are indeed many things that I don’t fully understand and therefore have to give more attention to.
Specific areas of improvement (4) It really helped me in nailing significant figures.
Resource length (4) The quiz is too long; it took a lot of time.
Refresher from previous learning (2)
Relevance to other parts of the course (2)
Challenging in a positive way (2)
It is so helpful especially with revising what we did when we first started the term. Nice question too.
No comments but I’m really impressed with the layout of this worksheet since it almost covered everything we did during lectures so thumbs up.
The scientific Numeracy resources was a bit difficult which helped to keep one thinking which is a good exercise when it comes to developing better understanding when it comes to conversion and science.
Conclusions
Supporting underrepresented and disadvantaged students in scientific subjects by addressing student numeracy gaps, improves their confidence, academic skill set and progression. To be effective, this support requires an efficient approach to identify core knowledge gaps and should provide accessible support materials that foster engagement. The SNSW used in this study is a robust resource for establishing baseline metrics and upskilling students, whilst minimising the impact on staff workload, potentially contributing to a more inclusive teaching and learning environment.
Using the SNSW as a diagnostic tool has effectively highlighted knowledge gaps that can be addressed more efficiently. Graphs, averages and spread of data, and scientific units emerged as challenging areas for students. Completion rate and score improved significantly upon repeating the SNSW, and whilst there was no significant difference, there was a positive correlation between SNSW repetition and higher module scores. Students generally found the SNSW favourable and the immediacy of formative feedback was well received.
This study focused on one university in South Africa, but future investigations could extend this by comparing findings from different institutions in the country. Seeking specific student perceptions of the different numeracy topic sections may also yield deeper insight. Additionally, investigating when students prefer to use the SNSW could help inform strategies for the optimal timing for providing resources. Additional learning resources may be incorporated as well, and these could be tailored to students’ learning needs as identified by the SNSW results.
Acknowledgements
We wish to acknowledge with gratitude the enthusiastic contribution to this research project by the 210 volunteers from the CHEM101 class of 2024 at Rhodes University. We also thank the Department of Chemistry and the Information and Technology Services Division of Rhodes University for their support of this research project. The ongoing support for innovative chemistry education in South Africa by LearnSci (UK) is greatly appreciated.
Data availability
The data supporting the results of this study are available upon request to the corresponding author.
Declarations
E.C., L.W., A.B. and S.S. are, or were, employed by Learning Science (trading as LearnSci) at the time of creation of this article. Ethical approval was obtained from the Rhodes University Human Ethics Committee (approval no. 2023-7534-8234).
Authors’ contributions
J.S.: Conceptualisation, data curation, investigation, methodology, project administration, resources, writing – original draft, writing – review and editing. E.C.: Conceptualisation, data curation, formal analysis, investigation, methodology, project administration, visualisation, writing –original draft, writing – review and editing. L.W.: Conceptualisation, data curation, formal analysis, investigation, methodology, project administration, visualisation, writing – original draft, writing – review and editing. A.B.: Data curation, software. S.S.: Data curation, software. D.E.S.: Conceptualisation, software, supervision. M.T.D-C.: Conceptualisation, methodology, project administration, supervision, visualisation, writing – original draft, writing – review and editing. All authors read and approved the final manuscript.
References
1. Mumba FK, Rollnick M, White M. How wide is the gap between high school and first-year chemistry at the University of the Witwatersrand? S Afr J High Educ. 2002;16(3):148–156. https://doi.org/10.4314/sajhe.v16i3.25227
2. Shallcross DE, Davies-Coleman MT, Lloyd C, Dennis F, McCarthy-Torrens A, Heslop B, et al. Smart Worksheets and their positive impact on a first-year quantitative chemistry course. J Chem Educ. 2025;102:1062–1070. https:// doi.org/10.1021/acs.jchemed.4c00705
3. Towns MH, Bain K, Rodriguez JG. How did we get here? Using and applying mathematics in chemistry. In: Towns M, Bain K, Rodriguez JG, editors. It’s just math: Research on students’ understanding of chemistry and mathematics. ACS Symposium Series 1316. Washington, DC: American Chemical Society; 2019. p. 1–8. https://doi.org/10.1021/bk-2019-1316.c h001
4. Coll R, Ali S, Bonato J, Rohindra D. Investigating first-year chemistry learning difficulties in the South Pacific: A case study from Fiji. Int J Sci Math Educ. 2006;4:365–390. https://doi.org/10.1007/s10763-005-9007-6
5. Rees S, Kind V, Newton D. Meeting the challenge of chemical language barriers in university level chemistry education. Isr J Chem. 2019;59:470–477. https://doi.org/10.1002/ijch.201800079
6. Coyte E, Lowry RB. Paired online laboratory assessments: Formative engagement and summative attainment. J Chem Educ. 2024;101(8):3514–3521. https://doi.org/10.1021/acs.jchemed.4c00308
7. McCartney J, Egieyeh S, Ebrahim N, Braaf E, Beukes D. Innovation in pharmacy education during the pandemic: Using Learning Science to support laboratory-based practical skills. S Afr Pharma J. 2021;88(4):31–33. https:/ /hdl.handle.net/10520/ejc-mp_sapj_v88_n4_a9
8. South African Department of Basic Education (DBE). 2024 National Senior Certificate (NSC) Diagnostic Report: Book 1. Pretoria: DBE; 2024. p. 217, 245. Available from: https://www.education.gov.za/Portals/0/Documents/Re ports/2024/2024%20NSC%20Diagnostics%20Book%201.pdf?ver =2025-0 2-07-130329-033
9. Van Zyl A. The contours of inequality: The links between socio-economic status of students and other variables at the University of Johannesburg. J Stud Aff Afr. 2016;4(1):1–16. https://doi.org/10.14426/jsaa.v4i1.141
10. Crabtree R. Barriers to student engagement: Why don’t students engage? Student Engag Higher Educ J. 2023;4(3):28–47. https://sehej.raise-network .com/raise/article/view/1156
11. South African Department of Basic Education (DBE). Curriculum and Assessment Policy Statement: Grades 7-9: Mathematics. Pretoria: DBE; 2011. Available from: https://www.education.gov.za/Portals/0/CD/National %20Curriculum%20Statements%20and%20Vocational/CAPS%20SP%20%2 0MATHEMATICS%20GR%207-9.pdf?ver=2015-01-27-160141-373
12. South African Department of Basic Education (DBE). Curriculum and Assessment Policy Statement: Grades 10-12: Mathematics. Pretoria: DBE: 2011. Available from: https://www.education.gov.za/Portals/0/CD/National% 20Curriculum%20Statements%20and%20Vocational/CAPS%20FET%20_%2 0MATHEMATICS%20_%20GR%2010-12%20_%20Web_1133.pdf?ver=201 5-01-27-154314-253
13. Glazer N. Challenges with graph interpretation: A review of the literature. Stud Sci Educ. 2011;47(2):183–210. https://doi.org/10.1080/03057267.2011.6 05307
14. Potgieter M, Ackermann M, Fletcher L. Inaccuracy of self-evaluation as additional variable for prediction of students at risk of failing first-year chemistry. Chem Educ Res Pract. 2010;11:17–24. https://doi.org/10.1039 /C001042C
https://doi.org/10.17159/sajs.2025/20172
AuTHOR: Anastassios Pouris1
AFFILIATION:
1Institute for Technological Innovation, University of Pretoria, Pretoria, South Africa
CORRESPONDENCE TO: Anastassios Pouris
EMAIL: apouris@icon.co.za
DATES:
Received: 16 Apr. 2025
Revised: 17 July 2025
Accepted: 04 Aug. 2025
Published: 29 Sep. 2025
HOW TO CITE:
Pouris A. Sensitivity of GERD/GDP to time academics spend on R&D in South Africa, 2022/2023. S Afr J Sci. 2025;121(9/10), Art. #21903. https: //doi.org/10.17159/sajs.2025/21903
ARTICLE INCLuDES:
☒ Peer review
☐ Supplementary material
DATA AVAILAbILITY:
☐ Open data set
☒ All data included
☐ On request from author(s)
☐ Not available
☐ Not applicable
EDITORS:
Chrissie Boughey Nkosinathi Madondo
KEYWORDS:
GERD/GDP, academic time, South Africa, research intensity
Sensitivity of GERD/GDP to time academics spend on R&D in South Africa, 2022/2023
This short communication estimates the impact of the time academics spend on research and development (R&D) on the research intensity of South Africa. Research intensity is indicated by the R&D expenditure as a percentage of the gross domestic product (GDP). A country’s research intensity is indicative of technological progress and global competitiveness, which arises from improved productivity and efficiency across various industries. Furthermore, the indicator is used for the attraction of foreign investments. Research intensity is of particular importance in South Africa as it is used by the country’s government as a target to propagate the country’s socio-economic development. The Science, Technology and innovation Decadal Plan 2022–2032 (South African Department of Science and Innovation, 2022) identifies the research intensity of various sectors as targets, and political authorities have reported that the ratio of the gross expenditure on research and development (GERD) to GDP should be 1.5%. However, the current value of the indicator is 0.61%. The higher education sector is a main contributor to research intensity in the country and the time that academics spend on R&D is the major factor in the sector’s intensity. In undertaking the R&D Survey in South Africa, the Human Sciences Research Council estimates a research coefficient for academics of 22%. However, other surveys estimate a much lower ratio. The current investigation has identified that if the research ratio of academics is 7%, the country’s research intensity is 0.48%. This is substantially lower than the current estimate and requires the urgent attention of government authorities.
Significance:
• Research intensity is the most cherished indicator among the set of indicators in the context of science, technology and innovation in a country. In South Africa, the issue is of critical importance as the political authorities use the indicator for policy targets and the administrative system appears to overestimate the size of the indicator.
• The current intensity of 0.61 appears to political authorities to be adequate and so they reduce the budgets related to research and development. However, this article identifies that South Africa’s intensity may be closer to 0.48. South Africa has not seen such indicators for more than 20 years.
Research intensity and time academics spend on R&D
Research and development (R&D) expenditures as a percentage of the gross domestic product (GDP) serve as a critical indicator of a country’s commitment to innovation, economic growth and societal progress. By investing in R&D, nations can foster a culture of creativity and discovery, driving technological advancements and enhancing competitiveness in the global market. This investment not only leads to the development of new products, services and industries but also addresses pressing challenges such as climate change, health care and sustainable development.1
The use of R&D expenditure as a percentage of GDP as an international metric has its roots in the mid-20th century. The Organisation for Economic Co-operation and Development (OECD) played a significant role in standardising this measure through the Frascati Manual, first published in 1963. The metric gained further prominence with the establishment of the United Nations Educational, Scientific and Cultural Organization (UNESCO) Institute for Statistics, which began collecting and publishing data on R&D expenditures globally.2
In South Africa, the recently published report South African National Survey of Research and Experimental Development3 provides findings of the relevant survey with commentary, standard summary tables of the overall findings from 2022/2023, and time series from previous instances of the survey.
Table C1483 of the Survey provides data for researchers’ headcount and full-time equivalent (FTE) per university in the country. The ratio provides the average research coefficient (time academics spend on R&D for the particular university). Inaccurate estimation of the research coefficient leads to inaccurate estimation of the resources invested in R&D in the higher education sector and may have serious consequences for policy. For example, overestimating the expenditures for R&D
• will underestimate the productivity of the sector;
• may affect the national allocation of resources between higher education institutions and other R&D performers (e.g. government laboratories);
• may affect the allocation of resources between research and teaching; and
• will overestimate the gross expenditure on research and development (GERD), GERD/GDP and so on.
Underestimating the R&D expenditures will have the reverse consequences. Similarly, the consideration of the science and technology institutions as a system means that emphasis should be placed differently on the weakest part of the system. An overestimation of the R&D coefficients could easily mask the weakness of the higher education system, with adverse repercussions for the whole national system of innovation.
2025 https://doi.org/10.17159/sajs.2025/21903
Table 1 shows the headcount, the FTE and the relevant ratio per university for 2022/2023.
The average ratio of all the universities is 0.22 for 2022/2023 – down from 0.239 for 2019/2020. While a 2% decline is of policy interest, what is probably more important is that the estimated coefficient of 22% does not coincide with an investigation by the then Department of Science and Technology (DST)4 which shows that academics declare that they spend only 7% of their time on research (FIG10.2). It is mentioned that these values are supported by international empirical research.5
There are also interesting findings in the detailed analyses per university. The University of Pretoria appears to have the second smallest coefficient at 12.8%. This is approximately half the average of all the universities. On
the other hand, North-West University has a coefficient of 85% (up from 29.9% during 2019/2020). The private universities declare an average coefficient of 30% (down from 43.7% during 2019/2020).
For comparative purposes, the University of Fort Hare has a coefficient of 30%, the University of Limpopo 38% and Stellenbosch University 29%.
If these data are correct, we have to redefine the research intensities of the universities, and investigate how North-West University was able to increase their research intensity so drastically in a short time.
The University of Pretoria should investigate the negative forces in the institution resulting in the second smallest coefficient, and so on.
In investigating the methodology of the Human Sciences Research Council, it becomes apparent that, while the OECD6 recommends
Table 1: Researcher headcount, full-time equivalent (FTE) and ratio of South African higher education institutions for 2022/2023
Source: Original data from the Centre for Science, Technology and Innovation Indicators (CeSTII)3
the estimation of the relevant coefficients from custom surveys, the Human Sciences Research Council in South Africa asks the universities to provide the relevant information. It is apparent that the university administrations do not have such information about their staff and the information provided by the universities is more guesswork than reliable information. The time academics spend on R&D is defined by the OECD and it requires relevant expertise. For example, issues of specialised health care; patent and licence work; policy-related studies; and routine software development are excluded
While a cost-efficient approach would be for a large-scale survey with the objective of identifying the time academics spend on R&D in the country, an alternative is for each university to estimate the relevant coefficients for their own staff through relevant surveys.
The next issue to address here is the ratio of R&D expenditures/GDP in South Africa if the time academics spend on R&D is not 22% (the current assumption) but actually 7%.4 It should be emphasised that higher education performs approximately 40% of the country’s R&D and, hence, a change in the sector will have a substantial impact on the total R&D statistics of the country.7
The higher education sector R&D expenditure by accounting category (Table C131)3 identifies that the labour cost, including specific categories of R&D personnel cost for 2022/2023, is 81.9%. As the time of academics is adjusted from 22% to 7%, this drop of 68% will affect the 81.9% of the expenditures. (Hence 68% x 81.9% = 55.76%.)
The higher education contribution to GERD is 36.4%. Hence, the drop of 55.76% will affect the 36.4% of GERD. (55.76 x 36.4% = 20.29%.)
Consequently, the ratio GERD/GDP of 0.61 will decrease by 20.29% and will be 0.48%. This is a substantially low R&D expenditure, and if it is not corrected soon it will destroy the country’s infrastructure and any hope for competitiveness, economic growth and creation of employment.
Data availability
All the data supporting the results of this study are included in the article itself.
Declarations
I have no competing interests to declare. I have no AI or LLM use to declare.
References
1. Garfield E, Malin MV, Small H. Citation data as science indicators. In: Elkana Y, Lederberg J, Merton RK, Thackray A, Zuckerman H, editors. Toward a metric of science: The advent of science indicators. New York: John Wiley & Sons; 1978. p. 179–207.
2. Godin B. The most cherished indicator: Gross domestic expenditures on R&D (GERD) in measurement and statistics on science and technology. Montreal: Canadian Science and Innovation Indicators Consortium (CSHC); 2004.
3. Centre for Science, Technology and Innovation Indicators (CeSTII). South African National Survey of Research and Experimental Development: Statistical report 2022/23. Pretoria: Human Sciences Research Council; 2024. Available from: https://hsrc.ac.za/wp-content/uploads/2024/11/RD_S tatisticalReport2022-23_WEB.pdf
4. South African Department of Science and Technology (DST). A study on building a cadre of emerging scholars for higher education in South Africa. Pretoria: DST; 2018. Available from: https://www.dsti.gov.za/images/2018/E merging-Scholars_22.pdf
5. Forgasz HJ, Leder GC. Academics: How do they spend their time? Paper presented at: NZARE/AARE Conference; 2003 November 29 – December 03; Auckland, New Zealand. 2003. p. 361–368. Available from: https://www.aar e.edu.au/data/publications/2003/for03109.pdf
6. Organisation for Economic Co-operation and Development (OECD). Frascati manual supplement. Paris: OECD; 1989.
7. South African National Advisory Council on Innovation (NACI). South African science technology and innovation indicators. Draft report. Pretoria: NACI; 2025.