The Africa Unit for Transdisciplinary Health Research (AUTHeR), North-West University, South Africa
EDITOR-IN-CHIEF
Leslie Swartz
Academy of Science of South Africa
EDITOR-IN-CHIEF MENTEE
Doniwen Pietersen
College of Education, Unisa, South Africa
MANAGING EDITOR
Linda Fick
Academy of Science of South Africa
ONLINE PUBLISHING SYSTEMS
ADMINISTRATOR
Nadia Grobler
Academy of Science of South Africa
ONLINE PUBLISHING ADMINISTRATOR
Phumlani Mncwango
Academy of Science of South Africa
ASSOCIATE EDITORS
Pascal Bessong
HIV/AIDS & Global Health Research Programme, University of Venda, South Africa
Chrissie Boughey
Centre for Postgraduate Studies, Rhodes University, South Africa
Teresa Coutinho
Department of Microbiology and Plant Pathology, University of Pretoria, South Africa
Thywill Dzogbewu
Department of Mechanical and Mechatronics Engineering, Central University of Technology, South Africa
Jemma Finch
School of Agricultural, Earth and Environmental Sciences, University of KwaZulu-Natal, South Africa
Jennifer Fitchett
School of Geography, Archaeology and Environmental Studies, University of the Witwatersrand, South Africa
Vusi Gumede
Faculty of Economics, University of Mpumalanga, South Africa
Stefan Lotz
South African National Space Agency
Philani Mashazi
Department of Chemistry, Rhodes University, South Africa
Sydney Moyo
Department of Biological Sciences, Louisiana State University, LA, USA
ASSOCIATE EDITOR MENTEES
Simone Dahms-Verster School of Geography, Archaeology and Environmental Studies, University of the Witwatersrand, South Africa
Tim Forssman
School of Social Sciences, University of Mpumalanga, South Africa
Nkosinathi Madondo
Academic Literacy and Language Unit, Mangosuthu University of Technology, South Africa
Lindah Muzangwa Agricultural Sciences, Royal Agricultural University, UK
Pfananani Ramulifho
Department of Environmental Sciences, University of South Africa, South Africa
Shane Redelinghuys
National Institute for Communicable Diseases, South Africa
South African Journal of Science
EDITORIAL ADVISORY BOARD
Saul Dubow
Smuts Professor of Commonwealth History, University of Cambridge, UK
Pumla Gobodo-Madikizela Trauma Studies in Historical Trauma and Transformation, Stellenbosch University, South Africa
David Lokhat Discipline of Chemical Engineering, University of KwaZulu-Natal, South Africa
Robert Morrell
School of Education, University of Cape Town, South Africa
Pilate Moyo Department of Civil Engineering, University of Cape Town, South Africa
Catherine Ngila African Foundation for Women & Youth in Education, Sciences, Technology and Innovation, Nairobi, Kenya
Daya Reddy
Applied Mathematics, University of Cape Town, South Africa
Linda Richter
DST-NRF Centre of Excellence in Human Development University of the Witwatersrand, South Africa
Brigitte Senut
Natural History Museum, Paris, France
Benjamin Smith Centre for Rock Art Research and Management, University of Western Australia, Perth, Australia
Himla Soodyall Academy of Science of South Africa, South Africa
Lyn Wadley
School of Geography, Archaeology and Environmental Studies, University of the Witwatersrand, South Africa
Published by the Academy of Science of South Africa (www.assaf.org.za) with financial assistance from the Department of Science, Technology & Innovation
Design and layout
Lumina Datamatics
Correspondence and enquiries sajs@assaf.org.za
Copyright All articles are published under a Creative Commons Attribution Licence. Copyright is retained by the authors.
Disclaimer
The publisher and editors accept no responsibility for statements made by the authors.
Submissions
Submissions should be made at www.sajs.co.za
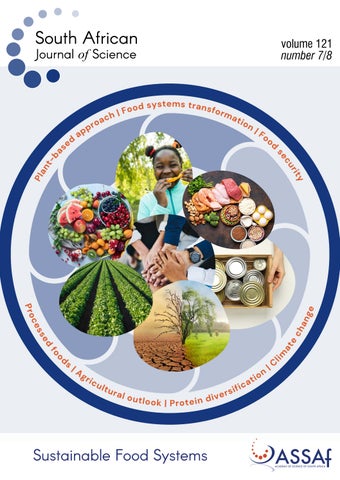
On the cover
Mapping underutilised and emerging food sources and technologies as solutions to food insecurity in South Africa
Lisa-Claire Ronquest-Ross, Gunnar O. Sigge 63
Proximate and fatty acid compositions of smoked underutilised South African mussel Choromytilus meridionalis
Suné Henning, Sinazo Matika, Ayodeji B. Oyenihi 71
Characterisation of Bambara groundnut landraces: Nutritional and proximate composition
Mosima M. Mabitsela, Sydney Mavengahama, Marthinus J. Booysen, Ethel E. Phiri 78
Impact of nitrogen fertilisation on cactus pear mucilage functionality
Vuyelwa Nkoi, Maryna de Wit, Angeline van Biljon, Johan van Niekerk, Brandon van Rooyen, Wilben Pretorius .................................................................................... 89
Sustainable strategies for sodium reduction in biltong by improving healthiness without impairing safety
Rita Opperman, Barbara E. van Wyngaard, MacDonald Cluff, Carina Bothma, Eileen Roodt, Celia Hugo, Arno Hugo 99
An environmental, economic and nutrient index for milk and plant-based beverages in South Africa
Enrike Maree, James N. Blignaut, Cornelius J.L. du Toit, Heinz H. Meissner 105
Palm oil in salty snacks: A South African labelling audit on sustainability communication
Andrew Thatcher, Olivier Crespo, Peter Johnston, Ammaarah Darsot ........................................ 122
Funding South Africa’s food and nutrition policy: Estimates for the 2018–2022 funding cycle
Peter T. Jacobs, Vandudzai Mbanda, Sisonke Mtyapi 130
A learning journey approach to food security in a South African foodshed Scott Drimie, Julian May 138
A sustainable food system provides food security and nutrition for all, without compromising the environmental, social and economic foundations for future generations. This special issue entitled ‘Sustainable Food Systems’ draws on a range of disciplines to present a comprehensive overview of articles that reflect on the importance of local food systems to stimulate the production of healthy, safe and sustainable food resources.
(Cover design: Nadia Grobler)
Guest Leader
Author: Annchen Mielmann1
AFFILIAtIoN:
1The Africa Unit for Transdisciplinary Health Research (AUTHeR), North-West University, Potchefstroom, South Africa
CorrESPoNDENCE to: Annchen Mielmann
EMAIL: Annchen.Mielmann@nwu.ac.za
hoW to CItE: Mielmann A. Will protein diversification lead to sustainable food systems in southern Africa? S Afr J Sci. 2025;121(7/8), Art. #22457. https://doi.org/10.17159/sa js.2025/22457
Will protein diversification lead to sustainable food systems in southern Africa?
Food is essential for human life, but current food production and consumption practices are unsustainable, resulting in food insecurity for many people.1 Over 60 million people in southern Africa are projected to experience food insecurity.2 Food security is when people have social, physical and economic access to safe and healthy food3 –and serves as an indicator of inclusive economic growth and sustainability.4 Sustainability of food systems should generate food and nutrition security for future generations in the long term without compromising socio-economic and environmental foundations.5 The Sustainable Development Commission describes a sustainable food system as one that feeds all people healthily, sustainably and equitably while being distinct, environmentally friendly and persistent.6
This special issue of the South African Journal of Science, entitled ‘Sustainable Food Systems’, presents a comprehensive overview of articles that reflect on the importance of local food systems to stimulate the production of healthy, safe and sustainable food resources. Southern Africa faces many modern challenges in the creation of a sustainable food system due to the combined pressure of environmental, social and economic factors. What we eat and the way we produce our food greatly impact our land, climate, biodiversity, health and well-being, and communities.7 To make diets healthier and food systems more sustainable, southern Africa needs a platform to link researchers and their findings. Boosting the United Nations Sustainable Development Goals (SDGs) requires an urgent transformation of food systems. In reality, the current food production and consumption patterns in southern Africa creates complex sustainability challenges that are driving humanity out of a safe functional space. These challenges include diet-related health problems, food insecurity, socio-economic inequalities and environmental degradation. To effectively address these challenges will require integrated and systemic policy approaches.8 Therefore, the contributions in this special issue draw on a range of disciplines to advance our understanding of food sustainability, food security and nutrition in southern Africa. Due to the rapid increase in the human population, a major challenge in maintaining global food security is increasing our current food production within the near future.9
Plant-based approach
The Commentary by Smith et al. provides stakeholder insights and policy recommendations from the InnoFoodAfrica Project on traditional African foods. To achieve the priorities of sustainable nutrition and food security solutions in South Africa, smallholder farmers need multilevel support to expand the production and consumption of indigenous and traditional African food crops (ITFC). Public education is required to transform local perspectives on protein intake and the benefits of ITFCs. Furthermore, it is suggested that the government must exempt ITFCs from value-added tax (VAT) to promote their mainstream commercial viability.
Ronquest-Ross and Sigge identify underutilised or emerging new food sources and technologies and reveal that some of these, such as indigenous African crops and food waste recovery, could be available to South Africans within 3–5 years, as they are rated highest in their ability to meet the nutritious, safe and relevant for South Africans criteria identified. One such example of an indigenous African crop is Bambara groundnut. Mabitsela et al. find that understanding the nutritional value of Bambara groundnut enables informed agricultural strategies, promoting its cultivation as a sustainable nourishment source and resilience against food insecurity.
Wyma et al. review the extent of African food-based dietary guidelines and analyse their inclusivity of plant-based dietary patterns and reveal a considerable shortfall in official recommendations for the broad spectrum of plant-based diets. The guidelines should be inclusive of plant-based dietary patterns and provide information for people who choose to eat plant-forward diets to promote healthy diets from sustainable food systems. This implies the need to offer more alternatives in plant-based food ingredients for sustainable product development. Nkoi et al. look at the impact of nitrogen fertilisation on cactus pear mucilage functionality. The functionality of the mucilage is attributed to its protein content and highlights the impact of nitrogen fertilisation on mucilage properties. Understanding how nitrogen affects mucilage functionality provides insights for crop management and sustainable food production.
Maree et al. developed a specialised sustainability model for milk and plant-based beverages, adaptable by different countries. This is achieved using the Dairy Index for Environment, Economics, and Nutrition (DiEET) model’s approach that has advanced the existing understanding of the sustainability of bovine milk versus plant-based alternatives like almond, soy and oat beverages. It serves as a practical tool for stakeholders, promoting consumer education and guiding industry practices towards sustainability. Its application can enhance sustainability evaluations and contribute to global efforts in monitoring SDGs.
Agricultural outlook
Agricultural transformation must embrace diversification to meet the challenges posed by climate change, food insecurity and health threats. A cohesive agricultural education and training (AET) system is required that identifies the needs of our entire food system and delivers responsive pedagogies that combine learning sources. Fry et al. investigate the performance of the AET system using an Agricultural Innovation System lens and identify specific factors that hinder AET system performance. The absence of communication and coordination mechanisms contributes to a disenabling environment for AET supportive networking, leading to missed opportunities to facilitate between food system actors and AET providers to develop transdisciplinary research and contribute to sustainable food systems.
2025 https://doi.org/10.17159/sajs.2025/22457
Habanyati and Paramasivam analyse the characteristics, strengths and limitations of various extension models in sustainable agriculture adoption. Their findings reveal that adoption rates of sustainable agricultural practices among smallholder farmers are typically low across the selected countries, with the exception of organic farming and climate-resilient practices, which exhibit medium adoption rates. Policymakers and practitioners should prioritise the development of extension strategies that are economically viable and tailored to the specific needs and constraints of smallholder farmers. This emphasises the significant role of the agro-food sector in accomplishing food sustainability achieved by developing specific strategies for a sustainable food system for the entire food chain. One of these strategies pertains to an environmentally sustainable agro-food sector that is resilient to climate change.4
Climate change
Climate change will radically impact the planet’s water and soil, which consecutively affect food production.4 Developing countries are attempting to mitigate climate change; however, the potential of complementary proteins for food security goals and mitigating climate impacts is still underrepresented in sustainable food research. Thatcher et al. compare the seasonal climate forecast (SCF) needs and the possible arising farming actions of commercial farmers and smallholder farmers while exploring the prospects for developing SCF tools to aid farmers. It is important to understand what farmers need to know to perceive and make use of SCFs, and to bring guidance to bridge the gap between existing SCF products and taking more informed farming actions that will increase their resilience to climate change and improve their food security. This will enable stakeholders to build seasonal climate forecasting information tools that can be easily accessed and understood by commercial and smallholder farmers alike.
Processed foods
Processed food products are widely consumed in southern Africa and will continue to be a fundamental component of the modern food supply and consumers’ diet. The current challenge is to identify practical strategies to ensure that the nutritive attributes of these foods meet the needs of modern consumers. Protein-rich animal-based foods such as biltong have a very high salt content, but it is essential to ensure that these snack products keep up and adhere to modern consumers’ health and nutritional demands. Opperman et al. reveal that sustainable strategies such as a 50% reduction in salt is possible without adverse effects on biltong’s chemical, microbial or sensory quality, which could improve healthiness without impairing safety. Food safety culture is becoming increasingly important in the food industry as it has transitioned from a single compliance-based concept to a comprehensive organisational value that is vital for ensuring food safety.10 Lues and Visser delve into food safety culture perspectives and suggest a food safety culture improvement pipeline by proposing six steps for continuous improvement in order to enforce additional risk-mitigation behaviours beyond compliance.
Sishi-Vilakazi and De Kock investigated the prevalence of palm oil and its derivatives in salty snack products, the presence of sustainability claims, including the Roundtable on Sustainable Palm Oil (RSPO) certification logo, and other types of claims on salty snack product labels. Their results highlight that, despite the prominence of palm oil, none of the products featured the RSPO certification logo or communicated sustainable palm oil sourcing practices. These findings reveal that while palm oil use is widespread in salty snacks, engagement with palm oil sustainability concerns is lacking. By adopting and promoting the use of certified sustainable palm oil, the industry can meet rising consumer demand for ethical practices, reduce its ecological footprint and position itself as a leader in sustainable food production.
Henning et al. determine the proximate and fatty acid compositions of smoked underutilised South African mussel Choromytilus meridionalis It is a valuable food with a high protein content and a well-balanced fatty acid composition, rich in omega-3 fatty acids. Currently, this species is underutilised as a commercial food product and shows potential as a functional ready-to-eat food that could contribute to food security. Given South Africa’s current obesity crisis and high
burden of non-communicable diseases, an immediate transition from ultra-processed to minimally processed food will have little success. Therefore, the current research priority is to understand the higher consumption rates of processed foods and to adopt a more holistic approach to consider how food, consumer and sensory science methodologies can directly drive sustainable food consumption to influence the rate and extent of protein intake.
Food security
Innovative strategies to strengthen a pressurised African food system are required to address the challenges associated with food insecurity. Some of these strategies to address the multiple challenges include promoting environmental sustainability and sustainable resource management, supporting local economic development, and ensuring food security.11,12 Drimie and May suggest implementing the learning journey approach to food security in a South African foodshed. Through revealing systemic issues in the local food system through direct experience of a local environment, learning journeys can co-produce knowledge in support of responses to the underlying complexity. Learning journeys move beyond extractive research towards collaborative learning that can, with concerted follow-up, result in locally appropriate bottom-up systems change.
Ferreira and Botha explore baseline insights into the food practices and needs of a South African resource-constrained community. In resource-constrained communities, the accessibility, availability and limited consumption of healthy food are strongly influenced by poverty. This argument confirms the relevance of custom-made interventions that can be used to promote healthy consumption habits in specific communities, against the background and importance of broader systems and holistic transformation that can support food security on a wider level. Drimie et al. examine fresh produce access and consumption patterns in Inchanga, eThekwini, to understand how strengthening linkages between small-scale farmers and consumers could improve local food systems. Their study indicates that cost, rather than knowledge, is the primary barrier to adequate fresh produce consumption in low-income communities, although some misinformation on food prevails. Furthermore, three factors that enable healthy eating were identified: (1) gradual food introduction; (2) growing one’s own food; and (3) fresh food preference. Establishing local markets supported by appropriate public policy could simultaneously address farmers’ economic needs and consumers’ nutritional requirements, thus strengthening the resilience of local food systems.
South Africa’s National Food and Nutrition Security Plan (NFNSP) accentuates the importance of food security as a means to ensuring that South Africa has a dependable and sufficient supply of food to meet the nutritional requirements of its population. Unfortunately, stakeholders have identified a number of challenges to the Plan’s implementation. These challenges include financial constraints, specifically the size of the Plan’s budget and insufficient funding.13 Jacobs et al. used an elementary funding gap equation for a systematic calculation of the funds needed for the Plan. They built a unique data set based on historical spending information for 2018-2022 and found that national and subnational government departments dominate funding sources for food and nutrition policy activities. Furthermore, aggregation of all available funding sources revealed that authorities met only 50% of the Plan’s funding needs after 4 years, and thus fell short of meeting its target. Jacobs and colleagues suggest that a holistic approach to financing food and nutrition policy is essential to achieve constitutionally protected food rights and SDG imperatives.
Protein diversification
Proteins are made up of amino acids that are essential in maintaining optimal health.14 By 2050, the world population will exceed 9.1 billion, creating further demand for a variety of protein foods as the population grows. Alternative proteins are critical for developing sustainable food systems and climate-resilient agriculture. In Africa, where protein deficiency is prevalent, protein demand is projected to escalate over the next two decades as the continent’s population doubles. The challenge lies in identifying diverse protein sources, including plant-based, cultivated and insect-based proteins, while addressing the environmental costs of traditional animal protein production, which is resource intensive and
increasingly expensive. The increase in plant proteins in current diets has resulted in multiple studies to improve the application of plant proteins in the pharmaceutical and food industries through modification methods. The latter could increase their bioavailability, techno-functionality, bioactivity and digestibility properties.14 This brings up the issue of whether protein diversification will lead to sustainable food systems in southern Africa.
Katz-Rosene and colleagues15 suggested three “meta-narrative coalitions” on protein sustainability which explore the heterogeneous character of protein foods that could contribute to sustainable food systems: (1) modernising proteins, which aims to centre technological innovations; (2) reconstituting proteins, which aims to introduce new protein food products and reduce animal protein consumption; and (3) regenerating proteins, which aims to restore human–nature relations within protein manufacturing and consumption practices. As confirmed by the researchers, the diversity of strategies for a sustainable protein future may be at stake and could delay food system transformation. According to the International Panel of Experts on Sustainable Food Systems16, many of the conversations on protein sustainability are politicised and ideological (unwavering) viewpoints. Therefore, the Panel requested realignment of innovation routes through retrieving false protein claims and encouraging open and healthy conversations. A possible solution is understanding the value of protein pluralism that could ensure a more resilient transition, preventing one meta-narrative coalition from becoming more dominant and rather ensuring that all three protein meta-narratives are actively engaged in advancing the current unsustainable food system in southern Africa.15 This raises the question: is protein pluralism a means towards enhancing resilience in the southern African food system of tomorrow?
Food systems transformation
The answer to this question most likely lies in the development of research skills to lead food systems transformation through engaged, transdisciplinary science. The Commentary of Swanepoel and MentzCoetzee reflects on the Food Systems Research Network for Africa (FSNet-Africa) model of strengthening research capacity for food systems transformation in Africa. Their approach demonstrates how locally grounded, stakeholder-informed research can drive sustainable change, offering a replicable model for building the next generation of African scientists committed to equitable and inclusive food systems development. Achieving sustainable food systems in southern Africa will require researchers with a diverse set of skills who can collaborate across disciplines and outside of academia. The Commentary by Wale and Gandidzanwa explores the concept of sustainable food systems transformation and asks if we are attempting to eat the elephant in one piece? Their article highlights that, while transformation is a viable vision, sustainable food systems cannot be considered unidimensional. Framing sustainability and sustainable food systems as a journey and the outcome as a continuum, enables us to realise that food systems are constantly evolving, shaped by changing ecological conditions, social demands and political contexts.
Concluding remarks
The findings from this special issue restate that enhancing African food systems requires a modern multifaceted approach that includes innovation and knowledge, technological advancements and a digital revolution, and trade and innovative financing for a sustainable future. Southern Africa’s youth is its most valuable resource. The potential to harness our youth segment is inspiring but, without the required expenditure, an inadequate workforce could place a gigantic burden on African food systems. Therefore, for future purposes, it is vital to empower our youth through vocational training, entrepreneurship and continuous learning in the agri-food sector that will drive innovative solutions and purposeful leadership. Transforming current food systems into more sustainable ones will not surface automatically. It requires a transformation in food system governance, which is about how farmers, companies in agri-food chains, banks, governments, NGOs and other
stakeholders interact and try to influence each other in order to achieve their objectives. Sustainable food systems require a deeper integration of many disciplinary viewpoints. It is essential to recognise the complexity of designing the right policy to improve food security for the southern African context.
r eferences
1. Runhaar H. Governing towards sustainable food systems: New connections for more diversity. Int J Agric Sustain. 2025;23(1), Art. #2475254. https://d oi.org/10.1080/14735903.2025.2475254
2. UN News. Horn of Africa: Around 60 million in urgent humanitarian need. UN News. 2023 June 26. Available from: https://news.un.org/en/story/202 3/06/1138087
3. Sumsion RM, June HM, Cope MR. Measuring food insecurity: The problem with semantics. Foods. 2023;12(9), Art. #1816. https://doi.org/10.3390/fo ods12091816
4. Wijerathna-Yapa A, Pathirana R. Sustainable agro-food systems for addressing climate change and food security. Agriculture. 2022;12(10), Art. #1554. https://doi.org/10.3390/agriculture12101554
5. Nguyen H. Sustainable food systems concept and framework [document on the Internet]. c2018 [cited 2025 Jul 02]. Available from: https://openknow ledge.fao.org/server/api/core/bitstreams/b620989c-407b-4caf-a152-f790f5 5fec71/content
6. Sustainable Development Commission. Food security and sustainability: The perfect fit [document on the Internet].c2009 [cited 2025 Jul 02]. Available from: https://www.sd-commission.org.uk/data/files/publications/SDCFood SecurityPositionPaper.pdf
7. Willett W, Rockström J, Loken B, Springmann M, Lang T, Vermeulen S, et al. Food in the Anthropocene: The EAT–Lancet Commission on healthy diets from sustainable food systems. Lancet. 2019;393(10170):447–492. https://www.the lancet.com/journals/lancet/article/PIIS0140-6736(18)31788-4/fulltext
8. Guerrieri V, Borchardt S, Listorti G, Marelli L, Vittuari M. Time to transform? Sustainability narratives for European food systems. Glob Food Secur. 2025;44, Art. #100831. https://doi.org/10.1016/j.gfs.2025.100831
9. Wahbeh S, Anastasiadis F, Sundarakani B, Manikas I. Exploration of food security challenges towards more sustainable food production: A systematic literature review of the major drivers and policies. Foods. 2022;11(23), Art. #3804. https://doi.org/10.3390/foods11233804
10. Pai AS, Jaiswal S, Jaiswal AK. A comprehensive review of food safety culture in the food industry: Leadership, organizational commitment, and multicultural dynamics. Foods. 2024;13(24), Art. #4078. https://doi.org/1 0.3390/foods13244078
11. Zougmoré RB, Läderach P, Campbell BM. Transforming food systems in Africa under climate change pressure: Role of climate-smart agriculture. Sustainability. 2021;13(8), Art. #4305. https://doi.org/10.3390/su13084305
12. Carloni E, Giordano C, Di NL, Mulazzani L, Setti M, Falasconi L, et al. Promoting sustainable food systems: An empirical analysis of local food hub governance models and structures in 12 African settings. Environ Sci Policy. 2025;164, Art. #103983. https://doi.org/10.1016/j.envsci.2024.103983
13. South African Department of Planning, Monitoring and Evaluation (DPME). Implementation evaluation of the national food and nutrition security plan full report. Pretoria: DPME; 2023. Available from: https://www.dpme.gov.za/keyf ocusareas/evaluationsSite/Evaluation%20Reports/Genesis%20DPME%20NF NSP%20Full%20Evaluation%20Report%2002.11.2023.pdf
14. Varzakas T, Smaoui S. Global food security and sustainability issues: The road to 2030 from nutrition and sustainable healthy diets to food systems change. Foods. 2024;13(2), Art. #306. https://doi.org/10.3390/foods13020306
15. Katz-Rosene R, Heffernan A, Arora A. Protein pluralism and food systems transition: A review of sustainable protein meta-narratives. World Dev. 2023;161, Art. #106121. https://doi.org/10.1016/j.worlddev.2022.106121
16. IPES-Food. The politics of protein: Examining claims about livestock, fish, ‘alternative proteins’ and sustainability. Brussels: IPES-Food; 2022. Available from: https://www.ipes-food.org/_img/upload/files/PoliticsOfProtein.pdf
AuthorS: J.F. Ryk Lues1 Monique Visser1
AFFILIAtIoN:
1Centre for Applied Food Sustainability and Biotechnology, Faculty of Health and Environmental Sciences, Central University of Technology, Bloemfontein, South Africa
CorrESPoNDENCE to: Ryk Lues
EMAIL: rlues@cut.ac.za
hoW to CItE: Lues JFR, Visser M. Will Sam report the drain? Food safety culture perspectives and considerations for continuous improvement. S Afr J Sci. 2025;121(7/8), Art. #22458. https:// doi.org/10.17159/sajs.2025/22458
Sam report the drain? Food safety culture perspectives and considerations for continuous improvement
Significance:
Food safety culture (FSC) has emerged as a pivotal food safety determinant, with added benefits to broader organisational culture and overall performance. In recent years, FSC has been incorporated into a number of global standards and has moved stakeholders to engage with the implementation and conformance protocols. With the evolution of FSC, the realisation emerged that it encompasses multiple interdisciplinary concepts that introduce new best-practice requirements in risk mitigation, the validity and reliability of assessments, and the effectiveness of interventions. In addition to the extensive standards in the public domain that respond to, and guide, FSC components, this Perspective aims to provide additional context and contribute to the body of knowledge regarding FSC. The information should benefit industry in particular, by providing food for thought and practical solutions and advancing continuous improvement through empowerment and capacity.
What would Sam do?
Samantha (Sam) is a food handler at a chicken processing facility. Her primary function is trimming off-cuts from chicken portions. She works 10-hour shifts standing upright, with 15-minute morning and afternoon breaks and a 30-minute lunch break. On a typical day, she handles about 7000 chicken portions per shift. Travel from her home to her workplace is an hour’s drive using public transport and requires walking to and from the taxi ranks; she allows about 2 hours for travel daily.
One day, as she finishes her shift and hurries to catch her taxi home, she notices an unpleasant, pungent odour from a drain in an adjacent processing area. Knowing that this location is outside her area of responsibility and lacks monitoring systems, she is well aware that if she ignores the odour, her behaviour is unlikely to be detected, nor have any consequences. In this scenario, Sam is unlikely to reflect on standards and compliance protocols, quality control measures, organisational performance or reputation. Rather, her thoughts are likely to be on her fatigue, whether her ride home will be safe and on time, how she will make ends meet, and her family’s well-being.
One may argue that in situations like this, food safety management systems should prevail, as they are intended to address food safety risks through monitoring and testing procedures, standards and policies, compliance schedules, audits and the like. Such systems should effectively trigger responses and corrective actions when deviations occur. However, reality has taught that no system is foolproof (in the Sam analogy, for example, the system failed to monitor and maintain the drains effectively). Seeing that food safety and spoilage incidences occur continuously, in situations in which the processes fall short, the remaining risk mitigation prospect is the human element, necessitating considerations that will encourage the correct human response. The Sam analogy highlights that our thoughts determine our actions, and to influence and direct behaviours, it is essential to address the issues that occupy food handlers’ minds and sentiments. Ultimately, in the workplace, the thoughts that drive actions beyond key performance indicators are not primarily policy or process driven, but informed by subjective considerations such as belonging and ownership, respect, trust and loyalty.
An interdisciplinary concept
Informed by current-day developments in technology, applied knowledge and interdisciplinary approaches, service providers and regulatory bodies have increasingly realised that the food continuum consists of multi-faceted components wherein the humanities play an integral part. The farm-to-fork pipeline boasts a plethora of entities in which agriculture, primary and secondary processing, packaging, distribution, wholesale and retail, and hospitality are integral and where human behaviour is profound. Food-related risks, whether biological, chemical or physical, can be introduced during any step in the mentioned pipeline, and, therefore, to fully understand and mitigate food-borne risk, an understanding is needed of the multifaceted composition of food production and provision. This has brought about a unique interplay among disciplines such as organisational psychology, food safety, consumer sciences, public health and the like.
Apart from consumer sciences, the social sciences and humanities have not had much reflection within the food safety discipline, with the latter historically regarded as a natural science field. Food scientists, technologists and microbiologists are not usually versed in the social sciences and psychology, nor are they officially registered to engage in mainstream industrial psychology and organisational culture interventions. The emergence of food safety culture (FSC) has brought with it a novel narrative in which the human facet of food production, distribution and service has been acknowledged, along with the intermingling of the natural and social disciplines. This combination encompasses multi-, inter- and transdisciplinary considerations, which are peripheral to the specialist foci of educational- and industry-related food science and technology. In order not to infringe on the mandates of portfolios such as human resources (HR), FSC interventions should be unambiguously acknowledged as food-safety-focused interventions with likely secondary benefits for the broader organisational culture, and not vice versa
Considering the general human behavioural determinants widely published and debated in the literature, such as emotion, need, consequence, environment, competency and the like, why elevate organisational culture in particular to influence behaviour? Literature on FSC offers a multitude of theories and models1-5, with a simple reason being: “We do what other people do.” Yiannas pointed to this as being “homophily” – the concept describing our tendency to associate with, and mimic similar others.6 An intriguing demonstration of this is the Joshua Bell Subway Violin Experiment conducted in January 2007, when The Washington Post led a social experiment featuring renowned violinist Joshua Bell.7 Known for performing in prestigious concert halls, Bell played in a busy subway station (L’Enfant Plaza) in Washington, D.C., dressed casually and without recognition. He played six classical pieces on an expensive Stradivarius violin during the morning rush hour. Despite his virtuosity, very few commuters stopped to listen and only a handful of people noticed the music, with even fewer taking the time to engage. The experiment highlighted how society often overlooks aspects with potential importance, in the absence of associated human interest or support. If people were observing and creating hype around Bell, he would likely have received significantly more attention.
Getting the boss on board
Considering that people tend to mimic other people’s behaviours, one would expect this to be even more the case with leadership.8 Although organisational leadership may be accommodating and amenable to participating in food safety intervention activities such as interviews, surveys or focus groups, one should acknowledge that the measure of authority and responsibility of the managing director, chief executive officer or general manager extends significantly wider than only food safety assurance. When engaging leadership, traits such as competence, experience, respect and diplomacy demonstrated by internal as well as third-party food safety assurance representatives are pivotal. Occasionally, an atmosphere of petulance arises when the leadership collective is summoned to participate in food safety assessments and are asked to respond to questions during which the organisation’s best and worst are laid bare for scrutiny. The interchange with the regulatory representatives can be complex; on the one hand, management holds the line function authority and ultimate operational accountability, and on the other, the perceived veto power is held by the regulator or auditor which may, in a worst-case scenario, result in non-conformances, termination of pivotal contracts, reputational damage and financial consequence. Management is known for sometimes considering product safety as a necessary evil intended to mitigate risk, rather than contributing to output and financial viability, and regard regulations and standards as enablers to absolve them of food-safety-related consequences only. To the contrary, recent food-safety-related litigation arguments have considered aspects broader than only compliance, with the required standards prompted by, for example, consumer protection and related legislation, asserting that food-safety-related incidences may have originated from food handlers who were ill informed, ignorant or hesitant to look out for and report risks beyond their primary function. The terminology that alludes to this is “duty of care”, defined as: “A moral or legal obligation to ensure the safety or well-being of others by maintaining a reasonable standard of care.”9 Increasingly, the FSC narrative has promoted the principle that the food industry has an obligation to apply its mind to ensure safe products beyond only the set limits and standards. This requires the involvement of organisational departments and reporting levels broader than only the safety and quality assurance portfolios.
“In the bigger scheme of things, the average piece of junk is probably worth more than our criticism designating it so” (Anton Ego in the 2007 animated film Ratatouille; Bird and Pinkava, 2007). This metaphor proposes sparing a thought for the leadership of the multitude of food production and distribution businesses, from small- to medium-sized enterprises to multinationals, that must balance compliance with keeping the company afloat amidst pandemics, trade wars, labour demands and economic fluctuations. In a way, it is conceivable that management prioritises financial sustainability in times of economic difficulty. Fortunately, the benefits of a conducive and mature FSC and its effect on the broader organisational culture and performance have been clearly demonstrated, justifying
FSC interventions beyond only a conformance-led and resource-tapping exercise.1,5,10,11
Evolution of the standards
Food safety standards and certification systems are rolled out globally for good reason, with clearly demonstrated benefits being the unequivocal kerbing of food-safety-related outbreaks, losses and mortalities. Therefore, the principle of a conducive FSC ‘beyond’ and not ‘instead of’ systems needs to be acknowledged and reiterated. The dichotomy in formalising FSC principles has been that a concept promoted as ‘doing something because it’s the way we do things around here, even with no one watching’, has been incorporated into the standards. To navigate the process, one should consider this seeming contradiction as a measure to introduce and impart a concept that is still relatively novel in the food production continuum, with a fair amount of uncertainty still surrounding it.
The development of the various standards that address FSC are rooted in HACCP and related risk assessment, management and mitigation systems created in the 1960s, with the subsequent milestones being: the ISO standard followed the Codex Alimentarius principles related to food hygiene (1969); HACCP was incorporated into the European Union regulations (1991) and adopted globally; the ISO 22000 1st Issue was released (2005); it was incorporated into the FSSC 22000 certification scheme; ISO 22000:2018 was published (2018) and, most recently, FSSC 22000 V6.0 (2023).12 In terms of the BRC standard, components such as continuous improvement (2010), the introduction of an FSC module in 2018, and formal integration into the BRCGS standard (2022)13 have guided the development. The SQF and IFS systems also recognise FSC components, which are enhanced through GFSI benchmarking.5 The respective standards continue to evolve, focusing on how FSC is implemented and maintained in diverse and multifaceted food manufacturing and processing environments and cultures. Ultimately, the standards aim at holistic food safety assurance through developing organisational cultures that promote food safety performance.2 5 10
Integrity of the process
Often, during FSC interventions, respondents and staff from portfolios not directly involved with the physical handling of products question the reasons for having to participate in the process. The principle that employees on all levels should understand and embrace their roles in the organisation, as they relate to food safety, is grippingly demonstrated by the anecdote of John F. Kennedy and the janitor14: During a visit to the NASA space centre in 1962, JFK was touring the facility when he came across a janitor sweeping the floors. JFK, curious about the man’s role, asked him what he did at NASA. The janitor, without hesitation, responded, “I’m helping put a man on the moon”. In the context of food safety, it is essential that all employees on all levels acknowledge that they have an important role to play in ensuring safe and wholesome products for customers.
In addition to ensuring broad participation and representation, reliable and valid data collection, processing and interpretation are essential for informed decision-making during FSC interventions: ‘You can’t improve what you can’t measure.’ When engaging a food production facility across its various levels and portfolios, moral and ethical considerations are key to minimising risk and harm while ensuring the validity and reliability of assessments and interventions. Avoiding activities that could harm participants physically, emotionally, or psychologically is crucial, because when respondents are unsure about the anonymity of their responses, they may not be entirely honest, impacting the accuracy of the data. Several best practices have been documented and recommended to promote respondent well-being and engagement, such as informed consent and voluntary participation. These should ensure that participants are fully informed about the purpose, potential risks and benefits of their engagement, allowing them to decide freely whether to participate. Permissions should also include organisational authorisations and buy-in from stakeholders such as labour unions and support departments, in order to provide access, foster trust and goodwill, and improve response rates. Local and regional acts and regulations, such as those protecting personal information (e.g. GDPR, POPIA) should
Figure 1: The food safety culture improvement value chain (based on data from Thorsen et al.15).
also be considered and adhered to. Using aggregated data can further assist in maintaining anonymity in small departments and sections, and circumvent the involvement of internal staff in the assessment process, which may introduce a conflict of interest. Providing options for written reactions in focus groups can further protect participants’ identities in cases where respondents may consider fellow focus group members to not be trustworthy.
Let’s do this
With the exception of organisations with a proven record of FSC advancement, scientists or organisational culture experts who may be interested in FSC assessment findings, and perhaps human resources departments looking to optimise strategies and systems, the industry food safety and quality representatives and leadership are likely to be interested in only the bottom-line findings, whether they are accurate, and how to respond and ultimately comply. However, in situations in which the FSC assessment and intervention process is being questioned (e.g. in cases of underperformance and non-compliance), it is pivotal that the process be defendable, secure and logical.
Figure 1 offers a FSC improvement pipeline, proposing six steps: (1) the awareness phase constitutes activities to foster ownership and buy-in on all levels; (2) assessment entails the measurement and interpretation of the prevailing FSC; (3) alignment involves the identification of gaps and linking findings with standard-guided interventions and solutions; (4) improvement constitutes the mapping, ranking and roll out of interventions; (5) internal audit refers to second-party developmental assessments to determine alignment with the standard assessment, and if needed, revisiting of the improvements process to ensure compliance; concluding with (6) independent third-party auditing and certification.
Conclusion
Ultimately, FSC is a means to an end – a strategy to enforce additional risk-mitigation behaviours beyond compliance. Nevertheless, limiting the FSC intent to only compliance and not acknowledging its benefits for broader organisational culture and well-being, would be unfortunate. Embarking on a FSC journey as a means to an end only, while discounting its benefits for overall performance, economic gains and a conducive organisational environment, would be to lose out on its strongest selling points.
Declarations
We have no competing interests to declare. We have no AI or LLM use to declare. Both authors read and approved the final manuscript.
r eferences
1. Pai AS, Jaiswal S, Jaiswal AK. A comprehensive review of food safety culture in the food industry: Leadership, organizational commitment, and multicultural dynamics. Foods. 2024;13(24), Art. #4078. https://doi.org/1 0.3390/foods13244078
2. Da Cunha DT, Prates CB, Canuto IG, Stedefeldt E, Luning PA, Zanin LM. The relationship of food safety culture elements: A serial mediation model. Food Control. 2025;169, Art. #111022. https://doi.org/10.1016/j.foodcont.2024 .111022
3. Sharman N, Wallace CA, Jespersen L. Terminology and the understanding of culture, climate, and behavioural change – impact of organisational and human factors on food safety management. Trends Food Sci Technol. 2020;96:13–20. https://doi.org/10.1016/j.tifs.2019.12.005
4. Jespersen L, Griffiths M, Wallace CA. Comparative analysis of existing food safety culture evaluation systems. Food Control. 2017;79:371–379. https://d oi.org/10.1016/j.foodcont.2017.03.037
5. Global Food Safety Initiative (GFSI). A culture of food safety: A position paper from the Global Food Safety Initiative (GFSI) [document on the Internet]. c2018 [cited 2024 Sep 05]. Available from: GFSI-Food-Safety-Culture-Full.pdf
6. Geeraert J, Rocha LEC, Vandeviver C. The impact of violent behavior on co-offender selection: Evidence of behavioral homophily. J Crim Justice. 2024;94, Art. #102259. https://doi.org/10.1016/j.jcrimjus.2024.102259
7. Dossey L. Noticing. Explore. 2008;4(4):225–227. https://doi.org/10.1016/j. explore.2008.04.006
8. Zhang Y, Hu Z, Tian S, Zhou C, Ding Y. Trickle-down effects of temporal leadership: The roles of leadership perspective and identification with leader. Front Psychol. 2022;13, Art. #1013416. https://doi.org/10.3389/fpsyg.20 22.1013416
9. Aczel MR. Justice without borders: Opportunities from France’s ‘duty of care’ act applied to Uganda. Energy Res Soc Sci. 2021;75, Art. #102034. https:// doi.org/10.1016/j.erss.2021.102034
10. Da Cunha DT, Stedefeldt E, Luning PA, Prates CB, Zanin LIM. Food safety culture as a behavioural phenomenon shaping food safety. Curr Opin Food Sci. 2025;63, Art. #101305. https://doi.org/10.1016/j.cofs.2025.101305
11. Crandall PG, Mauromoustakos A, O’Bryan CA, Thompson KC, Yiannas F, Bridges K, et al. Impact of the Global Food Safety Initiative on food safety worldwide: Statistical analysis of a survey of international food processors. J Food Prot. 2017;80(10):1613–1622. https://doi.org/10.4315/0362-028X .JFP-16-481
12. FSSC. FSSC 22000 Version 6 – Guidance documents [webpage on the Internet]. c2023 [cited 2024 Aug 31]. Available from: https://www.fssc.com/ fssc-22000/documents/fssc-22000-version-6/#guidance-documents
13. BRCGS. BRCGS global standard for food safety. London: BRCGS; 2022. Available from: https://www.brcgs.com/product/global-standard-food-safet y-issue-9/p-13279/
14. Both-Nwabuwe JMC, Dijkstra MTM, Beersma B. Sweeping the floor or putting a man on the moon: How to define and measure meaningful work. Front Psychol. 2017;8, Art. #1658. https://doi.org/10.3389/fpsyg.2017.01658
15. Thorsen M, Hill J, Farber J, Yiannas F, Rietjens IMCM, Venter P, et al. Megatrends and emerging issues: Impacts on food safety. Compr Rev Food Sci Food Saf. 2025;24, Art. #70170. https://doi.org/10.1111/1541-4337. 70170
AuthorS: Katherine A. Smith1
Mohammad N. Emmambux2
Shakila Dada1
AFFILIAtIoNS:
1Centre for Augmentative and Alternative Communication, Faculty of Humanities, University of Pretoria, Pretoria, South Africa
2Department of Consumer and Food Sciences, Faculty of Natural and Agricultural Sciences, University of Pretoria, Pretoria, South Africa
CorrESPoNDENCE to: Mohammad Emmambux
EMAIL: naushad.emmambux@up.ac.za
hoW to CItE: Smith KA, Emmambux MN, Dada S. Stakeholder insights and policy recommendations from the InnoFoodAfrica Project on traditional African foods. S Afr J Sci. 2025;121(7/8), Art. #17677. https:// doi.org/10.17159/sajs.2025/17677
ArtICLE INCLuDES:
☐ Peer review
☐ Supplementary material
KEYWorDS: indigenous and traditional African food crops, stakeholder engagement, sustainable nutrition, food security, food innovations
Stakeholder insights and policy recommendations from the InnoFoodAfrica Project on traditional African foods
Significance:
Supporting systems that provide healthy and safe food ingredients and products and environmentally sustainable nutrition and food security solutions are key local priorities. To achieve these priorities in South Africa, multilevel and multiagency support is needed by smallholder farmers to expand the cultivation, growing, distribution, marketing, and production of indigenous and traditional African food crops (ITFC) and ingredients, as well as the sale, acceptance, and consumption of ITFCs. Public education is required to transform local perspectives on protein intake and the benefits of ITFCs. The government must exempt ITFCs from VAT to promote their mainstream commercial viability.
Malnutrition is considered Africa’s most pressing health and social challenge.1 A triple burden of malnutrition, including undernutrition; overnutrition leading to obesity and diet-related non-communicable diseases; and micronutrient deficiency (or hidden nutrition), is emerging in South Africa.2 Just under half of children under the age of five in South Africa (43%) present with some form of malnutrition.3 The prevalence of stunting in South African children is high at about 27%.3 Stunting and undernutrition increase a child’s vulnerability to poor health, poor developmental outcomes, and mortality. Simultaneously, an estimated 68% of women and 31% of men over the age of 15 years in South Africa are overweight or obese.4 The high prevalence of micronutrient deficiency and overweight malnutrition that occurs alongside stunting is “an emerging feature of food insecurity in South Africa”5(p.20)
The sub-Saharan African diet commonly includes an inadequate intake of animal products and vegetables.6 Three main staples – wheat, maize and rice – provide most of the world’s daily calorie requirements and protein intake. In sub-Saharan Africa, maize is the prevalent staple. Although this affordable and accessible staple crop has a high energy density, refined maize meal commonly lacks macronutrients, for example protein, and micronutrients (vitamins and minerals). Dietary dependency on maize for the provision of daily calorie intake could cause protein-energy malnutrition.7
Local shifts toward urbanisation and changing agricultural production have affected the security of a healthy, acceptable, diverse and affordable food supply.8 The cost and affordability of nutrient-dense foods remain major barriers to consumers accessing nutritious and balanced diets. Foods with high energy density (such as maize products) are comparatively cost-effective energy sources; however, they generally have lower nutrient densities.9 As agricultural production moves away from subsistence farming and rural households attempt to generate income from other sources, large-scale farming faces considerable challenges in meeting the food demand of the growing urban population.8 There is a growing list of groups that are disproportionately vulnerable to food insecurity, including women (particularly women of reproductive age who live in low-income settings), victims of conflict, people with health conditions, people living in low-income urban areas and rural areas, the elderly, and children under the age of five.3,10 Subsequently, there is a pressing need to improve the accessibility, acceptability, availability and affordability of safe and healthy foods and food ingredients with environmentally sustainable nutrition and food security solutions.
Indigenous and traditional food crops (ITFCs), such as sorghum, Bambara groundnut and cowpea, have marked potential to diversify diets and offer viable alternatives to enhance food and nutrition security.11 The availability, affordability and accessibility of safe and nutritious food at national and household levels is included as a strategic goal of the 2014 South African National Policy on Food and Nutrition Security.12 Links between dietary diversity and attaining food and nutrition security are highlighted in this policy. It further asserts that the neglect of indigenous and traditional foods contributes to micronutrient deficiencies. Concerns over environmental degradation, climate change vulnerabilities, and biodiversity losses also support the need to integrate ITFCs into the food-supply system. Indigenous food crops should contribute to the African diet by providing essential micronutrients and health benefits.13 These climate-resistant crops also hold the potential to promote income generation for subsistence and smallholder farmers. Increased reliance on ITFCs in local diets could result in reduced dependency on foreign food aid and greater reliance on local, sub-Saharan African solutions from within the region.14
The InnoFoodAfrica (IFA) project, funded by the European Union, aims to create new value chains of ITFCs to produce and distribute healthy foods and bio-based materials for packaging from farms to local and export markets. IFA demonstrates the potential of African ITFCs as healthy food ingredients to combat malnutrition in children and pregnant women and the undernutrition risk in adults. The project has developed technologies and methods combined with capacity-building, communication, and business models to improve farming practices and nutrition, and to produce healthy ingredients and foodstuffs as well as packaging materials to reduce loss. The project involves 13 African and 5 European partners, comprising 5 research and technology organisations, 6 universities, 3 non-governmental organisations, and 4 private enterprises.
Coordinated policy, programmatic and research efforts are required to address malnutrition, food insecurity and environmental sustainability to address complex nutrition and food security challenges in South Africa. Stakeholder engagement is one way to facilitate the impact of research and promote the practical consideration
https://doi.org/10.17159/sajs.2025/17677
and implementation of research findings and recommendations and put forward meaningful policy recommendations from research.14 The term ‘stakeholders’ refers to “individuals, organisations, or communities that have a direct interest in the process and outcomes of a project, research, or policy endeavor”15(p.5). Stakeholder engagement assists researchers to draw meaningful insights from research findings and identify policy and implementation gaps. Given the central role that research plays in promoting sustainability16, stakeholder engagement was included to extend the potential of the IFA research beyond academia with a focus on its potential broader contributions to environmentally sustainable food and nutrition solutions.
A hybrid stakeholder workshop was hosted at the University of Pretoria’s Future Africa Campus during their biennial ‘Africa Week’ science leadership event. Invitations were extended broadly to higher education institutions, the agricultural and farming industry, non-profit organisations, governmental agencies, and organisations, and shared through the Africa Week advertisements and webpage. A total of 42 stakeholders attended in person and 2 stakeholders attended virtually. Stakeholders represented academic and higher education institutions (9), food and beverage manufacturing, processing, and/or safety organisations (20), local research organisations (6), agricultural and farming industries (4), a national non-profit organisation (1), and governmental agencies or organisations (2). The workshop was also attended virtually by three of the funding partners and in person by nine IFA associates. Seven students from the University of Pretoria who were directly involved in the project contributed to the presentations and/or discussions.
Stakeholder engagement was bidirectional and collaborative as the stakeholders were included to improve the uptake of the research and facilitate policy recommendations.14 The aim of the stakeholder workshop was to disseminate information on the outputs of the project to key stakeholders to generate discussion and identify takeaway points for policy and programmatic recommendations. Firstly, key research findings from the various work packages in the IFA project were shared. Secondly, the workshop aimed to facilitate stakeholder reflection on the meaning and impact of the key research findings with a focus on identifying the main action points to be taken forward. Lastly, the responsibilities and roles of the key players and stakeholders to action the identified reflection points were also identified and discussed.
The stakeholder workshop was facilitated by a researcher (S.D.) with experience in stakeholder engagement. The facilitator started the workshop by detailing the primary aim of the workshop, explaining that stakeholder engagement was essential to ensure that the project
had extensions beyond the research value to emphasise the impact of IFA research. Firstly, a brief overview of the IFA project aims, planned outputs and overarching objectives were shared. The workshop was divided into four sessions with different but complimentary foci, namely (1) consumer and nutrition studies, (2) farmers’ participatory research, (3) food ingredients, food products and bio-packaging innovation, and (4) a summary and final comments. Each session started with a summary presentation on the primary aims and outputs of the research and an interactive question-and-answer session. Thereafter, there was an individual reflection session in which stakeholders made notes and, lastly, a facilitated reflection and discussion session.
Stakeholders were provided with a summary graphic detailing the different types of potential impacts of research and their definitions (Figure 1). The impact summary graphic was developed based on literature in the field.17 The graphic was provided to guide the stakeholder reflections on whether research has an impact on people’s understanding and awareness of issues, promotes technological advances, affects the health and well-being of individuals or groups, influences capacity and preparedness to handle changes, and impacts cultural attitudes and/or beliefs. The summary graphic was also intended for stakeholders to consider the research impact on the economy, the environment, various social issues, novel or amended policies and guidelines, and whether research could contribute to changes in attitudes or beliefs.
Stakeholders were provided with sticky notes and requested to make notes focused on the different impact points during the presentations, reflection and discussion sessions. The sticky notes were collected after each session. Furthermore, summary notes were displayed on a board at the front of the venue and additional summary notes were compiled by a scribe during each reflection and discussion session. During the fourth and final session of the day, the workshop facilitator provided feedback to the stakeholders on the summary points drawn from their reflection; the main takeaway points and the identified roles of the responsible partners were also reintroduced and discussed. Following the workshop, one author (K.S.) compiled summaries of the notes, sticky notes and discussions. These summaries were sent to the IFA project partners and discussed between the authors (K.S., S.D., M.N.E.).
Stakeholder reflections acknowledged the commercial potential of the IFA innovations in terms of addressing food systems and nutrition challenges in a sustainable and comprehensive way. However, they further identified that scaling up the production of food ingredients and food products, to the commercial level required for them to make notable changes, would be hampered by the insufficient and inconsistent supply.
Figure 1: Types of potential impacts of research and their definitions.
The impact of value-added tax (VAT) on commercial food and beverage producers and consumers was a key challenge to this endeavour. The potential for sidestream income from the bio-packaging innovation was highlighted as a positive financial contributor to an alternative income source for farmers, as existing machinery can be used in a novel way to produce bio-packaging.
Discussions during the sessions centred largely around the need to develop food systems that supply healthy, affordable and nutrient-dense foods to the South African population. The potential benefits of ITFCs to meet this agenda were acknowledged by the stakeholders. Stakeholders identified two main barriers related to the mainstreaming of ITFCs. Firstly, the cost of food and food ingredients from ITFCs could be more competitive compared to that of maize meal if they were VAT exempted. Secondly, there is a need for awareness of the Paediatric Food Based Dietary Guidelines of South Africa.18 Other barriers include attitudes towards and stigmatisation of ITFCs and these are linked to the lack of market interest in these crops.
Market potential needs to be developed and mainstream consumer demand needs to be increased to develop and sustain ITFC farming and food systems.19 The informal food retail sector fed by smallholder farmers plays an essential role in the supply and distribution of food in South Africa, especially for rural dwellers in remote areas.20 Inadequate access to agricultural support services has been identified as a major reason for the inadequacy of programmes and policies that intend to support local smallholder farmers. Various programmatic efforts have been made to support local smallholder farmers, to boost their productivity and support their integration into the local agricultural economy.21 Among these is the Agricultural Policy Action Plan 2015–2019, which focuses on value addition as a strategy. The Department of Rural Development initiated a land development programme called One Household One Hectare in 2015, targeting state-owned farms, Proactive Land Acquisition Strategy farms, and communal land with the purpose of creating rural smallholder producers at the household level in order to ensure food security, reduce poverty, create sustainable employment, broaden the skills base, and support the Agri-parks Programme. Considered one of the most progressive support programmes, the Comprehensive Agricultural Support Programme was implemented by the Department of Agriculture, Land Reform, and Rural Development in 2004/2005 to safeguard access to agricultural support and service delivery. Smallholder farmers are among the intended beneficiaries of this programme, which provides comprehensive financial and programmatic support for the farmers. Although there is substantial policy and programmatic support for smallholder farmers in theory, there are clear implementation gaps and fewer than intended smallholder farmers have benefitted from this support.21
The literature identifies that the dearth of reliable data about smallholder farmers in South Africa is a major contributing factor to the lack of support offered to them.20 21 The lack of information on the number of smallholder farmers, the crops they farm, the types of production in which they engage, and the markets that they supply, remains a key challenge to the government offering them support.20 21 Even national agricultural censuses from Statistics South Africa continue to focus on large-scale commercial farmers. A comprehensive register of smallholder farmers in South Africa needs to be compiled, and then wide-scale governmental support is required to deliver comprehensive, targeted policy and programmatic support to make tangible differences in market access.21
There is a concurrent need for governmental policies to be developed and implemented that address food distribution and marketing, which historically have been left mainly to private entities.3 Mabhaudhi et al.3 called for policymakers to adopt a transformative stance that includes informal traders and transporters who may currently operate illegally but play an important role in market access for ITFCs. There are limited data available on the buying and selling practices of informal traders of ITFCs and their economic value in South Africa.19 Related to this is the imperative of raising the profile of ITFCs among consumers. Stakeholders identified that many smallholder farmers cultivate ITFCs already, but due to the lack of demand in the market, these crops are not mainstream. Current policies include a limited focus on ITFCs which stifles those who grow, process and distribute ITFCs in informal food systems.3 19
Caregivers at schools, among others, must be made aware of the importance of feeding the children affordable protein-rich foods such as legumes, eggs and fish. Caregivers also need to be educated on appropriate complementary feeding and education should focus on the first 1000 days of life. An updated school curriculum is required to include a renewed focus on nutrition and the Paediatric Food Based Dietary Guidelines of South Africa. Education should encourage plantbased diets to promote a transformation of local perspectives on protein intake. Despite their multiple benefits, negative perceptions and attitudinal barriers affect the acceptance of many ITFCs, and there needs to be more awareness about the benefits of ITFCs.11 Education supported by public–private partnerships is needed to break the stigmatised associations that many local consumers have towards ITFCs as ‘poor people’s food’ and to promote the acceptance of ITFCs and food ingredients into local diets.3 Stakeholders suggested that public–private partnership is also required to educate consumers on how to store and prepare these crops to prevent postharvest losses and on how to prepare food to maintain nutrient density. Concerted marketing efforts and attractive packaging of foods using ITFCs as food ingredients could change perceptions on ITFCs.11
Another critical limiting factor to the mainstreaming of ITFCs identified by the stakeholders was the cost of including ITFCs as wide-scale commercialised food ingredients. While there are multiple factors that culminate to influence food insecurity and malnutrition, the affordability of food purchases is central for both urban and rural consumers.9 In South Africa, many basic food items, such as brown bread (produced from wheat), rice, dried maize and maize products, are exempted from VAT.22 Stakeholders highlighted that it is imperative for the government to exempt ITFCs from VAT to promote the affordability of food products produced from these crops. Without VAT exemption, the use of ITFCs as wide-scale commercialised food ingredients is unattainable because of the cost of commercial production and the consequent high prices for end consumers.
Multifaceted support is required in a circular fashion to boost the cultivation, growth, distribution, marketing and production of food ingredients as well as the selling, acceptance and consumption of ITFCs. To realise the aim of mainstreaming ITFCs, consistent support is required from the government in terms of policy and implementation, with further support from private entities.
Acknowledgements
We acknowledge Dr Marinel Rothman, Prof. Riette de Kock, Prof. Quenton Kritzinger, Dr Danie Jordaan, Dr Diana Marais, the students from the various work packages of the University of Pretoria, and the various stakeholders who participated for their contributions to the stakeholder engagement workshop. This project was funded by the European Union’s Horizon 2020 Research and Innovation Programme under grant agreement no. 862170. The views and opinions expressed are those of the authors and do not necessarily reflect those of the funders.
Declarations
We have no competing interests to declare. We have no AI or LLM use to declare. All authors read and approved the final manuscript.
r eferences
1. African Union. Africa regional nutrition strategy 2015–2025. Addis Ababa: African Union; 2022. Available from: https://au.int/sites/default/files/pages/3 2895-file-arns_english.pdf
2. Mkhize M, Sibanda M. A review of selected studies on the factors associated with the nutrition status of children under the age of five years in South Africa. Int J Environ Res Public Health. 2020;17(21), Art. #7973. https://doi.org/1 0.3390/ijerph17217973
3. Mabhaudhi T, Chibarabada T, Chimonyo V, Murugani V, Pereira L, Sobratee N, et al. Mainstreaming underutilized indigenous and traditional crops into food systems: A South African perspective. Sustainability. 2018;11(1), Art. #172. https://doi.org/10.3390/su11010172
4. Statistics South Africa. Demographic and health survey 2016. Key indicators report. Pretoria: Statistics South Africa; 2017. Available from: http://www.sta tssa.gov.za/publications/Report%2003-00-09/Report%2003-00-092016.pdf
5. Nannan N, Laubscher R, Nel JH, Neethling I, Dhansay MA, Turawa EB, et al. Estimating the changing burden of disease attributable to childhood stunting, wasting and underweight in South Africa for 2000, 2006 and 2012. S Afr Med J. 2022;112(8):676–683. https://doi.org/10.7196/SAMJ.2022.v112i8 b.16497
6. Mudogo CM. Vulnerability of urban poor women and children to the triple burden of malnutrition: A scoping review of the sub-Saharan Africa environment. J Med Res. 2017;17(4):9–16. Available from: https://api.semanticscholar.or g/CorpusID:80789091
7. Oladiran DA, Emmambux NM. Locally available African complementary foods: Nutritional limitations and processing technologies to improve nutritional quality –A review. Food Rev Int. 2022;38(5):1033–1063. https://doi.org/10.1080/8755 9129.2020.1762640
8. Thow AM, Schönfeldt H, deKock R, Viljoen A, duRand G, Gericke G, et al. Policy for the complex burden of malnutrition in Africa: A research agenda to bring consumers and supply chains together. Public Health Nutr. 2017;20(6):1135–1139. https://doi.org/10.1017/S1368980016003050
9. Misselhorn A, Hendriks SL. A systematic review of sub-national food insecurity research in South Africa: Missed opportunities for policy insights. PLoS ONE. 2017;12(8), Art. #0182399. https://doi.org/10.1371/journal.po ne.0182399
10. Bain LE, Awah PK, Geraldine N, Kindong NP, Sigal Y, Bernard N, et al. Malnutrition in sub-Saharan Africa: Burden, causes and prospects. Pan Afr Med J. 2013;15(1), Art. #120. https://doi.org/10.11604/pamj.2013.15.12 0.2535
11. Akinola R, Pereira LM, Mabhaudhi T, De Bruin FM, Rusch L. A review of indigenous food crops in Africa and the implications for more sustainable and healthy food systems. Sustainability. 2020;12(8), Art. #3493. https://d oi.org/10.3390/su12083493
12. Republic of South Africa. National policy on food and nutrition security. Pretoria: Government Printers; 2014. https://www.gov.za/sites/default/files/ gcis_document/201409/37915gon637.pdf
13. Mushaphi L, Dannhauser A, Walsh C, Mbhenyane X, Van Rooyen F. The impact of a nutrition education programme on feeding practices of caregivers with children aged 3 to 5 years in rural Limpopo Province, South Africa. S Afr J Clin Nutr. 2017;30(4):101–108. https://doi.org/10.1080/16070658 .2017.1322823
14. Warren AM, Constantinides SV, Blake CE, Frongillo EA. Advancing knowledge about stakeholder engagement in multisectoral nutrition research. Glob Food Sec. 2021;29, Art. #100521. https://doi.org/10.1016/j.gfs.2021.100521
15. Deverka PA, Lavallee DC, Desai PJ, Esmail LC, Ramsey SD, Veenstra DL, et al. Stakeholder participation in comparative effectiveness research: Defining a framework for effective engagement. J Comp Eff Res. 2012;1(2):181–194. https://doi.org/10.2217/cer.12.7
16. Weißhuhn P, Helming K, Ferretti J. Research impact assessment in agriculture –A review of approaches and impact areas. Res Eval. 2018;27(1):36–42. http s://doi.org/10.1093/reseval/rvx034
17. Reed MS, Ferré M, Martin-Ortega J, Blanche R, Lawford-Rolfe R, Dallimer M, et al. Evaluating impact from research: A methodological framework. Res Policy. 2020;50(4), Art. #104147. https://doi.org/10.1016/j.respol.2020.1 04147
18. Vorster HH, Badham JB, VenterCS. An introduction to the revised food-based dietary guidelines for South Africa. S Afr J Clin Nutr. 2013;26(3suppl):S5–S12. Available from: https://www.sajcn.co.za/index.php/SAJCN/article/view /2244
19. Mbhenyane XG. Indigenous foods and their contribution to nutrient requirements. S Afr J Clin Nutr. 2017;30(4):5–7. https://doi.org/10.10520/ EJC-c6be5ce48
20. Okunlola A, Ngubane M, Cousins B, du Toit A. Challenging the stereotypes: Small-scale black farmers and private sector support programmes in South Africa: A national scan. Cape Town: Institute for Poverty, Land and Agrarian Studies, School of Government, Faculty of Economic and Management Sciences, University of the Western Cape; 2014. Available from: https://afric aportal.org/publication/challenging-the-stereotypes-small-scale-black-farme rs-and-private-sector-support-programmes-in-south-africa-a-national-scan/
21. Aliber M, Hall R. Support for smallholder farmers in South Africa: Challenges of scale and strategy. Dev South Afr. 2012;29(4):548–562. https://doi.org/1 0.1080/0376835X.2012.715441
22. South African Government. Value-Added Tax Act 89 of 1991. Pretoria: Government Printers; 1991. Available from: https://www.gov.za/documents /value-added-tax-act-12-may-2015-0846
https://doi.org/10.17159/sajs.2025/17677
AuthorS: Edilegnaw Wale1 Colleta Gandidzanwa1
AFFILIAtIoN:
1Department of Agricultural Economics, Extension and Rural Development, Faculty of Natural and Agricultural Sciences, University of Pretoria, Pretoria, South Africa
CorrESPoNDENCE to: Edilegnaw Wale
EMAIL: ew.zegeye@up.ac.za
hoW to CItE: Wale E, Gandidzanwa C. Sustainable food systems transformation: Are we attempting to eat the elephant in one piece? S Afr J Sci. 2025;121(7/8), Art. #22459. https://doi.org/10.1715 9/sajs.2025/22459
ArtICLE INCLuDES:
☐ Peer review
☐ Supplementary material
KEYWorDS: sustainable food systems transformation, complexity, assumptions, drivers, challenges
PubLIShED: 11 August 2025
Sustainable food systems transformation: Are we attempting to eat the elephant in one piece?
In this Commentary, we critically examine the concept of sustainable food systems transformation, with a particular focus on the complexities, potential ripple effects, and real-world practical implications of pursuing such a transition. Drawing on the metaphor of ‘eating an elephant’ as a representation of undertaking a monumental yet feasible task, the Commentary highlights that while transformation is a viable vision, it is often non-linear, intricate, multidimensional and inherently complex. The discussion traces the evolution of the sustainable food systems concept, interrogates the underlying implicit assumptions, identifies key drivers of change, and explores the operational challenges encountered in practice. Furthermore, it delineates strategic priorities necessary for the effective implementation of sustainable food systems transformation. By situating these issues within a broader contextual framework, we aim to inform and guide future scholarly and policy-oriented engagements on this topical and global issue.
Context
The current agri-food systems are not sustainable; they need to be transformed with major changes needed in production, distribution and consumption (dietary shifts).1 Sustainable food systems transformation has become an issue of global priority given persistent food insecurity, malnutrition, environmental degradation and rural poverty. Africa faces diverse and complex transformation challenges in the context of climate change, food waste and loss, changes in consumer demand, and cultural change, accelerated by a growing population projected to be 2.5 billion by 2050.2 The growing need for sustainable food systems transformation calls for clarity of the concept itself, understanding the current issues and challenges of making it operational, ensuring that there is common understanding on the nature of the transformation, what it entails and a buy-in from all stakeholders on the need for the transformation, and the steps needed to realise the transformation, particularly in an African context. If the current agri-food systems are maintained, it will become increasingly difficult or even impossible to achieve the United Nations’ Sustainable Development Goals (SDGs).
Continuing population and consumption growth will mean the global demand for food will increase for at least another 40 years.3 Many international organisations, such as the United Nations Food and Agriculture Organization (FAO) have provided such projections. The challenge ahead is finding ways and means to sustainably meet this growing food demand. Based on empirical evidence, various sustainable agricultural production practices (climate-smart agriculture, precision agriculture, agroecology, agroforestry, regenerative agriculture, organic farming, etc.) have been recommended, presenting the analogy of an elephant that is not consumable all at once. The uptake of these sustainable agricultural practices has not been as widespread as one would have expected. Even though there are a variety of contextual reasons for this in the literature, one challenge that complicates uptake across the board is the public versus private costs/benefits of adopting these practices, meaning that there are public benefits that farmers do not fully capture and there are costs (direct and/or opportunity costs) that only farmers incur. Market incentives do not reward sustainable production practices or sustainable consumption behaviour. Said differently, the costs of sustainability are paid by the consumer/producer while everyone enjoys the benefits. This mismatch is an inherent challenge and is responsible for the poverty of adopting sustainable agricultural practices. Because of the complexity and multidimensionality of the food system concept, a multifaceted, multistakeholder, multisectoral, transdisciplinary and global strategy is needed to ensure sustainable food systems transformation. Because of the complexities of food systems, changes at one level may have undesirable effects at other levels, or may lead to leakage effects and spillovers.1
Food systems are both contributors to and victims of climate change. Food systems create about 37% of total emissions through different agricultural practices, such as livestock farming, crop production and value addition. These activities also lead to deforestation, plastic use and increased carbon emissions.4 Reducing greenhouse gas emissions in food systems will enhance the system’s resilience. Similarly, strategies to reduce food waste and loss throughout the food supply chain will significantly contribute to emission reduction, strengthening the system’s resilience. Understanding the ‘food loss and waste – food security’ nexus contributes to understanding the challenges posed by the continuous and unsustainable practices of agri-food systems and supply chains. This would call for ensuring the sustainability of different components of the food system: primary food production, processing, packaging, distribution, retailing, consumption and disposal.
While there are benefits to sustainable supply chains, a number of operational issues remain. How feasible are such practices for small farmers operating in a fragile environment? What are the costs and benefits (to consumers, producers, and other actors along the value chain)? Are consumers willing and able to pay marginally more? What does this mean for poor smallholder farmers in terms of income, food security and livelihood? How do we incentivise the required behavioural changes? This short article outlines the genesis of the sustainable food systems concept, the implicit assumptions made, the drivers of sustainable food systems transformation, the operational challenges, and the priorities identified to implement sustainable food systems transformation.
https://doi.org/10.17159/sajs.2025/22459
the genesis of the concept of sustainable food systems in the context of Africa
The roots of sustainable food systems can be traced back to the environmental movements of the 1970s, owing to the poverty of conventional food production and consumption practices. The publication of The Limits to Growth (1972) underscored the potential dangers of over-exploitation and over-dependence on natural resources, which sparked a broader conversation about how nature-dependent industries were degrading natural capital.5 ‘The Green Revolution’ (1940s–1960s) also sparked debates about intensive agriculture’s long-term environmental, economic and social consequences. In Africa, much of the debate was about why the Asian green revolution did not happen there.
From the 1980s to the 1990s, the dominant discourse in the developing world was on food security and agricultural productivity, with heavy emphasis on increasing yields, extension services, agricultural technology and managing land degradation. Population growth, famines, rural poverty and food insecurity mainly drove this. The concept of sustainability began to gain more currency, particularly following the Brundtland Report (1987), which highlighted the interconnectedness of environmental, economic and social dimensions of sustainable development. During this time, food security gained prominence, with the FAO articulating the different dimensions of the concept.6 The discussion shifted to multisectoral solutions when the sustainable food systems lens first appeared in African regional initiatives like the Comprehensive African Agricultural Development Programme (CAADP) in the early 2000s. Global agendas also started to shape local food policies. The current discussion is on the resilience and sustainability (and lack thereof) of local food systems, following the COVID-19 pandemic, climate disasters, the war in Ukraine, and current policies of the Trump administration.
In essence, the phrase ‘food systems’ has become prominent in recognition of the complexity and multidimensionality of food and its actors/value-adding actions. This shift has occurred due to the recognition that food security is only one outcome among other outcomes in a bigger and more complex food system. A food system encompasses a range of actors and their interlinked value-adding activities (noted above) that originate from agriculture, forestry or fisheries and parts of the broader economic, societal and natural environments in which they are embedded.7 The food system consists of complex sub-systems such as a farming system, an input supply system, an agribusiness value chain system, a transport system and a waste management system. It interacts with other systems, including the energy, information, trade, water and health systems. This means a structural change in the food system might originate from a change in another system or vice versa. For example, a policy promoting more biofuel in the energy system will significantly impact the food system, or an ICT policy in a country will affect the food system. A policy on water use efficiency will have a significant impact on the food system. Such interactions and ripple effects demonstrate the need for a holistic approach.
It has become necessary to recognise the complexity of food systems beyond food and agriculture, integrating all the above actors and actions holistically. As a result, sustainable food systems emerged as an interdisciplinary field that combines ecological, social and economic dimensions.8 The Rio+20 summit in 2012 reaffirmed the importance of sustainable agriculture and food systems. More recently, many of the Sustainable Development Goals have explicitly incorporated the need for sustainable food systems. Having gone through these different phases, sustainable food systems have now been at the centre of global policy discussions.9 The food system approach not only helps to engender discussion of adaptation options across the complete set of food system activities, but also provides a framework for systematic analysis of synergies and trade-offs balanced across a range of societal goals.10 The synergies and trade-offs arise because food systems are integrated and dynamic networks with knock-on effects that link food production, processing, distribution, consumption and waste management.11
A sustainable food system is meant to ensure that the foundations for ensuring food security and nutrition do not occur at the expense of the welfare of future generations. The SDGs are centred on a sustainable food
system. To eradicate hunger, attain food security, and enhance nutrition by 2030, the SDGs demand significant changes in agriculture and food systems. Accordingly, to achieve the SDGs, the global food system must be redesigned to be more resilient, environmentally sustainable, more productive, inclusive, and capable of providing wholesome diets to everyone, both now and for future generations.7 This daunting task demands systems thinking and perspectives to address the local, national, regional and global challenges.
Assumptions of food systems transformation
Food systems transformation sounds neutral or positive, but it actually rests on a lot of implicit assumptions regarding the required change, particularly its feasibility and practicality. By definition, food systems transformation implies that the system needs to change. Why does it need to be transformed? Does the transformation entail the same thing for the different elements of the system? How would we account for the heterogeneity? Who are the agents of change? What is the change theory? Are all the actors actively pursuing the transformation? Are there missing links in the system? Who is responsible for any missing links in the system? Who deals with the knock-on or ripple effects and synergies? Who deals with trade-offs? Where is the clearing house? All these questions have implicit assumptions behind them. Addressing these questions will shed light on the implicit assumptions.
The need for transformation emanates from the need to integrate sustainability and ensure the resilience of the system. As noted above, current food systems are major contributors to environmental degradation. They often fail to ensure equitable access to nutritious food. Many food production practices are economically unsustainable for smallholder farmers and vulnerable groups. These are the justifications for the transformation. The ultimate goal of the transformation is to build food systems that are environmentally sustainable, economically viable, nutritionally adequate and socially inclusive.
Sustainable production, strategies to reduce food waste and loss, equitable distribution and access to healthy food, healthy consumption, inclusive governance, and policy and investment shifts are the key pathways to the transformation agenda.
Food systems transformation makes an implicit assumption about the nature of the different parts. It is assumed that the whole is the sum of homogeneous parts. That assumption simplifies the complexity of the problem and the solution. The transformation agenda calls for different adjustments as it relates to the different heterogeneous elements of the system. The agents of the change are the actors in each element of the system.
The other implicit assumption is that there are no missing links, and there are actors to take care of any existing missing links. If there are knock-on or ripple effects, synergies or trade-offs, the system has to develop mechanisms that can account for such impacts and ensure a sustainable food transformation.
The theory of change behind the idea of ‘sustainable food systems transformation’ refers to a structured framework that outlines how and why a transition from current food systems to more sustainable ones will lead to desired long-term outcomes like environmental sustainability, food security and social equity. Policy and regulation, innovation and technological change, behavioural change and collaboration (multistakeholder partnerships) are the levers of change. Stakeholders should be willing and able to collaborate across sectors. Political buy-in has to be there, and financial resources have to be mobilised. There has to be enough public awareness and incentive to change behaviours and norms. For the system to be transformed, given the diversity of motives and incentives for the stakeholders in the system, all actors have to be actively pursuing the transformation.
In the context of sustainable food systems, a clearing house refers to a central platform or mechanism that collects, organises and disseminates knowledge, data, tools, best practices and resources to support the transformation of food systems toward sustainability. The purposes of the clearing house in the context of sustainable food systems include knowledge sharing, coordination among the sectors/stakeholders/actors, capacity building, evidence-based policy support, and monitoring and evaluation.
Most actors/stakeholders want transformation, although some groups may prefer incremental change or the status quo as some transformative processes may exacerbate inequalities.12 Transformative processes that worsen inequalities undermine the diversity and complexity of the system, characterised by different levels of inequalities. Many marginalised groups, such as smallholders, Indigenous people, the disabled and women, have historically been sidelined in food system reforms.13
Another implied assumption of food systems transformation is that this change will be driven by technological innovation14, yet there are a number of food systems transformation drivers. This assumption underestimates the social, political and ecological dimensions that cannot be addressed by technology alone. These assumptions behind food systems transformation are crucial to avoid unrealistic solutions, recognise trade-offs, and ensure inclusivity, preventing shallow reforms that disregard root causes and better aligning strategies with local realities.
The impacts/outcomes expected from sustainable food systems transformation include reduced environmental impacts of food systems, improved food and nutrition security, greater resilience to climate change, and enhanced livelihoods and equity, especially for women and smallholders. Sustainable food systems transformation requires an understanding of the drivers of food systems transformation, to which we now turn.
Drivers of food systems transformation in an African context
Food systems now require transformation in the face of climate change, evolving cultures and technological advancements to meet the transforming demands arising from a growing population. Given the preceding implicit assumptions and the challenges thereof, how can food systems transformation be achieved? The key is to consider the transformation process as a journey and the outcome as a continuum. Given the interconnectedness of dimensions linked to food systems, one important change that needs to occur is the functionality of different systems with one another. This entails the purge of fragmentation, a common challenge in policy formulation and implementation. Both inaction and fragmentation are critical challenges.
The transformative changes being called for in a global food system in crisis cannot – and ultimately will not – be achieved without intense scrutiny of the challenges and changes in the underlying political economies that drive today’s food systems.15 The key drivers of food systems transformation can be summarised as follows.
Climate change and environmental degradation
Africa is among the most vulnerable continents to climate change, despite contributing the least to its causes. Rising temperatures, erratic rainfall and extreme weather events are already undermining crop yields, livestock productivity and ecosystem services.16 Land degradation, biodiversity loss and water pollution further constrain food system resilience. These environmental pressures necessitate adaptive and transformative responses, including shifts toward agroecological practices, climate-smart agriculture and nature-based solutions.17 Climate risk is thus both a disruptor and a driver for sustainability-oriented transformation.
demographic change and urbanisation
Africa’s rapidly growing and urbanising population, projected to reach 2.5 billion by 2050, has significant implications for food systems. Urbanisation is reshaping food demand, driving shifts toward more processed, convenient and diverse diets.18 This creates new opportunities for agri-food value chains, but also increases pressure on rural producers, infrastructure and natural resources. Urban growth also alters labour markets and land use, weakening traditional food systems while strengthening connections to globalised supply chains. The ‘youth bulge’ offers potential for innovation and entrepreneurship, but youth engagement remains constrained by structural barriers such as land access and financial exclusion.19 Youth mindset, attitude towards farming, and entrepreneurial challenges are also hurdles in agricultural succession planning.
technological innovation and digitalisation
Digital technologies are transforming agricultural extension, market access, financial services and data management. ICTs have the capacity to change consumer preferences. Social media can drive the globalisation process, resulting in more homogeneity; and the digital divide among the different elements of the food system will affect the transformation process. Mobile platforms and precision agriculture tools offer new avenues for increasing productivity and improving decision-making.20 However, access and benefits remain uneven due to digital divides related to gender, geography and education. Innovation ecosystems, consisting of research institutions, start-ups and government programmes, can drive locally relevant solutions, particularly when co-produced with communities.21 The integration of Indigenous knowledge and low-cost innovations also plays a crucial role in context-appropriate transformation.
social movements and changing food narratives
Consumer preferences, civil society activism and farmer movements are increasingly shaping African food systems. Calls for food sovereignty, agroecology and nutrition-sensitive agriculture reflect broader struggles over land rights, equity and ecological sustainability.22 Social narratives that portray food as a public good, as opposed to a commodity, are helping to reimagine food systems around values of social justice, human rights and well-being. These narratives challenge dominant paradigms and promote locally embedded alternatives.
Policy and governance reform
Institutional and governance arrangements shape the direction and inclusivity of food systems transformation. Decentralisation, participatory policy processes and multistakeholder platforms have emerged as key mechanisms for enabling systemic change.23 However, as noted above, many African countries face governance challenges, including fragmented policies, limited coordination and weak implementation capacity. International frameworks such as the United Nations Food Systems Summit and Agenda 2063 provide normative direction, but require strong local adaptation and ownership to be effective.13
economic liberalisation and market integration
Trade liberalisation, structural adjustment and regional integration (e.g. the African Continental Free Trade Area) have altered the structure of African food systems. These shifts have expanded access to markets and inputs, but also increased vulnerability to global price volatility and corporate concentration.24 While commercialisation offers income opportunities, it often benefits larger and more connected actors, exacerbating inequality and marginalising smallholders. Effective transformation requires inclusive value chain development and policies that balance efficiency with equity.25
Food systems transformation in Africa is being driven by intersecting demographic, environmental, technological, economic and socio-political forces. While these drivers present significant challenges, they also offer entry points for more just, resilient and sustainable food futures. The success of such transformation depends on inclusive governance, systems thinking, and the capacity to navigate trade-offs and synergies in a rapidly changing world. The next section synthesises the challenges of operationalising the transformation of food systems, taking into account the implicit assumptions and the drivers.
Challenges in operationalising sustainable food systems transformation
Operationalising the concept of sustainable food systems entails translating a broad and complex idea into practical, disaggregated and actionable strategies. The key challenges are given below.
Complexity and interconnectedness
Balancing the trade-offs or ripple effects between environmental sustainability (e.g. reducing greenhouse gas emissions), economic profitability and social equity (e.g. food accessibility and affordability) remains a key challenge. Our capacity to nurture resilient food systems within global environmental change, and understand their drivers and
the determinants of livelihood outcomes and trade-offs is severely constrained. Eriksen11 developed a framework that could be employed to build a database of typologies of food system interactions, functional for different management or analytical purposes. Fassio and Chirilli26 suggest a framework for analysing food and agriculture systems that can provide a holistic assessment of the impacts, actions and outcomes achieved by these systems.
a ccounting for contextual variability
The other challenge is adapting sustainable food systems to diverse local contexts, in which socio-economic, political and environmental conditions differ. This is especially the case for the African smallholder sector, which is characterised by the heterogeneity of the products and diversity of the socio-economic and agroecological systems.
Institutional/policy barriers and market failures
Existing policies and entrenched institutional structures often favour conventional food systems and create incentives for unsustainable practices (e.g. input subsidies). Policy frameworks are fragmented and lack cross-sectoral coordination.3 There is no mechanism in place to account for the discrepancy between private and public costs/benefits of adopting sustainable production, processing, packaging, distribution, consumption, waste disposal and recycling.
Consumer behaviour and demand
Poor consumer demand for food is hardly shaped by sustainability considerations. Changing consumers’ behaviour and increasing their demand for sustainable, healthy foods is a challenge if consumers have to pay the extra cost when food becomes expensive because it has accounted for environmental sustainability, or it has internalised the environmental costs of food production.
Climate change and environmental stress
While sustainable food systems are often proposed as solutions to mitigate climate change, the need for adaptation to these changes further complicates their implementation.9 A dual imperative of mitigation and adaptation is created through sustainable food systems practices, resulting in tensions both in policy and practice. Practices aimed at reducing emissions, such as reduced livestock production, may not align with adaptive strategies required for food security in climate-stressed communities that are dependent on mixed farming practices.
data and monitoring challenges
Robust data collection systems are often absent in low-income and rural areas, making it challenging to assess progress or make evidence-based decisions. Monitoring and evaluating the sustainability of food systems is a difficult task. Developing countries face capacity constraints when developing comprehensive metrics and data systems. Given the multifaceted and multidimensional nature of sustainable food system indicators, the lack of standardised definitions and measurement methods poses challenges for cross-study comparisons, monitoring and promoting food systems, and policy implementation.27
Future research directions in sustainable food systems
The future of sustainable food systems will require innovative research to address the issues enumerated above and emerging challenges, and to test new solutions. Future research in sustainable food systems must move from narrow technical fixes toward systemic, political and justice-centred approaches that recognise diversity, vulnerability and complexity.
agroecology
There is a tremendous knowledge gap on what it takes to optimise agroecological practices and their scalability, and to evaluate their impact on productivity, climate resilience and ecosystem services.
sustainable food consumption and dietary shifts
The ‘how’ of changing consumer behaviour and promoting healthy and sustainable diets will remain a key area of focus for future research. In this regard, there is a need to explore strategies for promoting healthy and culturally acceptable, sustainable diets that reduce environmental footprints. There is a need to understand the impact of sustainable food systems on public health in terms of providing nutritious, culturally appropriate and affordable food. The challenge, however, is that sustainable food consumption could be a luxury for many poor consumers.28
digital agriculture and precision technologies
Another area of research is the application of digital technologies, including precision agriculture, big data analytics and remote sensing, to optimise resource use, improve productivity and account for the environmental impact of agriculture. Big data is expected to greatly impact smart farming, creating unprecedented decision-making capabilities along the whole supply chain and changing role players.29
Circular food systems
The potential of circular food systems that minimise waste, reduce reliance on virgin resources (reused, recycled or repurposed), and support sustainable food production and consumption practices has not yet been fully explored. Future research should explore the ‘food loss and waste–food security’ nexus through evidence-based and scenario analyses, informing stakeholders about nexus interactions and highlighting synergies between different resource uses in a circular and green economy perspective.30
Concluding remarks
The design and evaluation of policies that support sustainable food production and consumption is complex in theory and practice. This means that the elephant is not consumable in one goal, nor can sustainable food systems be considered unidimensional. That is why food systems transformation must be viewed as a journey, not a destination. From this perspective, sustainability is not a fixed or static state but an ongoing process of learning, negotiation, and consensus-building, thereby encouraging systems thinking.31 This entails regular identification of food systems vulnerability spots, adaptation and intervention areas in different food system activities, to improve food security, livelihood and environmental outcomes. Viewing sustainability as a fixed destination implies that there is an ideal end-state – a point at which food systems are fully aligned with environmental integrity, social equity and economic viability. Framing the vision as a journey is useful in setting targets, benchmarks and indicators (e.g. SDG 2: Zero Hunger), which are essential for accountability and international cooperation. Framing it as a destination may obscure the dynamic and contested nature of food systems, oversimplifying the complexity of local realities, trade-offs and power asymmetries.10 11 Imagining sustainability and sustainable food systems as a journey and the outcome as a continuum enables us to realise that food systems are constantly evolving, shaped by changing ecological conditions, social demands and political contexts.
Declarations
We have no competing interests to declare. We have no AI or LLM use to declare. Both authors read and approved the final manuscript.
r eferences
1. Qaim M, Parlasca MC. Agricultural economics and the transformation toward sustainable agri-food systems. Agric Econ. 2025;56:327–335. https://doi.o rg/10.1111/agec.70023
2. United Nations Economic Commission for Africa (UNECA). Africa’s population prospects. Addis Ababa: UNECA; 2024. https://hdl.handle.net/10855/50524
3. Godfray HCJ, Beddington JR, Crute IR, Haddad L, Lawrence D, Muir JF, et al. Food security: The challenge of feeding 9 billion people. Science. 2010;327(5967):812–818. https://doi.org/10.1126/science.1185383
4. Brakebill S. How can we achieve both food security and net zero? Networks of evidence and expertise for public policy [webpage on the Internet]. c2022 [cited 2025 Apr 10]. Available from: https://www.csap.cam.ac.uk/news/artic le-how-can-we-achieve-both-food-security-and-net-zero/
5. Meadows DH, Meadows DL, Randers J, Behrens WW III. The limits to growth: A report for the club of Rome’s project on the predicament of mankind. New York: Universe Books; 1972. https://doi.org/10.1349/ddlp.1
6. United Nations Food and Agriculture Organization. World food summit: Rome declaration on world food security [webpage on the Internet]. c1996 [cited 2025 Apr 10]. Available from: https://www.fao.org/4/w3613e/w3613e00.htm
7. United Nations Food and Agriculture Organization. Food waste and food losses: Extent, causes and prevention [document on the Internet]. c2018 [cited 2025 Apr 10]. Available from: http://www.fao.org/3/i3347e/i3347e.pdf
8. Altieri MA. Agroecology: The science of sustainable agriculture. 2nd ed. Boca Raton, FL: CRC Press; 2018. https://doi.org/10.1201/9780429495465
9. Intergovernmental Panel on Climate Change (IPCC). Climate change and land: An IPCC special report on climate change, desertification, land degradation, sustainable land management, food security, and greenhouse gas fluxes in terrestrial ecosystems. Geneva: IPCC; 2019. Available from: https://www.ip cc.ch/srccl/
10. Ingram J. A food systems approach to researching food security and its interactions with global environmental change. Food Secur. 2011;3(4):417–431. https://doi.org/10.1007/s12571-011-0149-9
11. Ericksen PJ. Conceptualizing food systems for global environmental change research. Glob Environ Change. 2008;18(1):234–245. https://doi.org/10.10 16/j.gloenvcha.2007.09.002
12. Clapp J, Isakson SR. Risky returns: The implications of financialization in the food system. Dev Change. 2020;51(3):301–315.
13. High Level Panel of Experts on Food Security and Nutrition (HLPE). Food security and nutrition: Building a global narrative towards 2030 [webpage on the Internet]. c2020 [cited 2025 Apr 07]. Available from: https://openk nowledge.fao.org/server/api/core/bitstreams/8357b6eb-8010-4254-814a-1 493faaf4a93/content
14. Herrero M, Thornton PK, Mason-D’Croz D, Palmer J, Benton TG, Bodirsky BL, et al. Innovation can accelerate the transition towards a sustainable food system. Nat Food. 2020;1:266–272. https://doi.org/10.1038/s43016-020-0 074-1
15. Baker P, Lacy-Nichols J, Williams O, Labonté R. The political economy of healthy and sustainable food systems: An introduction to a special issue. Int J Health Policy Manag. 2021;10(12):734–744. https://doi.org/10.34172/ijh pm.2021.156
16. Niang I, Ruppel OC, Abdrabo MA, Essel A, Lennard C, Padgham J, et al. Africa. In: Barros VR, Field CB, Dokken DJ, Mastrandrea MD, Mach KJ, Bilir TE, et al. editors. Climate change 2014: Impacts, adaptation, and vulnerability. Part B: Regional aspects. Contribution of Working Group II to the Fifth Assessment Report of the Intergovernmental Panel on Climate Change. Cambridge, UK: Cambridge University Press; 2014. p. 1199–1265. Available from: https://ww w.ipcc.ch/site/assets/uploads/2018/02/WGIIAR5-Chap22_FINAL.pdf
17. Van Noordwijk M, Catacutan DC, Duguma LA, Pham TT, Leimona B, Dewi S, et al. Agroforestry matches the evolving climate change mitigation and adaptation in Asia and Africa. Singapore: Springer; 2023. https://doi.org/10. 1007/978-981-19-4602-8_2
18. Reardon T, Echeverria R, Berdegué J, Minten B, Liverpool-Tasie S, Tschirley D, et al. Rapid transformation of food systems in developing regions: Highlighting the role of agricultural research and innovations. Agric Syst. 2019;172:1–12. https://doi.org/10.1016/j.agsy.2018.01.022
19. United Nations Food and Agriculture Organization. The future of food and agriculture: Trends and challenges [document on the Internet]. Rome: FAO; 2017. Available from: https://openknowledge.fao.org/server/api/core/bitstrea ms/2e90c833-8e84-46f2-a675-ea2d7afa4e24/content
20. Aker JC, Mbiti IM. Mobile phones and economic development in Africa. J Econ Perspect. 2010;24(3):207–232. https://doi.org/10.1257/jep.24.3.207
21. Carolan M. No one eats alone: Food as a social enterprise. Washington DC: Island Press; 2017. https://doi.org/10.5822/978-1-61091-806-0
22. Nyéléni Declaration. Declaration of the International Forum for Agroecology, Nyéléni, Mali [webpage on the Internet]. c 2015 [cited 2025 Apr 09]. Available from: https://www.fao.org/family-farming/detail/en/c/384351/
23. United Nations Food and Agriculture Organization. Food systems and nutrition: A synthesis of evidence. Rome: FAO; 2021. Available from: https://openkno wledge.fao.org/server/api/core/bitstreams/33d54a6f-78e8-4a07-98ed-1a73 7a003064/content
24. Jayne TS, Chamberlin J, Headey DD. Land pressures, the evolution of farming systems, and development strategies in Africa. Food Policy. 2014;48:1–17. https://doi.org/10.1016/j.foodpol.2014.05.014
25. Alliance for a Green Revolution in Africa. Africa agriculture status report 2020: Feeding Africa’s cities [document on the Internet]. Nairobi: AGRA; 2020. Available from: https://agra.org/wp-content/uploads/2020/09/AASR-2020-Fee ding-African-Cities.pdf
26. Fassio F, Chirilli C. The circular economy and the food system: A review of principal measuring tools. Sustainability. 2023;15, Art. #10179. https://doi. org/10.3390/su151310179
27. Béné C, Fanzo J, Haddad L, Hawkes C, Caron P, Frison E. Five steps to make food systems more sustainable. Nature. 2019;569(7755):31–33. https://doi .org/10.1038/d41586-019-01358-z
28. Willett W, Rockström J, Loken B, Springmann M, Lang T, Vermeulen S, et al. Food in the Anthropocene: The EAT-Lancet Commission on healthy diets from sustainable food systems. Lancet. 2019;393(10170):447–492. https://doi.or g/10.1016/S0140-6736(18)31788-4
29. Wolfert S, Ge L, Verdouw C, Bogaardt MJ. Big data in smart farming: A review. Agric Syst. 2017;153:69–80. https://doi.org/10.1016/j.agsy.2017.01.023
30. Santeramo FG, Lamonaca E. Food loss–food waste–food security: A new research agenda. Sustainability. 2021;13, Art. #4642. https://doi.org/10.3 390/su13094642
31. Ostrom E. A general framework for analyzing sustainability of socialecological systems. Science. 2009;325(5939):419–422. https://doi.org/10 .1126/science.1172133
https://doi.org/10.17159/sajs.2025/22459
AuthorS: Frans Swanepoel1 Melody Mentz-Coetzee1
AFFILIAtIoN:
1Future Africa, University of Pretoria, Pretoria, South Africa
CorrESPoNDENCE to: Frans Swanepoel
EMAIL: frans.swanepoel@up.ac.za
hoW to CItE: Swanepoel F, Mentz-Coetzee M. Developing Africa’s next generation of scientists for sustainable food systems transformation. S Afr J Sci. 2025;121(7/8), Art. #22263. https:// doi.org/10.17159/sajs.2025/22263
ArtICLE INCLuDES:
☐ Peer review
☐ Supplementary material
KEYWorDS:
food systems, early career researchers, capacity strengthening, engaged research
FuNDING: Global Challenges Research Fund (GCRF)
PubLIShED: 11 August 2025
Developing Africa’s next generation of scientists for sustainable food systems transformation
We reflect on the FSNet-Africa model of strengthening research capacity for food systems transformation in Africa. By equipping early-career researchers with skills to undertake engaged, transdisciplinary research and fostering collaborations with stakeholders, the model has led to context-relevant innovations and strengthened policy linkages. Outcomes include improved researcher competencies, international partnerships, and tangible tools for food system resilience. The FSNet-Africa approach demonstrates how locally grounded, stakeholder-informed research can drive sustainable change, offering a replicable model for building the next generation of African scientists committed to equitable and inclusive food systems development.
Introduction
South Africa’s food system presents a significant paradox. Despite having a sufficient food supply, the country faces considerable challenges, such as widespread under- and overnutrition, environmental degradation, deep socio-economic inequalities, and a slow pace of transformation toward inclusivity.1 Local food systems are increasingly recognised as a vital solution to challenges, such as those faced in the South African food system.2
Local food systems contribute to improved nutrition and food security through promoting the cultivation and consumption of diverse, locally grown, culturally acceptable and nutrient-rich foods3; create economic opportunities (particularly for smallholder farmers, informal traders, and marginalised groups such as women and the youth)4 by creating employment opportunities; and empower communities to have control over their food production and distribution. Furthermore, local food systems can contribute to environmental sustainability by encouraging agroecological farming practices5 and shortening food supply chains and decreasing the need for long-distance transportation.6 Importantly, local food systems help mitigate the effects of food insecurity during global supply chain disruptions and localise control over food sovereignty.7
Engaged research can play a pivotal role in identifying local food systems solutions and innovations that address context-specific challenges, ensuring that interventions are tailored to the realities of local communities. Defined as a collaborative approach in which researchers and stakeholders – such as communities, policymakers, and practitioners – work together throughout the research process, engaged research is rooted in real-world problems and aligned with the needs and values of those most affected. This co-production of knowledge not only enhances the relevance and practical applicability of research, but also fosters trust, transparency and accountability, increasing the likelihood that research outcomes will inform and improve policy and practice.8
There is increasing pressure for publicly funded research to demonstrate that it is contributing to the type of impact and change that engaged research can deliver. Yet, there is limited training provided at the postgraduate level in Africa to develop the skills required to achieve impact, for example, through influencing policy or practice.9 A new cadre of researchers with different and more diverse skills who can collaborate across disciplines and outside of academia is needed. In this Commentary, we reflect on the model adopted by the Food Systems Research Network for Africa (FSNet-Africa) to develop early-career researchers’ skills for delivering engaged research, as documented by Mkandawire et al.10 While this Commentary is situated within the context of South Africa’s food system challenges, the FSNet-Africa model itself is continental in scope. Implemented across six African countries, the initiative provides a platform for drawing broader lessons on strengthening research capacity and food systems transformation across diverse African contexts.
The FSNet-Africa model aligns with several strategic policy and practice frameworks that shape food systems and research capacity development in South Africa and beyond. Globally, it contributes to the objectives of the Sustainable Development Goals, particularly Goals 1 (Zero Poverty), 2 (Zero Hunger) and 13 (Climate Action), and is consistent with the focus of the 2021 United Nations Food Systems Summit on sustainable food systems transformation. At the continental level, FSNet-Africa supports the African Union’s Agenda 2063 and complements the Comprehensive Africa Agriculture Development Programme (CAADP) by enhancing agricultural research and innovation capacity. Nationally, the initiative is aligned with South Africa’s National Development Plan (NDP) 2030, which emphasises inclusive economic growth and food security, as well as the Department of Science, Technology and Innovation’s Decadal Plan for Science, Technology and Innovation, which prioritises transdisciplinary research, science–policy engagement, and the development of a next-generation research cohort. FSNet-Africa contributes to these strategic agendas by equipping early-career researchers with the skills and networks required to engage meaningfully with policy processes and co-create solutions with non-academic stakeholders.
the FSNet-Africa model
The FSNet-Africa project aimed, inter alia, to develop skills for engaged research through its two-year experiential research-capacity-building programme targeted at early-career researchers. The research undertaken in the project by the early-career researchers (the Fellows) was intended to be relevant to African food systems and focused on tangible outcomes and impact. FSNet-Africa further aimed to enhance the networks of researchers: between disciplines, across career phases, across Africa, between Africa and the world, and between academia and society.
https://doi.org/10.17159/sajs.2025/22263
Twenty early-career researchers (who were within 10 years of completing their PhDs) from 10 universities in six African countries (Ghana, Kenya, Malawi, South Africa, Tanzania and South Africa) participated in the programme. They worked with a network of 60 researchers in these countries and the United Kingdom.
The FSNet-Africa model is distinguished by three interrelated features: an experiential learning approach, a multi-mentorship structure, and the embedding of ongoing stakeholder engagement. Together, these features support the development of skills for engaged research. They offer potential for replication in other capacity-strengthening initiatives (scaling out), for integration into institutional frameworks (scaling up), and for fostering shifts in research culture and values (scaling deep).
The FSNet-Africa experiential research-capacity-building fellowship provided funding for Fellows to conduct research during the fellowship, with capacity-strengthening interventions undertaken while the research project implementation was ongoing. Structuring the programme in this way facilitated learning through practice.
The capacity-strengthening interventions were aimed at embedding five key skills essential for conducting engaged research: project management, responsible research, research methodology, research impact assessment and communication. There were seven primary interventions during which Fellows’ capacities were strengthened, including a structured orientation, two summer schools, a write shop, science communications training and a stakeholder engagement dialogue. Additional training was provided online as needed. The content of the different training events was aligned with the phases of the research project cycle – conceptualisation, implementation and dissemination. Through this alignment, the project delivered just-in-time training. Figure 1 demonstrates the alignment of the research process and the capacity-strengthening activities.
FSNet-Africa’s approach to capacity strengthening was intentionally designed around the principles of experiential learning, where researchers build competencies through direct application in real-world contexts. This approach enabled Fellows to immediately apply knowledge acquired through training activities (e.g. science communication or stakeholder engagement) within their ongoing research projects, reinforcing skill acquisition through practice. Capacity development extended beyond technical research skills to include soft skills such as leadership in transdisciplinary teams, communication with non-academic audiences,
and navigating institutional structures. This holistic skill set is critical for researchers working at the intersection of science, policy and practice.
Each Fellow was supported by at least one mentor from one of the African academic partner institutions and one from the University of Leeds (United Kingdom). The two mentors were chosen in combination to provide different disciplinary insights into the interdisciplinary team. Each Fellow was also supported by a University of Pretoria researcher (referred to as a UP host) whose primary role was to expand the Fellows’ networks within the institution. This structure facilitated the development of international and intra-Africa networks and enabled networking across career phases.
A critical feature of the fellowship was the stakeholders’ role in the research process. From orientation, when Fellows were conceptualising their research ideas, they were tasked to collaborate with food systems stakeholders to define the research they would undertake. Stakeholders remained embedded in the research process, with several collaborating with Fellows to undertake the research, and with Fellows returning to stakeholders with the outcomes of their research. FANRPAN was primarily responsible for facilitating these engagements as a boundary-spanning organisation.
FSNet-Africa is aligned with a broader ecosystem of initiatives that aim to build food systems capacity across Africa, including the African Union’s Science, Technology and Innovation Strategy for Africa (STISA-2024) and the African Centres of Excellence (ACE). In doing so, the programme not only contributes to individual and institutional capacity but also supports a systems-level approach to strengthening Africa’s research and innovation landscape in agriculture and food security.
outcomes and emerging impact
Professional development
Ongoing monitoring and evaluation were undertaken within the FSNetAfrica project to provide insight into the value of the fellowship to the Fellows. Self-reported skills assessments were undertaken at baseline, midway through the fellowship, and at the end of the fellowship. Results of the comparison of skill levels prior to and after the fellowship show that 80% of Fellows improved their capacity to conduct gender-responsive research, 75% improved their capacity to engage stakeholders in research and monitor research impact, and 60% improved their ability to engage with policy audiences.10
Figure 1: Illustration of Fellows research project implementation with capacity-building interventions.
Many Fellows continue to work with mentors and stakeholders, including through the development of joint funding proposals. Several Fellows received promotions within their institutions, signalling the value of their contributions. One Fellow, from the University of Dar es Salaam (Tanzania), was named one of the Top Agri-Food Pioneers by the World Food Prize Foundation. This accolade celebrated her significant contributions to sustainable agriculture and youth empowerment in Africa. She attributes this achievement to her participation in FSNet-Africa.11 While many Fellows achieved important milestones, this example illustrates how the model supported visible, sector-recognised leadership.
Local solutions to promote food systems transformation
The FSNet-Africa approach of co-creating research with stakeholders resulted in enhanced partnerships with non-academic stakeholders. Fellows exchanged knowledge and expertise with stakeholders, including farmers, policymakers, civil society organisations, and the private sector.
Impact-ready outputs from FSNet-Africa include a range of products to improve the nutrient quality of food12, including a recipe book, an infant porridge and a biscuit, all made from indigenous crops and ingredients that are readily available to the community. One Fellow explored the potential for Moringa oleifera to be used as a sustainable broiler feed additive to reduce the use of antibiotics in chicken farming.13 Other outputs, yet to be finalised and published, include a mobile application for farmers to measure fertiliser application to improve soil health and reduce water pollution, and the use of fruit-peel waste to create more nutritious silage-based food for ruminant goats.
Harnessing partnerships for impact
International partnerships can play an important role in building capacity for engaged science. These collaborations facilitate knowledge exchange, provide access to resources, and enhance policy advocacy. In doing so, international collaborations bridge local needs with global expertise.
FSNet-Africa has demonstrated the value of international collaboration in developing research capacity. The University of Pretoria acted as project hub, with nine African universities as the spokes and two UK partner universities. FSNet-Africa contributed to the nomination and shortlisting of the University of Leeds/University of Pretoria strategic partnership as a finalist for The Times Higher Education Awards Partnership of the Year 2024. This nomination highlighted the impactful partnership between the two institutions, particularly through the FSNet-Africa initiative, which addresses critical challenges in food security and climate-smart agriculture.
Partnerships are also critical for strengthening the science–policy interface, which requires more than building capacity within academic institutions. Policy actors and boundary-spanning organisations also play a vital role in enabling the uptake of research into policy and practice. Within FSNet-Africa, this interface was supported by the Food, Agriculture and Natural Resources Policy Analysis Network (FANRPAN), which served as a key boundary organisation facilitating collaboration between researchers and policy stakeholders across Africa. Such intermediary mechanisms help bridge institutional and disciplinary divides, create platforms for engagement, and support knowledge brokerage. Future capacity-building initiatives should explore how formal partnerships with national and regional policy bodies, advisory platforms, and evidence observatories can be institutionalised to deepen policy responsiveness and strengthen science-informed decision-making.
Challenges and lessons learnt
The FSNet-Africa model is a model that can enhance collaboration across disciplines and between academia and broader stakeholders to develop the next generation of researchers who are equipped to tackle complex challenges such as food systems transformation. The FSNet-Africa model was presented during a side event at the World Food Prize Borlaug Dialogue and has been taken up as a case study in the UN Food and Agriculture Organization’s guidance on strengthening national science–policy interfaces for agrifood systems.14 With the growing demand for collaboration and partnerships, such models need to be institutionalised to disrupt the silo mentality and advance collective action.
However, institutionalising such models requires systemic change. Universities and funders must adapt structures and incentives to support transdisciplinary work, reward stakeholder engagement, and prioritise real-world outcomes. At the same time, ongoing investment in research infrastructure, policy linkages, and inclusive partnerships, both local and international, is vital to sustain momentum and scale successes.
Conclusion
The FSNet-Africa model demonstrates a promising pathway for building the next generation of African researchers equipped to lead food systems transformation through engaged, transdisciplinary science. Its experiential learning design, multi-mentorship approach, and emphasis on stakeholder co-creation have not only strengthened individual capacities but also fostered enduring networks across disciplines, sectors and borders. The initiative’s early outcomes (ranging from improved research skills and career advancement to context-relevant innovations) highlight the model’s potential to generate meaningful, locally anchored impact. While FSNet-Africa was designed to generate research impact, its enduring contribution to the deliberate development of a cohort of African researchers equipped to lead future science–society engagements should not be overlooked.
Future research could explore the integration of additional capacity-building strategies within engaged research models like FSNet-Africa. In particular, examining the impact of job shadowing and incubation models could yield insights into how to deepen experiential learning. Furthermore, investigating the development of communication and leadership skills for researchers working in multidisciplinary and transdisciplinary teams would help to strengthen collaborative research for impact.
As global interest in transforming food systems grows, the FSNet-Africa experience provides valuable insights into how capacity-building, collaborative science, and local ownership can work in tandem to advance sustainability and equity in African food systems.
Acknowledgements
FSNet-Africa was funded by the Global Challenges Research Fund (GCRF) through the partnership between UK Research and Innovation (UKRI) and the African Research Universities Alliance (ARUA). The lead partner institutions were the University of Pretoria (South Africa), the University of Leeds (UK) and the Food and Natural Resources Policy Analysis Network (FANRPAN) (Pan-African).
Declarations
We have no competing interests to declare. We have no AI or LLM use to declare. Both authors read and approved the final manuscript.
r eferences
1. FAO, European Union, CIRAD, DSI NRF Centre of Excellence in Food Security (CoE-FS). Food systems profile – South Africa: Catalysing the sustainable and inclusive transformation of food systems. Rome/Brussels/France/Cape Town:FAO/European Union/CIRAD/CoE-FS; 2022. https://doi.org/10.4060/c c0071en
2. Mkhize X, Mthembu BE, Napier C. Transforming a local food system to address food and nutrition insecurity in an urban informal settlement area: A study in Umlazi Township in Durban, South Africa. J Agric Food Res. 2023;12, Art. #100565. https://doi.org/10.1016/j.jafr.2023.100565
3. Rudolph M, Muchesa E. A review of the agroecological farming system as a viable alternative food production approach in South Africa. S Afr J Agric Ext. 2023;51(2):43–76. https://doi.org/10.17159/2413-3221/2023/v51n2a 12755
4. Kapari M, Hlophe-Ginindza S, Nhamo L, Mpandeli S. Contribution of smallholder farmers to food security and opportunities for resilient farming systems. Front Sustain Food Syst. 2023;7, Art. #1149854. https://doi.org/1 0.3389/fsufs.2023.1149854
5. Zenda M, Rudolph M. A systematic review of agroecology strategies for adapting to climate change impacts on smallholder crop farmers’ livelihoods in South Africa. Climate. 2024;12(3), Art. #33. https://doi.org/10.3390/cli 12030033
6. Greenberg S. Greenhouse gas emissions in the South African food system: Integrated and transformative responses required [document on the Internet]. c2024 [cited 2025 May 14]. Available from: https://www.researchgate.net/p ublication/386566387_Greenhouse_gas_emissions_in_the_South_African_ food_system_Integrated_and_transformative_responses_required
7. Moyo BH, Thow AMT. Fulfilling the right to food for South Africa: Justice, security, sovereignty and the politics of malnutrition. World Nutr. 2020; 11(3):112–152. https://doi.org/10.26596/wn.2020113112-152
8. National Co-ordinating Centre for Public Engagement. Introducing public engagement [webpage on the Internet]. No date [cited 2025 May 12]. Available from: https://www.publicengagement.ac.uk/introducing-public-engagement
9. Mentz-Coetzee M, Sienart M. Designing and implementing impactful post PhD supporting programmes in Africa. Unpublished report; 2022.
10. Mkandawire E, Mentz-Coetzee M, Swanepoel F, Dougill A, Quinn C, Madzivhandila T. Introducing the FSNet Africa model: Strengthening African capacity to tackle Africa’s wicked development challenges. New Agenda S Afr J Soc Econ Policy. 2024;94:3–8. https://hdl.handle.net/10520/ejc-nage nda_v2024_n94_a1
11. World Food Prize Foundation. Top agri food pioneers: Innocensia John [webpage on the Internet]. c2024 [cited 2025 May 14]. Available from: https://www.worldfoodprize.org/index.cfm?nodeid =96937&audienceID=1& action=viewspeaker&id=2222
12. Boakye A, Dougill A, Mwangwela A, Legodi H. Valorising cucurbit seeds (egusi) for community nutrition and food security in Ghana. FSNet Africa Policy Brief no. 102 [document on the Internet]. c2024 [cited 2025 May 12]. Available from: https://fsnetafrica.com/publications/policy-brief-102-valorising-cucurbi t-seeds-egusi-for-community-nutrition-and-food-security-in-ghana/
13. Lungu NS, Maina JG, Dallimer M, van Marle Köster E. The potential of Moringa oleifera as a sustainable broiler feed additive: Investigating awareness, perceptions, and use by broiler farmers and Moringa farmers in South Africa. Sustainability. 2024;16, Art. #2208. https://doi.org/10.3390/su16052208
14. Food and Agriculture Organization of the United Nations (FAO). Guidance on strengthening national science-policy interfaces for agrifood systems. Rome: FAO; 2024. https://doi.org/10.4060/cd3125en
1Africa Unit for Transdisciplinary Health Research (AUTHeR), North-West University, Potchefstroom, South Africa
2Physicians Association for Nutrition South Africa, Cape Town, South Africa
3Department of Agricultural Economics and Rural Development, University of Göttingen, Göttingen, Germany
4ProVeg International, Berlin, Germany
5Department of Public Health, University of Cape Town, Cape Town, South Africa
6Global Academy of Agriculture and Food Systems, University of Edinburgh, Edinburgh, Scotland, UK
7Tailored Foods, Vaughan, Ontario, Canada
CorrESPoNDENCE to: Nanine Wyma
EMAIL: nanine.wyma@pan-sa.org
DAtES:
r eceived: 24 June 2024
r evised: 02 Apr. 2025
Accepted: 15 Apr. 2025
Published: 11 Aug. 2025
hoW to CItE: Wyma N, Klapp A-L, Nhlapo P, Ubanwa M, Niesing C. Food-based dietary guidelines in Africa and their inclusivity of plant-based dietary patterns. S Afr J Sci. 2025;121(7/8), Art. #18967. https://doi.org/10.1715 9/sajs.2025/18967
Food-based dietary guidelines in Africa and their inclusivity of plant-based dietary patterns
Food-based dietary guidelines (FBDGs) are powerful country-level policies that can guide healthy diets from sustainable food systems. They are associated with several Sustainable Development Goals (SDGs), particularly SDG 2 (zero hunger), SDG 3 (good health and well-being) and SDG 13 (climate action). However, most FBDGs still favour animal-based food consumption despite increasing global adoption of plant-based dietary patterns to meet health and climate targets. Our objectives were to review the extent of African FBDGs and to analyse their inclusivity of plant-based dietary patterns. A state-of-the-art literature review was conducted, including qualitative analysis and quantitative scoring using the Balanced Food Choice Index system. We found that 12 African countries had FBDGs, although these contained less information about plant-based dietary patterns than the global average. The most balanced guidelines were from South Africa, Namibia, Benin, Gabon and Zambia. One-quarter of FBDGs in Africa refer to the sustainability of plant-based foods or dietary patterns. However, there was a significant lack of awareness of some forms of plant-based diets, with only two FBDGs discussing vegetarian diets. Five African dietary guidelines included plant-based alternatives to meat, milk or dairy. Future African FBDGs are encouraged to be inclusive of plant-based dietary choices and balance the various health, economic, environmental and ethical aspects that play a role in people’s food choices.
Significance:
• We reviewed food-based dietary guidelines (FBDGs) in Africa, finding a considerable shortfall in official recommendations for the broad spectrum of plant-based diets. Only 12 African countries have FBDGs, representing one-quarter of the Food and Agriculture Organization (FAO) member countries from Africa.
• According to our analysis, sustainability is included in one-quarter of African guidelines, because they explain the environmental benefits of plant-based foods or dietary patterns. Two guidelines discuss vegetarian diets, and five guidelines include plant-based alternatives to meat, milk or dairy.
Introduction
Food-based dietary guidelines (FBDGs) can become crucial to fostering sustainable food systems.1 Developed by over 100 countries, these national policies offer evidence-based contextual recommendations for achieving a nutritionally complete and balanced diet at a public health level.2 Their primary purpose is to serve as a tool in health promotion, nutrition education and policy formulation, effectively addressing concerns related to health and nutrition.3 FBDGs may further contribute information on what constitutes sustainable dietary choices on a country level.
sustainability in food-based dietary guidelines
A sustainable food system ensures food security and nutrition for all by offering access to affordable, culturally acceptable, equitable and safe sustainable diets.4 These diets are nutritionally adequate, promote health and minimise environmental impacts.4 Healthy diets from sustainable food systems are linked to a number of Sustainable Development Goals (SDGs), in particular SDG 2 (zero hunger), SDG 3 (good health and well-being) and SDG 13 (climate action).5
FBDG policies have significance in transforming food systems and shaping dietary patterns by including recommendations for adopting sustainable diets.6 7 Integrating climate action into all national policies is a target of SDG 13, and recommendations8 are to leverage FBDG policies in directing sustainable low-carbon food choices. Despite this, global analyses reveal a critical gap between current FBDGs and sustainability goals.7
Global food systems are a leading driver of climate change, responsible for about one-third of global greenhouse gas emissions.8 Reducing meat consumption and avoiding scenarios of overconsumption are key components of mitigating food systems emissions.8 Dietary patterns higher in plant-based foods and lower in animal products are consistent with the United Nations Food and Agriculture Organization (FAO) and World Health Organization (WHO)9 guiding principles for healthy and sustainable diets, often reflected in FBDGs as a sustainable dietary principle6 7 10 .
Plant-based dietary patterns, including vegetarian and vegan, vary in the extent to which they exclude animal products.11 A global analysis from Klapp et al.11 examined the details of plant-based dietary recommendations in FBDGs, concluding that, out of 95 examined guidelines, fewer than half had a position on vegetarian diets, with only 45% providing recommendations on healthy plant-based alternatives to meat and dairy.11 The same analysis also found that economic interests associated with meat production influence the inclusion of plant-based dietary concepts into countries’ FBDGs.11 Increasing access to evidence-based information on plant-based nutrition is important for FBDGs that aim to integrate sustainability, promote healthy diets and avoid micronutrient deficiencies.
state of nutrition in africa
A small proportion of African countries have country-level FBDGs. In 2022, only seven countries had government recommendations for healthy diets in the form of an FBDG policy, and none of these FBDGs had integrated concepts
Review Article
https://doi.org/10.17159/sajs.2025/18967
of sustainability.12 The development of African FBDGs will likely accelerate in future years, and context-specific recommendations for sustainable healthy diets are urgently required. There are various complex systemic factors influencing food systems and consumption patterns in Africa, and this study covers some of the indicators associated with SDG 2, SDG 3 and SDG 13 that can be addressed through balanced FBDGs.
The African continent, home to over 1.2 billion people, faces a profound nutrition crisis with rising hunger, food insecurity and undernutrition, all indicators of SDG 2.13 The FAO and others13 report that progress towards achieving the targets set for these issues is far off track. The number of Africans experiencing hunger has risen to over 57 million, representing a much higher proportion of the population than in other regions.13 In 2022, 19.7% of the African population was undernourished, and 78% could not afford a healthy diet.13
There is a ‘double burden’ of malnutrition in Africa, where coexisting patterns of under- and overnutrition drive increasing rates of overweight and obesity and the risk factors for developing non-communicable diseases (NCDs).14-16 Many NCDs are diet related, such as obesity, type 2 diabetes, cardiovascular disease and some cancers. Reducing premature deaths associated with NCDs is a target of SDG 3. Despite a lack of data on overall rates of NCDs on the African continent, it is estimated that NCD-related deaths are significant and on the rise.17 The prevalence of obesity doubled in six African countries and tripled in five others between 1991 and 2014.18 Diabetes is also increasing in the African region.19 In 2013, it was projected that the number of people living with diabetes in Africa would rise from 19.8 million to 41.5 million in 2035, with countries such as South Africa, Zimbabwe and the Democratic Republic of Congo facing alarming rates.19
The growing burden of diet-related NCDs is explained by nutrition transitions resulting from rapid urbanisation and economic development across Africa.13 16 19-21 For example, there is an increase in diabetes rates across the economic spectrum in Africa, from 4.4% in low-income and 5.0% in lower-middle-income countries, to 7.0% in upper-middle-income countries.19 Urbanisation-driven dietary shifts are characteristically towards ‘Western’ diets high in unhealthy ultra-processed foods and animal-source foods that are high in salt, sugar and trans- and saturated fats, and away from traditional high-fibre, plant-forward dietary patterns.20 An analysis by the FAO et al.13 of consumption patterns in African countries across the rural–urban continuum showed that urban dietary patterns are highest in animal-source foods (44%), as a result of increasing access to income. Legumes such as pulses, nuts and seeds are more often consumed in rural areas and are likely to be dropped from urban dietary patterns.13
Preserving traditional plant-forward dietary patterns and avoiding shifts towards Western diets are crucial for sustainable and just food systems in Africa.22 Africa’s traditional diets are rich in legumes, indigenous vegetables and whole grains, with indigenous crops revered for their substantial nutritional value, climate-resilient qualities and cultural value.23 Indigenous food systems are important to SDG 2, yet often overlooked and underutilised, particularly in FBDGs. There are 100 ‘forgotten’ African plant foods outlined by the FAO24 that could contribute to food and nutrition security on the continent. Sustainable dietary patterns should emphasise local native foods to counter nutritional deficiencies and promote food security in a changing climate.
table 1: Indicators and their weights in the Balanced Food Choice Index
No food group that includes only meat, fish, and/or eggs
No food group that contains only dairy
Plant-based food sources for critical nutrients of plant-based diets
Recommendations on how to obtain vitamin B12 without animal-based foods
In this review, we aimed to determine the inclusivity of plant-based dietary patterns in African FBDGs. The objectives were to (1) review the extent of African FBDGs and (2) analyse their content using the Balanced Food Choice Index (BFCI) scoring system, a tool used to index countries’ FBDGs for their inclusion of basic principles promoting healthy and sustainable plant-based dietary choices.10
Methods
The study design was a state-of-the-art literature review25 of African FBDG documents that included a qualitative analysis followed by quantitative scoring. The purpose of state-of-the-art reviews is to outline the development of a topic by describing where we are, how we got here, and where we are headed. A state-of-the-art review is rooted in subjective realism and the idea that knowledge is shaped by individuals and communities over time.25 This perspective aligns with the approach that country-level FBDG documents are created based on local foods and dietary patterns.
The protocol for our review and analysis of publicly available FBDG documents was cleared by the North-West University Health Research Ethics Committee (NWU-00075-24-A1). Our team included researchers based in South Africa, Germany and Nigeria. African FBDGs were collected between January and March 2024. The FAO online repository for FBDGs26 was used for data collection. The Google search engine was also used with the keywords “dietary guideline [country name]” for all African FAO member countries.27 FBDGs were included if they stemmed from an African country, were the latest edition, and were published from 1995 onwards. Guidelines for specific target groups, such as children; technical support papers describing the methodology for the development of FBDGs; and other nutrition policies were excluded. There were no limitations on language. Literature published in languages other than English was translated using free software, DeepL Translator, in conjunction with consultation with native speakers.
We chose to use the 47 African FAO member countries.27 This is fewer countries than the 55 member states making up the African Union.28 In a previous study looking at African FBDGs, Ainuson-Quampah et al.12 used the 47 African WHO member countries. We chose to use the FAO member countries as the FAO is a driving force behind developing FBDGs worldwide and the source of the global FBDG repository.26
The data extraction and analysis of the FBDG documents were guided by the BFCI scoring system. The FBDGs were collected and studied, and qualitative data were extracted according to the BFCI indicators to allocate points to their score. Points were allocated for inclusive food groups, plant food sources of nutrients, a position on vegetarian diets, recommendations for plant-based alternatives, and associated health and sustainability aspects. This system was applied in a global analysis by Klapp et al.10 and a description of the indicators and their weighting is found in Table 1. Four blinded researchers scored the FBDG documents and discussed their results to form a consensus for each country’s score. A summary of updated scores for African FBDGs using the BFCI tool between 2022 and 2024 is provided in the supplementary material
A map of food graphics from food-based dietary guidelines in Africa and their World Bank country economic classification was created, inspired by the analysis by Kraak et al.29 of the FBDGs of G20 member countries (Figure 1).
Do all food groups that include meat, fish, and/or eggs also include ≥1 plant-based foods? 18
Do all food groups that include dairy foods (milk or milk products) also include ≥1 plant-based foods? 18
Does the guideline mention ≥1 plant-based food as a source of protein, iron, calcium, zinc or omega-3 fatty acids?
≤15 points, 3 for each nutrient
Does the guideline say that diets without or low in animal-based products require B12 supplementation? 5
table 1 continues on next page
table 1 continued...
Indicator
Plant-based meat alternatives
Plant-based milk alternatives
Plant-based dairy alternatives
Recommendations on vegetarian diets
Health benefits of vegetarian diets
Environmental sustainability benefits of vegetarian diets and/or plant-based foods
Coding rule
Does the guideline text mention/do the guideline graphics (food pyramids, plates, etc.) display ≥1 plant-based meat alternative and present it as a possible alternative?
Does the guideline text mention/do the guideline graphics (food pyramids, plates, etc.) display ≥1 plant-based milk alternative and present it as a possible alternative?
Does the guideline text mention/do the guideline graphics (food pyramids, plates, etc.) display ≥1 plant-based alternative to dairy products (e.g. yoghurt and cheese) and present it as a possible alternative?
Weight
≤6 points, 3 each for inclusion in texts and graphics
≤6 points, 3 each for inclusion in texts and graphics
≤6 points, 3 each for inclusion in texts and graphics
Does the guideline mention a form of a vegetarian diet and give any nutritional guidance about it? 12
Does the guideline point out the preventive potential of vegetarian diets in terms of non-communicable diseases such as obesity, heart disease and type 2 diabetes? 9
Does the guideline point out the lower resource usage and/or lower greenhouse gas emissions of vegetarian diets or plant-based foods vs animal-based diets? 5
Guideline: any official document or web application that provides food-based dietary guidance for people in the general population (healthy adults who are not seniors, pregnant or lactating)’ food group: the guidelines’ largest unit of food grouping; plant-based alternatives: products that are very similar to their respective animal-based products in terms of use.
Weight: Full points if yes; zero points if no.
A colour key was added which corresponds to The World Bank Group30 economic classification for countries, as the literature describes associations between increasing income, increased animal product consumption and burden of NCDs.13 19 For the 2024 fiscal year, the classification of countries
was according to 2022 gross national income per capita in US dollars: $1135 or less as lower-income economies, between $1136 and $4465 as lower-middle-income economies, $4466 to $13 845 as upper-middleincome economies, and $13 846 or more as high-income economies.31
Figure 1: Food graphics of food-based dietary guidelines in Africa and their World Bank country economic classification.
r esults
extent of dietary guidelines in africa
Twelve African countries had FBDGs: Benin32, Ethiopia33, Gabon34, Ghana35, Kenya36, Namibia37, Nigeria38, Sierra Leone39, Seychelles40, South Africa41, Zambia42 and Tanzania43 (Table 2). These countries represent only one-quarter of FAO member countries from Africa. Figure 1 shows the food graphics of FBDGs in Africa with their World Bank economic classification. Countries’ economic classification varied, but the majority (50%) of the African countries with FBDGs were lowermiddle-income countries. Almost half (42%) of these guidelines were recently published, between 2020 and 2024; two were translated from French (Benin32 and Gabon34).
Balanced Food Choice Index for african dietary guidelines
Balanced FBDGs are guidelines that include food choices across ethical, ecological, religious and economic aspects and, therefore, cover accurate information for the broad spectrum of plant-based diets.10 Table 3 shows the BFCI scores for FBDGs in Africa according to our analysis and a summative table of the individual indicator scores per country is included in the supplementary material. The average BFCI score was 21.83 out of 100 points, compared with a global average of 33.58.10
With 53 points, South Africa had the most balanced guideline among African countries. This score was because of the mention of plant food sources of five critical nutrients (protein, iron, calcium, zinc, omega-3 fatty acids) and vitamin B12 recommendations. South Africa’s guidelines had a position on vegetarian diets that highlighted several associated health benefits.41 Points were also awarded for describing plant-based alternatives to meat, milk and other dairy products.
Namibia, Benin, Gabon and Zambia had relatively high scores. However, these countries lacked information on vitamin B12 supply in the spectrum of plant-based diets. Seychelles was in last place with zero points, indicating a considerable lack of information regarding healthy and sustainable food choices.
Factors contributing to the BFCI score are discussed in the following subsections in decreasing order of weight (as shown in Table 1).
Inclusive food groups
Inclusive food groups contribute the most points to the BFCI scoring system, and exclusive animal-product-only meat and dairy groups are allocated no points. Three countries (Benin, Namibia and Gabon)
table 3:
food-based dietary guidelines and their Balanced Food Choice Index scores
received points for inclusive meat and dairy groups, meaning that they list animal- and plant-based foods together in one food group. Namibia’s FBDG recommended “eat[ing] beans or meat regularly”.37 Benin’s guideline had an inclusive protein food group made up of “meat, fish, beans and other protein sources”.32
The Tanzanian FBDG documents replaced an inclusive food group with an exclusive one. Previous Tanzanian policies grouped proteins into a “pulses, nuts and animal-source food” group.43 In 2023, food groups were officially split into separate plant- (pulses and nuts) and animal-source foods.43 This approach does not reflect inclusive food groups and received zero points.
r ecommendations for vegetarian diets
Dietary guidelines received 12 points for providing recommendations on vegetarian diets. Among the 12 African FBDGs analysed, the word “vegetarian” only appears in those of two countries: South Africa and Zambia.41 42
South Africa’s guidelines provided a comprehensive position on vegetarian diets, recommending a vegetarian meal at least once a week. The quoted paragraph covers many aspects of information contributing to South Africa’s overall highest score:
People choose to follow a vegetarian diet for a variety of reasons. Well-planned vegetarian diets can be both nutritious and healthy. These have been associated with a lower risk of heart disease, type 2 diabetes, obesity and certain types of cancer, and lower blood cholesterol levels. However, restrictive or unbalanced vegetarian diets may lead to nutritional deficiencies, particularly in situations of high metabolic demand. The nutrients of major concern in a vegetarian diet are protein, iron, calcium, vitamin B12 and n-3 fatty acids.41
Zambia’s guidelines provided nutrient recommendations for vegetarian diets but had no comprehensive position on these diets.
For vegetarians and those who are not eating fish, insects and [animal-source foods], … taking two servings of pulses, nuts and seeds will ensure an adequate intake of proteins and other micronutrients that fish, insects and [animal-source foods] provide.42
table 2: Africa’s food-based dietary guidelines
African
health benefits of vegetarian diets
A dietary guideline received nine points for mentioning the health benefits of vegetarian diets. As described, “vegetarian” diets were rarely referred to in African guidelines. Only South Africa’s guidelines met the criterion of describing the health benefits associated with vegetarian diets, including lowered blood cholesterol and protection against NCDs such as “heart disease, type 2 diabetes, obesity and certain types of cancer”41.
The Zambian guideline described the health benefits associated with plant-forward diets. The scoring system did not allocate points for the information found in the Zambian FBDG, because there was no reference to vegetarian diets. However, one paragraph raises awareness of the NCD-protective benefits of plant-forward diets:
There is increasing evidence of the health benefits of plants (grains, legumes, nuts and a variety of fruits and vegetables) on human health … Reducing the intake of red meats and processed meats like bacon, ham, sausages and burgers, and replacing these with healthier plant-based food options, insects and fish helps to reduce the risk of obesity and associated [non-communicable diseases] such as heart disease, diabetes and cancer.42
Environmental sustainability
Three African countries met the criteria for including the sustainability benefits of vegetarian diets or plant-based foods. The Zambian FBDG demonstrated a comprehensive statement on sustainability, mentioning a range of environmental parameters such as greenhouse gas emissions, land and water requirements, deforestation and soil health:
Eating a diet predominantly based on whole grains, legumes, fruits and vegetables, fish and insects is not only good for our health, but it is good for planetary health too. Growing whole grains, legumes, fruit and vegetables, and producing fish and insects does not produce as much greenhouse gas as raising cattle or large livestock. Raising livestock produces 14.5 percent of all greenhouse gas emissions, with cattle (raised for both beef and milk, as well as for inedible outputs like manure and draft power) contributing 65 percent of the livestock sector’s emissions. Whole grains, pulses, fruits and vegetables, insects and fish also help reduce waste and lower pollution. Such a dietary pattern also reduces water and land use, slows deforestation and reduces the destruction of topsoil, among other benefits.42
Guidelines from Sierra Leone and Ethiopia received points for underscoring the role of beans, pulses and legumes in sustainable food systems and promoting protein diversification.
[Pulses and legumes] have important nitrogen-fixing qualities needed for enhancing soil fertility, hence they have a positive impact on the sustainable environment in the context of the changing climatic conditions.39
Food system transformation processes that target improving diet quality must consider actions needed to increase production diversification, must include production and productivity of legume crops.33
Nutrient recommendations
The literature often describes five critical nutrients that require special attention in a predominantly plant-based diet: protein, iron, calcium, zinc and omega-3 fatty acids. The BFCI awards three points for each nutrient if a guideline mentions plant-based foods that can provide
these nutrients. More points are allocated for sourcing vitamin B12 (five points) recommendations for people who consume few or no animal products in the form of fortified foods and supplements.
Only two (17%) guidelines recommended sourcing vitamin B12 when animal products are excluded. Zambia’s guidelines highlight the risk of vitamin B12 deficiency when omitting animal products from the diet.
All vitamin B12 requirements must be met from animal sources of food or from supplementation, as there is virtually no vitamin B12 in plant food sources.
41
Vitamin B12 is mainly found in fish, poultry meat and dairy products. Not consuming ASF [animal-source foods] can lead to vitamin B12 deficiency.42
Plant proteins were found in most (83%) African dietary guidelines. The Ghanaian FBDG recognised plant-based protein as an adequate, healthy and affordable alternative to animal protein.
Eat a variety of beans, nuts and legume seeds every day as part of a healthy diet. Beans, nuts and legumes are an important source of protein and nutrients from plant foods. Food from this group is a particularly important substitute for animal protein, since they are cheaper than animal sources for protein and micronutrients.35
Three-quarters (75%) of African guidelines covered plant-food sources of iron. Several countries expressed concerns about the absorption and bioavailability of plant-based iron. Some guidelines provided recommendations for increasing bioavailability by combining plant-based sources of iron with vitamin-C-rich fruit and vegetables.
Citrus fruit, e.g. grapefruits and lime are also available as well as fresh tomatoes all of which are high in vitamin C, and when eaten with foods containing iron will enhance the absorption of the iron e.g. spinach, okra, etc.… It is important to recognize that iron from animal-based foods, commonly known as heme iron are better absorbed compared to plant based iron i.e. non-heme iron.39
Half (50%) of the guidelines presented plant food sources of calcium. FBDGs often position cow’s milk as the superior source of calcium in a diet, which is the case in the South Africa guidelines:
The inclusion of milk (especially calcium and potassium) in the diet is essential in order to meet the nutrient needs of most South Africa. … Adequate calcium intake is difficult to achieve with dairy free diets, even when other nutrient recommendations are met.41
However, there are many sources of calcium among plant foods, as demonstrated in the Zambian guideline:
If milk is not available, eat calcium-rich foods such as moringa, amaranthus, cowpeas leaves, cassava leaves, baobab fruit or leaves, tamarind leaves…42
Plant food sources of zinc were found in only one-third (33%) of guidelines, and Zambia’s guidelines highlighted the risks of zinc bioavailability.42 None of the guidelines made recommendations for increasing the bioavailability of zinc from plant food.
Zinc is mainly found in animal protein sources such as meat, and is also more easily absorbed and used from animal protein sources than plant sources.
42
Plant food sources of omega-3 fatty acids were mentioned the least in African FBDGs, at 25%. Risks associated with vegetarian diets and
lower omega-3 fatty acids are mentioned in two guidelines (the South African and Zambian):
With regard to fatty acids, the body has the ability to convert some ALA [alpha-linolenic acid] into the n-3 [omega-3] PUFAs [polyunsaturated fatty acids], EPA [eicosapentaenoic acid] and DHA [docosahexaenoic acid], yet this conversion isn’t very efficient. If no fish is consumed, a supplement of DHA [docosahexaenoic acid] should be considered.41
DHA [docosahexaenoic acid] is an essential omega-3 fat found in fatty fish. It is important for brain health and is difficult to get from plant sources.42
Plant-based alternatives
The BFCI awards points for FBDGs that mention plant-based alternatives to meat, milk or dairy in the text or the food graphic.
Plant-based alternatives to cow’s milk were mentioned in four African guidelines (those of Benin32, Gabon34, Tanzania43 and South Africa42). The most common milk alternative was soya milk, mentioned in the guidelines of Benin, Gabon and South Africa. Coconut milk was recommended by Tanzania.43 Interestingly, Gabon’s guidelines suggested a range of traditional milk alternatives:
Alternate between skimmed dairy products (milk, yoghurt) and cow’s milk substitutes (sole, white beans, soya, sesame) during the week.34 [translated from French]
Treatment [of cow’s milk allergy] consists of total avoidance of exposure to the allergens through elimination diets, and replacing cow’s milk with soy or rice milk.41
Use of coconut milk in moderation; not more than one-third of a cup per person per day.43
Plant-based meat was also mentioned in four FBDGs (Kenya36, Benin32, South Africa41 and Gabon34). Soya and associated products, including “soya meat”, tofu and tempeh, dominated these recommendations.
Many soy foods, such as soy beans, soy nuts, soy flour, textured soy protein and tempeh, are rich in fibre. However, isolated soy protein does not include dietary fibre.41
We have presented a review and analysis of FBDGs in Africa. Objective one was to review the extent of FBDGs in Africa, revealing a concerningly low proportion of country-level guidelines on the continent. Only 12 out of the 47 African member countries of the FAO had FBDGs, leading to a significant gap in access to official information on what constitutes healthy diets across Africa. This should prompt urgent coordination from national governments and regional FAO groups to develop FBDGs in African countries and review outdated policies against the latest scientific evidence.
It is challenging to access up-to-date FBDG documents from countries around the world. Information on the latest documents and processes is usually limited to the country level, and it is uncertain when the FAO repository was last updated. The literature does indicate the development of newer FBDGs in African countries, with Tanzanian guidelines citing development in Zimbabwe, Rwanda, Eswatini, Gambia and Botswana.43 FBDGs will be essential for public health and food systems transformation in Africa.
Objective two was to analyse African guidelines for their inclusivity of basic information on plant-based dietary patterns. This is relevant
because many people in Africa limit animal-source foods for economic, health, environmental, religious or ethical reasons.8,13,44 The inclusivity of plant-based dietary patterns was calculated using the BFCI scoring system.10 The results showed that African FBDGs had less information (21.83 out of 100 points) about plant-based dietary patterns than the global average (33.58 out of 100 points), indicated by the mean BFCI scores.10 Our results calculated the top five most balanced guidelines in Africa as those from South Africa41, Namibia37, Benin32, Gabon34 and Zambia.42 Countries can learn from the best practice examples related to FBDG policies in Africa and the rest of the world.
The greatest opportunity for FBDGs to achieve a high BFCI score is with inclusive food groups combining animal and plant proteins, as found in Namibia37, Benin32 and Gabon.34 Longer, more detailed FBDG documents are associated with higher BFCI scores.10 Our analysis found a considerable lack of awareness of vegetarian diets in FBDGs across Africa, contributing to overall low scores. This is despite the guidelines from Ethiopia33 and Ghana35 describing dietary patterns as traditionally plant-forward and low in animal-source foods. Africa’s local foods are found in diverse recommendations from Gabon’s range of milk alternatives, “white beans, soya, sesame” (translated from French: haricot blanc, soja, sésame)34, to Zambia’s plant food sources of calcium, “moringa, amaranthus, cowpeas leaves, cassava leaves, baobab fruit or leaves, tamarind leaves”.42
In terms of nutrient recommendations, the African guidelines commonly presented plant-based food options for protein and iron. This was a strength across the FBDGs in Africa. There were fewer recommendations for calcium, zinc and omega-3 fatty acids, and rarely for vitamin B12 supplementation. These are all important to address as foundational concepts of plant-based nutrition.10 11
Many of the African guidelines criticise the bioavailability of nutrients found in plant foods. Few discuss how to effectively increase the bioavailability of nutrients. For example, plant-based food sources of iron can be combined with vitamin-Crich fruit and vegetables as a practical strategy to prevent iron deficiencies.45 There are also several highly bioavailable plant-based food sources of calcium, including green leafy vegetables46, fortified plant-based milk and calcium-set tofu.47 Food preparation methods may also play a role in effectively reducing anti-nutritional factors and supporting mineral and protein absorption from staple plant foods such as legumes and grains.48
Milk alternatives should be incorporated into African dietary guidelines, as an estimated 70% of the global population experiences challenges in fully digesting lactose, with higher prevalence among black and Indigenous communities as well as low- and middle-income countries.49 10 Including milk alternatives is an important part of African guidelines, as lactose intolerance is highly prevalent in Africa, ranging between 53% and 84% in North Africa and 77% and 100% in sub-Saharan Africa49, making it difficult for a significant part of the population to digest dairy. Analysis results show that one-third of African guidelines mention plant-based milk alternatives. There is a diversity of plant milks mentioned in guidelines: soya, sesame, bean and coconut milk. Information on coconut milk is found in the guideline of Tanzania43, where coconut palms are indigenous.50 Globally, guidelines generally recommend fortified soya milk10, a common option with comparable protein to cow’s milk.51
Our results show that more African FBDGs are incorporating aspects of sustainability, compared with a 2022 review12 finding no sustainability aspects in African FBDGs. Zambia raised awareness of the climate impacts of animal agriculture and recommended plant-based dietary patterns in their FBDG.42 This is in line with an FBDG analysis of the G20 countries by Kraak et al.29, which showed that limiting meat consumption is an important part of sustainability in FBDGs, especially for higher-income contexts. Another way that African FBDGs consider sustainability is by promoting the production and consumption of legumes. Legumes are an important part of sustainable food systems, protein diversification and nutrition security.52,53 They have a long shelf life and are an inexpensive source of protein, fibre, iron and folic acid.54 Increased consumption of legumes can also have a protective effect against cardiovascular disease and heart attacks.55
FBDGs in Africa largely miss the opportunity to promote the health benefits of plant-based dietary patterns. The NCD-protective benefit of plant-based dietary patterns was only explained in the FBDGs from South Africa41 and Zambia.42 The rising burden of NCDs across Africa requires diverse solutions, and plant-based dietary shifts could alleviate the burden of disease and reduce healthcare costs.56 FBDGs should be used as a platform to share evidence-based information promoting these health benefits to medical and nutrition professionals.
Conclusion
Africa needs more FBDGs to promote healthy diets from sustainable food systems. These FBDGs should be inclusive of plant-based dietary patterns and provide information for people who choose to eat plant-forward diets for health, environmental, religious or ethical reasons, or out of necessity because of food insecurity and lack of access to animal-source foods.
Acknowledgements
We thank Raz Arnold Design for their design contributions.
Funding
We acknowledge funding from ProVeg Grants (Jul2023-0000001842).
Data availability
The data supporting the results of this study are available upon request to the corresponding author.
Declarations
We have no competing interests to declare. We have no AI or LLM use to declare. The protocol for a review and analysis of publicly available FBDG documents was cleared by the North-West University Health Research Ethics Committee (NWU-00075-24-A1).
Authors’ contributions
N.W.: Conceptualisation, methodology, data collection, sample analysis, data analysis, data curation, writing – the original draft, writing –revisions, project leadership, project management, funding acquisition.
A-L.K.: Conceptualisation, methodology, data collection, sample analysis, data analysis, data curation, writing – the original draft, writing –revisions, funding acquisition. P.N.: Data collection, sample analysis, data analysis, writing – the original draft, project management. M.U.: Data collection, sample analysis, data analysis, writing – the original draft. C.N.: Methodology, validation. All authors read and approved the final manuscript.
r eferences
1. United Nations Food and Agriculture Organization (FAO). Food systems-based dietary guidelines: An overview. Rome: FAO; 2024. https://openknowledge.fa o.org/handle/20.500.14283/cc9394en
2. United Nations Food and Agriculture Organization (FAO). Food-based dietary guidelines: Background [webpage on the Internet]. No date [cited 2024 Jun 24]. Available from: https://www.fao.org/nutrition/education/food-dietary-gu idelines/background/en/
3. World Health Organization (WHO). Preparation and use of food-based dietary guidelines. Geneva: WHO; 1996. Available from: https://www.fao.org/4/x02 43e/x0243e00.htm
4. United Nations Food and Agriculture Organization (FAO). Sustainable diets and biodiversity: Directions and solutions for policy, research and action. Rome: FAO; 2010. Available from: https://www.fao.org/4/i3004e/i3004e00.htm
5. Grosso G, Mateo A, Rangelov N, Buzeti T, Birt C. Nutrition in the context of the Sustainable Development Goals. Eur J Public Health. 2020;30(1):119–123. https://doi.org/10.1093/eurpub/ckaa034
6. James-Martin G, Baird DL, Hendrie GA, Bogard J, Anastasiou K, Brooker PG, et al. Environmental sustainability in national food-based dietary guidelines: A global review. Lancet Planet Health. 2022;6(12):977–986. https://doi.org/10 .1016/S2542-5196(22)00246-7
7. Springmann M, Spajic L, Clark MA, Poore J, Herforth A, Webb P, et al. The healthiness and sustainability of national and global food based dietary guidelines: Modelling study. BMJ. 2020;370, Art. #2322. https://doi.org/1 0.1136/bmj.m2322
8. Intergovernmental Panel on Climate Change (IPCC). Summary for policymakers. In: Climate change and land: An IPCC special report on climate change, desertification, land degradation, sustainable land management, food security, and greenhouse gas fluxes in terrestrial ecosystems. Cambridge: Cambridge University Press; 2022. p. 1–36. https://doi.org/10.1017/9781009157988.001
9. United Nations Food and Agriculture Organization (FAO) and World Health Organization (WHO). Sustainable healthy diets: Guiding principles. Rome: FAO/WHO; 2019. Available from: https://www.who.int/publications/i/item/9 789241516648
10. Klapp AL, Feil N, Risius A. A global analysis of national dietary guidelines on plant-based diets and substitutions for animal-based foods. Curr Dev Nutr. 2022;6(11), Art. #144. https://doi.org/10.1093/cdn/nzac144
11. Tuso PJ, Ismail MH, Ha BP, Bartolotto C. Nutritional update for physicians: Plant-based diets. Perm J. 2013;17(2): 61–66. https://doi.org/10.7812/TP P/12-085
12. Ainuson-Quampah J, Amuna N, Holdsworth M, Aryeetey R. A review of foodbased dietary guidelines in Africa: Opportunities to enhance the healthiness and environmental sustainability of population diets. Afr J Food Agric Nutr Dev. 2022;22(2):19471–19495. https://doi.org/10.18697/ajfand.107.21790
13. FAO, IFAD, UNICEF, WFP, WHO. The state of food security and nutrition in the world: Urbanization, agrifood systems transformation and healthy diets across the rural–urban continuum. Rome: FAO; 2023. https://doi.org/10.4 060/cc3017en
14. Onyango AW, Jean-Baptiste J, Samburu B, Mahlangu TLM. Regional overview on the double burden of malnutrition and examples of program and policy responses: African region. Ann Nutr Metab. 2019;75(2):127–130. https://do i.org/10.1159/000503671
15. Bosu WK. An overview of the nutrition transition in West Africa: Implications for non-communicable diseases. Proc Nutr Soc. 2015;74(4):466–477. https ://doi.org/10.1017/s0029665114001669
16. Hunter-Adams J, Yongisi BN, Dzasi K, et al. How to address non-communicable diseases in urban Africa. Lancet Diabetes Endocrinol. 2017;5(12):932–934. https://doi.org/10.1016/S2213-8587(17)30220-6
17. Bigna JJ, Noubiap JJ. The rising burden of non-communicable diseases in sub-Saharan Africa. Lancet Glob Health. 2019;7(10):1295–1296. https://doi .org/10.1016/S2214-109X(19)30370-5
18. Amugsi DA, Dimbuene ZT, Blessing M, Muthuri S, Ezeh AC. Prevalence and time trends in overweight and obesity among urban women: An analysis of demographic and health surveys data from 24 countries, 1991–2014. BMJ. 2017;7, Art. #017344. https://doi.org/10.1136/bmjopen-2017-017344
19. Peer N, Kengne AP, Motala AA, Mbanya JC. Diabetes in Africa: An update. Diabetes Res Clin Pract. 2013;103(2):197–205. http://dx.doi.org/10.1016/j .diabres.2013.11.006
20. Mbogori T, Mucherah W. Nutrition transition in Africa: Consequences and opportunities. Glob J Transform Educ. 2019;1(1):5–10. https://doi.org/10. 14434/gjte.v1i1.26141
21. Juma K, Juma P A, Shumba C, Otieno P, Asiki G. Non-communicable diseases and urbanization in African cities: A narrative review. In: Anugwom EE, Awofeso N, editors. Public health in developing countries – Challenges and opportunities. London: IntechOpen; 2020. http://dx.doi.org/10.5772/in techopen.89507
22. Akinola R, Pereira LM, Mabhaudhi T, de Bruin FM, Rusch L. A review of indigenous food crops in Africa and the implications for more sustainable and healthy food systems. Sustainability. 2020;12(8), Art. #3493. https://d oi.org/10.3390/su12083493
23. Aworh O. From lesser-known to super vegetables: The growing profile of African traditional leafy vegetables in promoting food security and wellness. J Sci Food. 2018;98(10):3609–3613. https://doi.org/10.1002/jsfa.8902
24. United Nations Food and Agriculture Organization (FAO). Compendium of forgotten foods in Africa – A companion publication for integrating Africa’s forgotten foods for better nutrition. Accra: FAO; 2024. https://doi.org/10.40 60/cc5044en
25. Barry ES, Merkebu J, Varpio L. State-of-the-art literature review methodology: A six-step approach for knowledge synthesis. Perspect Med Educ. 2022;11:281–288. https://doi.org/10.1007/s40037-022-00725-9
26. United Nations Food and Agriculture Organization (FAO). Food-based dietary guidelines [webpage on the Internet]. No date [cited 2024 Jun 24]. Available from: https://www.fao.org/nutrition/education/food-based-dietary-guidelines
27. United Nations Food and Agriculture Organization (FAO). FAO regional office for Africa: Member countries in Africa [webpage on the Internet]. No date [cited 2024 Jun 24]. Available from: https://www.fao.org/africa/about-us/our-offices/en
28. African Union. Member states [webpage on the Internet]. No date [cited 2024 Jun 24]. Available from: https://au.int/en/member_states/countryprofiles2
29. Kraak VI, Stanley KC, Patino SRG, Houghtaling B, Shanks CB. How the G20 leaders could transform nutrition by updating and harmonizing food-based dietary guidelines. Transforming nutrition. UN-Nutr J. 2022;11(1):69–89. https://doi.org/10.4060/cc2805en
30. The World Bank Group. The world by income and region [webpage on the Internet]. c2024 [cited by 2024 Jun 24]. Available from: https://datatopics .worldbank.org/world-development-indicators/the-world-by-income-and-re gion.html
31. The World Bank Group. World Bank country and lending groups [webpage on the Internet]. No date [cited 2024 Jun 24]. Available from: https://datah elpdesk.worldbank.org/knowledgebase/articles/906519-world-bank-countr y-and-lending-groups
32. Government of Benin. Benin’s dietary guidelines [document on the Internet]. c2015 [cited 2024 Jun 24]. Available from: https://wiredhealthresources.net /presentations/82/story_content/external_files/Benin.pdf
33. Federal Government of Ethiopia, Ministry of Health, Ethiopian Public Health Institute. Ethiopia: Food-based dietary guidelines – 2022 [document on the Internet]. Addis Ababa:Federal Government of Ethiopia, Ministry of Health, Ethiopian Public Health Institute; 2022. Available from: https://ephi.gov.et/w p-content/uploads/2021/02/FBDG_MotherDocument_WebVersion.pdf
34. Government of Gabon. Guide et recommandations alimentaires nationales pour des régimes sains – Gabon [National dietary guidelines and recommendations for healthy diets – Gabon]. Rome: FAO; 2021. French. Available from: https://faolex.fao.org/docs/pdf/gab208778.pdf
35. Ministry of Food and Agriculture, University of Ghana School of Public Health. Ghana: National food-based dietary guidelines – 2023. Accra: Ministry of Food and Agriculture and University of Ghana School of Public Health; 2023. Available from: https://drive.google.com/file/d/1eZcCt0dhkNjDOUA13-BiGAfs 23uOpkVl/view?usp=sharing
36. Kenyan Ministry of Health. National guidelines for healthy diets and physical activity. Nairobi: Government of Kenya; 2017. Available from: http://www. nutritionhealth.or.ke/wp-content/uploads/Downloads/National%20Guidelines %20for%20Healthy%20Diets%20and%20Physical%20Activity%202017.pdf
37. Namibian Ministry of Health and Social Services, Food and Nutrition Unit. Food and nutrition guidelines for Namibia: Food choices for a healthy life. Windhoek: Ministry of Health and Social Services; 2000. Available from: http s://openknowledge.fao.org/server/api/core/bitstreams/d66a1136-9262-408 c-93ef-a69f6f40e3fc/content
38. Nigerian Federal Ministry of Health, Nutrition Division. Food-based dietary guideline for Nigeria: A guide to healthy eating [webpage on the Internet]. Abuja: Federal Ministry of Health; 2006. Available from: https://openknowl edge.fao.org/server/api/core/bitstreams/53d6c163-3ffe-426f-a6b3-ff3357e 96754/content
39. Sierra Leonean Ministries of Agriculture. Sierra Leone: Food-based dietary guidelines for healthy eating [document on the Internet]. c2016 [cited 2024 Jun 24]. Available from: https://openknowledge.fao.org/server/api/core/bitstr eams/22cb889f-b539-4ef9-8572-2afcc3bcfa39/content
40. Nutrition Unit, Seychelles Ministry of Health and Social Services. The Seychelles dietary guidelines [document on the Internet]. c2006 [cited 2024 Jun 24]. Available from: https://openknowledge.fao.org/server/api/core/bitstr eams/a51d10c3-3bd8-43c5-9dee-bc6c20c1841e/content
41. Vorster HH, Badham JB, Venter CS. An introduction to the revised food-based dietary guidelines for South Africa. S Afr J Clin Nutr. 2023;26(suppl):S5–S12. Available from: https://www.sajcn.co.za/index.php/SAJCN/article/view/2244
42. Zambian Ministry of Agriculture. Zambia food-based dietary guidelines: Technical recommendations. Lusaka; Ministry of Agriculture; 2021. Available from: https://nfnc.org.zm/download/zambia-food-based-dietary-guidelines-t echnical-recommendations-2021-produced-by-the-ministry-of-agriculture/
43. Ministry of Health of the United Republic of Tanzania. Tanzania mainland foodbased dietary guidelines for a healthy population: Technical recommendations. Dodoma: Ministry of Health; 2023. Available from: https://www.moh.go.tz/st orage/app/uploads/public/658/295/d4b/658295d4bbcba467264195.pdf
44. Chouraqui JP, Turck D, Briend A, Darmaun D, Bocquet A, Feillet F, et al. Religious dietary rules and their potential nutritional and health consequences. Int J Epidemiol. 2021;50(1):12–26. https://doi.org/10.1093/ije/dyaa182
45. Heffernan A, Evans C, Holmes M, Moore JB. The regulation of dietary iron bioavailability by vitamin C: A systematic review and meta-analysis. Proc Nutr Soc. 2017;76(OCE4), Art. #E182. https://doi.org/10.1017/S0029665 117003445
46. Bourassa MW, Abrams SA, Belizán JM, Boy E, Cormick G, Quijano CD, et al. Interventions to improve calcium intake through foods in populations with low intake. Ann N Y Acad Sci. 2022;1511(1): 40–58. https://doi.org/1 0.1111/nyas.14743
47. Buchowski BS. Chapter 1: Calcium in the context of dietary sources and metabolism. In: Preedy VR, editor. Calcium: Chemistry, analysis, function and effects. London: The Royal Society of Chemistry; 2015. p. 3–20. https://doi.o rg/10.1039/9781782622130
48. Samtiya M, Aluko RE, Dhewa T. Plant food anti-nutritional factors and their reduction strategies: An overview. Food Prod Process Nutr. 2020;2, Art. #6. https://doi.org/10.1186/s43014-020-0020-5
49. Li A, Zheng J, Han X, Jiang Z, Yang B, Yang S, et al. Health implication of lactose intolerance and updates on its dietary management. Int Dairy J. 2023;140, Art. #105608. https://doi.org/10.1016/j.idairyj.2023.105608
50. Batugal PV, Ramanatha R, Oliver J, editors. Coconut genetic resources. Serdang: International Plant Genetic Resources Institute; 2005. Available from: https://cgspace.cgiar.org/server/api/core/bitstreams/7bbe5f2a-26a0-4c378d57-0472a870d112/content
51. Begum AA, Mazumder AR. Soymilk as source of nutrient for malnourished population of developing country: A review. Int J Adv Sci Tech Res. 2016;5(6): 192–201.
52. Semba RD, Ramsing R, Rahman N, Kraemer K, Bloem MW. Legumes as a sustainable source of protein in human diets. Glob Food Sec. 2021;28, Art. #100520. https://doi.org/10.1016/j.gfs.2021.100520
53. Foyer CH, Lam HM, Nguyen HT, Siddique KHM, Varshney RK, Colmer TD, et al. Neglecting legumes has compromised human health and sustainable food production. Nat Plants. 2016;2, Art. #16112. https://doi.org/10.1038 /nplants.2016.112
54. United Nations Food and Agriculture Organization (FAO). World Pulses Day [webpage on the Internet]. No date [cited 2024 Jun 24]. Available from: https://www.fao.org/world-pulses-day/en/
55. Mendes V, Niforou A, Kasdagli MI, Ververis E, Naska A. Intake of legumes and cardiovascular disease: A systematic review and dose-response metaanalysis. Nutr Metab Cardiovasc Dis. 2023;33(1):22–37. https://doi.org/10. 1016/j.numecd.2022.10.006
56. Springmann M, Godfray HC, Rayner M, Scarborough P. Analysis and valuation of the health and climate change cobenefits of dietary change. Proc Natl Acad Sci USA. 2016;113(15):4146–4151. https://doi.org/10.1073/pnas.1523119113
1Amrita School for Sustainable Futures, Amrita Vishwa Vidyapeetham, Amritapuri, India
2Amrita School of Agricultural Sciences, Amrita Vishwa Vidyapeetham, Coimbatore, India
CorrESPoNDENCE to: Estone Jiji Habanyati
EMAIL: cbiddids20001@am.students. amrita.edu
DAtES:
r eceived: 15 Nov. 2024
r evised: 21 May 2025
Accepted: 21 May 2025
Published: 11 Aug. 2025
hoW to CItE: Habanyati EJ, Paramasivam S. Extension models in sustainable agriculture adoption in South Asia and sub-Saharan Africa. S Afr J Sci. 2025;121(7/8), Art. #20578. https:// doi.org/10.17159/sajs.2025/20578
ArtICLE INCLuDES:
☒ Peer review
☐ Supplementary material
DAtA AVAILAbILItY:
☐ Open data set
☐ All data included
☒ On request from author(s)
☐ Not available
☐ Not applicable
EDItorS:
Annchen Mielmann
Leslie Swartz
KEYWorDS: adoption, diffusion, innovation, public extension system, transfer of technology
FuNDING:
Amrita Vishwa Vidyapeetham (E4LIFE International PhD Fellowship Program)
Extension models in sustainable agriculture adoption in South Asia and sub-Saharan Africa
Using the Preferred Reporting Items for Systematic Reviews and Meta-Analyses (PRISMA) methodology, we rigorously analysed the characteristics, strengths, and limitations of various extension models, including Fee-for-Service, Farmer Field Schools, Training and Visit, and Farmer-to-Farmer approaches. This review identifies persistent barriers to the widespread adoption of sustainable agricultural practices, such as limited access to resources, inadequate training, and the lack of tailored solutions for diverse farming contexts, which stem from the inherent limitations of conventional agricultural extension models. We also discuss a hybrid approach that integrates conventional and emerging participatory, demand-driven models, customised for smallholder farmers’ unique needs and constraints. This integrative strategy is suggested to enhance the dissemination and adoption of sustainable agricultural practices, thereby contributing to sustainable development and food security in South Asia and sub-Saharan Africa. We emphasise the need to leverage the complementary strengths of diverse extension models to address existing challenges and drive effective policy interventions.
Significance:
• Our findings will assist policymakers and practitioners to prioritise the development of agricultural extension strategies that are economically viable and tailored to the specific needs and constraints of smallholder farmers.
• We aim to help foster greater engagement from policymakers, enhance communication channels, and implement robust feedback mechanisms to ensure that agricultural extension services are responsive and adaptable.
Introduction
Agricultural development is essential for sustainable development and reducing poverty in South Asia and sub-Saharan Africa.1,2 Agricultural extension services are crucial for spreading technological advancements and tackling the challenges that farmers encounter at the local level.3 4 Despite their significance, smallholder farmers in these regions often face substantial barriers, including limited access to critical knowledge, information, and resources to improve their agricultural practices and achieve agricultural progress. Effective extension models are crucial for successfully disseminating sustainable agricultural practices (SAPs) to farmers. Sustainable agriculture is the viable management of available agricultural resources aimed at meeting increasingly complex human needs whilst restoring the integrity of the environment; enhancing the social and economic settings of farmers, their employees, and local communities; safeguarding farmers’ well-being and health; and conserving renewable natural resources.5
The concept of sustainable agriculture, also known as agricultural sustainability, is often categorised into three pillars: economic, social, and environmental. In practice, it constitutes one of the strategies for improving the sustainability of the farming system through the adoption of various SAPs, such as soil and water conservation technologies, terraces, agroforestry, climate-smart agriculture, organic farming, climate-resilient technologies, and conservation agriculture. However, smallholder farmers in rural areas of developing countries frequently encounter difficulties in accessing SAPs.6 To sustain their livelihoods, these farmers need a diverse range of reliable and precise information, as agricultural advancement depends on the ability to generate, share, and utilise knowledge effectively.7,8
Providing effective and efficient agricultural extension services remains a complex challenge, particularly for smallholder farmers. Information on knowledge-intensive SAPs in South Asia, according to Ali9, and in sub-Saharan Africa, according to Davis10, is provided by publicly financed agricultural extension services, which have historically struggled to cope with the changing demands of smallholder farmers. Extension programmes in rural communities serve a significant role in interfacing farmers with other stakeholders in the rural development agenda.11 Information is transmitted by employing either conventional or traditional extension models. The fundamental distinction between conventional extension models and traditional extension models is their methodology and efficacy in supporting farmers. Conventional extension models, such as Training and Visit (T&V), are predominantly distinguished by top-down, information-driven techniques that emphasise disseminating technology and knowledge to farmers with little emphasis on interactive learning.1 12 13 In contrast, traditional extension models, such as Farmer Field Schools (FFS), are primarily bottom-up, community-driven, and participatory techniques, focusing on indigenous knowledge and practices, fostering an integrative approach to agricultural development.1,10,12,14 Nevertheless, the efficiency of these models may vary depending on the region’s level of development, with T&V likely being more appropriate for less developed regions and FFS for more established agricultural regions.12,15 The assessment of conventional extension models alongside FFS is imperative because it underscores the potential benefits of participatory techniques in agricultural extension. The comprehension of the viability of FFS in comparison to conventional models assists in generating extension systems that are more resilient and better tailored to the distinctive demands of agricultural communities.
Notwithstanding the recognised benefits of SAPs and significant efforts by national and international organisations to promote their adoption, uptake remains low in rural areas16-19 and low adoption rates are primarily because of
https://doi.org/10.17159/sajs.2025/20578
gaps in farmers’ knowledge19,20. The slow adoption of SAPs has raised concerns about the effectiveness of existing agricultural extension models, which have sometimes led to suboptimal outcomes.21,22 The knowledge gaps in agricultural practices translate to yield discrepancies.12 Hence, a large proportion of smallholder farmers in South Asia and sub-Saharan Africa frequently utilise substandard practices in agriculture owing to a lack of awareness, expertise, and management.23 This review specifically examines the factors that influence the adoption of SAPs and the effectiveness of conventional extension models in promoting SAPs in South Asia and sub-Saharan Africa, and evaluates their strengths, weaknesses, and the overall impact of the models on the adoption rates of SAPs amongst smallholder farmers.
Materials and methods
We conducted a thorough literature analysis to examine the primary obstacles to the diffusion and adoption of SAPs amongst smallholder farmers in South Asia and sub-Saharan Africa in the context of four frequently utilised agricultural extension models: ((1) Fee-for-Service, (2) Farmer Field Schools (FFS), (3) Training and Visit (T&V), and (4) Farmer-toFarmer Extension (F2FE)). A systematic review aims to examine empirical evidence by extracting quantitative and qualitative aspects from original research.24,25 The Preferred Reporting Items for Systematic Reviews and Meta-Analyses (PRISMA) method, in contrast to the traditional review, adopts well-defined protocols.25 The method has been utilised in several disciplines24 26 , including agricultural research25. We employed a four-phase flow diagram to conduct a systematic review, which included identifying studies, screening studies, examining study eligibility, and selecting studies for inclusion (Figure 1).
Literature search strategy
The articles reviewed in this study were identified through searches done on Springer, Scopus, Web of Science, Science Direct, PubMed, and Google Scholar. The keywords utilised in the search for literature
were based on those from previously published empirical studies: such as “Sustainable Agricultural Practices”, “agricultural extension models”, “public extension system”, “transfer of technology”, “adoption” and “innovation diffusion models in agriculture”.
Inclusion criteria
A total of 750 articles were identified through the literature search. After the exclusion of duplicates, titles, abstracts, and full-text screening, a total of 46 studies were considered relevant and thus were included in this study (Figure 1). The following criteria were used to choose papers: (1) empirical research articles and conference proceedings; (2) studies published in English; (3) studies on the types of SAPs (soil and water conservation technologies, terraces, agroforestry, climate-smart agriculture, organic farming, climate-resilient technologies, and conservation agriculture) practised by smallholder farmers and the adoption rates in South Asia and sub-Saharan Africa; (4) studies focusing on factors influencing the adoption of SAPs; and (5) articles highlighting the utilisation of conventional agricultural extension models (Fee-for-Service, FFS, T&V, and Farmer-to-Farmer Extension) in South Asia and sub-Saharan Africa and their impact. The adoption rate of SAP indicators (low, tardy, medium, and abandonment), as revealed in the reviewed literature, was employed in this study to assess the impact of the extension models in the regions under review.
exclusion criteria and study delimitation
Articles that were not accessible in full text or not published in English were excluded to avoid translation complexity. Furthermore, studies that focused on locations other than South Asia and sub-Saharan Africa, as well as non-conventional agricultural extension models, were excluded. Based on accessible literature on SAPs, the study included the following sub-Saharan Africa countries: Nigeria, Tanzania, Rwanda, Democratic Republic of the Congo, Mozambique, Ethiopia, Zambia, Cameroon, Zimbabwe, Kenya, Malawi, Gambia, Niger, Togo, Uganda, and Namibia.
Figure 1: The Preferred Reporting Items for Systematic Reviews and Meta-Analyses (PRISMA) flow chart.
Bangladesh, India, Nepal, and Pakistan were the countries included in this study from South Asia. Conversely, the study’s publication years span 1997 through 2023.
Limitations of the study
By limiting the review to English language studies, significant findings published in other languages, particularly from locations where the question under study is likely to be extremely relevant, were omitted. This exclusion could translate to a cultural bias, with non-English-speaking countries’ viewpoints, concerns, and interventions being underutilised. Consequently, the study’s findings may not adequately depict the broad spectrum of information available, thereby restricting the findings’ generalisability and feasibility, particularly in non-English-speaking countries.
data analysis
The data utilised in this study were analysed using an exploratory thematic analysis. This anaysis enabled us to synthesise existing literature by identifying and analysing recurring themes or trends amongst SAP studies. Thematic analysis aided in analysing the impacts of various extension models, resulting in a more nuanced and thorough assessment of the existing body of knowledge. Furthermore, as demonstrated in Figure 2, a word cloud analysis enhanced our ability to extract and analyse significant factors that influence the adoption of SAPs amongst smallholder farmers.
r esults and discussions
Factors influencing the adoption of saPs
Given an array of factors that influence the adoption of various combinations of SAPs, policymakers should examine numerous factors when utilising extension models for smallholder farmers to adopt multiple SAPs to ensure that farmers can optimise the benefits of SAPs. A word cloud (Figure 2) was generated to graphically illustrate factors and concepts in the data set influencing adoption of SAPs amongst smallholder farmers in South Asia and sub-Saharan Africa. This visual tool and the reviewed literature effectively aided in summarising and categorising 22 factors that influence the adoption of SAPs, as depicted in Table 1. The factors were classified into five categories: (1) socio-economic, (2) bio-physical, (3) institutional, (4) financial, and (5) technical.
Socio-economic factors
Income, gender, household size, farmers’ experience, and age are positively and significantly correlated with smallholder farmers’ adoption of SAPs.11 19 27 28 According to the findings of Ali9 and Arslan et al.29, education, income, labour availability, and household wealth play a significant part in explaining the adoption of SAPs. Reviewed literature revealed that young farmers are more likely to adopt new technology than older farmers because they are risk-takers and have more years of education. On the other hand, education enhances farmers’ ability to access, comprehend, and use technology-related information, resulting in increased adoption and sustainability of new technologies.30 Additionally, it is evident from the reviewed literature that education and the adoption of SAPs are positively correlated. Based on the type of SAPs, household size has been noted as a determinant in households’ adoption decisions (Table 1).
bio-physical factors
SAPs as depicted in Table 1 are frequently site-specific strategies that are determined by a region’s geography and bio-physical conditions. This implies that bio-physical parameters have a substantial impact on its adoption. Previous studies found characteristics such as household location, agro-ecological zone, and distance from the nearest town or market as crucial and statistically significant in influencing the adoption of SAPs.19,27,31 Locational parameters influence adoption decisions.30 The distance between farms and markets inhibits the adoption of SAPs in developing countries. The adoption rate of SAPs decreases as the distance between the farm and the nearest market increases. Furthermore, in terms of location, Pedzisa et al.30 revealed that agro-ecology has a significant impact on yield and is a primary factor that influences the adoption of SAPs and prolonged use. Farmers in Zambia’s drier regions, for example, adopted conservation agriculture for its water conservation features.20,29
Institutional factors
Membership in a farmers’ group, as well as information and technical advice provided in various training programmes, positively and significantly influences the adoption of SAPs.11,19,27,28 Extension visits coupled with access to input support from non-governmental organisations (NGOs), land tenure stability, and training are all anticipated to have an impact on the adoption of SAPs.28,30,31 Pedzisa et al.30 underscore that extension
Figure 2: A word cloud depicting factors influencing the adoption of sustainable agricultural practices amongst smallholder farmers.
table 1: Categorisation of factors influencing the adoption of sustainable agricultural practices
furnishes farmers with information about the availability and attributes of new technology as well as technical skills for implementing it. According to recently reviewed studies, farmers (both from South Asia and sub-Saharan Africa) who regularly interact with the extension programme, whether through government and NGOs or farmer to farmer, have an optimistic influence on adoption.
Financial factors
The adoption of SAPs, or any technological innovation, necessitates adequate monetary assistance and access to incentives (Table 1). Lack of accessibility to credit is an enormous obstacle to the adoption of SAPs.28 29 For example, credit-constrained farmers may be less inclined to adopt SAPs that need monetary expenditures, such as fertiliser and seed varieties, than SAPs that do not, such as manure or crop rotation.33 The high levels of SAP abandonment are statistically consistent with anecdotal evidence from Zambia, which shows that most “adoption” was based on the anticipation of receiving free inputs, and that after these incentives were no longer given, abandonment occurred.20 29 Therefore, access to credit and incentives through institutional or non-institutional sources is critical to the adoption of SAPs.
technical factors
The technological adoption of ecologically sound agricultural development is a complex subject. Farmers have constantly sought new technologies to lower costs whilst increasing profits or production. The adoption of innovative strategies to improve agricultural sustainability is always dependent on farmers’ knowledge and skills.20 Farmers with easy access to knowledge and advanced technology are highly encouraged to adopt SAPs. Farmers who adopt new technologies and practices generally rely on certain information sources prior to adoption; their decision is influenced by a preference for one source over another or merely a lack of easy access to alternative sources.32 It is therefore imperative to determine which information sources tend to be more effective in prompting adoption.
In line with the aforementioned factors that influence the adoption of SAPs amongst smallholder farmers as illustrated in Table 1, this review delved further into institutional factors, particularly those relating to agricultural extension models.
Conventional agricultural extension models
Fee-for-Service extension models
Private sectors provide the Fee-for-Service extension model, in which farmers pay for extension services to make services more accessible. Generally, farmers hire extension workers to provide particular information and services.34-36
Pros of the model
This model provides current and relevant information to the farmers by establishing a demand-driven extension service platform that is
Access to knowledge Extension services
Access to information Training
Access to technology Farmers’ associations
Land tenure
economical, reliable, and outstanding.34 According to studies conducted in Tanzania by Shausi et al.37, Bangladesh by Ogunmodede et al.38, and Nepal by Paudel et al.39, farmers were eager to pay for agricultural extension services. In Zimbabwe, requiring payment for extension services ensured that these services were delivered to farmers who were genuinely interested in acquiring knowledge and implementing the practices.40
Cons of the model
Research conducted in Zimbabwe by Foti et al.40, as well as in Rwanda and Zambia by Ogunmodede et al.38, found that farmers had a very low interest in Fee-for-Service extension. Additionally, most governments in developing countries tend to oversupply free but ineffective extension services, leading to a lack of willingness, especially amongst smallholder farmers, to pay for commercial extension services.40 Additionally, smallholder farmers are unable to hire services because of their low incomes.10 22 36 This model is more capitalistic, favouring wealthy farmers over others who cannot afford to pay for services. The majority of the farmers targeted for the adoption of SAPs are smallholders who are still battling with breaking the poverty cycle and are unable to pay for extension services, hence impeding the practices’ adoption and diffusion.
Farmer Field Schools
The FFS agricultural extension model emerged during the rice monocropping agricultural era. In the 1980s, Indonesia and the Philippines implemented this approach to spread knowledge-intensive integrated pest management.12 34 FFS are unstructured schools within the farmers’ neighbourhood, schools without a building, and with community-driven training in which a similarly minded group of 20–25 neighbouring farmers meets regularly with instructors amidst the crop and animal cycles.11,14,34,41 Farmers are encouraged to undertake independent research, identify and investigate challenges, and develop solutions.
Pros of the model
The success of FFS in Nigeria is because of farmers’ engagement in identifying their challenges, deciding, testing, and assessing potential solutions.15 Programmes under FFS encourage cost sharing to maintain sustainability as well as promote a sense of ownership and responsibility.10 The earlier study suggests that the FFS model should be prioritised to enhance the dissemination of SAPs aimed at enhancing average crop yields and improving the well-being of farming communities.42 When appropriately integrated, FFS has been found to strengthen supply chain actors, farmers, and agribusiness champions’ behaviour related to climate change adaptation at a lower training cost.43,44
Cons of the model
A myriad of obstacles (Table 2) impedes the implementation of FFS in South Asia and sub-Saharan Africa, notably insufficient exposure of staff to FFS tenets and operations, gender disparities, and a low level of engagement of policymakers.11 13 36 45 In Nigeria, the model’s sustainability
without outside financial backing was a significant obstacle.15 Farmers who complete the FFS have been reported to have little success in disseminating the innovations amongst their neighbours.46 This implies that the strategies for instruction and curriculum need to be rethought to make an impact on the intended users of the innovations being propagated.
training and Visit Model
The T&V extension model has been extensively used as the main technology transfer approach in sub-Saharan Africa and South Asia.14 The model was envisioned to develop a group of extension experts
competent in steering farmers towards increasing productivity and revenue through ideal, viable, and reliable planning.10,13,34,47
Pros of the model
The T&V model was remarkably successful and effective in disseminating Green Revolution technologies in irrigated areas of Asia, particularly India, where farming systems are more homogeneous.12 34 46-48 Furthermore, the T&V model promotes very specific packages and supports farmers to increase production and household incomes.10 According to Davis10, the T&V model improved linkages with research because of its top-down implementation
table 2: Comparative analysis of conventional extension models employed in South Asia and sub-Saharan Africa
Model
Fee-for-Service Demand-driven model
Farmer Field Schools Demand-driven model
Farmers pay for the service
Farmers contract extension officers
Cost-effective
High-quality services
Failure by farmers to pay for the services
Countries
Discovery learning
Direct links between farmers and scientists
Critical thinking and creativity
Cost sharing
High levels of ownership
Intensive training
Participatory
Democratic
Client centred
Community-based learning
Extension staff are not adequately exposed
Lack of coordination at national level
Gender disparities
Low degree of engagement and collaboration with policymakers
Financially unsustainable
Tanzania
Bangladesh
Nepal
Rwanda
Zambia
India
Pakistan
Kenya
Nigeria
DRC
Gambia
Niger
Cameroon
Togo
Uganda
Namibia
Tanzania
Zimbabwe
Kenya
Davis10
Foti et al.40
Shausi et al.37
Ogunmodede et al.38
Paudel et al.39
Brown et al.22
Brown et al.35
Anandajayasekeram et al.13
Davis10
Ferroni and Zhou12
Abdullah et al.42
Ajani and Onwubuya15
Cipriano et al.21
Maulu et al.11
Mapiye et al.14
Anandajayasekeram et al.13
Cunguara and Moder47
Lacks appropriate feedback mechanisms
Increased geographical coverage
Improved linkages with research
Promotes very specific packages
Training and Visit Supply-driven model
Aids farmers to enhance output and income
Extension officers are knowledgeable and updated
Financially unsustainable
Extension agents lack communication skills
Too rigid and costly
One-way information flow
Farmers are passive
Too hierarchical
Gender insensitive
Rwanda
Ethiopia
Cameroon
Nigeria
Mozambique
India
Nepal
Zambia
Tanzania
Davis10
Ferroni and Zhou12
Ekumankama and Anyanwu50
Dhital1
Mitti et al.51
van den Ban and Mkwawa53
Maulu et al.11
Mapiye et al.14
Buehren et al.49
Taye48
table 2 continues on next page
Model Characteristics Strengths
Weaknesses
Farmer-toFarmer Extension
Demand-driven model
Model farmers train and share local information
Low cost and effective
Wide coverage
Improved sustainability and accountability
Inclusive of marginalised farmers
Farmers are active
High credibility
Harness indigenous leadership
Participatory
Principle of voluntarism
Enhanced feedback mechanisms from farmers to extension officers
Model farmers lack communication skills
Conflicts between lead farmers and their followers
Bias in selecting model farmers
Gender imbalance
Inadequate backing from local institutions
Absence of relevant training resources
Limited technical expertise amongst farmers
High expectations from farmers regarding financial and non-financial rewards
High dropout rates amongst participants
strategies and increased geographical coverage, particularly in locations where extension officers were readily available (Table 2).
Cons of the model
Although the T&V model enhanced linkages with research by promoting highly specialised packages, studies revealed that it is unreliable, ineffective, devoid of equity, financially untenable, and ultimately led to many countries being burdened with insurmountable levels of debt.13 34 In India, the withdrawal of the World Bank culminated in long-term financial commitments for state governments.46 In Ethiopia, Kenya, Rwanda, Côte d’Ivoire, Cameroon, and Nigeria, the communication system between contact farmers and the rest of the community did not operate as intended; the model was eventually declared unsatisfactory.10 13 46 49 50
Studies in India by Ferroni and Zhou12 and Zambia by Mitti et al.51 contend that, as a supply-driven system, the T&V model supported ideas developed by researchers, with minimal input from farmers, and genuine technology adopters. Furthermore, it has been argued that in Nepal the model primarily focused on production, neglecting postharvest and agribusiness operations, such as value addition, credit, and marketing; frequent monitoring; and communication infrastructure.1 In Zambia, as highlighted by Mitti et al.51, the model was expensive to operate, inflexible, lacking appropriate feedback mechanisms, gender insensitive, and personnel tended to lack focus. Overall, it is concluded that the T&V model did not fulfil its promises and expectations.12 52 However, the T&V approach could be more effective in Tanzania if it were more participative and demand-driven.53
Farmer-to-Farmer Extension Model
Farmer-to-Farmer Extension (F2FE) is based on the principle of voluntarism, often through establishing a network of farmer promoters and trainers, who are expected to educate and share information with other farmers.54-58 Studies conducted in the Democratic Republic
Countries employing the model
Ethiopia
Zambia
Kenya
Nepal
Zimbabwe
Pakistan
Rwanda
India
Malawi
Uganda
Bangladesh
Cameroon
DRC
Mozambique
Selected references
Hailemichael and Haug54
Kiptot and Franzel56
Scarborough et al.55
Simpson et al.57
Habanyati et al.20
Tessema et al.65
Kiptot et al.59
Kumar Shrestha63
Dube69
Baloch and Thapa67
Sah et al.62
Cipriano et al.21
Brown et al.22
Maulu et al.11
Kansiime et al.58
Meena et al.61
Meena et al.60
Fisher et al.64
Chaudhary et al.66
Martini et al.43
of Congo and Mozambique by Cipriano et al.21 and in Rwanda by Kiptot et al.59 found that, under F2FE, volunteer farmers are recruited, trained, and then mentored by other farmers on improved agricultural practices. Depending on the location, farmer trainers are often known as lead, innovative, volunteer, master, model, or community knowledge workers.11 20 55-57 60 The F2FE model’s popularity was influenced by flaws identified in previous models, such as the engagement of contact farmers in the T&V model.56 The F2FE model is prominent for extension and advisory services in sub-Saharan Africa.57
Pros of the model
When the fundamental principles for extension delivery are upheld, F2FE is an effective model.43 54 56 61 The F2FE has proved to be more viable in regions with strong social assets, minimal social strata, and strong community confidence.54,56,62 Studies highlighted that the F2FE model was cost-effective, had improved the accountability of the local government to the farmers, and enabled marginalised communities who are frequently excluded from mainstream assistance to have greater access to extension services.63 64 In Ethiopia, F2FE was more valuable in farmers’ adoption of SAPs and advocated for the continued use of model farmers in innovation dissemination.65 Model farmers, on the other hand, associate the benefits of their role with an enhanced reputation, personal fulfilment, and the opportunity to receive various incentives.20,54,56,57
Cons of the model
The F2FE model has been proven to be ineffective when model farmers are chosen only on their abilities, without considering their capacity to communicate and transfer their knowledge to others.22,54,56,62,66 Additionally, a study conducted in Pakistan by Baloch and Thapa67 found that an insufficient number of field-based extension workers, each responsible for 2000–2400 households, proved ineffective despite the workers being well equipped with the necessary knowledge. In other circumstances, as
observed in Ethiopia, follower farmers often found it difficult to confidently replicate the practices of model farmers, as technology may remain exclusive or be predominantly utilised by early adopters.54 The lead farmers were in conflict with the farmers under their leadership owing to the incentives benefitted, ultimately prompting others to abandon or not even adopt SAPs.20,68 Ineffective model farmer selection procedures, marginalisation of smallholder farmers, and a lack of widespread support all contribute to F2FE’s failure.54 56 The F2FE model in Nepal lacks a clear pro-poor focus on agricultural extension and decentralisation strategies.63 As a result of some of these identified challenges, a study found that only 43% of the sampled farmers in Zimbabwe utilised the F2FE extension approach, which was below the expected target.69
table 3: Sustainable agricultural practices (SAPs) and their adoption rates
Impact of extension models on the adoption of saPs
The central focus of extension services is the adoption of technologies and improved practices like SAPs. In agricultural extension programmes, the acquired knowledge and information is an output, whereas the adoption of technologies is an outcome and the ultimate impact is the change in productivity.48 The reviewed agricultural extension models have been employed to promote SAPs to farmers. The T&V and F2FE models are amongst the most dominant and frequently utilised extension models, and their degree of success varies depending on the context (Table 3 and Figure 3). The adoption rates of SAPs are predominantly classified as “Low (small proportion of farmers adopting in a given area)” in all selected nations, with occasional instances of “Low and Country
Nigeria Improved seed varieties
Tanzania Soil and water conservation technologies
Rwanda Terraces
DRC Conservation agriculture
Mozambique Conservation agriculture
Ethiopia Organic farming
Zambia Conservation agriculture
Cameroon Agroforestry
Pakistan Climate-smart agriculture
Nepal Climate-resilient technologies
India Organic farming
Zimbabwe Conservation agriculture
Kenya Agroforestry
Bangladesh Organic farming
Malawi Conservation agriculture
Oyetunde-usman et al.19
Training & Visit
Fee-for-Service
Training
Fee-for-Service
Farmer-to-Farmer Extension
Fee-for-Service
Training & Visit
Farmer-to-Farmer Extension
Tenge et al.16
Hammond et al.72
Nahayo et al.28
Cipriano et al.21
Nkala et al.18
Cipriano et al.21
Teklewold et al.33
Habanyati et al.20
Arslan et al.74
Ng’ombe et al.31
Nkomoki et al.73
Nkamleu and Manyong27
Mazhar et al.70
Kumar et al.32
Singh and Sharma77
Brown et al.35
Chaudhary et al.66
Pedzisa et al.30
Mwaura et al.71
Sarker and Yoshihito75
Extension Fisher et al.64
3: Dominant extension models utilised in the sampled countries: Farmer-to-Farmer Extension (F2FE), Training and Visit (T&V), Farmer Field Schools (FFS) and Fee-for-Service.
tardy (delayed beyond the right or expected time)”, “Medium” adoption, or “Abandonment”. Notwithstanding their benefits, profound global concerns, and the desire to achieve the Sustainable Development Goals by 2030, the adoption rate and extensive utilisation of SAPs are still low in rural regions of developing countries.17 31 33 41 68 70 The T&V model is supply-driven and enables wider geographical coverage and research links, but it has been criticised for being economically untenable, restrictive, and gender-insensitive. The T&V model, as indicated in Table 2 and Figure 3, is prominent in Nigeria, Mozambique, Ethiopia, Cameroon, Tanzania, Zambia, and Kenya, where the adoption rates of SAPs remain low with abandonment being experienced (Figure 4), most likely because of these constraints. Research in Nigeria by Oyetunde-usman et al.19 found that despite the utilisation of the T&V model, the adoption of SAPs (improved seed varieties) was low (14%). The primary cause of low adoption of SAPs (agroforestry) in Kenya is a lack of knowledge regarding farmers’ adopting behaviour towards the
technique.71 Similarly, the SAPs (agroforestry) were not widely adopted in Cameroon, where the T&V model has been in use for many years.27
The F2FE model is demand-driven, cost-effective, leverages local leadership, optimises sustainability, and is broadly inclusive, enabling lead farmers to train their peers in their farming zones (see Table 2). However, constraints such as bias in recruiting lead farmers, contentions between trainers and trainees, insufficient training resources, and high dropout rates thwart its impact. These shortcomings are prevalent in countries such as Ethiopia, Zambia, Kenya, Nepal, Zimbabwe, Pakistan, Malawi, and Rwanda, where F2FE is employed but adoption rates of SAPs remain low with abandonment being experienced in some countries (see Table 3 and Figure 4). Farmers in Rwanda expressed concern about the inadequate availability of extension services and practical knowledge to sustain them, resulting in low adoption rates of SAPs (terrace).28 72 In Ethiopia, Teklewold et al.33 noted that the adoption rates of SAPs remained lower than expected.
Figure
Figure 4: Adoption rates of sustainable agricultural practices per country.
Although conservation agriculture holds great potential, its adoption by farmers in Malawi remains low, and some basin-based conservation agriculture abandonment has been documented.64
As depicted in Table 2, the Fee-for-Service model is demand-driven and efficient in influencing smallholder farmers’ adoption of SAPs. However, because of the fact that it entails farmers to pay for advisory services, many smallholder farmers cannot afford it, limiting its impact. This underscores why, despite the availability of this model, the adoption of SAPs remains low in countries such as Pakistan, Bangladesh, Zambia, Rwanda, Zimbabwe, and Tanzania, as highlighted in Table 3 and Figure 4 Research conducted in Zambia revealed low adoption rates of SAPs (conservation agriculture) despite being promoted for over 15 years.20 31 73 74 Similarly, in Tanzania, Tenge et al.16 reported that notwithstanding the usage of T&V and Fee-for-Service model, the adoption rate of SAPs (conservation of soil and water) is low, and soil erosion persists as a threat. Regardless of the national promotion of SAPs (organic farming), the idea of SAPs was new to Bangladesh farmers, and adoption rates remained low.75
Unfortunately, in Zambia, despite the utilisation of the Fee-for-Service model, Habanyati et al.20 and Arslan et al.74 found that there were high levels of abandonment (around 95%) of SAPs amongst smallholder farmers, with anecdotal evidence indicating that most “adoption” was in anticipation of receiving free inputs and that once these incentives were no longer delivered, abandonment occurred. Pedzisa et al.30 observed significant levels of conservation agriculture abandonment in Zimbabwe amidst the utilisation of the Fee-for-Service model, arguing that such abandonment does not occur in conventional agriculture. Brown et al.’s22 study in Africa showed that many farmers adopt conservation agriculture because they have a mindset that they will receive some incentives to do that. But when the perceived incentives are not provided, they underperform. A significant number of respondents depended on project support to implement conservation agriculture-based sustainable intensification.66 However, their adoption of this approach ceased when the support was withdrawn.
The FFS model emphasises discovery learning, community involvement, and farmer-led training (see Table 2). It fosters farmers to critical thinking and problem-solving. However, significant barriers exist, including financial unsustainability, gender inequality, and a lack of policy support. These oversights related to the FFS help explain the low adoption rates of SAPs, notwithstanding its widespread use in Pakistan, Kenya, Nigeria, and the Democratic Republic of the Congo (see Table 3 and Figure 4). The SAPs have been promoted through FFS in the Democratic Republic of the Congo and Mozambique, notably through conservation agriculture; nevertheless adoption rates are low.21 22 Despite the benefits of conservation agriculture, its adoption in Mozambique has been tardy and low because of farmers’ lack of vital skills, knowledge, and equipment, as well as inadequate extension services and poverty.18
The quest for the widespread adoption of SAPs (climate-smart agriculture) was found to be complicated in Pakistan.70 In Nepal, Kumar et al.32 found that the United States Agency for International Development (USAID)-led Knowledge-Based Integrated Sustainable Agriculture in Nepal (KISAN) recipient farmers adopted SAPs (climate-resilient technologies) instead of KISAN non-beneficiary farmers. SAPs (organic farming) are progressively more widespread with low-to-medium adoption and are stable in India.2,76,77 However, smallholder farmers continue to cultivate less than 1 ha of land under SAPs.76 Similarly, a study in Zambia by Habanyati et al.20 revealed that smallholder farmers who had adopted conservation agriculture were cultivating tiny portions of land whilst larger portions were under conventional agriculture. This scenario is a reflection of imperfections identified in the extension models implemented in these particular countries. The research results reveal that no specific extension model is adequate on its own, and that to generate impactful adoption rates of SAPs across the selected regions, a more integrative and contextualised strategy is imperative.
strategies to enhance adoption rates of saPs amongst smallholder farmers
To enhance the adoption of SAPs amongst smallholder farmers, a holistic strategy is essential, addressing financial, educational, biophysical,
technological, social, and institutional constraints. Governments and nonprofit development institutions ought to invest in resources and facilities to assist extension workers. This entails allocating financial resources, demonstration trials, as well as training infrastructure to enhance the efficacy and impact of extension services, which are vital in fostering both traditional and new SAPs.30 Kumar et al.32 emphasise that extension services should prioritise education, access to resources, financial support, interpersonal relationships, climate awareness, and tailored techniques. Education has been found to significantly impact the adoption of SAPs by improving farmers’ knowledge and capacity to effectively execute new practices.19,30
Local agricultural communities’ distinctive needs and circumstances should be taken into consideration whilst designing extension services. Extension programmes should emphasise farmer-centred capacity building by showcasing the efficacy of SAPs10,46 through collaborative learning networks, FFS, and on-farm demonstrations. Real-time information on climate-smart practices, soil health management, and organic farming methods can also be provided via digital extension channels, including social media platforms, SMS alerts, community radio shows, and mobile applications.9 Enhancing the involvement of women and youths in agricultural extension can also lead to greater adoption rates, guaranteeing that sustainable developments benefit all segments of the farming community. Extension services can significantly improve smallholder farming systems’ viability and productivity by tackling these issues. By assisting smallholder farmers in overcoming market obstacles, financial limitations, and knowledge gaps, these extension initiatives can eventually increase the adoption rates of SAPs.
Conclusions
Our findings reveal that the adoption rates of SAPs amongst smallholder farmers are typically low across the selected countries, except for organic farming and climate-resilient practices, which exhibit medium adoption rates. This demonstrates that the extension models employed in the selected countries have not had the anticipated impact. Notwithstanding the noted shortcomings with the extension models, the T&V and the F2FE are the most dominant and extensively utilised in South Asia and sub-Saharan Africa. Models such as Fee-for-Service, FFS, T&V, and F2FE have shown variable success but often fall short of the transformative impacts in disseminating SAPs. Persistently low adoption rates and frequent abandonment of SAPs underscore the need for a more integrated and context-sensitive approach to extension services. To overcome these challenges, it is essential to combine conventional extension models with innovative, participatory, and demand-driven approaches. Enhancing the participatory nature of the FFS model by involving farmers can increase their relevance and effectiveness. Policymakers and practitioners should prioritise the development of extension strategies that are economically viable and tailored to the specific needs and constraints of smallholder farmers. This includes fostering greater engagement from policymakers, enhancing communication channels, and implementing robust feedback mechanisms to ensure that extension services are responsive and adaptable.
Acknowledgements
We extend our gratitude to the Amrita Live-in-Labs® academic programme for providing support.
Funding
This work was funded by the E4LIFE International PhD Fellowship Program offered by the Amrita Vishwa Vidyapeetham university.
Data availability
The data supporting the results of this study are available upon request to the corresponding author.
Declarations
We have no competing interests to declare. We have no AI or LLM use to declare.
Authors’ contributions
E.J.H.: Conceptualisation, literature search, methodology, writing –original draft, writing – review and editing. S.P.: Conceptualisation, writing –review and editing, supervision. Both authors read and approved the final manuscript.
r eferences
1. Dhital PR. Agricultural extension in Nepal: Experiences and issues. J Adv Agric. 2017;7:1071–1082. https://doi.org/10.24297/jaa.v7i3.6287
2. FiBL, IFOAM. The world of organic agriculture: Statistics and emerging trends. Bonn: Organic Basics; 2022.
3. Cook BR, Satizábal P, Curnow J. Humanising agricultural extension: A review. World Dev. 2021;140, Art. #105337. https://doi.org/10.1016/j.worlddev.2 020.105337
4. Singh AK, Dubey SK, Sah U, Singh L. Temporal adaptation of agricultural extension systems in India. Curr Sci. 2016;110:1169–1177. Available from: https://www.jstor.org/stable/24908005
5. Kassie M, Zikhali P, Pender J, Köhlin G. Organic farming technologies and agricultural productivity: The case of semi-arid Ethiopia. Working Papers in Economics 334. Gothenburg: School of Business, Economics and Law, University of Gothenburg; 2008. http://hdl.handle.net/2077/18888
6. Landmann D, Lagerkvist CJ, Otter V. Determinants of small-scale farmers’ intention to use smartphones for generating agricultural knowledge in developing countries: Evidence from rural India. Eur J Dev Res. 2021; 33:1435–1454. https://doi.org/10.1057/s41287-020-00284-x
7. Haworth BT, Biggs E, Duncan J, Wales N, Boruff B, Bruce E. Geographic information and communication technologies for supporting smallholder agriculture and climate resilience. Climate. 2018;6(4), Art. #97. https://do i.org/10.3390/cli6040097
8. Silvestri S, Richard M, Edward B, Dharmesh G, Dannie R. Going digital in agriculture: How radio and SMS can scale-up smallholder participation in legume-based sustainable agricultural intensification practices and technologies in Tanzania. Int J Agric Sustain. 2021;19:583–594. https://do i.org/10.1080/14735903.2020.1750796
9. Ali J. Factors affecting the adoption of information and communication technologies (ICTs) for farming decisions. J Agric Food Inf. 2012;13:78–96. https://doi.org/10.1080/10496505.2012.636980
10. Davis KE. Extension in sub-Saharan Africa: Overview and assessment of past and current models, and future prospects. J Int Agric Ext Educ. 2008;15:15–28.
11. Maulu S, Hasimuna OJ, Mutale B, Mphande J, Siankwilimba E. Enhancing the role of rural agricultural extension programs in poverty alleviation: A review. Cogent Food Agric. 2021;7, Art. #1886663. https://doi.org/10.1080/23311 932.2021.1886663
12. Ferroni M, Zhou Y. Achievements and challenges in agricultural extension in India. Glob J Emerg Mark Econ. 2012;4:319–346. https://doi.org/10.1177/0 974910112460435
13. Anandajayasekeram P, Puskur R, Workneh S, Hoekstra D. Concepts and practices in agricultural extension in developing countries: A source book. Washington, DC / Nairobi: IFPRI / ILRI; 2008.
14. Mapiye O, Makombe G, Molotsi A, Dzama K, Mapiye C. Towards a revolutionized agricultural extension system for the sustainability of smallholder livestock production in developing countries: The potential role of ICTs. Sustainability. 2021;13, Art. #5868. https://doi.org/10.3390/su13115868
15. Ajani E, Onwubuya E. Farmer Field School (FFS) and Junior Farmer Field and Life School (JFFLS) as challenges to agricultural extension development and practice in Nigeria. J Agric Ext. 2010;14:53–61. https://doi.org/10.4314/jae .v14i1.64069
16. Tenge AJ, De Graaff J, Hella JP. Social and economic factors affecting the adoption of soil and water conservation in West Usambara Highlands, Tanzania. Land Degrad Dev. 2004;15:99–114. https://doi.org/10.1002/ldr.606
17. Kassie M, Jaleta M, Shiferaw B, Mmbando F, Mekuria M. Adoption of interrelated sustainable agricultural practices in smallholder systems: Evidence from rural Tanzania. Technol Forecast Soc Change. 2013;80:525–540. https://doi.org/10.1016/j.techfore.2012.08.007
18. Nkala P, Mango N, Zikhali P. Conservation agriculture and livelihoods of smallholder farmers in Central Mozambique. J Sustain Agric. 2011;35:757–779. https://doi.org/10.1080/10440046.2011.606492
19. Oyetunde-usman Z, Olagunju KO, Ogunpaimo OR. Determinants of adoption of multiple sustainable agricultural practices among smallholder farmers in Nigeria. Int Soil Water Conserv Res. 2021;9:241–248. https://doi.org/10.10 16/j.iswcr.2020.10.007
20. Habanyati EJ, Nyanga PH, Umar BB. Factors contributing to disadoption of conservation agriculture among smallholder farmers in Petauke, Zambia. Kasetsart J Soc Sci. 2018;41:6–11. https://doi.org/10.1016/j.kjss.2018.0 5.011
21. Cipriano IM, Onautsu DO, Tarassoum TD, Adejumobi II, Bolakonga BA. Uptake of conservation agriculture technology through farmer field schools in the Democratic Republic of Congo and Mozambique. J Agric Ext. 2022;26:44–58. https://doi.org/10.4314/jae.v26i1.6
22. Brown B, Nuberg I, Llewellyn R. Constraints to the utilisation of conservation agriculture in Africa as perceived by agricultural extension service providers. Land Use Policy. 2018;73:331–340. https://doi.org/10.1016/j.landusepol.2 018.02.009
23. Jack K. Constraints on the adoption of agricultural technologies in developing countries. J Agric Technol Adoption Initiative, Boston, J-PAL (MIT) and CEGA (UC Berkeley). 2013;15:250–260.
24. Faúndez M, Alcayaga H, Walters J, Pizarro A, Soto-Alvarez M. Sustainability of water transfer projects: A systematic review. Sci Total Environ. 2023;860, Art. #160500. https://doi.org/10.1016/j.scitotenv.2022.160500
25. Bahinipati CS, Kumar V, Viswanathan PK. An evidence-based systematic review on farmers’ adaptation strategies in India. Food Secur. 2021;13:399–418. https://doi.org/10.1007/s12571-020-01139-3
26. Dandadzi P, Kothurkar NK. Assessing the sustainability of biosand filters: Unveiling interlinkages and leveraging factors for effective implementation. Environ Sustain Indic. 2023;20, Art. #100311. https://doi.org/10.1016/j.in dic.2023.100311
27. Nkamleu GB, Manyong VM. Factors affecting the adoption of agroforestry practices by farmers in Cameroon. Small-scale For Econ Manag Policy. 2005;4:135–148. https://doi.org/10.1007/s11842-005-0009-6
28. Nahayo A, Pan G, Joseph S. Factors influencing the adoption of soil conservation techniques in Northern Rwanda. J Plant Nutr Soil Sci. 2016; 179:367–375. https://doi.org/10.1002/jpln.201500403
29. Arslan A, McCarthy N, Lipper L, Asfaw S, Cattaneo A. Adoption and intensity of adoption of conservation farming practices in Zambia. Agric Ecosyst Environ. 2013;187:72–86. https://doi.org/10.1016/j.agee.2013.08.017
30. Pedzisa T, Rugube L, Winter-nelson A, Baylis K, Mazvimavi K. Abandonment of conservation agriculture by smallholder farmers in Zimbabwe. J Sustain Dev. 2015;8:69–82. https://doi.org/10.5539/jsd.v8n1p69
31. Ng’ombe J, Kalinda T, Tembo G, Kuntashula E. Econometric analysis of the factors that affect adoption of conservation farming practices by smallholder farmers in Zambia. J Sustain Dev. 2014;7:124–138. https://doi.org/10.5539 /jsd.v7n4p124
32. Kumar A, Takeshima H, Thapa G, Adhikari N, Saroj S, Karkee M, et al. Adoption and diffusion of improved technologies and production practices in agriculture: Insights from a donor-led intervention in Nepal. Land Use Policy. 2020;95, Art. #104621. https://doi.org/10.1016/j.landusepol.2020.104621
33. Teklewold H, Kassie M, Shiferaw B. Adoption of multiple sustainable agricultural practices in rural Ethiopia. J Agric Econ. 2013;64:597–623. http s://doi.org/10.1111/1477-9552.12011
34. Olayemi SS, Ope-Oluwa AA, Whiteley AC. Evolution of agricultural extension models in sub-Saharan Africa: A critical review. Int J Agric Ext Rural Dev Stud. 2021;8:29–51.
35. Brown B, Samaddar A, Singh K, Leipzig A, Kumar A, Kumar P, et al. Understanding decision processes in becoming a fee-for-hire service provider: A case study on direct seeded rice in Bihar, India. J Rural Stud. 2021;87:254–266. https://doi.org/10.1016/j.jrurstud.2021.09.025
36. Anderson JR, Feder G. Agricultural extension: Good intentions and hard realities. World Bank Res Obs. 2004;19:41–60. https://doi.org/10.1093/wb ro/lkh013
https://doi.org/10.17159/sajs.2025/20578
37. Shausi GL, Ahmad AK, Abdallah JM. Factors determining crop farmers willingness to pay for agricultural extension services in Tanzania: A case of Mpwapwa and Mvomero Districts. J Agric Ext Rural Dev. 2019;11:239–247. https://doi.org/10.5897/JAERD2019.1097
38. Ogunmodede AM, Tambo JA, Adeleke AT, Gulak DM, Ogunsanwo MO. Farmers’ willingness to pay towards the sustainability of plant clinics: Evidence from Bangladesh, Rwanda and Zambia. Int J Agric Sustain. 2022;20:1360–1372. https://doi.org/10.1080/14735903.2022.2082018
39. Paudel GP, Khanal AR, Rahut DB, Krupnik TJ, McDonald AJ. Smart precision agriculture but resource constrained farmers: Is service provision a potential solution? Farmer’s willingness to pay for laser-land leveling services in Nepal. Smart Agric Technol. 2023;3, Art. #100084. https://doi.org/10.1016/j.atec h.2022.100084
40. Foti R, Nyakudya I, Moyo M, Chikuvire J, Mlambo N. Determinants of farmer demand for “Fee-for-Service” extension in Zimbabwe: The case of Mashonaland Central province. J Int Agric Ext Educ. 2007;14:95–104. https: //doi.org/10.5191/jiaee.2007.14108
41. Norton GW, Alwang J. Changes in agricultural extension and implications for farmer adoption of new practices. Appl Econ Perspect Policy. 2020;42:8–20. https://doi.org/10.1002/aepp.13008
42. Abdullah M, Li C, Xia J, Li S, Ghazanfar S, Mehmood Y, et al. Effectiveness comparison between the farmers field school and the training & visit approaches of agricultural extension in two districts of Pakistan. Am-Eurasian J Agric Environ Sci. 2014;14:33–39.
43. Martini E, Pagella T, Mollee E, van Noordwijk M. Relational values in locally adaptive farmer-to-farmer extension: How important? Curr Opin Environ Sustain. 2023;65, Art. #101363. https://doi.org/10.1016/j.cosust.2023.101363
44. Kassem HS, Alotaibi BA, Muddassir M, Herab A. Factors influencing farmers’ satisfaction with the quality of agricultural extension services. Eval Program Plann. 2021;85, Art. #101912. https://doi.org/10.1016/j.evalprogplan.202 1.101912
45. Feder G, Murgai R, Quizon JB. Sending farmers back to school: The impact of farmer field schools in Indonesia. Rev Agric Econ. 2004;26:45–62. https://d oi.org/10.1111/j.1467-9353.2003.00161.x
46. Eicher CK. Agricultural extension in Africa and Asia. Agric Econ. 2007; 7431:1–9.
47. Cunguara B, Moder K. Is agricultural extension helping the poor? Evidence from rural Mozambique. J Afr Econ. 2011;20:562–595. https://doi.org/10. 1093/jae/ejr015
48. Taye H. Evaluating the impact of agricultural extension programmes in subSaharan Africa: Challenges and prospects. Afr Eval J. 2013;1(1), Art. #a19. https://doi.org/10.4102/aej.v1i1.19
49. Buehren N, Goldstein M, Molina E, Vaillant J. The impact of strengthening agricultural extension services: Evidence from Ethiopia. Policy Research Working Paper WPS8169. Open Knowledge Repository. 2017. https://doi.or g/10.1596/1813-9450-8169
50. Ekumankama OO, Anyanwu AC. Evaluation of the job performance of extension professionals in Abia State of Nigeria. J Agric Food Sci. 2007;5:93–109. https://doi.org/10.4314/jafs.v5i1.41652
51. Mitti G, Drinkwater M, Kalonge S. Experimenting with agricultural extension in Zambia: Care’s Livingstone food security project. Network Paper –Agricultural Administration (Research and Extension) Network (United Kingdom) Issue 77. London: Overseas Development Institute (ODI); 1997.
52. Aker JC. Dial ‘A’ for agriculture: A review of information and communication technologies for agricultural extension in developing countries. Agric Econ. 2011;42:631–647. https://doi.org/10.1111/j.1574-0862.2011.00545.x
53. van den Ban AW, Mkwawa DS. Towards a participatory and demand-driven training and visit (T&V) agricultural extension system: A case of Tanzania. Eur J Agric Educ Ext. 1997;4:117–123. https://doi.org/10.1080/13892249 785300221
54. Hailemichael S, Haug R. The use and abuse of the ‘model farmer’ approach in agricultural extension in Ethiopia. J Agric Educ Ext. 2020;26:465–484. https://doi.org/10.1080/1389224X.2020.1757475
55. Scarborough V, Killough S, Johnson DA, Farrington J. Farmer-led-extension: Concepts and practices. London: Intermediate Technology Publications; 1997.
56. Kiptot E, Franzel S. Farmer-to-farmer extension: Opportunities for enhancing performance of volunteer farmer trainers in Kenya. Dev Pract. 2015;25:503–517. https://doi.org/10.1080/09614524.2015.1029438
57. Simpson BM, Franzel S, Degrande A, Kundhlande G, Tsafack S. Farmer to farmer extension: Issues in planning and implementation. Technical note. Urbana, IL: Modernizing Extension and Advisory Services (MEAS), University of Illinois; 2015.
58. Kansiime MK, Alawy A, Allen C, Subharwal M, Jadhav A, Parr M. Effectiveness of mobile agri-advisory service extension model: Evidence from Direct2Farm program in India. World Dev Perspect. 2019;13:25–33. https://doi.org/10.1 016/j.wdp.2019.02.007
59. Kiptot E, Franzel S, Nzigamasabo P, Ruganirwa C. Farmer-to-farmer extension of livestock feed technologies in Rwanda: A survey of volunteer farmer trainers and organizations. ICRAF Working Paper no. 221. Nairobi: World Agroforestry Centre; 2016. https://doi.org/10.5716/WP16005.PDF
60. Meena MS, Kale RB, Singh SK. Lead farmer based farmer to farmer extension model: SWOT analysis and sustainability issues in Indian context. In: Soni NV, Patel JB, Makwan AR, Patel DD. Souvenir: Proceedings of the National Seminar on Extension Strategies for Doubling Income for Livelihood Security; 2018 April 26–27; Anand, India. Anand: Directorate of Extension Education, Anand Agricultural University; 2018. p. 53–61.
61. Meena MS, Kale RB, Singh SK, Gupta S. Farmer-to-farmer extension model: Issues of sustainability & scalability in Indian perspective. ISEE Natl Semin. 2016:78–83.
62. Sah U, Singh SK, Pal J. Farmer-to-farmer extension (F2FE) approach for speedier dissemination of agricultural technologies: A review. Indian J Agric Sci. 2021;91:1419–1425. https://doi.org/10.56093/ijas.v91i10.117403
63. Kumar Shrestha S. Decentralizing the farmer-to-farmer extension approach to the local level. World J Sci Technol Sustain Dev. 2014;11:66–77. https://doi.o rg/10.1108/WJSTSD-08-2013-0028
64. Fisher M, Holden ST, Thierfelder C, Katengeza SP. Awareness and adoption of conservation agriculture in Malawi: What difference can farmer-to-farmer extension make? Int J Agric Sustain. 2018;16:310–325. https://doi.org/10.1 080/14735903.2018.1472411
65. Tessema MY, Asafu-Adjaye J, Kassie M, Mallawaarachchi T. Do neighbours matter in technology adoption? The case of conservation tillage in northwest Ethiopia. Afr J Agric Resour Econ. 2016;11:211–225.
66. Chaudhary A, Timsina P, Karki E, Sharma A, Suri B, Sharma R, et al. Contextual realities and poverty traps: Why South Asian smallholder farmers negatively evaluate conservation agriculture. Renew Agric Food Syst. 2023;38, Art. #e13. https://doi.org/10.1017/S1742170523000066
67. Baloch MA, Thapa GB. The effect of agricultural extension services: Date farmers’ case in Balochistan, Pakistan. J Saudi Soc Agric Sci. 2018;17:282–289. https://doi.org/10.1016/j.jssas.2016.05.007
68. Brown B, Llewellyn R, Nuberg I. Why do information gaps persist in African smallholder agriculture? Perspectives from farmers lacking exposure to conservation agriculture. J Agric Educ Ext. 2018;24:191–208. https://doi.o rg/10.1080/1389224X.2018.1429283
69. Dube L. Farmer to farmer extension approach: Analysis of extent of adoption by smallholder farmers in Manicaland and Masvingo provinces of Zimbabwe. J Agric Econ Rural Dev. 2017;3:149–160.
70. Mazhar R, Ghafoor A, Xuehao B, Wei Z. Fostering sustainable agriculture: Do institutional factors impact the adoption of multiple climate-smart agricultural practices among new entry organic farmers in Pakistan? J Clean Prod. 2021;283, Art. #124620. https://doi.org/10.1016/j.jclepro.2020.124620
71. Mwaura GG, Kiboi MN, Bett EK, Mugwe JN, Muriuki A, Nicolay G, et al. Adoption intensity of selected organic-based soil fertility management technologies in the Central Highlands of Kenya. Front Sustain Food Syst. 2021;4:1–17. https://doi.org/10.3389/fsufs.2020.570190
72. Hammond J, Rosenblum N, Breseman D, Gorman L, Manners R, van Wijk MT, et al. Towards actionable farm typologies: Scaling adoption of agricultural inputs in Rwanda. Agric Syst. 2020;183, Art. #102857. https://doi.org/10.1 016/j.agsy.2020.102857
73. Nkomoki W, Bavorová M, Banout J. Adoption of sustainable agricultural practices and food security threats: Effects of land tenure in Zambia. Land Use Policy. 2018;78:532–538. https://doi.org/10.1016/j.landusepol.2018.0 7.021
https://doi.org/10.17159/sajs.2025/20578
74. Arslan A, McCarthy N, Lipper L, Asfaw S, Cattaneo A. Adoption and intensity of adoption of conservation farming practices in Zambia. Agric Ecosyst Environ. 2014;187:72–86. https://doi.org/10.1016/j.agee.2013.08.017
75. Sarker A, Yoshihito I. Information sources used by the farmers regarding practice of organic farming: A study from Bangladesh. J Rural Probl. 2007;43:234–239. https://doi.org/10.7310/arfe1965.43.234
76. All India Network Programme on Organic Farming (AI-NPOF). Annual report 2020-2021 [document on the Internet]. New Delhi: National Centre for Organic and Natural Farming; 2021. Available from: https://nconf.dac.gov.i n/AnnualReport
77. Singh B, Sharma AK. Factors affecting adoption of organic farming technology in arid zone. Ann Arid Zone. 2019;58:1–5.
AuthorS: Tim Fry1
Aldo Stroebel2
Sarah Cardey1
AFFILIAtIoNS:
1School of Agriculture, Policy and Development, University of Reading, Reading, UK
2Research, Innovation and Internationalisation Office, University of Mpumalanga, Mbombela, South Africa
CorrESPoNDENCE to: Tim Fry
EMAIL: t.j.fry@pgr.reading.ac.uk
DAtES:
r eceived: 28 June 2024
r evised: 27 Mar. 2025
Accepted: 10 Apr. 2025
Published: 11 Aug. 2025
hoW to CItE: Fry T, Stroebel A, Cardey S. A structural–functional diagnostic of Mpumalanga’s agricultural education and training system. S Afr J Sci. 2025;121(7/8), Art. #18996. https:// doi.org/10.17159/sajs.2025/18996
ArtICLE INCLuDES:
☒ Peer review
☐ Supplementary material
DAtA AVAILAbILItY:
☐ Open data set
☐ All data included
☐ On request from author(s)
☒ Not available
☐ Not applicable
EDItorS:
Annchen Mielmann
Leslie Swartz
KEYWorDS: Agricultural Innovation System (AIS), Agricultural Education and Training (AET), structural–functional, agricultural innovation, transdisciplinary curricula
FuNDING:
South African National Research Foundation, South African Agricultural Research Council
A structural–functional diagnostic of Mpumalanga’s agricultural education and training system
Increasing capabilities are required to develop solutions to wicked problems whilst the economic, environmental, and social contexts of farming have become more turbulent. There is a growing focus on developing systemic capabilities that enable the identification, development, and scaling of shared solutions. This requires a cohesive agricultural education and training (AET) system that identifies needs of entire food systems and delivers responsive pedagogies that combine learning sources. However, South Africa’s AET system remains in dire need of governance reform directed towards greater integration. This study investigates the performance of the AET system in the Mpumalanga Province, South Africa, utilising an agricultural innovation system (AIS) lens to identify where there are absent or poor-quality infrastructures and interactions, and cognitive, regulatory, and normative institutions that hinder AET-system performance. Evaluations of AET-supportive innovation structures were coupled with articulations of innovation functions that support transdisciplinary demand articulation, knowledge co-development, and networking. Results highlight an absence of communication and coordination mechanisms, hindering vertical and horizontal interactions between multi-actor groups. This absence contributes to a disenabling environment for AET-supportive networking, facilitation, and brokerage, leading to missed opportunities to facilitate between food system actors and AET providers to develop transdisciplinary research and pedagogies that harness diverse knowledge, resources, and networks to maximise impact. Whilst there are industry-led needs assessment structures, these operate in silos and lack public sector engagement that could enable organisations with complementary mandates, knowledge, and infrastructures to respond to common priorities.
Significance:
This paper advances scholarly interests in South African agriculture by applying an AIS-diagnostic lens to evaluate Mpumalanga’s AET system to identify systemic blockages that hinder multi-actor collaboration within Mpumalanga’s citrus and maize subsystems. This research goes beyond previous studies that focus on local-level agriculture, the influence of extension officers, or commodity-specific insights. Further, most agricultural studies in Mpumalanga focus on linear-modelled developmental pathways, whilst this study extends research by evaluating how multi-actor access and capabilities influence outcomes and the development of disenabling or enabling environments for AET in Mpumalanga.
Introduction
Increasing individual, organisational, and systemic capabilities to develop solutions to wicked problems are required as the economic, environmental, and social contexts of farming have become more turbulent.1 2 In response, there is a growing focus on developing systemic capabilities that enable the identification, development, and scaling of shared solutions.3 A primary way in which such dynamic capabilities are developed are through agricultural education and training (AET) and research systems. Whilst there are shifts towards participatory and systemic approaches to addressing food system challenges, the South African state-led AET system has changed little since its establishment, part of the ongoing legacy of colonialism. Poorly integrated AET, paradigms of linear technology transfer, diminishing budgets, and outdated curricula have contributed to South African AET being unable to replicate the performance of similar state-led systems.4 5 Whilst paradigms of linear transfer of technologies remain prevalent in South Africa6, there is growing momentum to integrate agricultural innovation system (AIS) theories and practices into AET, driven by an understanding that solving wicked problems requires integrated approaches7 that include diverse knowledge bases and forms of learning8-10. AET systems need to operate in an integrated manner to address systemic problems that contain multiple root causes, each with context-specific and multilevel drivers, including sectoral and spatial path dependencies and vulnerabilities.11,12 The complex and contested nature of agricultural systems requires integrated AET services that diagnose and respond to multidimensional challenges that have developed through and reinforce food system vulnerabilities.13
Responsive, complexity-aware AET should utilise an AIS len to identify opportunities to co-develop solutions to unpredictable yet recognisable challenges.14 The systemic perspectives within AIS allow for an understanding of interdependent networks that affect nonlinear innovation processes.15,16 This is vital to ensuring AET curricula and pedagogies capitalise on the multitude of learning environments within Mpumalanga and continuously adapt AET to multistakeholder needs and priorities.17-19 The design of multidimensional AET recognises that sustainable and transformative developmental outcomes cannot be predicted by understanding the attitudes or behaviours of individuals20, posing challenges to historic modes of food system governance built around top-down policymaking and solely technological solutions21
This paper supports the functioning of Mpumalanga’s AET system by identifying systemic blockages that hinder multistakeholder collaboration, critically identifying shared and interdependent aims, capabilities, and challenges.
Research Article
https://doi.org/10.17159/sajs.2025/18996
This research goes beyond previous research on agricultural systems in Mpumalanga, which has predominantly focused on farming at local levels22-25, the role of extension officers as change agents26,27, or commodity-specific insights. Further, the majority of agricultural studies undertaken within Mpumalanga24 27 28 have used a linear-developmental lens. As such, this study extends current research by providing an AIS lens through which to evaluate the disenabling or enabling environments for AET in Mpumalanga and contributing to theoretical development in AIS studies.
Structural–functional framework
This study’s systemic focus requires a framework that incorporates diverse knowledge centres whilst identifying stakeholder-specific constraints and opportunities.29,30 Building on methodological frameworks developed in diagnostic AIS work9,17,31, this structural–functional framework enables the mapping of AIS structures to provide a basis from which to identify elements that cause weakness or deficiencies in AIS functions30
structural framework
The framework considers four key AIS structural components:
1. Actors: individuals and organisations learning and putting into use new ways and methods of working.32 33
2. Institutions: shared habits and routines used by actors organised by repetitive rules, norms, and strategies.34,35
3. Interactions: networking and engagement mechanisms and facilitated activities that aid interactive learning and negotiation between actors.10 36
4. Assets: physical, knowledge, and financial assets and resources.
To support the identification of actors who influence AET, this study drew from the United Nations Food and Agriculture Organization’s (FAO’s)37 categorisation of key AIS actors (see Table 1). Given the sector’s historical and structural bias towards codified knowledge8, we made efforts to include stakeholder groups operating within tacit and informal spheres.
Functional framework
This framework develops a nuanced analytical lens to examine which functions support or inhibit the presence, absence, and quality of innovation-supportive structures. Functions are seen as targeted interactions, often with specific AET or systemic facilitation aims. Drawing from the typologies of Bergek et al.38 and Hekkert et al.39, and the identification of innovation support services by Ndah et al.40, the below functions focus on AET activities that develop individual, organisational, and systemic innovative capabilities.
1. Awareness, development, and exchange of knowledge: development of codified and tacit knowledge in formal and informal settings; inclusion of new and existing knowledge inputs to innovation processes.41 42
2. Advisory, consultancy, and backstopping: identification and articulation of knowledge, priorities, roles, and resource-specific needs43; market demand; and provision of technical, legal, economic, environmental, and social advice.
3. Networks, facilitation, and brokerage: multilevel and monolevel stimulation between stakeholders with the objective of improving the quality of interactions and facilitation of networks.44
4. Capacity building: theory-based and interactive learning processes for individuals and organisations.20
Combined framework
The combination of structural and functional frameworks enables the analysis of the presence, absence, and quality of system structures, and what and how AIS structures affect who can access innovation-supportive functions. This framework was used to develop initial interview and focus group protocols and to set up a multistakeholder workshop that facilitated reflection on study findings (Table 2).
table 1:
categories and potential agricultural innovation system roles
Actors/ subcategories Potential roles
Providing advisory services
Farmer organisations
Advisory services
Educational institutes
Representing farmers in value chains and policy arenas
Facilitating access to agricultural inputs, credit, and markets
Brokerage of knowledge between farmers and other actors
Making new technology and practices available
Forging networks and supporting farmers’ organisations
Improving the education level of all actors
Education and training of professionals in the agricultural sector
Development of better knowledge and skills for agricultural actors
Developing and improving technologies, practices, and processes
Researchers
Policymakers
Testing and validation of locally developed technologies and processes
Documenting the ways new practices and technologies are adapted
Formulating, implementing, and reflecting on strategies, policies, and regulations
Allocating resources for research and human resources development
Facilitating networks and partnerships
Source: Adapted from the FAO37 under a CC BY-NC-SA 3.0 licence
Methodology systems boundaries
This study’s focus on analysing Mpumalanga’s AET system through an AIS lens requires the setting of system boundaries to identify which actors, infrastructures, institutions, and interactions are included in the analysis, and implicitly which are excluded. The multifaceted challenges facing Mpumalanga’s AIS have developed from an interplay of biophysical, technological, social–cultural, economic, institutional, and political dimensions45, and this poses a boundary-setting challenge. This is because of the difficulty in establishing who has key influence and interest in Mpumalanga’s AET system, and thus who should be included as a study participant. For example, the study boundary could finish at value chains located only within Mpumalanga, national businesses that purchase agricultural goods and services from within Mpumalanga, or international markets that have an influence on what and how specific crops are grown in Mpumalanga. We deployed spatial and commodity-specific foci to in response to this methodological challenge.
Spatial boundary
AET’s multilevel, cross-commodity and inter-commodity foci and the integration of codified and tacit learning sources require a boundary that is able to cover multistakeholder interactions across multiple levels and dimensions.20 As such, whilst the spatial boundary has been set primarily within Mpumalanga, this spatial boundary is fluid to incorporate national stakeholders with a significant influence on Mpumalanga’s AET, for example national policymakers and centralised industry groups.
Selection of commodity chains
As this study sought to determine systemic blockages within Mpumalanga’s AET, we were not directly concerned with specific crops or value chains.
Actor
However, to support the identification of system structures, we focused on two specific commodity chains. The initial selection of commodities was informed using the analysis of Mpumalanga’s agricultural sector, with commodities selected based on their importance in Mpumalanga’s food system.46 A value chain complexity matrix (Figure 1) was used to select two commodity systems, citrus and maize, because of their contrasting system structures and levels of socio-material and socio-organisational complexity.
data collection
Data were primarily collected using semi-structured interviews, focus groups, and a reflexive multi-actor workshop. Reviews of grey literature on Mpumalanga’s AET, citrus, and maize subsystems helped tailor data collection tools to study participants’ interests. Semi-structured interviews allowed for flexibility to explore stakeholder-specific comments and for interviewees to discuss topics of interest, creating more reflexive interviews.47 Half of the study interviews and one focus group were held in-person, either at the University of Mpumalanga or at the offices and farms of participants’ organisations, with other interviews and focus groups taking place online. Of the 38 participants, 20 were men and 18 were women (Table 3).
Twenty-four semi-structured interviews were held between 13 July and 29 August 2023, with two focus groups held on 6 August 2023. A rapid analysis of the findings was undertaken to allow for the findings to be discussed by participants in a workshop held at the University of Mpumalanga on 15 August 2023 (Table 4).
data analysis
Interviews, focus groups, and the workshop were recorded and transcribed with the consent of participants. Preset codes from the structural–functional framework and emerging codes were assigned to text containing similar content. Codes were then organised into code families to obtain thematic categories. Analysis was then conducted on codes, with further analysis completed to identify where access to AET structures and functions was influenced by stakeholder characteristics.
Findings
Findings are presented in two sections that highlight the different structural and functional capacities of Mpumalanga’s education and training, and research systems. The delineation of education and training, and research into separate but interlinked subsystems is because of differing structural dynamics that influence the quality of innovation structures and functions that operate within the wider AET system.
education and training system
Poor multi-actor AEt coordination
Articulated by van Saden’s analysis of AET innovation within the North-West’s AIS48, responsive curricula and learning systems require the organisation of social learning between food system actors, government bodies, and AET providers. Complementing her findings, the results show that significant collaborative efforts are required
Structures Actors Institutions Interactions
Infrastructures
What structural components contribute to realising each function, the presence and/or absence, or capability and/or quality of each structural component?
Functions Awareness, development, and exchange of knowledge
Advisory, consultancy, and backstopping
Networks, facilitation, and brokerage Capacity building
What functions are performed by agricultural education and training stakeholders, and how well do these support innovative capabilities at individual, organisational, and system levels?
Combined analysis
Which structures enable which functions, for whom, and how?
Which functions support the development of innovative capabilities, for whom, and how?
table 3: Stakeholder association of study participants
Stakeholder groups Diversity within stakeholder groups
Number of participants
1. Farmer organisations Industry bodies, smallholder associations, and non-governmental organisations 14
2. Training providers University lecturers, non-governmental organisations, governmental bodies, and industry bodies 13
3. Government and funding bodies Policymakers, extension officers, commodity, and development funders 5
4. Researchers Government, university, private, and commodity body researchers 6
table 4: Stakeholder groups of in-person and online study participants
Stakeholder group In-person workshop participants online workshop participants
1. Farmer organisations 3 5
2. Training providers 4 2
3. Government and funding bodies 4 3
4. Researchers 4 3
between institutions that enable multi-actor reflexive engagement in the development and delivery of agricultural curricula and pedagogies.
Findings from this study indicate that there are weak educational coordination mechanisms, leading to a lack of facilitated interactions between public and private AET providers. The absence of an intraeducational system coordination poses challenges not only to AET-focused actors but also to the capacity of Mpumalanga’s entire food system to respond to ongoing challenges. Absent relationship-building structures between education providers and the wider AIS contribute to mismatches in required and produced skill sets between education providers and employers. Subsequently, graduates regularly do not possess sufficient role-specific knowledge, networks, and soft skills to easily transition into employment. Organisations in Mpumalanga’s food system frequently have to invest significant resources to upskill new employees to provide them with the requisite technical knowledge, soft skills, and multi-actor relationships that are specific to sectors, value chains, and local food systems.
[We need] collaboration between the university and the department [of Agriculture]. We can’t be producing students and then when they go to the market they can’t be absorbed. [University educator]
We are working in silos. I’m doing my own things, the investors [are] doing their own things, the department [of Agriculture], [are doing] their own things. But all of us are focusing on the same people. [NGO staff]
Poor-quality intrasystem coordination is driven by weak communicative structures unable to identify multisectoral training needs and opportunities to incorporate experiential learning within existing pedagogies. Universities do not have access to real-world learning environments to provide soft skill development that meets the multifaceted needs of complex food systems in Mpumalanga. This absence emanates from weak institutional links between government, industry, and education providers, hindering potential education sharing between actors to combine theory-based and practical pedagogies. Whilst there is a wide recognition of the benefits of collaboration between education providers and employers, such benefits, for example of co-identifying industry needs, are not enabled by institutional norms or regulations. This disenabling environment is compounded by the complex nature of the multilevel AET system in Mpumalanga, and this challenge is increased as government and employers are not mandated to seek out educational partnerships.
https://doi.org/10.17159/sajs.2025/18996
Industry [should] support students from the university or college level, however there is not a platform to develop those relationships. [Smallholder association manager]
All these discussions we have been having with these other institutions, they have been on an ad hoc basis. We need something, like a programme or a hub, that allows us to structure our engagements. [Government extension manager]
Experiential learning is highly valued but faces a disenabling environment
Experiential learning is recognised as crucial to students’ abilities to understand the multidimensional factors that influence food systems and should be considered a core component of Mpumalanga’s AET system. Limited examples exist of mechanisms that integrate theoretical and practical learning environments, with examples including internships and studentships between private sector actors and the Agricultural Research Council (ARC). However, there is no system-wide framework that identifies experiential learning opportunities within the whole food system.
We now realise, after having appointed this guy [an extension officer without a degree] with his incredible, incredible wealth of practical knowledge, that that’s where the focus should be… the universities would be doing everybody a favour by getting a more practical focus in their curricula. [Commodity training provider]
We want people from the universities that will fit our profile… we usually can’t find them because they aren’t given that type of training… in most cases, universities don’t do that kind of training.
[Private researcher]
Limited attempts to develop integrated learning environments have been stymied because of poor connectivity between local, municipal, and provincial systems in Mpumalanga; government working in silos; and a lack of a central structure that brokers educational partnerships.
Public and private extensions face resourcing constraints, compounded by a lack of collaboration
Commodity-group-employed extension officers access crop-specific continuous professional development (CPD) that helps them adapt to changing needs. Strong vertical integration supports commodity groups to inform their extension training programmes by gathering top-down and bottom-up information through surveys and frequent industry forums.49 These multilevel needs-gathering structures allow training to respond to industry needs and are a considerable strength. However, industry-led training providers are often unable to access sufficient training infrastructures to capitalise on demand-driven training opportunities.
We use conferencing facilities, which… drives up the costs considerably, but there isn’t really training facilities that are accessible and useful and well equipped. [Commodity group training provider] Training facilities are not freely available. [Commodity group training provider]
Contrastingly, there is insufficient CPD for public extension officers, with the ARC only providing limited support, whilst the provincial Department of Agriculture does not fully capitalise on the recent growth of the University of Mpumalanga. The lack of multi-institutional coordination limits the identification of needs and opportunities between government extension, AET role players, and industry. This absence has led to missed opportunities to strengthen extension education and provision by combining the CDP of extension officers with the development of experiential learning placements for university students.
Poor networking compounds systemic challenges
Another example of poor intrasystem communication can be found in the recently (2023) closed Assistant Agricultural Extensionist programme through which the South African Department of Agriculture, Land Reform and Rural Development appointed 5000 new extension officers throughout South Africa on 3-month contracts. However, provincial departments of agriculture were not allocated sufficient resources, including vehicles, laptops, and phones, to support new assistant extension officers to fulfil their roles. Improved collaboration with food system actors could have helped identify mutually beneficial opportunities for collaborative working that enabled the sharing of resources, for example, by organisations travelling to the same locations together to combine extension provision with students’ experiential learning.
The assistant extension practitioners were unable to do anything as they didn’t have … access to resources. [DARDLEA research manager]
These [assistant] extension officers cannot do full work without a full extension officer supervising them… they will need to be driven to the farms by the existing extension officers. [DARDLEA extension official]
research and innovation system
Commodity structures enable industry collaboration
Well-established national commodity organisations have developed coordination systems that combine bottom-up and top-down approaches to inform research agendas. These coordination systems enable research to respond to ongoing and novel challenges by facilitating multilevel commodity-specific interactions. Interactions are supported by regulations and normative expectations that have been established by commodity levy-funding structures. For example, the Citrus Growers’ Association draws upon funding from the citrus value chain through a levy charged on growers’ exports. This levy-funding sets research expectations of citrus value chain stakeholders50, with service delivery communicated through well-structured agreements. The commodity-focused research system
enables the collection of multilevel needs and supports the functioning of the national agricultural research system by enabling multi-institutional interactions.51 Funding bodies mandate multi-institutional research consortia in funding calls, acting as a systemic enabler that brings actors together around identified system needs (Figure 2).
The stated purpose of the Citrus Growers’ Association is the “interests of the producers of export citrus”52(p.96), and, as such, research coordination models primarily respond to the priorities of commercial and export-focused agriculture. Whilst the Citrus Growers’ Association has ringfenced 20% of levy fees to support emerging farmers, the overarching aim of the Association is to increase exports of citrus, and thus this remains the central developmental pathway promoted for emerging farmers. Whilst elements of such commercial developmental pathways can support the resilience and sustainability of emerging farmers, there are significant risks associated with the promotion of cash crops and commercial markets for such actors.49 As dominant system structures, including input, infrastructure, and information systems, are built around the capabilities and networks of commercial farmers, these systems are often unsuitable for farmers whose focus is on local food security. An ongoing challenge that is beyond the scope of this paper is how to ensure that commodity groups help develop food systems that reduce smallholder exposure to market and climatic shocks by supporting domestic markets for traditional food baskets. An over-reliance on such export-orientated structures could expose smallholder and emerging farmers to unnecessary short-term risks as agricultural environments become more unstable.
Public research structures need leadership and investment
Public research coordination structures, including the Mpumalanga Agricultural Research Committee, are visible in Mpumalanga. However, a lack of ownership from public actors has resulted in poor-quality networking, facilitation, and exchange of knowledge. Such provincial research coordination structures are, however, still in their infancy, and strong leadership is required to enable such structures to identify and support systemic needs, priorities, and resources. A key focus of public agricultural bodies should be to support interactions that enable the shared utilisation of infrastructures between public research stakeholders to create efficiencies in service delivery that reduce the ongoing funding challenges faced by public bodies.
discussion and conclusion
This study confirms that there is a disenabling environment for AET in Mpumalanga, with research and educational subsystems facing structural weaknesses through a lack of translevel interactions.53 There is an absence of a coordination framework across the AET system that enables communication between different levels, commodity
Figure 2: Commodity-research system.
chains, and formal and informal networks. The ensuing lack of networking, facilitation, and brokerage is a fundamental systemic blockage, causing many actors to operate in silos. This weak networking environment significantly contributes to poor awareness and exchange of knowledge between actors and inhibits advisory and backstopping services through limited intrasystem awareness of needs and resources. Whilst commodity-research structures have embedded norms, regulations, and well-developed communicative mechanisms, system-wide platforms that support cross-commodity, public and private innovative capabilities are lacking. The University of Mpumalanga (UMP), the Agricultural Research Council of South Africa (ARC), and the Mpumalanga Department of Agriculture, Rural Development, Land and Environmental Affairs (DARDLEA) should provide leadership to strengthen provincial AET structures. These should build on the Water Research Commissions’ research on how to frame a comprehensive multilevel agricultural learning system54 that brings together complementary strengths and resources to respond to systemic needs. UMP, ARC, and DARDLEA have the legitimacy, resources, and access to networks and infrastructures to consolidate multilevel and multi-actor networks around common goals and should co-develop a coordination mechanism that pools knowledge and resources for mutual benefit. Further, their mandates and access to a diverse range of human and organisational resources provide them with the capabilities to effectively coordinate with an equitable and impactful provincial AET system that complements existing commodity-coordination structures.
Of significance is the absence of interactions between actors operating in formal and informal spheres. This contributes to a systemic inability to take advantage of complementary skills, networks, and resources.
A system-wide coordination platform should facilitate between public and private AET providers and users by capitalising on the mandates of extension officers to act as innovation intermediaries that link formal and informal networks. Further, collaboration between public and private extensions should be strengthened to identify complementary needs and resources and respond to limited extension resourcing. Participatory and multi-actor identification of problems would enable industry, government, ARC, provincial departments, and UMP to work together on extension CPD and identify where sharing of resources between extension stakeholders is desirable and feasible.
Such a platform should integrate with commodity-coordination and communication structures that enable commodity-research subsystems to meet bottom-up and top-down needs. Government, UMP, and the ARC should learn from such commodity systems to understand how to facilitate multidisciplinary and transdisciplinary research consortia that identify and build on complementary skills and resources. In-kind investments between such bodies in a public research coordination system would enable the identification of synergies in research activities, infrastructures, and networks to maximise impact. Agenda-setting exercises between such actors should be used to facilitate backstopping and networking functions and build on pre-existing initiatives, for example the Mpumalanga Agricultural Research Committee. Undertaking research and needs mapping between such bodies would provide the basis for awareness, development, and exchange of knowledge and resources. This would identify where there are opportunities to collaborate on mutually beneficial research and education and training activities.
As recommended by the ASSAf Consensus Study53, AET actors in Mpumalanga should adopt a land grant model as an AET-systemwide coordination mechanism. Articulated by Kopp55, a land grant model could act as a systemic enabler by facilitating demand-driven relationships between ministries and education and research bodies to promote usable science. This builds on the Department of Science, Technology and Innovation’s Decadal Plan56 that envisages a transformed research institutional landscape with greater integration between all actors and would act as a starting point to create enabling environments for multi-actor AET that provides responsive, demand-driven research and education that capitalises on the diversity of knowledge, networks, and resources in Mpumalanga.
Funding
Funding was made available by the South African National Research Foundation and Agricultural Research Council to support this study as part of a pilot programme ‘Strengthening Agricultural Research and Innovation’.
Data availability
The data pertaining to this article are not available.
Declarations
We have no competing interests to declare. We have no AI or LLM use to declare. Ethical clearance was received from the School of Agriculture, Policy, and Development, University of Reading (Number: 2200C). This study contributed to the fulfilment of T.F.’s MSc, awarded by the University of Reading.
Authors’ contributions
T.F.: Conceptualisation, methodology, investigation, formal analysis, validation, data curation, writing – original draft, writing – review and editing. A.S.: Supervision, project leadership, project administration, funding acquisition, writing – review and editing. S.C.: Supervision, project leadership, writing – review and editing. All authors read and approved the final manuscript.
r eferences
1. Darnhofer I, Gibbon D, Dedieu B. Farming systems research: An approach to inquiry. In: Darnhofer I, Gibbon D, Dedieu B, editors. Farming systems research into the 21st century: The new dynamic. Dordrecht: Springer Netherlands; 2012. p. 3–31. https://doi.org/10.1007/978-94-007-4503-2_1
2. Leach M, Stirling AC, Scoones I. Dynamic sustainabilities: Technology, environment, social justice. London: Routledge; 2010. https://doi.org/10.1 324/9781849775069
3. Klerkx L, Begemann S. Supporting food systems transformation: The what, why, who, where and how of mission-oriented agricultural innovation systems. Agric Syst. 2020;184, Art. #102901. https://doi.org/10.1016/j.ag sy.2020.102901
4. Eicher CK. The evolution of agricultural education and training: Global insights of relevance for Africa. Staff Paper Series [webpage on the Internet]. c2006 [cited 2024 Apr 17]. Available from: https://ideas.repec.org//p/ags/midasp/ 11816.html
5. Spielman DJ, Ekboir J, Davis K. The art and science of innovation systems inquiry: Applications to sub-Saharan African agriculture. Technol Soc. 2009; 31(4):399–405. https://doi.org/10.1016/j.techsoc.2009.10.004
6. Pamuk H, Bulte E, Adekunle AA. Do decentralized innovation systems promote agricultural technology adoption? Experimental evidence from Africa. Food Policy. 2014;44:227–236. https://doi.org/10.1016/j.foodpol.2013.09.015
7. Zwane E, Davis K. Extension and advisory services: The African renaissance. S Afr J Agric Ext. 2017;45, Art. #17159. https://doi.org/10.17159/2413-32 21/2017/v45n2a397
8. Swanepoel F, Ofir Z, Stroebel A, editors. Agricultural education and training for development in sub-Saharan Africa. In: Towards impact and resilience: Transformative change in and through agricultural education and training in sub-Saharan Africa. 1st ed. Newcastle Upon Tyne: Cambridge Scholars Publishing; 2014.
9. Aerni P, Nichterlein K, Rudgard S, Sonnino A. Making agricultural innovation systems (AIS) work for development in tropical countries. Sustainability. 2015;7:831–850. https://doi.org/10.3390/su7010831
10. World Bank. Enhancing agricultural innovation. Washington, DC: World Bank; 2006. http://hdl.handle.net/10986/24105
11. Kok K, Loeber A, Grin J. Politics of complexity: Conceptualizing agency, power and powering in the transitional dynamics of complex adaptive systems. Res Policy. 2021;50, Art. #104183. https://doi.org/10.1016/j.re spol.2020.104183
12. Kok K, Gjefsen MD, Regeer B, Broerse J. Unraveling the politics of ‘doing inclusion’ in transdisciplinarity for sustainable transformation. Sustain Sci. 2021;16:1811–1826. https://doi.org/10.1007/s11625-021-01033-7
13. Fisher E, Rip A. Responsible innovation: Multi-level dynamics and soft intervention practices. In: Owen R, Bessant J, Heintz M, editors. Responsible innovation: Managing the responsible emergence of science and innovation in society. Chichester: John Wiley & Sons; 2013. p. 165–183. https://doi.org /10.1002/9781118551424.ch9
14. Kamara LI, Lalani B, Dorward P. Towards agricultural innovation systems: Actors, roles, linkages and constraints in the system of rice intensification (SRI) in Sierra Leone. Sci Afr. 2023;19, Art. #e01576. https://doi.org/10.10 16/j.sciaf.2023.e01576
15. Leeuwis C, Aarts N. Rethinking communication in innovation processes: Creating space for change in complex systems. J Agric Educ Ext. 2011;17, Art. #536344. https://doi.org/10.1080/1389224X.2011.536344
16. Knierim A, Labarthe P, Laurent C, Prager K, Kania J, Madureira L, et al. Pluralism of agricultural advisory service providers: Facts and insights from Europe. J Rural Stud. 2017;55:45–58. https://doi.org/10.1016/j.jrurstud.2017.07.018
17. Schut M, Klerkx L, Rodenburg J, Kayeke J, Hinnou LC, Raboanarielina CM, et al. RAAIS: Rapid appraisal of agricultural innovation systems (Part I). A diagnostic tool for integrated analysis of complex problems and innovation capacity. Agric Syst. 2015;132:1–11. https://doi.org/10.1016/j.agsy.2014.08.009
18. Tropical Agriculture Platform. Common framework on capacity development for agricultural innovation systems: Guidance note on operationalization. Wallingford: CAB International; 2016.
19. Schut M, Leeuwis C, Thiele G. Science of scaling: Understanding and guiding the scaling of innovation for societal outcomes. Agric Syst. 2020;184, Art. #102908. http://doi.org/10.1016/j.agsy.2020.102908
20. Edquist C, Borrás S. The choice of innovation policy instruments. Technol Forecast Soc Change. 2013;80:1513–1522. https://doi.org/10.1016/j.techf ore.2013.03.002
21. Cohen MD, Axelrod R. Harnessing complexity: Organizational implications of a scientific frontier. New York: Simon and Schuster; 2000. p. 199.
22. Hlatshwayo S, Ngidi M, Temitope O, Modi A, Mabhaudhi T, Slotow R, et al. A typology of the level of market participation among smallholder farmers in South Africa: Limpopo and Mpumalanga provinces. Sustainability. 2021;13, Art. #7699. https://doi.org/10.3390/su13147699
23. Nkosi CS, Olorunfemi OD, Khwidzhili H. Data on climate change effect and use of adaptation strategies among smallholder maize farmers: Evidence from a microlevel survey in Ehlanzeni District, South Africa. Data Brief. 2023;48, Art. #109106. https://doi.org/10.1016/j.dib.2023.109106
24. Oduniyi O, Temitope O, Nyam YS. Awareness and adoption of sustainable land management practices among smallholder maize farmers in Mpumalanga Province of South Africa. Afr Geogr Rev. 2022;42:217–231. https://doi.org /10.1080/19376812.2021.2018661
25. Xaba T, Marwa N, Mathur-Helm B. Efficiency and profitability analysis of agricultural cooperatives in Mpumalanga, South Africa. J Econ Behav Stud. 2018;10:1–10. https://doi.org/10.22610/jebs.v10i6(J).2587
26. Bruwer PW, Khwidzhili R. The role of private agronomists towards the sustainability of commercial crop farmers in the eastern highveld of Mpumalanga, South Africa. S Afr J Agric Ext. 2022;50:147–162. https://doi. org/10.17159/2413-3221/2022/v50n1a11704
27. Oduniyi OS, Tekana SS. Does information acquisition influence the adoption of sustainable land management practices? Evidence from Mpumalanga Province South Africa. Front Sustain Food Syst. 2021;5, Art. #769094. http s://doi.org/10.3389/fsufs.2021.769094
28. Khwidzhili RH, Worth S. Evaluation of South Africa’s public agricultural extension in the context of sustainable agriculture. S Afr J Agric Ext. 2019;47(1):20–35. https://doi.org/10.17159/2413-3221/2019/v47n1a486
29. Hermans F, Klerkx L, Roep D. Structural conditions for collaboration and learning in innovation networks: Using an innovation system performance lens to analyse agricultural knowledge systems. J Agric Educ Ext. 2015;21:35–54. https://doi.org/10.1080/1389224X.2014.991113
30. Minh TT. Unpacking the systemic problems and blocking mechanisms of a regional agricultural innovation system: An integrated regional-functionalstructural analysis. Agric Syst. 2019;173:268–280. https://doi.org/10.1016 /j.agsy.2019.03.009
31. Lamprinopoulou C, Renwick A, Klerkx L, Hermans F, Roep D. Application of an integrated systemic framework for analysing agricultural innovation systems and informing innovation policies: Comparing the Dutch and Scottish agrifood sectors. Agric Syst. 2014;129:40–54. https://doi.org/10.1016/j.agsy.2014.05.001
32. Hall A. Capacity development for agricultural biotechnology in developing countries: An innovation systems view of what it is and how to develop it. J Int Dev. 2005;17:611–630. https://doi.org/10.1002/jid.1227
33. Lamontagne-Godwin J, Dorward P, Ali I, Aslam N, Cardey S. An approach to understand rural advisory services in a decentralised setting. Soc Sci. 2019;8(3), Art. #103. https://doi.org/10.3390/socsci8030103
34. Toillier A, Faure G, Audouin S, Mathé S, Triomphe B, Temple L. Literature review of methodologies for the diagnosis of agricultural innovation systems (AIS).France: CIRAD; 2021 [cited 2023 Apr 27]. Available from: http://agrit rop.cirad.fr/596199/1/Literature%20review%20AIS%20Final%20version.pdf
35. Turner JA, Klerkx LWA, Rijswijk K, Williams T, Barnard T. Systemic problems affecting co-innovation in the New Zealand agricultural innovation system: Identification of blocking mechanisms and underlying institutional logics. NJAS Wageningen J Life Sci. 2016;76:99–112. https://doi.org/10.1016/j.n jas.2015.12.001
36. Leeuwis C, van den Ban AW. Communication for rural innovation: Rethinking agricultural extension. Oxford: John Wiley & Sons; 2004. https://doi.org/10. 1002/9780470995235
37. United Nations Food and Agriculture Organization (FAO). Assessing agricultural innovation systems for action at country level: A preliminary framework [webpage on the Internet]. Rome: FAO; 2022. Available from: http s://www.fao.org/documents/card/en?details=CB0614EN
38. Bergek A, Jacobsson S, Carlsson B, Lindmark S, Rickne A. Analyzing the functional dynamics of technological innovation systems: A scheme of analysis. Res Policy. 2008;37(3):407–429. https://doi.org/10.1016/j.respol .2007.12.003
39. Hekkert MP, Suurs R, Negro SO, Smits REHM, Kuhlmann S. Functions of innovation systems: A new approach for analysing technological change. Technol Forecast Soc Change. 2007;74:413–432. https://doi.org/10.1016/ j.techfore.2006.03.002
40. Ndah H, Knierim A, Faure G, Zarokosta E, Audouin S, Wielinga HE, et al. A scientific report on cross-compared research insights on innovation support practices [document on the Internet]. c2017 [cited 2022 Nov 21]. Available from: https://agritrop.cirad.fr/584619/
41. Edquist C. Systems of innovation: Perspectives and challenges. In: Fagerberg J, Mowery DC, editors. The Oxford handbook of innovation. Oxford: Oxford University Press; 2006. p. 181–208. https://doi.org/10.1093/oxfordhb/9780 199286805.003.0007
42. Reece J. Agricultural research through a ‘new product development’ lens. Exp Agric. 2004;40:295–314. https://doi.org/10.1017/S0014479704002030
43. Smits R. Innovation studies in the 21st century: Questions from a user’s perspective. Technol Forecast Soc Change. 2002;69:861–883. https://doi.or g/10.1016/S0040-1625(01)00181-0
44. Ndah H, Knierim A, Koutsouris A, Faure G. Diversity of innovation support services and influence on innovation processes in Europe: Lessons from the AgriSpin project. Proceedings of the 13th European International Farming Systems Association (IFSA) Symposium; 2018 July 1–5; Chania, Greece. Chania: IFSA; 2018.
45. Leeuwis C, Schut M, Waters-Bayer A, Sartas M, Atta-Krah K, Douthwaite B. Capacity to innovate from a system CGIAR research program perspective. Penang: CGIAR Research Program on Aquatic Agricultural Systems; 2014. https://hdl.handle.net/10568/51941
46. Mpumalanga Department of Agriculture, Land Reform and Rural Development (DARDLEA). Annual performance plan 2021/22. Mbombela: DARDLEA; 2021.
https://doi.org/10.17159/sajs.2025/18996
47. Bruges M, Smith W. Improving utilisation of Māori land: Challenges and successes in the application of a participatory approach. Kōtuitui: N Z J Soc Sci Online [webpage on the Internet]. 2009;4(3):205–220. https://doi.org/10.1080/ 1177083X.2009.9522455
48. Van Staden W. Climate responsive innovation within the agricultural curriculum and learning system. South Afr J Environ Educ. 2020;36, Art. #6. https://doi. org/10.4314/sajee.v36i1.6
49. Stringer LC, Fraser EDG, Harris D, Lyon C, Pereira L, Ward CFM, et al. Adaptation and development pathways for different types of farmers. Environ Sci Policy. 2020;104:174–189. https://doi.org/10.1016/j.envsci.2019.10.007
50. Roberts S, Chisoro S. Innovation and inclusion in South Africa’s citrus industry. Edinburgh / Johannesburg / Dar es Salaam: Innovation and Inclusive Industrialisation in Agro-Processing; 2021.
51. Fry T. Strengthening innovation structures as a pathway to weave people together around shared priorities: Perspectives from an agricultural innovations system diagnostic in Mpumalanga, South Africa. Christchurch: IAMCR-FAO; 2024.
52. South African Department of Agriculture, Land Reform and Rural Development (DALRRD). A profile of the South African citrus market chain. Pretoria: DALRRD; 2020.
53. Academy of Science of South Africa (ASSAf). Revitalising agricultural education and training in South Africa. Pretoria: ASSAf; 2017 https://researc h.assaf.org.za/handle/20.500.11911/85
54. Lotz-Sisitka H, Pesanayi T, Weaver K, Lupele C, Sisitka L, O’Donoghue R, et al. Water use and food security: Knowledge dissemination and use in agricultural colleges and local learning networks for homestead food gardening and smallholder farming. Pretoria: Water Research Commission; 2016.
55. Kopp RE. Land-grant lessons for Anthropocene universities. Clim Change. 2021;165, Art. #28. https://doi.org/10.1007/s10584-021-03029-9
56. South African Department of Science and Innovation (DSI). Science, technology and innovation decadal plan 2022–2032 [document on the Internet]. Pretoria: DSI; 2021 [cited 2025 Mar 21]. Available from: https:// www.nrf.ac.za/wp-content/uploads/2023/06/STI-Decadal-Plan-2022-23-14 Dec22.pdf
https://doi.org/10.17159/sajs.2025/18996
AuthorS: Scott Drimie1,2 Mieke Faber3 4
Lisanne du Plessis1 2
AFFILIAtIoNS:
1Division of Human Nutrition, Department of Global Health, Faculty of Medicine and Health Sciences, Stellenbosch University, Cape Town, South Africa
2Southern Africa Food Lab, Stellenbosch, South Africa
3Non-Communicable Disease Research Unit, South African Medical Research Council, Cape Town, South Africa
4Centre of Excellence for Nutrition, North-West University, Potchefstroom, South Africa
CorrESPoNDENCE to: Scott Drimie
EMAIL: scottdrimie@mweb.co.za
DAtES:
r eceived: 29 June 2024
r evised: 26 June 2025
Accepted: 27 June 2025
Published: 11 Aug. 2025
hoW to CItE:
Drimie S, Faber M, du Plessis L. Understanding barriers and opportunities for fresh produce access in eThekwini Metro, Durban, South Africa. S Afr J Sci. 2025;121(7/8), Art. #19011. https:// doi.org/10.17159/sajs.2025/19011
ArtICLE INCLuDES:
☒ Peer review
☐ Supplementary material
DAtA AVAILAbILItY:
☐ Open data set
☐ All data included
☒ On request from author(s)
☐ Not available
☐ Not applicable
EDItorS:
Annchen Mielmann
Leslie Swartz
KEYWorDS:
triple burden of malnutrition, food accessibility, local food systems, small-scale farming, nutritionsensitive agriculture, South Africa
FuNDING:
Nedbank Green Trust, World Wide Fund for Nature, Douglas George Murray Trust
Understanding barriers and opportunities for fresh produce access in eThekwini Metro, Durban, South Africa
South Africa faces a triple burden of malnutrition – undernutrition, hidden hunger and increasing rates of overweight and obesity driven by poor dietary choices. We examined fresh produce access and consumption patterns in Inchanga, eThekwini (South Africa) to understand how strengthening linkages between small-scale farmers and consumers could improve local food systems. Using mixed methods, we collected quantitative data from 121 participants and conducted three focus group discussions to assess consumption patterns, procurement practices and barriers to fresh produce access. Key findings highlight significant challenges, including insufficient fruit and vegetable consumption; 29% of participants reported zero intake the previous day, largely due to financial constraints. Economic pressures are stark among low-income households, with 70% reliant on Child Support Grants, underscoring affordability barriers to nutritious foods. Participants travel over an hour to supermarkets for fresh produce, indicating potential for local markets. While nutrition knowledge was generally good, affordability rather than education emerged as the primary constraint. Insights into local food shopping behaviour underscore the potential for establishing markets that support local produce, enhancing community accessibility. Promoting African leafy vegetables emerges as a viable strategy to enhance the affordability of dietary diversity and health outcomes. The study reveals a clear opportunity to bridge the gap between local farmers seeking markets and consumers needing affordable, accessible fresh produce. Establishing local markets supported by appropriate public policy could simultaneously address farmers’ economic needs and consumers’ nutritional requirements, strengthening the resilience of local food systems.
Significance:
• Cost rather than knowledge is the primary barrier to adequate fresh produce consumption in low-income communities, although some misinformation on food prevails.
• Local market development could simultaneously address farmers’ livelihood needs and consumers’ food access challenges.
• Public policy support for farmer–consumer linkages represents a promising nutrition-sensitive intervention.
• There are intricate linkages between agriculture and nutrition, suggesting that comprehensive, multi-sectoral approaches are required to combat malnutrition effectively.
Introduction
Over the past 30 years, South Africa has undergone a nutritional transition, characterised by the triple burden of malnutrition: households are simultaneously experiencing undernutrition, hidden hunger, and overweight or obesity as a result of nutrient-poor diets.1 This food crisis is partly underpinned by high and ever-increasing food prices, as well as less-healthy foods being cheaper than nutrient-rich foods.2
Approaches to address malnutrition can be described as being nutrition-specific or nutrition-sensitive. Nutrition-specific interventions target the direct causes of malnutrition while nutrition-sensitive interventions target the underlying causes.3 Stunting, a sign of chronic undernutrition, can be decreased by 20% if core nutrition-specific treatments are expanded to reach 90% of the target population, according to research published in the Lancet 2013 Series on Maternal and Child Nutrition.4 Micronutrient supplements (zinc, iron, calcium, vitamin A and folic acid) for children and women of reproductive age are a few examples of core nutrition-specific interventions. Other examples include the promotion of exclusive breastfeeding for the first six months of life and adequate complementary feeding from six months to two years of age.3
Although nutrition-specific interventions are crucial, they cannot bring chronic malnutrition down to more ‘acceptable’ levels on their own. Nutrition-sensitive interventions that are responsive to nutrition are therefore also required. By incorporating nutrition targets into interventions from other sectors, such as agriculture, education, health, and WASH (water, sanitation and hygiene), nutrition-sensitive initiatives address the fundamental causes of malnutrition.3 As an example, strengthening the linkages between agriculture and nutrition may provide a pathway to creating access to nutritious food as food production has a direct impact on the amount and variety of food available.5 However, nutrition is not just shaped by the kinds of foods that are made available in the food system, but also by how that food system interacts with a whole range of other systems that shape daily life. Various pathways need to be carefully understood if local food systems are to help address malnutrition. A part of this is to understand the awareness of good nutrition so as to stimulate demand for local production.5
In the greater eThekwini area, approximately 200 000 households in over 300 informal settlements are affected by food insecurity as a result of soaring unemployment.6 The eThekwini Metropolitan Municipality has created six agroecology hubs as part of its resilience plan. Food is grown around these hubs by a large number of backyard gardeners, small-scale farmers and farming cooperatives. The eThekwini municipality and the Southern Africa Food Lab collaborated to introduce Woza Nami (‘Come with Me’) in 2020 at the Inchanga hub, located in a peri-urban area halfway between Pietermaritzburg and Durban.
Woza Nami has established a flagship demonstration site based at Inchanga, serving as a working farm with crop planting, soil rehabilitation programmes, poultry, an organic seedling nursery tunnel and different types of composting methods. The project supports a range of farmers, predominantly women, currently working with ten co-operatives (approximately 110 individuals), with between five and ten farmers intensively farming vegetables on almost a hectare of land. Woza Nami also works with 25 ‘One Home One Garden’ farmers who grow backyard vegetable gardens that supplement household diets with vegetables, especially green leafy vegetables. The hub hosts market days for its farmers, and anticipates partnering with Early Childhood Development (ECD) centres.
Beyond advancing an understanding of agroecological farming, the project aims to raise public awareness of nutrition among farmers and consumers, and increase accessibility to a variety of reasonably priced, nutrient-dense food through a range of local markets. Fresh produce such as fruits and vegetables are key components of a healthy, sustainable diet that is health-promoting and disease-preventing. Healthy diets provide adequacy without excess, of nutrients and health-promoting substances, from nutritious foods and avoid the consumption of health-harming substances.7 The importance of vegetables and fruit as part of a healthy diet is emphasised in the South African food-based dietary guidelines which, among others, encourage South Africans to “Eat a variety of vegetables and fruits”8. The World Health Organization recommends a daily intake of more than 400 g of fruit and vegetables to reduce the risk of non-communicable diseases and ensure adequate intake of dietary fibre.9 Raising awareness on healthy food choices and creating a demand for locally produced produce will therefore not only provide a market from which the farmers could build, but will also have potential health benefits for both farmers and consumers. Creating a link between local farmers and consumers requires an understanding of current procurement and consumption patterns, as well as their understanding of healthy food choices.5
The purpose of this study was to understand barriers and opportunities for improving fresh produce access by examining current patterns of procurement and consumption of fresh produce (vegetables and fruit), factors influencing food choices, and knowledge and understanding about food that contribute to healthy diets, and gaining a deeper understanding of the attitudes and intentions of consumers of fresh produce. This understanding will inform strategies to strengthen linkages between small-scale farmers and consumers in the local food system.
Methods
As described above, the Woza Nami project is linked to the Inchanga Agroecology Hub. This site was strategically and purposively selected based on criteria agreed by the project facilitators working with officials from the eThekwini Municipality Agro-Ecology Unit. It was agreed that the Woza Nami project would activate a market – at community level –for the farmers and the hub. As part of a baseline assessment, data were collected on household procurement and consumption of fresh produce using a structured questionnaire. In addition, focus group discussions were used to gain a deeper understanding of knowledge as well as attitudes and intentions of consumers of fresh produce.
Household questionnaire
The study sample consisted of 121 participants (people who grow, buy, prepare and influence food choices) purposively selected by targeting small-scale farmers and mothers/caregivers with a focus on women of reproductive age (18–49 years). An agricultural extension officer
and retired community health worker who were well known in and knowledgeable on the community, assisted with the identification and recruitment of eligible participants. Only one participant per household was included. Participants who did not consent or who were unable to speak the local languages (Zulu or English) were excluded. A structured fieldworker-administered household questionnaire was used to collect information on the consumption and procurement of vegetables and fruit, growing vegetables and fruit, factors influencing food choices, and knowledge on and sources of nutrition information.
Focus group discussions
Qualitative information was collected using focus group discussions (FGDs). The aim of the FGDs was to identify participants’ understanding of healthy food choices and their attitudes on their ability to implement the South African food-based dietary guidelines: “Eat a variety of vegetables and fruits.”8 The same participant/s who completed the household questionnaire were invited through in-person recruitment and telephonic follow-up by a research assistant to participate in the FGDs. Three FGDs were undertaken – two with five participants each and one with seven participants at a central, convenient location. The consultant and research assistant explained the aim of the FGD, identified who was collecting the information, and explained what would be done with the information. Permission was requested to record the discussions. Participants were assured of the anonymous nature of the discussions. The consent form was explained and signed. The consultant and research assistant gave a short introduction by explaining the aim and objectives of the project. A discussion guide was developed and used to facilitate the FGDs.
Management of data and data analysis
The quantitative questionnaire data were captured into a Microsoft Excel spreadsheet. Exploratory data analysis was undertaken to detect errors or strange values. The cleaned data were exported to the Statistical Package for Social Sciences (SPSS) version 27.0 for analysis. Descriptive statistics were generated to determine the frequencies and percentages.
Quality control and trustworthiness of the qualitative data were ensured through rigorous data capturing as well as analysis processes. Audio recordings from the FGDs were professionally transcribed. A separate electronic file was created for each FGD. The transcriptions were entered into the Atlas TI software program to enable labelling segments of text with code headings to aid reporting. Two researchers established the codes after careful reading and re-reading of the text. If agreement could not be reached on a specific code or codes, an additional researcher was consulted. Main themes were established around the key concepts explored in the FGDs.
r esults
The quantitative questionnaire data, supported by qualitative data from the FGDs, are reported per topic. The fieldworker-administered questionnaire was completed for 121 participants. Participants were mostly the household head (67%), the daughter of the household head (11%), or the wife/partner of the household head (8%). Just over half (52%) of the participants had more than 10 years of schooling (>Grade 10), and 27% were employed (either full time, part time, seasonally, or self-employed). The household size ranged from 1 to 16 members, and 70% of households were recipients of the Child Support Grant.
Household consumption and procurement of vegetables and fruit
Participants were asked to recall all fresh vegetables and fruit eaten the day before. In total, 61% had eaten vegetables (mostly cabbage, carrot, pumpkin leaves, and spinach) and 51% had eaten fruit (mostly apple and banana) the day before, while 29% had eaten no vegetables or fruit. For 40% of the participants who had eaten vegetables the day before, some, but not necessarily all, vegetables were from their own garden. Most (88%) households consumed green leafy vegetables when available.
Consumption of green leafy vegetables was further explored in the FGDs. Results reveal that a variety of green leafy vegetables were consumed, including pumpkin leaves, sweet potato leaves, amadumbe leaves, beetroot leaves, mulberry leaves, carrot leaves, turnip leaves and spinach:
Pumpkin leaves with peanuts no oil added [FGD1, P3]
There is this green leafy plant that grown in puddles/ponds called “ntephe”. It is nice if you cook it with tinned fish. [FGD1, P4]
At my house I got them used to the spinach although I don’t personally like it. I really like pumpkin leaves, and I grow it. And I also grow imbuya. [FGD3, P4]
Study participants reported that cost was the main barrier to the frequent consumption of both vegetables (75%) and fruit (74%), followed by the produce not being available in the area (vegetables 17% and fruit 20%). More than half of the participants reported that it is not easy to get affordable fresh vegetables and fruit (vegetables 58%, fruit 64%).
Participants of the FGDs mentioned that cost was a barrier to the consumption of fruit in particular:
The reason I don’t get fruit daily is the cost as they are expensive. [FGD1, P2]
I try have maybe 2-3 fruit per week. I think the hurdle with fruits is they are expensive. Sometimes one is not able to buy enough. [FGD2, P6]
Also, because some households go to town to shop only once a month, they run out of fruit:
We go once into town at the end of the month, then you stock up with fruit according to your financial means and storage at home. …We do eat them [fruit] but there comes a point where they run out. [FGD2, P7]
Vegetables and fruit were procured mostly on a weekly basis (vegetables 65%, fruit 55%), and to a lesser extent monthly (vegetables 34%, fruit
43%). As shown in Figure 1, vegetables and fruit were bought mostly at a supermarket (more than an hour away) or at nearby spaza shops (5–15 min away). More than 40% of the respondents never purchased vegetables or fruit from street vendors. Own production was a usual source of vegetables to some extent, but not fruit (Figure 1).
Growing vegetables and fruit
Of the total sample, 78% of the participants reported being involved in agricultural activities such as planting vegetables in their own gardens, mostly as a household food source. None of the households planted fruit. Participants in the FGDs mentioned various challenges that they experienced when planting vegetables. Animals such as goats, cows and chickens were a problem:
the cows come in because there is no fencing around the place. [FGD2, P7]
Adverse weather conditions and floods in the area affected vegetable gardens:
We were also growing seedlings for carrots and beetroot but during the recent KZN floods, a wall fell and whatever seedlings we had been growing were washed away. [FGD1, P1]
I had to take out the pumpkin leaves because they were dying because of hailstorm it got destroyed. [FGD2, P6]
Some participants mentioned that they would like to plant, but that lack of capacity and lack of space prevented them from doing so:
I do have a field to plant, but the land is a problem – it needs a lot of manpower, I don’t know if it needs to be ploughed by a tractor to just till it. The ground is very hard. [FGD2, P5]
I don’t want to lie – we don’t have a garden. There’s no space. [FGD1, P7]
Factors influencing food choices
Factors that influenced the participants’ choices when food shopping are shown in Table 1. When food shopping in general, the price of food items
Figure 1: Sources for usual procurement of vegetables and fruit, expressed as a percentage of the total sample (n=121).
influenced food choices for 80% of the participants. Shelf life, ease of preparation, and nutrient content were each considered by 20–30% of the participants. For both vegetables and fruit, cost was the main factor influencing the participants’ decision not to buy a specific food item, while for vegetables, availability was also a reason for 31% not to buy.
Nutrition literacy, specifically related to food choices and preparing meals, are shown in Table 2. Two-thirds (67%) of participants sometimes made unhealthy meals because they lacked money to buy healthier options. Most (75%) said shopping took too much time. Participants usually budgeted for food shopping, knew food prices, and compared costs before buying.
table 1: Factors that influence the participants’ decisions on whether to buy vegetables or fruit
table 2: Nutrition literacy, specifically related to food choices and preparing meals
Participants said that they never (47%) or sometimes (49%) buy a new food that they have heard about but not eaten before.
Knowledge on healthy eating
The participants were aware of a range of health benefits related to eating fresh vegetables and fruit, as demonstrated in Table 3
Overall, FGD participants were familiar with the benefits of healthy eating:
Healthy eating increases the immunity. [FGD1, P8]
…..vegetables build up our bodies and they protect us from various illnesses. [FGD1, P2]
I love carrots and I always say it helps my eyesight be better. [FGD3, P2]
FGD participants had a good understanding of both healthy and unhealthy food choices:
And when we talk of healthy food I think of my plate with boiled beetroot, boiled potato with skin on, a piece of boiled meat, and boiled spinach. [FGD1, P2]
When we speak of unhealthy eating I think of fried chips with a lot of sauce and vetkoeks and oily foods where the oil is visible on top. [FGD1, P2]
FGD participants were familiar with the role of water as part of a healthy diet, and were aware that salt in the diet should be limited:
…when I think of being healthy, I think of drinking water. [FGD1, P6]
….we need to use less salt in our healthy plate. It [a lot of salt] increases the BP [blood pressure]. [FGD2, P6]
However, they also had several misperceptions (inaccurate knowledge) about eating certain fruits and vegetables:
…. too much of oranges can make you get jaundice. [FGD3, P8]
Tomatoes have seeds, the seeds can get stuck on the intestines, and you end up getting ulcers, you can eat but you need to take out its water/fluid and the seeds before cooking it as is. [FGD3, P3]
sources of information on healthy eating
The main sources of information on healthy eating were nurses, radio, and TV / Internet (60–80%), followed by doctors, books, magazines and advertisements (Figure 2).
FGD participants mentioned that they received information at the clinic from the nursing sister and the doctor:
As a nursing sister she would tell me I needed to eat certain kinds of foods for good health. I would tell her some days I do have it [healthy foods] and some days I don’t. But am grateful for the health [knowledge] that I have received. [FGD3, P4]
I went to the clinic and the doctor said how are you with the salt? I then said I liked it. He said tell me what you do. I told him I add it to the food, then I add additional salt after cooking. I also add Knorrox and soup powder. Then he said gogo you need to stop that rubbish. [FGD2, P4]
FGD participants further said that they get information from a variety of media sources, such as TV, the Internet, newspapers, magazines, and radio:
We get from the TV you come across a channel to do with food, that explain how the food is and when you cook it – you should do it like this.
Figure 2: Sources of information on healthy eating.
table 3: Participants’ perceived benefits of eating vegetables and fruit (top 8 listed)
There it’s better because they are talking about something you can visualise. [FGD3, P3]
Even with the Internet although you can Google and do everything, but the picture of the finished product is there. [FGD3, P3]
Maybe you get some information from reading newspapers where they talk about health, where it’s explained what is beneficial to the body or you hear from the radio or TV. [FGD1, P6]
And magazines I am someone who likes magazines – I like reading them often. Especially if something to do with cooking. [FGD3, P2]
Factors enabling healthy eating and practices and examples of food preparation
Participants’ perceptions of factors enabling healthy eating and examples of food preparation were explored in the FGDs. The results and supporting quotes are presented in Table 4. Three main enabling factors were identified.
1. Gradual food introduction: When introducing new foods, tasting beforehand and slowly incorporating into familiar dishes was important.
2. Growing own food: Participants emphasised that growing vegetables increased consumption.
3. Fresh food preference: Participants preferred preparing fresh foods themselves rather than purchasing processed alternatives. Several practices that promote healthy eating were identified. These include the preference for fresh food, knowing how to make healthy meals, not overcooking vegetables, not peeling some foods (such as potato) and baking butternut seeds.
Discussion
This mixed-methods study reveals critical insights into opportunities for strengthening linkages between small-scale farmers and consumers to
improve local food system resilience. The quantitative data demonstrate the scope of challenges – particularly cost barriers – while qualitative findings provide crucial context about experiences and attitudes that inform potential solutions. The results of the quantitative data should not, however, be viewed as representative of the greater Inchanga area.
Fruits and vegetables are an integral part of sustainable healthy diets10, and a daily intake of more than 400 g is recommended by the World Health Organization to reduce the risk of developing non-communicable diseases9. In South Africa, this is not achievable as the availability of vegetables and fruit is not sufficient to meet these requirements.11 Low intake of fruits and vegetables has been consistently reported for South Africa, with a decrease in intake from 2005 to 201912, and is one of the leading dietary risk factors for non-communicable disease-related deaths13. In the current study, a third of participants had not eaten any vegetables or fruit the day before, reflecting an overall inadequate intake.
The most significant finding is that cost, rather than lack of nutrition knowledge, represents the primary barrier to adequate fresh produce consumption. While a third of participants consumed no vegetables or fruit the previous day, this was predominantly due to financial constraints rather than education gaps. This is in line with national data which show that cost was the major factor considered when grocery shopping.14
Although participants demonstrated a good understanding of nutritional benefits and healthy food choices, it does not necessarily translate into healthy eating behaviours. Food choices are often driven by factors other than the healthiness of the food, such as taste, traditional and health beliefs, and past childhood experiences, and, more so in lowand middle-income settings, by various contextual factors over which the individual may have little or no control.15 Changing dietary habits is therefore complex as food choices are influenced by individual, household and community factors as well as social, environmental, political and economic influences.16
With 70% of households receiving Child Support Grants – indicating very low incomes – and recent increases in food prices, households have increasingly limited resources for fresh produce purchases. Increasing fruit and vegetable intake will be challenging as these are not included in the average household food basket purchased by low-income women
table 4: Quotations supporting the focus group discussion participants’ perceived factors that enable healthy eating and food preparation practices
Perceived factors enabling a healthy diet
To eat new foods, must taste first, let family taste
Must have education about healthy diets
Growing food, we will eat more
Practices
Fresh food preferred
Know how to make healthy meals
Do not overcook vegetables
Do not peel potatoes
Bake butternut seeds
Quotes
I would add a little bit of it [new food] when I am cooking my usual food at home. [FGD2, P4]
What can make it easy for us [to] get more healthy food is for us to be educated …. Sometimes it’s knowing –how do we cook these vegetables of ours. [FGD1, P6]
I have planted lettuce, cabbage, onions, and carrots. That’s what I am able to go pick from the garden so that we have something to eat. [FGD1, P3]
Last year I planted green pepper, spinach, potatoes, …..I could sell it and also eat from it. [FGD2, P4]
We eat it more regularly if we grow the vegetables in gardens because sometimes there is sometimes no money. We eat more of it if it’s easily accessible because we have grown it. And with fruit – it’s easier to eat if you have a fruit tree. [FGD1, P1]
Quotes
I love beetroot a lot – but the one I will cook myself, not the store-bought ready-to-eat one. [FGD2, P5]
I love fruit and I always have them at home. I usually have it after a meal – maybe a banana or apple. [FGD2, P5]
..it doesn’t mean you must cook the same food day in and day out. You must vary your food. [FGD1, P3]
I believe your plate at home should be decent and have all the colours, green, yellow – have variety so that the body gets what it needs. [FGD2, P7]
I think we mustn’t over-cook our vegetables. [FGD2, P7]
I was also going to say do not peel the potatoes and butternut. [FGD1, P3]
After scooping out the seeds [butternut], you can put them in the oven [FGD1, P3]
in South Africa, and with the recent increases in the cost of the core food basket17, households will have consistently less money available to purchase them.
Although traditional nutrition education approaches on their own may have minimal impact when the fundamental barrier is economic rather than educational, promoting healthy eating through existing structures remains important.2 Nurses at the clinic were the main source of information on healthy eating, highlighting the importance of fostering a strong link between the local clinic and Woza Nami. It is further important that nutrition messages are consistent with those promoted by the Department of Health.
The study reveals a clear market opportunity that could benefit both farmers and consumers. Participants travel over an hour to supermarkets for fresh produce and report that shopping takes excessive time. Fruits and vegetables are perishable and cannot be stored for extended periods at room temperature. Participants reported that they often ran out of fresh vegetables and fruit. Meanwhile, 78% of participants engage in some agricultural activities, and the Agroecology Hub supports local farmers seeking market outlets. This represents a classic market inefficiency where supply and demand exist in the same geographical area but lack effective linkage mechanisms. Establishing local markets could simultaneously address the farmers’ need for income-generating opportunities and consumers’ need for convenient, affordable fresh produce access.5
In addition, promoting locally available African leafy vegetables can potentially improve households’ access to more-affordable nutritious food. African leafy vegetables are rich sources of certain key micronutrients, anti-oxidants and fibre and can therefore potentially improve diet quality and health.18 Furthermore, consumption of indigenous foods is part of a sustainable food system, increases biodiversity, and is part of local food habits and culture.
A change to diets that are healthier and more sustainable must include consuming more fruit and vegetables. According to economic modelling, future supply will not be sufficient in many nations to reach acceptable levels.11
As a result, a comprehensive public policy aimed at removing obstacles to the production and consumption of fruit and vegetables will be required. In particular, the findings strongly suggest a need for public policy support to facilitate farmer–consumer linkages. Current food system structures favour large-scale distribution through distant supermarkets, creating inefficiencies for both farmers seeking markets and consumers seeking affordable, convenient access to fresh produce. This would necessitate a range of interventions with a focus on increasing the production of fruit and vegetables, creating methods and technologies to cut waste without raising costs, and stepping up current initiatives to inform people about good eating habits.5 11
This provides an opportunity to create local markets for locally produced vegetables and fruit to improve the availability of and access to fresh produce within the area. Although own food production (home gardens), particularly planting vegetables, is prevalent, households experience several challenges with planting (e.g. goats, cows, chickens, lack of fencing). Initiatives focusing on increasing the production of fruits and vegetables need to strengthen current gardening practices and find solutions for problems experienced with home gardens.
Effective policy interventions would need to address multiple aspects of the farmer–consumer value chain. Infrastructure support for local market development could provide physical spaces and facilities that enable regular trading relationships between farmers and community members. Transportation and storage solutions would be essential to reduce post-harvest losses and ensure that fresh produce reaches consumers in good condition. Regulatory frameworks that facilitate direct farmer-to-consumer sales could reduce bureaucratic barriers while maintaining food safety standards.19 Perhaps most importantly, integration of local procurement into institutional feeding programmes such as schools, clinics and Early Childhood Development centres could provide farmers with reliable, bulk purchasers while simultaneously improving institutional nutrition outcomes.20
Conclusions
This study demonstrates that strengthening linkages between small-scale farmers and consumers represents a promising approach to improving local food system resilience and nutrition outcomes. The key insight is that cost rather than knowledge represents the primary barrier to adequate fresh produce consumption, suggesting that market-based solutions may be more effective than education-focused interventions alone.
The research reveals clear opportunities for local market development that could simultaneously address farmers’ economic needs and consumers’ nutritional requirements. Success will require public policy support, infrastructure development, and coordinated approaches that address both production and market challenges.
Future interventions should prioritise establishing accessible local markets for fresh produce that serve as regular meeting points for farmers and consumers. Supporting the production of affordable, culturally appropriate vegetables – particularly African leafy vegetables – would simultaneously address cost barriers whilst promoting nutritional diversity.
Developing public policies that facilitate farmer-consumer linkages represents a key structural intervention requiring coordination across multiple government levels. Integrating local food system development with health system messaging could amplify impact by aligning nutrition promotion with improved access. Finally, addressing structural barriers to small-scale production, including infrastructure, technical support and resource access, would strengthen the supply side of local food systems.
Acknowledgements
The study participants are acknowledged and thanked for their time, contribution and taking on the nutrition challenge in Inchanga. Particular thanks are extended to Carol Browne for oversight of the initial field study and Thobekile Dlamuka for completion of the fieldwork and implementation of the nutrition education programme. The staff at the Inchanga Agroecology Hub are acknowledged for orientation, contacts and hospitality in the field; members of the Woza Nami reference group for inputs; and the administrative staff at the Southern Africa Food Lab and Faculty of Agri-Sciences at Stellenbosch University for financial and logistical assistance.
Funding
This project received funding from the Nedbank Green Trust and the World Wide Fund for Nature (WWF), and the Douglas George Murray Trust (DGMT).
Data availability
The data supporting the results of this study are available upon request to the corresponding author.
Declarations
We have no competing interests to declare. We have no AI or LLM use to declare. The funders had no role in the design of the study; in the collection, analyses, or interpretation of data; in the writing of the manuscript; or in the decision to publish the results. Ethical clearance and oversight was provided by the Health Research Ethics Committee at Stellenbosch University (reference number: N21/08/081). Safety protocols for the prevention of the transmission of COVID-19 and compliance with legislation at the time were strictly adhered to. All participants signed informed consent forms for the different components of the research project. Each participant received a gift voucher as a token of appreciation for their time in completing the questionnaires. The FGDs participants each received a gift bag of dry beans, four-in-one soup mix and soya mince.
Authors’ contributions
S.D.: Conceptualisation, methodology, validation, formal analysis, investigation, resources, writing – original draft, writing – review and editing, project administration, funding acquisition. M.F.: Conceptualisation, methodology, validation, formal analysis, investigation, resources, writing – original draft, writing – review and editing, project administration,
funding acquisition. L.d.P.: Conceptualisation, methodology, validation, formal analysis, investigation, resources, writing – original draft, writing –review and editing, project administration, funding acquisition. All authors read and approved the final version.
r eferences
1. Simelane T, Mutanga S, Hongoro C, Parker W, Mjimba V, Zuma K, et al. National food and nutrition security survey: National report. Pretoria: Human Sciences Research Council; 2024 http://hdl.handle.net/20.500.11910/23338
2. May J, Witten C, Lake L. South African Child Gauge 2020: Food and nutrition security. Cape Town: Children’s Institute, University of Cape Town; 2020. Available from: https://ci.uct.ac.za/child-gauge/cg-2020-food-and-nutritio n-security
3. United Nations Children’s Fund (UNICEF). Multi-sectoral approaches to nutrition: Nutrition-specific and nutrition-sensitive interventions to accelerate progress. New York: UNICEF; 2017 [cited 2024 Jun 25]. Available from: http s://archive.ids.ac.uk/eldis/document/A101636.html
4. Bhutta ZA, Das JK, Rizvi A, Gaffey MF, Walker N, Horton S, et al. Evidencebased interventions for improvement of maternal and child nutrition: What can be done and at what cost? Lancet. 2013;382(9890):452–477. https://doi.org /10.1016/S0140-6736(13)60996-4
5. Herforth A, Harris J. Understanding and applying primary pathways and principles. Improving Nutrition through Agriculture Technical Brief Series. Results, and Innovations in Nutrition Globally (SPRING) Project [webpage on the Internet]. Arlington, VA: USAID/Strengthening Partnerships; 2014. https:/ /hdl.handle.net/10568/150507
6. Drimie S, Greenberg S, Losch B, Jiya N. Agroecological initiatives in eThekwini Metropolitan Municipality, KwaZulu-Natal. Transitions to Agroecological Food Systems Project Final Site Report [document on the Internet]. c2022 [cited 2025 Jun 25]. Available from: https://www.southernafricafoodlab.org/wp-co ntent/uploads/2022/08/TAFS-eThekwini-report-final-July-2022.pdf
7. Neufeld LM, Hendriks S, Hugas M. Healthy diet: A definition for the United Nations food systems summit 2021. In: von Braun J, Afsana K, Fresco LO, Hassan MHA, editors. Science and innovations for food systems transformation. Cham: Springer; 2023. p. 21–31. https://doi.org/10.1007/ 978-3-031-15703-5_3
8. Naude CE. “Eat plenty of vegetables and fruit every day”: A food-based dietary guideline for South Africa. S Afr J Clin Nutr. 2013;26(Suppl 3):S46–S56.
9. World Health Organization (WHO). Increasing fruit and vegetable consumption to reduce the risk of noncommunicable diseases [webpage on the Internet]. c2023 [cited 2025 Jun 25]. Available from: https://www.who.int/tools/elena/ interventions/fruit-vegetables-ncds
10. United Nations Food and Agriculture Organization, World Health Organization. Sustainable healthy diets – guiding principles. Rome: FAO; 2019. Available from: https://www.who.int/publications/i/item/9789241516648
11. Mason-D’Croz D, Bogard JR, Herrero M, Sulser TB, Cenacchi N, Dunston S, et al. Gaps between fruit and vegetable production, demand, and recommended consumption at global and national levels: An integrated modelling study. Lancet Planet Health. 2019;3:e318–e329. https://doi.org/ 10.1016/S2542-5196(19)30095-6
12. South African Department of Health (DoH). Foods procured, nutritional status and dietary intake of people living in South Africa: Desktop review. Pretoria: DoH; 2022. Available from: https://foodsecurity.ac.za/publications/foods-pr ocured-nutritional-status-and-dietary-intake-of-people-living-in-south-afric a-desktop-review/
13. Global Nutrition Report. Country nutrition profile: South Africa [webpage on the Internet]. c2021. [cited 2024 Jun 25]. Available from: https://globalnutriti onreport.org/resources/nutrition-profiles/africa/southern-africa/south-africa/
14. Shisana O, Labadarios D, Rehle T, Simbayi L, Zuma K, Dhansay A, et al. South African National Health and Nutrition Examination Survey (SANHANES-1). Cape Town: HSRC Press; 2013. Available from: https://www.hsrc.ac.za/uploa ds/pageNews/72/SANHANES-launch%20edition%20(online%20version).pdf
15. Faber M. The complexity of choosing healthy diets. S Afr J Clin Nutr. 2023;36(1):i–ii. https://doi.org/10.1080/16070658.2023.2187545
16. Chen P-J, Antonelli M. Conceptual models of food choice: Influential factors related to foods, individual differences, and society. Foods. 2020;9(12), Art. #1898. https://doi.org/10.3390/foods9121898
17. Pietermaritzburg Economic Justice & Dignity Group (PMBEJD). Household affordability index [document on the Internet]. c2022 [cited 2024 Jun 25]. Available from: https://pmbejd.org.za/wp-content/uploads/2022/03/March2022-Household-Affordability-Index-PMBEJD_30032022.pdf
18. Uusiku NP, Oelofse A, Duodu KG, Bester MJ, Faber M. Nutritional value of leafy vegetables of sub-Saharan Africa and their potential contribution to human health: A review. J Food Comp Anal. 2010;23:499–509. https://doi.org/10. 1016/j.jfca.2010.05.002
19. Gómez MI, Meemken E, Verteramo Chiu LJ. Agricultural value chains and social and environmental impacts: Trends, challenges, and policy options –Background paper for the State of Agricultural Commodity Markets (SOCO) 2020. Rome: Food and Agriculture Organization of the United Nations; 2020. https://doi.org/10.4060/cb0715en
20. Droomer L, Cooper-Bell T, Linderboom S, Scholtz K, Besada D. Implementation strategies for nutrition support to children in early learning programmes [document on the Internet]. c2023 [cited 2025 Jun 25]. Available from: https ://www.ecdreform.org.za/uploads/implementation-strategies-for-nutrition-su pport-to-children-in-early-learning-programmes.pdf
https://doi.org/10.17159/sajs.2025/19011
AuthorS: Ronél
Ferreira1 Karien Botha1
AFFILIAtIoN:
1Department of Educational Psychology, University of Pretoria, Pretoria, South Africa
CorrESPoNDENCE to: Ronél Ferreira
EMAIL: ronel.ferreira@up.ac.za
DAtES:
r eceived: 30 June 2024
r evised: 17 Apr. 2025
Accepted: 25 Apr. 2025
Published: 11 Aug. 2025
hoW to CItE:
Ferreira R, Botha K. Baseline insights into the food practices and needs of a South African resource-constrained community. S Afr J Sci. 2025;121(7/8), Art. #19020. https:// doi.org/10.17159/sajs.2025/19020
ArtICLE INCLuDES:
☒ Peer review
☐ Supplementary material
DAtA AVAILAbILItY:
☐ Open data set
☐ All data included
☒ On request from author(s)
☐ Not available
☐ Not applicable
EDItorS:
Annchen Mielmann
Leslie Swartz
KEYWorDS: food consumption behaviour, food and nutrition-related needs, health promotion intervention, resourceconstrained community, South Africa
FuNDING: University of Pretoria, Multotec
Baseline insights into the food practices and needs of a South African resource-constrained community
We report here on one phase of a broader research project that focused on the development, implementation and effect of a school-based health promotion intervention. We explored food-related practices and needs in a resource-constrained community, with the aim of developing and implementing a school-based health promotion intervention. The focus was on community practices regarding food choice, production, preparation and consumption. We followed an interpretivist qualitative approach and implemented a multiple case study design. We generated data with 45 primary school teachers (Grades 4–6) and 23 parents, sampled via criterion and snowball sampling techniques. In this article, we specifically report on the first phase of the broad research project, referring to the current food-related practices and associated needs of the participating community. We aim to contribute to the current understanding of food practices in resource-constrained contexts in South Africa, as a platform against which health promotion interventions can be designed and implemented. We argue for the importance of understanding the underlying reasons for food-related habits when wanting to address unhealthy food and nutrition-related practices. This argument confirms the importance of tailor-made interventions that can be utilised to promote healthy eating habits in specific communities, against the background and importance of broader systems and holistic transformation that can support food security on a wider level.
Significance:
Our findings highlight the specific food-related practices and needs of a resource-constrained community in South Africa. These findings can serve as baseline information to inform the development of health promotion interventions that can potentially contribute to sustainable food systems in South Africa. By grounding interventions in the expressed needs of communities, initiatives can be better tailored to local realities and more likely to support positive change. Moreover, if targeted at a specific community, interventions can encourage healthier dietary habits at ground level, thereby contributing to the broader efforts of supporting food and nutrition security goals in South Africa.
Introduction
Both scientific and non-scientific literature indicate the impacts of malnutrition, non-communicable diseases, food and nutrition insecurity, as well as hunger within sub-Saharan Africa. Scholars and practitioners should work together in addressing this global challenge at international, national, regional and local levels. Therefore, communities, academics, health services officials and public and private agencies should engage with one another to improve community-wide health – working together in developing interventions that can support sustainable food systems across the globe, but specifically in developing countries.
Several South African government policies have been put into effect in an attempt to address household food and nutrition insecurity. For example, the Integrated School Health Policy1 accentuates the implementation of health promotion interventions that can promote health and well-being throughout learners’ lives. Additionally, the Schooling 2025 document and Action Plan to 20142 prioritise health-promotion and poverty-reduction interventions. On ground level, school- and community-driven initiatives can support the implementation of such national drives.
In this article, we report on the first phase of a broader funded research project that focused on the potential role of schools in facilitating positive change. The project focused on the development, implementation and effect of a school-based health-promotion intervention on a resource-constrained community’s food-related practices. We specifically focus on the baseline data generated on the food-related practices and needs of a South African resource-constrained community, that subsequently informed the development of a health-promotion intervention. Our presentation of these findings may create a platform against which other strategies and interventions can be designed to support healthier food-related practices in related communities in the country.
In undertaking our research, we were guided by the Millennium Development Goals, and subsequent Sustainable Developmental Goals3, specifically those related to poverty, hunger, food security, nutrition and sustainable agriculture, healthy lives, well-being for all, inclusive and equitable quality education, and lifelong learning opportunities. Even though changes at various levels of the agricultural, production and social systems are required to facilitate positive transformation for food security on a broad level, we posit that focused changes in behavioural practices can contribute to eventual change, in support of the general aim of household food and nutrition security, psychosocial well-being and environmental sustainability.
Therefore, even though the existing literature indicates that interventions should move beyond a narrow focus on individual knowledge and initiatives, thereby following a transformative approach, we propose tailor-made interventions as pathways to support positive change on a broader level. We realise that changed food- and nutrition-related behaviour on a small scale, without the necessary efforts to change larger systemic drivers of food insecurity, will not necessarily result in sustainable changes on a broader socio-economic level.4 However,
https://doi.org/10.17159/sajs.2025/19020
we believe that small-scale efforts hold value as building blocks towards larger change efforts, especially if focused on the specific needs of the participants of an intervention.
Malnutrition in South Africa
The United Nations Food and Agriculture Organization indicates that sub-Saharan Africa and Asia have the highest malnutrition rates, accounting for almost 89% of the world’s most malnourished individuals.5 The average prevalence of overweight is 5% in sub-Saharan Africa, yet the prevalence of stunting is 31%. Of particular concern is the fact that 23% of all children in South Africa live in severe food poverty conditions.6 Furthermore, adults in sub-Saharan Africa face high levels of malnutrition, resulting in conditions such as diabetes and obesity.7 To elaborate, almost 69% of female South Africans older than 20 years are overweight, with nearly 44% of these being obese.8,9 These incidences are more evident in resource-constrained communities, where certain factors intensify the occurrence of malnutrition. To be more specific, resource-constrained communities in South Africa are typically challenged by poverty, unemployment, limited job opportunities and inadequate access to basic services such as running water as well as poverty-stricken hygiene and sanitary conditions, food and nutrition insecurity, and unhealthy eating habits.10,11 Food choices in these communities are typically based on cost, availability, accessibility, time restraints, culture and beliefs.12
Therefore, the prevalence of malnutrition in South African resourceconstrained communities is typically determined by factors such as inadequate access to food, limited healthcare services and an unhealthy environment, as well as broader social, economic and political forces that perpetuate poverty and inequality, neglect human rights and deny people access to essential resources.11,13 According to a report by the World Bank14, approximately 25% of the South African population was experiencing food poverty at the time of the report. The high unemployment rate in South Africa is a major contributing factor.15 In terms of unhealthy eating habits as a result of poverty, lower-income populations often struggle to access nutritional and healthy foods, as these options may be more expensive than unhealthy alternatives. To elaborate, the expenditure on meat and vegetables, for example, is six times lower in resource-constrained communities when compared to more affluent communities in South Africa.16
Many households in resource-constrained communities in South Africa face the challenge of food accessibility, rather than food availability.17 Even though South Africa is food secure on a national level, a large proportion of the population is thus vulnerable to household food and nutrition insecurity, more so amongst the black South African population.18 In an attempt to cope with household food and nutrition insecurity, people in resource-constrained communities may consume less healthy food, limit their portion sizes, or miss meals or food intake for entire days.13 18 Limited access to a variety of food stores has resulted in the eating habits of these communities often consisting of energy-dense food types that are high in carbohydrates, sugars and salts, with lower intake of fruits and vegetables. In addition, people often choose fast foods and snacks from informal vendors at affordable prices, or refined foods with a high fat content that are easy to prepare.9 19
As a result of acculturation after urbanisation, the transformed eating habits of South Africans residing in urban, resource-constrained communities are characterised by an increased consumption of proteins, fats, salts and sugar. Additionally, the intake of plant proteins, dietary fibre and complex carbohydrates has generally decreased.20,21 These individuals often follow eating patterns that include refined grains, starchy vegetables, added fats and sweets11, with the majority of the monthly food budget being spent on maize, chicken and bread22. Furthermore, sugar, tea, milk, white bread, non-dairy creamer, margarine, potatoes and green leafy vegetables are regularly consumed in such communities.19 23
Ecological perspective on community food practices
The state of food and nutrition insecurity in South Africa can be explained in terms of Bronfenbrenner’s24 Ecological Systems theory25 26
To elaborate, food and nutrition insecurity at the household level (microsystem) can be ascribed to factors such as insufficient food production at household level together with a reliance on purchased food. In addition, food and nutrition insecurity can result in households having to cope with additional costs related to transport to medical facilities, as well as medical and/or even funeral expenses.26 At the macrosystem level, high unemployment rates result in reduced food purchasing practices.24 25 Furthermore, the greater community may, as a result of food and nutrition insecurity, be faced with challenges such as crime and the cost of additional law enforcement (mesosystem).24,25 At the macrosystem level, external investments may be limited due to the effect of food and nutrition insecurity. This may in turn negatively impact the microsystem, as a negative impact on the South African rand (local currency) may lead to an increase in food and living costs, with these factors and influences resulting in an upwards spiral that is difficult to address.25 26
Methodology
We adopted interpretivism as a meta-theory based on the possibility of obtaining information-rich, in-depth data on the perceptions, opinions and experiences of the participants.27 We followed a qualitative approach which enabled us to obtain a rich, detailed understanding28 of the food-related practices and needs of the community.
research design and selection procedures
According to Creswell29, case study designs allow for thick descriptions and an in-depth understanding of specific social phenomena, events or people. We implemented a multiple case study design30 involving three primary schools (three cases) in a resource-constrained community situated in Gauteng, South Africa. All three schools are classified as so-called ‘low-quintile’ South African schools, characterised by less available resources.1 We selected two groups of participants: applying criterion sampling27 28 to select 45 Grade 4–6 teachers employed at the participating schools and snowball sampling27 28 to select 23 parent-participants associated with the schools. An overview of the participants is included in Table 1
The two groups of participants provided baseline information that ultimately informed the development of a health-promotion intervention. The intervention was later implemented in the three schools with all the Grade 4 to 6 learners. The baseline data that we report on concerns the two groups of participants’ perceptions of the food-related practices and needs of the community prior to implementation of the intervention, in terms of the community’s choice, production, preparation and consumption of food. During this phase of the broader project, we worked alongside two master’s in education students who formed part of the research team.
data generation, documentation and analysis
We applied Participatory Reflection and Action (PRA) principles during the qualitative data generation process.31 The decision to follow PRA principles was based on the possible value of the active involvement of participants, which could in turn become a source of power to them through access to new knowledge and skills.31 We were therefore able to involve different groups of participants, representative of different social ecologies or systems within the participating community.
table 1: Participants in the study
We followed a multi-method data-generation approach. To determine the baseline information for the broader project, we facilitated two series of PRA-guided work sessions – one with teachers and one with parents. Each group of participants was involved in three data-generation sessions of 2 h each. For these sessions, small groups of participants discussed certain prompts posed to them, while capturing their views in the form of PRA-matrices, after which they reported their ideas to the larger group of participants, entering into a discussion on the topic on the table.31
In support, we relied on observation-as-context-of-interaction32, audiovisual techniques33, field notes28 and reflective journals28. Reflexivity enabled us to continuously reflect on the research process and what was obtained in the field, remaining aware of our focus. Throughout, we acknowledged that we entered the research field with our own frames of reference, guarding against these influencing our actions and interpretations.
We then completed a reflexive thematic analysis.34 This data analysis and interpretation approach implied a dynamic and systematic, continuous learning process, during which we came to new insights as the study progressed. The purpose was, firstly, to understand the participants’ experiences and the manner in which they constructed meaning; secondly, to describe the diversity and variety of the participants’ experiences; thirdly, to strengthen the participants’ voices; and finally, to study individuals in their natural contexts.33
ethics
We followed the guidelines for ethical research, as stipulated by the Declaration of Helsinki. We thus attended to the principles of ethical awareness, protection of human rights and social justice, with our ethical decision-making being informed by reflexivity, shared dialogue and collegial consultation with co-researchers to ensure ethically justifiable research.34
We gained the necessary ethics approval and permissions from the University of Pretoria Ethics Committee (UP12/09/02), the national Department of Basic Education (D2016/339A) and the principals and governing bodies of the selected schools before commencing with our research. In obtaining informed consent from the participating teachers and parents, we informed them about the nature, procedures and potential consequences of the study, their right to voluntary participation and the option to withdraw. We honoured the principle of respect and obtained consent for participation, the recording of discussions, observing the participants and taking photographs.35
Information required
Information on what healthy eating entails and the consequences of unhealthy eating habits
Information on different types of food and nutrients, in relation to illnesses
teachers’ views
Information on food in relation to general health concerns
We respected the ethical principles of beneficence, by not exposing participants to dangerous situations and preventing them from being harmed in any way; of privacy, by dealing with all information confidentially; of anonymity, by protecting the identities of the participants and safekeeping all data sources; and avoidance of deception, by not misleading the participants or misrepresenting any information.35
r esults
We identified four main themes concerning the food and nutrition-related practices and associated needs of the selected community.
Critical need for knowledge about healthy dietary habits
Both the teachers and parent-participants indicated the need for the school community to be better informed about healthy dietary habits. They referred to information pertaining to various related aspects, as captured in Table 2
The examples captured in Table 2 attest to the critical need for community members to be informed about healthy dietary habits, for them to be able to guard against general illnesses and live healthier lives. Some of the teachers referred to specific examples of information required that could guide community members, such as guidelines on not to consume junk food, to eat fruits and vegetables, to choose white instead of red meat, brown instead of white sugar, Rooibos or green tea instead of coffee, water instead of fizzy drinks, and olive instead of sunflower oil. In support, the parents referred to several general health concerns, emphasising their need for information on how to avoid and treat these. In the words of one of the parents:
We need information on what we can do and eat to prevent us from getting sick need to get information about what can happen to you if you are obese, what can happen to your body, your blood sugar levels, your blood pressure…… also need information on where they can get effective medical help, what they must eat and what they must avoid……how they can live and eat healthier even if they don’t have a lot of money.
Overall, Theme 1 therefore emphasises the need for health-promotion interventions to include an educational component that deals with basic information on healthy eating and what this entails. More specifically, people need to be informed about healthy, affordable food options and the value of specific nutrients. In gaining such knowledge, communities
Parents need workshops and training about healthy food and balanced diets. The parents in our community don’t eat healthy because they don’t have the correct information
They must know what is going to happen to you if you continue to eat fast food and unhealthy food every day.
Parents’ views
… many of us who would like to learn more about healthy eating and what we can do to support our neighbours or even our own family members ... information on why vitamins are important with specific examples ... learn that there are food that build your body, food that is good for growth etc.
If my neighbour is obese or my mother has cancer, I want to learn what food will be the best to support them
We would like to know more about what type of food we can eat to prevent diseases like diabetes, high blood [pressure], cancer and heart diseases.
Which food can help your digestive system, or with constipation?
Pregnant girls... if these women and girls know what to eat and do, they eat good food, because the baby develop[s] according to what the mother eats.
… want to know about expecting [expectant] mothers, what must they eat?
If you’re obese, what kind of food should you eat?
table 2: Need for information on healthy dietary habits
can be supported to prevent diseases from occurring and aspire to use healthy eating as an avenue to overall well-being and support.
Needs related to food production
The second theme focuses on the community’s need for guidance on food production, with a strong emphasis on initiating and maintaining home-based vegetable gardens. Both the teachers and parents saw this as a pathway to address the challenges related to food availability and affordability, yet acknowledged that successful gardening would require specialised knowledge and skills. In the teachers’ view: “Our community members need a professional somebody to teach them about good food production techniques … to be able to produce their own food.”
The teachers seemed willing and able to provide some guidance to the community themselves, stating that they could “inform them about good food production techniques and we can provide them with guidance on aspects such as nutrition”.
The participants engaged in lengthy discussions about home-based vegetable gardens. Despite many parents sharing their experiences of vegetable gardening, they identified a need for information on the following specific aspects:
• Garden planning and maintenance:
Can learn how to start a vegetable garden at home where they can plant vegetables such as spinach, maize, cabbage and other vegetables spinach, tomatoes, onions, carrots, cabbage and beetroot.
The maintenance of a vegetable garden is something we want to learn about.
We know some basic things but want to learn strategies we can use to be successful. If we know how to maintain our vegetable gardens effectively, we will be able to produce more food for ourselves and other community members
• Soil preparation and compost:
… be able to identify the different soil types.
How do we have to prepare the soil in order to produce good vegetables from our garden?
Information on compost for gardening and how to produce this.
• Pest and disease control:
How can we manage pests such as insects that eat our vegetables?
What can we do to get rid of these worms?
• Food production skills:
Want to be informed about the seasonal production and planting of vegetables; about small-scale farming and the acquisition of farming skills.
This will empower community members and might also give them a source of income
As background to these needs, the participants mentioned several benefits of home-based vegetable gardens, such as food provision, enrichment of the school feeding scheme, the possibility of income generation and community cohesion. In this regard, for example, they said:
If we have vegetable gardens at home we can start contributing to our neighbours and to the school feeding scheme here at the school. Some people can even sell their vegetables.
Many older community members are in need of food, especially health food such as vegetables.
Home-based vegetable gardens can bring a community together
In summary, Theme 2 captures the need for health-promotion interventions to include a food production component, focusing on topics such as home-based vegetable gardening skills. In addition to including
information on the topic, the acquisition of skills was regarded as important for the resource-constrained community to benefit from such an intervention. In addition to valuing home-based vegetable gardens for food provision, the participants seemingly recognised the potential value of this action for resilience and even dignity, enabling people to provide for their own families as well as others in the community.
Needs related to food preparation
The third theme relates to the way in which food is prepared in the community, which often diminishes the nutritional value or contributes to health problems, because community members do not have the necessary knowledge and/or skills. The participants identified specific examples of unhealthy food preparation practices on which the community required guidance, as captured in Table 3
According to the teacher-participants, community members therefore require directed guidance on healthy food preparation practices. They stated that, “...community members need somebody who can teach them how to prepare food in a healthy way”. The teachers indicated healthy and alternative cooking methods as an important possible topic of discussion, saying that, “Steaming is encouraged, as well as grilling and baking.” Other teachers added that community members could benefit from information on suitable cooking times in order to avoid over-cooked meals, saying that, “they should actually know the importance of boiling and also when you boil you mustn’t over boil”. The parent-participants agreed and indicated that community members could benefit from information on healthy food preparation practices, to be able to preserve nutrients when cooking. They said: “We want to learn how to cook and bake in a healthier way, … need information on different cooking methods and the right manner to cook food.”
The teacher-participants also referred to the need for community members to learn how to read and interpret the information on food labels, for them to be able to prepare healthy meals. They indicated the importance of people knowing how to check expiration dates and preservatives added to food products. Parent-participants shared this view and emphasised their need to understand the expiration dates of canned foods and the reasons for cans sometimes expanding when still within the expiration date. Closely related, both the teachers and parents indicated that community members had to be informed about the storage and preservation of food, saying that, “They should learn how to preserve dry food more, like dry spinach and dry biltong.”
unhealthy food preparation practice
Unhealthy cooking methods
Excessive use of salt and seasoning
Participants’ views
Most people like frying all the time
Even vegetables or maize porridge are sometimes fried or cooked with added fat for extra flavour
They overcook vegetables or starches, and then add lots of oil/salt afterwards
… boil the chicken, then we put lots of spice on it and then we fry it
They add a lot of salt, stock cubes, or spicy seasonings
Oil is used in almost every meal
Healthier oil is too expensive
Using cheap oils and fats
Food hygiene and storage
We need information on healthy types of cooking oils so that they don’t only buy the cheapest available oil
Many households lack refrigerators, so leftovers are not kept safe
table 3: Topics related to food preparation practices
In summary, Theme 3 foregrounds the importance of including a section on healthy food preparation methods when developing health-promotion interventions for resource-constrained communities. By focusing on healthier cooking methods and the ingredients used in dishes, people can be guided to retain nutrients when preparing food and, in the process, reduce risk factors. Even though certain habits may have been established in such communities, knowledge of alternative food preparation methods may facilitate positive change.
Factors affecting the community’s food practices and needs
The final theme captures the contextual factors affecting the community’s practices and needs, as discussed in the previous themes. Both the teachers and parents were aware of the fact that systemic issues such as poverty, unemployment and the local food environment determine the food choice, production, preparation and consumption behaviour of the community, thereby resulting in the related need for guidance.
Poverty was foregrounded as a prominent factor affecting the community’s food and nutrition-related practices and needs. Participants described the cycle of poverty leading to a lack of sufficiently healthy food items or the consumption of cheap alternatives, which in turn results in malnutrition and poor health. In this regard, a teacher said: “Poverty causes hunger and malnutrition, as it determines the food consumption practices of community members across the ages.” In concrete terms, households with a limited income will focus on obtaining food that is affordable and accessible – regardless of its nutritional value. This may lead to the consumption of high volumes of maize meal, bread or inexpensive snacks sold by street vendors.
Closely related, the participants linked poverty to unhealthy dietary practices in the community, specifically the tendency to not consume breakfast on a daily basis. They indicated that: “Many people that live in this community don’t eat breakfast” and that “There are several kids and parents in our community that don’t eat anything at all early in the morning”. For those who did eat breakfast, foods rich in carbohydrates were commonly consumed, or alternatively, food that was left over from a previous day. This trend is evident from contributions such as the following:
At home most of the time we eat porridge, bread and we drink tea.
Community members usually eat pap … or the previous night’s leftovers. Some of them will eat pap and meat and some will eat pap and tea, and 80% of families in our community eat tea and bread.
Poverty similarly affected the food consumed during lunch and dinner. For lunch, families reportedly preferred carbohydrates with some vegetables. The participants indicated that, “Community members usually eat pap with cabbage or potatoes, beans or tomatoes” and “…pap with vegetables such as spinach and cabbage”. The teacher-participants reported that the children of the community were, however, “…eating here at the school … all the schools in our community have a feeding scheme where learners are being fed from”. For dinner, community members similarly preferred carbohydrates (such as maize meal, bread and rice), vegetables and, in addition, a protein (such as chicken, fish and Mopani worms). They would, for example, eat “chicken feet and chicken neck, with pap or sometimes just pap and morogo”; “…starches such as rice and vegetables such as cabbage, with chicken necks” and “…usually eat samp and beans, and sometimes fish or chicken, especially the braai pack”. Community members occasionally added meat to their meals, in the form of “ gizzards, chicken livers, chicken heads and chicken necks, or tin fish (with pap)”. Mention was further made of unhealthy fast food as popular lunch options, such as sphatlo (bread with fillings such as atchar, cold meat and chips), bunny chow (a quarter loaf of white bread with fried potato chips as main filling) and spikos (usually eaten on bread, consisting of atchar, tinned fish, polony and tinned spaghetti).
Even though unemployment, poverty and the local food environment therefore have negatively affected the food- and nutrition-related
practices of the community, this theme emphasises some level of resilience, with individuals doing what they can to cope with what they have. This highlights the importance of health-promotion interventions being realistic and context-sensitive, following an ecological approach when wanting to address the needs of a specific community.
Discussion
The baseline data discussed in the previous section informed our development of the health-promotion intervention that was implemented at the participating schools. These findings may also inform related interventions in future, with the aim of supporting change at ground level, potentially impacting sustainable food systems on a broader level. By considering the practices and needs of resource-constrained communities, strategies can be identified to facilitate positive small-scale change, as a pathway to change on a broader level.
Firstly, the participants in our study indicated the need for basic information on nutritious dietary habits as well as the consequences of unhealthy eating habits. In this regard, the South African Departments of Basic Education36 and Health37 confirm that a lack of sound food and nutrition-related knowledge can increase unhealthy eating habits, and negatively affect nutrition-related perceptions and practices. Existing research indicates that food- and nutrition-related knowledge can be enhanced through focused interventions, thereby potentially improving the nutritional status of South African resource-constrained communities.36 37 Knowledge, as well as the application of knowledge, will not merely benefit the health and well-being of resource-constrained communities but can also support sustainable food systems on a broader level.
Secondly, our research indicates that resource-constrained communities can benefit from guidance on food production and consumption. This finding correlates with the principles of the Sustainable Food Production Programme36, indicating that schools can support communities by providing individuals with knowledge and skills on food production and the sustainable use of natural resources. Therefore, leaders of supportive community-based initiatives can rely on community stakeholders as possible change agents. A suitable focus for interventions is community/ home-based vegetable gardens, which may support food production in a community, thereby addressing malnutrition and household food and nutrition insecurity while potentially creating a source of income. Such interventions can be informed by the work of Roseman and colleagues38, who emphasise the importance of a focus on nutrition-related knowledge, healthy food choices, access to healthy food options and improved food production skills.
Thirdly, our research confirms that resource-constrained communities can benefit from guidance on healthy food preparation. Therefore, future interventions can cover topics such as healthy cooking, the use of seasoning, and the interpretation of food labels and nutrition-related information. Our findings on food consumption practices can similarly inform the content of interventions aimed at improving sustainable food-related practices in resource-constrained communities. More specifically, alternative food options and portion guidelines can support community members to make better choices when selecting products or producing food. Healthier food-related practices at ground level may in turn pave the way for positive change on a broader level, in support of sustainable food systems.
Finally, by considering the factors affecting the food- and nutrition-related practices of resource-constrained communities, leaders of future interventions can consider real conditions when determining the content of initiatives for a specific context. By considering the impact of poverty as a root cause of malnutrition and household food insecurity14, food-related habits can be encouraged that are affordable yet healthy, providing alternatives to cheaper, unhealthy options characterised by reduced nutrients.
Conclusion
When wanting to address unhealthy food- and nutrition-related practices, it is important to consider the underlying reasons for these habits. In resource-constrained communities, the availability, accessibility and limited consumption of healthy food are strongly influenced by poverty.
https://doi.org/10.17159/sajs.2025/19020
In the same way, the frequency of household meal consumption will affect household food security, which is once again influenced by factors such as unemployment and poverty.
This argument confirms the importance of tailor-made interventions to promote healthy eating habits in specific communities. If targeted at a specific community, such interventions can encourage nutritious dietary habits, healthy food production and preparation, as well as the establishment of e.g. vegetable gardens for food production. In particular, the inclusion of targeted information in interventions is underscored by our research, with healthy lifestyle practices on ground level and the strengthening of sustainable food systems on a broader level, as potential outcomes.
Acknowledgements
We acknowledge Deliwe Maria Kumalo (MEd Educational Psychology) and Elzaan Smuts (MEd Educational Psychology), who completed their master’s studies under our supervision as part of the broader research project, for fulfilling the role of field workers and co-researchers.
Funding
The Institute for Food, Nutrition and Well-being (IFNuW) at the University of Pretoria and Multotec are thanked for providing funding.
Data availability
The data supporting the results of this study are available upon request to the corresponding author.
Declarations
We have no competing interests to declare. We have no AI or LLM use to declare. This work is based on K.B.’s PhD thesis entitled ‘Development and implementation of a school-based health promotion intervention in a resource-constrained community’.39
Authors’ contributions
R.F.: Conceptualisation, methodology, data collection, sample analysis, data analysis, validation, writing – the original draft, writing –revisions, student supervision, project leadership, funding acquisition. K.B.: Conceptualisation, methodology, data collection, sample analysis, data analysis, validation, data curation, writing – the original draft, student supervision, project management, funding acquisition. Both authors read and approved the final manuscript.
r eferences
1. South African Department of Health, Department of Basic Education. Integrated school health policy. Pretoria: Government Printers; 2012.
2. South African Department of Basic Education. Guidelines for full-service/ inclusive schools. Pretoria: Government Printers; 2010.
3. United Nations. The 2030 Agenda and the Sustainable Development Goals: An opportunity for Latin America and the Caribbean (LC/G.2681-P/Rev.3). Santiago: United Nations; 2018.
4. Battersby J, Haysom G. Linking urban food security, urban food systems, poverty, and urbanisation. In: Battersby J, Watson V, editors. Urban food systems governance and poverty in African cities. London: Routledge; 2018. p. 56–67.https://doi.org/10.4324/9781315191195-4
5. FAO, IFAD, UNICEF, WFP, WHO. The state of food security and nutrition in the world 2019: Safeguarding against economic slowdowns and downturns. Rome: FAO; 2019.
6. UNICEF. Child food poverty. Nutrition deprivation in early childhood. Child Nutrition Report. New York: UNICEF; 2024.
7. UNICEF, WHO, World Bank. Levels and trends in child malnutrition: Key findings of 2021 malnutrition estimates. Geneva: World Health Organization; 2021.
8. Otang-Mbeng W, Otunola GA, Afolayan AJ. Lifestyle factors and co-morbidities associated with obesity and overweight in Nkonkobe Municipality of the Eastern Cape, South Africa. J Health Popul Nutr. 2017;36, Art. #22. https:// doi.org/10.1186/s41043-017-0098-9
9. Goetjes E, Pavlova M, Hongoro C, Groot W. Socioeconomic inequalities and obesity in South Africa – A decomposition analysis. Int J Environ Res Public Health. 2021;18(17), Art. #9181. https://doi.org/10.3390/ijerph18179181
10. United Nations Development Programme (UNDP). The impact of social and economic inequality on economic development in South Africa. New York: United Nations; 2014.
11. Govender L, Pillay K, Siwela M, Modi A, Mabhaudhi T. Food and nutrition insecurity in selected rural communities of KwaZulu-Natal, South Africa: Linking human nutrition and agriculture. Int J Environ Res Public Health. 2016;14(1), Art. #17. https://doi.org/10.3390/ijerph14010017
13. Siddiqui F, Salam RA, Lassi ZS, Das JK. The intertwined relationship between malnutrition and poverty. Front Public Health. 2020;8, Art. #453. https://doi. org/10.3389/fpubh.2020.00453
14. World Bank. Comparability over time at the country level for international poverty measures. Washington, DC: World Bank Group; 2019.
15. Statistics South Africa. Quarterly labour force survey 2024. Pretoria: Statistics South Africa; 2024.
16. Napier C, Warriner K, Sibiya MN, Reddy P. Nutritional status and dietary diversity of pregnant women in rural KwaZulu-Natal, South Africa. Health SA. 2019;24, Art. #1114. https://doi.org/10.4102/hsag.v24i0.1114
17. UNICEF. Children, food and nutrition: Growing well in a changing world. New York: UNICEF; 2019.
18. Wing J, Jivan D. Targeting composite treatment of type 2 diabetes in middleincome countries – walking a tightrope between hyperglycaemia and the dangers of hypoglycaemia. S Afr Med J. 2015;106(1):57–61. https://doi.org /10.7196/SAMJ.2016.v106i1.10284
19. Govender L, Pillay K, Siwela M, Modi AT, Mabhaudhi T. Assessment of the nutritional status of four selected rural communities in KwaZulu-Natal, South Africa. Nutrients. 2021;13(9), Art. #2920. https://doi.org/10.3390/nu13092920
20. Faber M, Kunneke E, Wentzel-Viljoen E, Wenhold F. Dietary intake assessment – 24 hour recall. Pretoria: DST-NRF Centre of Excellence in Food Security/South African Medical Research Council; 2016.
21. Drewnowski A, Kawachi I. Diets and health: How food decisions are shaped by biology, economics, geography, and social interactions. Big Data. 2015;3(3):193–197. https://doi.org/10.1089/big.2015.0014
22. Martins JH. The household food budget of the wealthy and the poor in South Africa. J Fam Ecol Consum Sci. 2005;33:37–45. https://doi.org/10.4314/jfe cs.v33i1.52867
23. Napier C, Oldewage-Theron W. Dietary intake and nutritional status of adolescent girls and young women in Durban, South Africa. J Fam Ecol Consum Sci. 2015;43:1–15. Available from: https://www.ajol.info/index.ph p/jfecs/article/download/116672/106254/0
24. Bronfenbrenner U. The ecology of human development: Experiments by nature and design. Cambridge, MA: Harvard University Press; 1979. https: //doi.org/10.4159/9780674028845
25. Eriksson M, Ghazinour M, Hammarström A. Different uses of Bronfenbrenner’s ecological theory in public mental health research: What is their value for guiding public mental health policy and practice? Soc Theory Health. 2018;16:414–433. https://doi.org/10.1057/s41285-018-0065-6
26. Suwannawong PR, Auemaneekul N, Powwattana A, Chongsuwat R. Ecological system theory and community participation to promote healthy food environments for obesity and NCD prevention among school-age children. Public Health Nutr. 2023;26(7):1488–1500. https://doi.org/10.101 7/S136898002300040X
27. Denzin NK, Lincoln YS, editors. The Sage handbook of qualitative research. 4th ed. Thousand Oaks, CA: Sage; 2011.
28. Flick U. An introduction to qualitative research. Thousand Oaks, CA: Sage; 2022.
29. Creswell JW. Educational research: Planning, conducting, and evaluating quantitative and qualitative research. Upper Saddle River, NJ: Pearson; 2015.
30. Yin RK. Applications of case study research. 3rd ed. Los Angeles, CA: Sage; 2012.
31. Chambers R. Can we know better? Reflections for development. Rugby: Practical Action Publishing; 2017. https://doi.org/10.3362/978178044944 9.000
32. Angrosino MV, Mays de Perez KA. Rethinking observation: From method to context. In: Denzin NK, Lincoln YS, editors. Handbook of qualitative research. 2nd ed. Thousand Oaks, CA: Sage; 2000. p. 673–702.
33. Bless C, Higson-Smith C, Sithole SL. Fundamentals of social research methods: An African perspective. Cape Town: Juta & Company; 2013.
34. Braun V, Clarke V. Thematic analysis: A practical guide to understanding and doing. London: Sage; 2021.
35. Haverkamp BE. Ethical perspectives on qualitative research in applied psychology. J Couns Psychol. 2005;52(2):146–155. https://doi.org/10.103 7/0022-0167.52.2.146
36. South African Department of Basic Education. Action plan to 2014: Towards the realisation of schooling 2025. Pretoria: Government Printers; 2011.
37. South African Department of Health. The national health promotion policy and strategy 2015–2019. Pretoria: Government Printers; 2014.
38. Roseman MG, Riddell MC, Haynes JN. A content analysis of kindergarten–12th grade school-based nutrition interventions: Taking advantage of past learning. J Nutr Educ Behav. 2011;43(1):2–1. https://doi.org/10.1016/j.jne b.2010.07.009
39. Botha CJ. Development and implementation of a school-based health promotion intervention in a resource-constrained community [PhD thesis]. Pretoria: University of Pretoria; 2022. https://repository.up.ac.za/handle/22 63/87741
https://doi.org/10.17159/sajs.2025/19020
AuthorS: Lisa-Claire Ronquest-Ross1 Gunnar O. Sigge2
AFFILIAtIoNS:
1v2food, Bulimba, Queensland, Australia
2Department of Food Science, Stellenbosch University, Stellenbosch, South Africa
CorrESPoNDENCE to: Lisa-Claire Ronquest-Ross
EMAIL: lisaronquest@gmail.com
DAtES:
r eceived: 27 Oct. 2023
r evised: 28 Apr. 2025
Accepted: 30 Apr. 2025
Published: 11 Aug. 2025
hoW to CItE: Ronquest-Ross L-C, Sigge GO. Mapping underutilised and emerging food sources and technologies as solutions to food insecurity in South Africa. S Afr J Sci. 2025;121(7/8), Art. #17116. https://doi.org/10.1715 9/sajs.2025/17116
ArtICLE INCLuDES:
☒ Peer review
☐ Supplementary material
DAtA AVAILAbILItY:
☐ Open data set
☐ All data included
☒ On request from author(s)
☐ Not available
☐ Not applicable
EDItorS: Annchen Mielmann Leslie Swartz
KEYWorDS: South Africa, underutilised and emerging foods, affordable food, nutritious food
Mapping underutilised and emerging food sources and technologies as solutions to food insecurity in South Africa
There are clear signs that the South African food system is failing as we experience increasing trends in hunger, rising food costs, lack of dietary diversity, child stunting, foodborne illnesses, food waste and an obesity epidemic coupled with malnutrition. A literature review was conducted to identify underutilised or emerging new food sources and technologies (UEFST). They were identified as indigenous African crops (IACs), insects, fermentation, cultured meat and seafood, food waste recovery and algae. Criteria were developed to assess these UEFST to evaluate their ability to provide affordable, nutritious, safe and relevant food for South Africans (ANSSA). A survey was conducted with food professionals from industry, academia and government to evaluate these UEFST against the ANSSA criteria. Findings indicate that the two most promising UEFSTs – IACs and food waste recovery – could be available to South Africans within three to five years. These sources were rated highest in their ability to meet the ANSSA criteria identified. The two underutilised or emerging food sources with the longest time frame to commercialisation were cultured meat and seafood and algae (5 to 10 years), with cultured meat and seafood scoring the lowest of all six UEFST against the ANSSA criteria.
Significance:
• Underutilised and emerging food sources offer South Africa new solutions to address food security.
• Indigenous African crops and recovery and valorisation of food waste are the most promising short-term options to address food security.
• South African stakeholders from academia, government and industry will need to invest in research, product development, capability-building, scale-up and an agile regulatory environment for these underutilised and emerging food sources to reach commercialisation.
Introduction
South Africa emerged from an oppressive apartheid system in 1994, and more than 30 years of democracy later, over half of the population still lives in poverty.1 Levels of inequality have remained high, and South Africa remains one of the most unequal countries in the world.1 Unemployment in 2024 was 32% and remains a pressing national challenge.2
One in five South African households (21%) in 2021 was affected by moderate to severe food insecurity.3 Poorer households can spend more than 40% of their total expenditure on food compared to the national average of 13%.4 Data from the Household Affordability Index indicate that a minimum nutritious food basket is unaffordable for most low-income South Africans.5
Food consumption patterns have changed and will continue to change dramatically over the coming decades in South Africa.6 Ronquest-Ross et al.7 concluded that food consumption shifts have been towards sugar-sweetened beverages, processed and packaged food, animal-source foods, added caloric sweeteners and away from vegetables.7 These dietary shifts are concerning as they relate to public health.7 Poor diet contributes to four of the top ten death and disability risk factors.8 The prevalence of obesity is pervasive in South Africa, with 68% of women either overweight or obese.9 In 2021, 11% of the adult South African population had diabetes.10 Unfortunately, South Africa has made limited progress in reducing stunting in children under five years, with 21% stunted.11 Even though the SANHANES-18 survey indicates that anaemia and iron status have improved, poor micronutrient status, especially vitamin A and iron, is still common among young children.4
South Africa’s food system contributes 15–20% of greenhouse gas emissions.12 Although 80% of South African land is suitable for livestock farming, overgrazing on erosion-prone soils has led to widespread land degradation, dramatically reducing soil carbon storage.13 Food production and processing are energy intensive, especially in a country dependent on coal-fired energy sources, and thus substantially increase the system’s carbon footprint.13 South Africa is a water-scarce country with water security becoming a crisis.14
Tubb and Seba’s15 RethinkX report suggests we are on the edge of transformational food and agricultural production disruption. This results in uncoupling from land and sea resources to novel protein sources derived from bacteria, yeasts and fungi.15-17 This will be achieved through rapid advances in synthetic biology and precision fermentation, enabling microorganisms to produce almost any complex organic molecule. A study by Ronquest-Ross et al.18 indicated that, while South African food and beverage manufacturing appears to be keeping pace with the advances in food manufacturing in the areas of automation, process and quality control, material handling and centralised distribution centres with warehouse management systems, there is a low adoption and commercialisation of novel technologies. However, recently, foodtech start-ups focused on precision fermentation and cultured meat and seafood have been established in South Africa.19 Several countries have put in place strategic food system transformation action plans to address climate change and food security. For example, Denmark launched the
https://doi.org/10.17159/sajs.2025/17116
Danish Action Plan for Plant-based Foods in 2023 to address climate, environmental and nutritional challenges.20
It is evident that the South African food system is failing as we experience increasing trends in hunger and malnutrition, rising food costs, a lack of dietary diversity, child stunting, foodborne illnesses, an obesity epidemic coupled with negative climate impacts and environmental degradation. There is a need to develop renewable and sustainable sources of food.21 Underutilised or emerging food sources and technologies (UEFST) present potential solutions to South Africa’s food security challenges and could deliver beneficial changes to its food system.
The objective of this study was to identify which UEFSTs have the potential to be able to address food security and environmental issues in South Africa and to provide recommendations to enable this transition. The findings of this study could help key stakeholders in government and academia and those along the food value chain to prepare for or enable acceleration in research, advance scale-up infrastructure, and enable regulatory and/or policy frameworks to support the commercialisation of these potential future food solutions for South Africa.
Materials and methods
Literature review
A literature review was conducted to identify UEFSTs that could potentially provide solutions to delivering safe, affordable and nutritious foods for vulnerable South Africans. These food sources and technologies were then evaluated based on their positive and negative inherent properties (such as nutritional value, food safety and organoleptic properties) as well as the drivers and barriers to reaching commercialisation related to
achieving scale, consumer adoption, regulatory considerations and food system impact.
Quantitative expert survey
A quantitative study was conducted to gain insight from South African food science and technology professionals on the potential of these UEFSTs to provide affordable, nutritious, safe food products. The question was defined so that respondents could familiarise themselves with the six underutilised or emerging food sources. The survey (Table 1) was designed around criteria related to affordability, nutrition, safety, consumer acceptance and regulatory environment (referred to as ANSSA criteria – Affordable, Nutritious, Safe, relevant for South Africans). The ANSSA criteria (Table 2) were designed to evaluate those UEFSTs most likely to be produced locally at scale, to be accepted by South Africans, and to enable a sustainable and affordable diet while improving the population’s health. A question was also included to understand the time horizon for commercialisation in South Africa. The survey consisted of 14 questions. The criteria were rated on a 4-point Likert scale, where 4 = strongly agree, 3 = agree, 2 = disagree and 1 = strongly disagree.
recruitment of experts
We identified experts from government, industry and academia through our professional networks (Figure 1). They were selected for their experience and skills related to the South African food and beverage industry and food science and technology.
Ethical approval was obtained from Stellenbosch University’s Ethics Council on 15 July 2021 with project number 22423 before the commencement of the research process. We extended an invitation
table 1: Survey questions and definitions of underutilised or emerging food sources and technologies
Number Question
1 Indicate the field you work in. Options: industry, academia, government
2 Area of expertise? Options: indigenous African crops, insects, biomass fermentation, genetic engineering, cellular agriculture, food waste, algae, other
3 These underutilised or emerging food sources are affordable, as they could reach scale quickly (Definition: Can reach the mass market at scale)
4 These underutilised or emerging food sources are affordable, as they can be locally produced and processed (Definition: This food source can be locally produced and processed in South Africa)
5 These underutilised or emerging food sources are affordable, as the level of investment required will be achievable (Definition: The capital and resources needed to set up production and processing facilities are available or can be easily sourced)
6 These underutilised or emerging food sources are affordable, as there are the necessary stakeholders and capabilities available (Definition: There is sufficient stakeholder alignment and support as well as capabilities and related skills available to be able to research and industrialise this food source)
7 These underutilised or emerging food sources are nutritious due to their inherent nutritional profile (Definition: The nutritional profile is favourable in terms of overall protein, fat, carbohydrate, fibre, vitamin and mineral content)
8 These underutilised or emerging food sources are safe, as they do not pose an insurmountable allergen, toxicological or microbial risk (Definition: These allergens, toxicological or microbial risks would be a concern for human health)
9 These underutilised or emerging food sources are safe, as processing has been proven to effectively reduce any inherent food safety risks in this food source (Definition: An inherent food safety risk like an allergen, toxicological or microbial risk)
10 These underutilised or emerging food sources are safe, as products utilising this food source do not require special storage conditions, with ambient conditions being the most favourable.
11 Consumers would accept these underutilised or emerging food sources as they are culturally acceptable (Definition: The food source is part of South African culture through local cuisines and traditional diets)
12 Consumers would accept these underutilised or emerging food sources, as their organoleptic profile is desirable (Definition: The food source is part of South African culture through local cuisines and traditional diets and is enjoyed)
13 These underutilised or emerging food sources would be able to reach consumers, as there is a favourable regulatory environment in regard to this food source (Definition: The South African regulatory environment permits or would not prohibit this food source from being produced and marketed to South African consumers)
14 Please indicate (use an X in the appropriate box) the time frame in which you expect these underutilised or emerging food sources to be commercially available in South Africa, where 1 = short term (3–5 years); 2 = medium term (5–10 years) and 3 = long term (10+ years).
via email to 53 experts identified to participate in the survey. of the 53 experts invited to participate, 40 agreed and signed the informed consent letter. They were told that they could withdraw their participation at any point during the survey.
statistical analysis
The questionnaire (in Microsoft Word) was sent to all willing participants electronically via email to complete the survey (Figure 1). MS Excel was used to capture the response data and STATISTICA 14 (TIBCO Software Inc. Data Science Workbench, version 14, 2020) was used to analyse the data.
Constructs in the study were measured with items on a Likert scale, and the reliability of the items was investigated with Cronbach alpha analyses to
table 2: Definitions of ANSSA (Affordable, Nutritious, Safe, relevant for South Africans) criteria
Criteria Definition
• Scalable
• Locally produced and manufactured/processed
Affordable
• Level of investment required
• Stakeholders and capabilities available, e.g. research institutes, academia, industry
• Nutritional profile
Nutritious
Safe
South Africa
• Lack of anti-nutrients
• Allergens
• Toxicity
• Microorganisms
• Pesticides
• Storage conditions
• Processing safety
• Culturally relevant
• Consumer acceptance
• Favourable regulatory environment
indicate how well the set of items in the survey results related to each other. The mean of the reliable items was used to measure these constructs.
The relationships between two continuous variables were investigated using regression analysis, and the relationship’s strength was measured with the Spearman correlation to determine whether there was a correlation between the variables. The agreement between repeated measures of the same variable was investigated through Bland-Altman plots. The relationships between continuous response variables and nominal input variables were analysed to determine if there were statistically significant differences using appropriate analyses of variance (ANOVA). A p-value of less than 0.05 represents statistical significance in hypothesis testing, and 95% confidence intervals were used to describe the estimation of unknown parameters.
The total scores of each underutilised or emerging new food source from this survey were plotted against the estimated time horizon indicated to determine the most promising future food sources.
r esults and discussion
summarised results of the literature review on ueFst
Indigenous African crops
Modern agricultural systems promote the cultivation of a limited number of crop species, such as wheat and maize, and have neglected the utilisation of indigenous African crops (IACs).22 IACs originated in Africa or were introduced into Africa, and are now recognised as naturalised or traditional crops. Many indigenous African grains, pulses, vegetables and fruits remain essential for food security, nutrition and dietary diversity for vulnerable African communities. These grains are well adapted to semi-arid conditions with natural resistance to many pests, requiring fewer inputs.22-24 However, these grains and vegetables remain limited to subsistence farming and remain underutilised due to a lack of commercial production and processing, new product development, distribution and marketing, and consumer awareness about their benefits or inclusion in diets, as well as negative cultural perceptions.23-27 However, there is now a growing interest from the government and other stakeholders in the value of IACs to address food security and climate change.28 29
Insects
The consumption of insects, also called entomophagy, is practised by more than two billion people worldwide and is steadily increasing.30-32 Over 1500 species of insects are eaten across Africa, including the mopane worm, termites, grasshoppers and crickets.33 Compared with conventional livestock, insects have low space requirements, high reproductive rates and feed conversion ratios and emit low levels of greenhouse gases, making them ideal for farming purposes.30 31 34 Some
technologies.
Figure 1: Time horizon and overall score analysis for the underutilised or emerging food sources and
insect species can be grown on organic side streams, thus transforming waste into high-value food or feed.34 Furthermore, insects have a positive nutrition profile.30,31
Fermentation
Dating back 6000 years, fermentation is the oldest and most economical biotechnology process.35,36 Traditional fermentation uses microorganisms to process raw materials into enhanced products with unique flavours, nutritional profiles or modified textures, such as kimchi or tempeh.36
Fungal mycoproteins are already widely consumed as meat alternatives through the brand Quorn, which is made from Fusarium venenatum.16 17 36 This is known as biomass fermentation and leverages the fast growth of the fungal mycelium to produce large quantities of protein efficiently.36
Precision fermentation can also use microbial cells to produce specific functional ingredients or recombinant proteins such as dairy, egg or heme proteins that can enhance plant proteins, cultivated animal cells or other microbial biomass.16 36 Research opportunities are related to strain development and target selection through biotechnology like gene editing, genetic engineering and breeding strategies.36,37 Feedstock optimisation – including waste products or agro-industrial by-products to reduce costs and improve yields, bioreactor design and downstream processing – are all areas to be researched further.36 37
Cultured meat or seafood
Cultured meat or seafood is an emerging branch of biotechnology that encompasses culturing techniques to manufacture products typically obtained from animal production.38,39 The cells are extracted, isolated and fed a nutrient-dense liquid, allowing them to proliferate in bioreactors.39,40 The product replicates conventionally derived meat’s structure, composition and nutritional value.39 Cultured meat is promising but at an early stage and requires significant improvements and modifications for the process to be cost-efficient and robust enough to be produced at scale.41 Key challenges include cell source, selection and development; culture media optimisation; mimicking the in-vivo myogenesis environment; bioreactor and bioprocess engineering; scaffold biomaterials; regulatory approvals; and consumer acceptance.38,39,41 Cultured meat could deliver large reductions in water use, greenhouse gas emissions, eutrophication potential, land use, biodiversity loss, and zoonotic diseases compared to conventional meat production.38 39 42
Food waste
It is estimated that 30% of all food produced on the planet is lost before reaching a human stomach.43 This is of great concern because a substantial portion of discarded food is still edible and because of the wasted resources and emissions related to its production.43,44
A staggering 10 million tonnes (about one-third) of food is wasted in South Africa.44 45 The bulk of this loss (49%) arises from the processing and packaging stage and 18% from the consumption stage.45
The edible portion of currently wasted foods is an emerging source of new ingredients for the food-processing industry.21 Valorisation opportunities exist for extracting protein from post-industrial streams, like spent brewer’s yeast and rapeseed press cake.16
Algae
Algae have been exploited for centuries as food and feed.46 Seaweed polysaccharides such as carrageenan are extensively used as a thickening agent, stabiliser and fat replacer in various food applications.47 Japan started the first industrial-scale production of Chlorella microalgae for human consumption. Algae are abundant primary producers with multiple species having a high protein content, oils rich in polyunsaturated fatty acids (PUFAs), a high fibre content, vitamins, minerals, antioxidants and natural colourants.46,48
Algae use less land, are fast growing, can grow in areas unsuitable for plants, and more efficiently utilise energy from sunlight.48 49 They have simple nutritional requirements and can produce specific compounds by manipulating cultivation conditions.48 However, high production costs, high energy and water usage, and technical difficulties in including algal material in palatable food preparations remain the challenges.50 Furthermore, safety assessments and restrictive regulatory requirements can delay commercialisation.46
results of the quantitative expert survey
Descriptive statistics were used to describe the variables (Table 3). Of the 40 expert respondents, 50% were from industry and 50% were from academia or government (called academia for statistical analysis purposes). The power analysis result for the total group of 40 respondents was a 90% power with a small/medium effect size of δ = 0.53. When comparing the two groups of 20 each, industry compared to academia, there was a 90% power and medium effect size of δ = 0.75. The power analysis measures the likelihood that a researcher will find statistical significance in a sample if the effect exists.
Overall results
Indigenous African crops
IACs recorded the highest mean and highest scores out of the six UEFST for each criterion (Tables 3 and 4). This was consistent across both the industry and academic expert groups. IACs received the highest score for the ‘Affordable’ criteria due to their ability to be locally produced and processed. IACs are inherently suitable to the South African climate, especially given their drought tolerance, and are currently grown by subsistence farmers. The potential integration of subsistence farming with the formal market would create economic opportunities, employment and improved food security. The criterion of ‘Safe’ was the lowest score related to inherent allergens, toxicological and microbial risks. With such positive results across all criteria, the question remains: why are IACs not being utilised more to address food insecurity in South Africa? Some respondents (3 of 40) highlighted that the perception of these crops being linked to poverty requires a real public shift to enable the adoption of this underutilised food source.
Insects
Insects scored the second highest of the six UEFSTs for the criterion of ‘Nutritious’, which was the highest of all the criteria for insects (Table 4). The lowest overall result for insects was related to the ‘South Africa’ criterion. Challenges were related to cultural acceptability, organoleptic profile and favourable regulatory environment. These are significant
table 3: Descriptive statistics of the expert survey data
table 4: Summary of sub-criteria scores for the underutilised or emerging food sources and technologies
barriers to insect protein gaining momentum globally, not only in South Africa. In many parts of rural South Africa, however, catching, cooking and eating insects whole is a common practice.51 Adding insects as milled or ground has improved consumer acceptance, which respondents also suggested. It could be a way to provide nutrition and overcome the barriers of cultural acceptance and taste.31 In addition, challenges to reach scale were identified as a result of the lack of stakeholders and capabilities and lack of local production and processing. A South African company, Maltento, is investing in insect growing and harvesting. However, insects as a food source will remain limited to animal feed if the challenges related to the ‘South Africa’ criterion are not addressed.
Fermentation
The criterion of ‘Nutritious’ was the highest score for this UEFST (Table 4). The lowest scores for fermentation were for the criteria of ‘Safe’, related to contamination of reactors and the requirement of chilled storage conditions and ‘Affordable’ associated with the lack of stakeholders and capabilities (respondents highlighted the need for specialised scientific support and research), as well as investment available for this technology. Furthermore, the ‘South Africa’ criterion scored lower for cultural acceptability, organoleptic profile and regulatory environment. Fermentation has been a culturally acceptable processing practice for dairy (e.g. amasi) and grains (e.g. mageu) for generations, and hence, an extension of this into meat/dairy alternatives or nutritional ingredients is a leap consumers could make if transparency and trust are maintained between industry, regulators and consumers.
Cultured meat or seafood
Cultured meat or seafood scored the lowest of the UEFSTs for the ‘Affordability’ criterion. This was related to the investment required, the availability of stakeholders and capabilities (respondents highlighted the need for specialised scientific support and research), and the ability to reach scale with local production and processes (Table 4). All these challenges identified by the respondents are aligned with an emerging and novel technology. Further barriers to meeting the criteria are related to cultured meat or seafood being culturally acceptable in a country where animal meat is extremely desirable from a cultural, heritage and status perspective. In addition, the regulatory environment is a barrier as no regulations exist for cultured meat and seafood from the Department of Agriculture, Land Reform and Rural Development. Furthermore, there were safety hurdles related to storage conditions, namely requiring a chilled/cold chain.
The Mann–Whitney test indicated a significant difference (p = 0.04) between industry and academia in their assessment of cultured meat or seafood. Academia scored higher at 2.43 than the 2.18 for industry,
indicating that industry is challenged to engage with this new technology as multiple hurdles remain to be solved at the research and scale-up stage and, hence, is not yet ready for commercialisation. There are two cultured meat start-ups, Mzansi Meats Co. (now Newform Foods) and WildBio, and a cultured seafood start-up, Sea-Stematic, headquartered in South Africa.
r ecovery of food waste
A few respondents (3 of 40) highlighted food waste avoidance as a critical first step to feeding hungry South Africans. They indicated that food manufacturers are working hard to integrate post-industrial food waste into their processes but suggested there is more value to be captured. In line with the United Nation’s Sustainable Development Goals, food manufacturers and retail members of the Consumer Goods Council of South Africa launched the South African Food Loss and Waste Voluntary Agreement, committing to halving food waste by 2030.52 Food waste recovery scored highest in the ‘Affordable’ sub-criteria and the ‘Nutritious’ criterion (Table 4). However, it scored the lowest for safety of all the UEFSTs, with respondents highlighting storage as the primary concern (most likely after recovery and before processing), then inherent food safety risks (examples given by respondents were cross-contamination, pathogen growth, mycotoxins and microbial spoilage) and then safe processing. Furthermore, respondents highlighted the lack of a favourable regulatory environment for companies to redistribute food waste as a key barrier. Consumer acceptance was also highlighted as a challenge, with respondents suggesting the term ‘food surplus’ rather than ‘food waste’.
Algae
The major hurdle for algae indicated by respondents was acceptance by the South African consumer, with cultural acceptance and organoleptic profile scoring the lowest (Table 4). Unlike in Asia, eating algae is not part of the South African diet. Furthermore, respondents indicated affordability with a lack of investment, stakeholder and capability (respondents highlighted the need for specialised scientific support and research) and local production and processes as challenges. The ‘Nutritious’ criterion was the highest score for algae, suggesting that using nutrients and bioactive extracts from algae to enhance products is an opportunity.
time frames
Respondents indicated that the two most promising UEFSTs – IACs and food waste recovery – could be available to South Africans in the shortest time frame (within 3–5 years), with a score of > 2.8 for their ability to meet the criteria identified (Figure 1). According to the
Spearman correlation, acceptance by South Africans of recovered food waste as a food source is the reason for the longer time frame (p = 0.04) for this UEFST. Fermentation and insects are next in terms of time frames to commercialisation (< 5–10 years) and they scored > 2.8. The Spearman correlation indicated that the criterion of ‘affordability’ was the main reason for the longer time estimates provided for fermentation by the respondents (p = 0.02).
The two underutilised or emerging food sources and technologies with the most extended time frames to availability are algae and cultured meat or seafood (> 5–10 years). ‘Affordability’, ‘safety’ and ‘acceptance’ by South African consumers were all reasons for the longer time estimates provided by respondents for algae when analysing the Spearman correlation.
Conclusion
UEFSTs could be an essential solution in providing South Africans with affordable, nutritious, safe foods. These could be in the form of a nutritious ingredient enhancing the overall nutritional profile of a product with added macro- or micronutrients derived from insects, algae or food waste. Replacement of whole animal/fish proteins could be through biomass fermentation, cultured meat, seafood, or hybrids utilising plant proteins and precision fermentation. Enhancing dietary diversity could be achieved by incorporating IACs into our diets through innovative new products like baked goods, snacks or meat alternatives. Through product formulation and flavour science, food products utilising these new ingredients/food sources can be designed to be tasty, ensuring that consumers purchase them again.
Marketing these products to ensure consumers understand what they are, as well as their benefits, is essential to any new product adoption, especially to overcome food neophobia. Respondents in the survey highlighted that, as South Africa is so diverse, products made from UEFSTs will not necessarily appeal to all South Africans. However, they may be targeted to a niche-conscious consumer group and grow in mass adoption and acceptance over time.
Respondents indicated that, for any of these UEFSTs to reach the market, there needs to be investment from industry, governments, and academia into research, technical capability building and scale-up infrastructure through to commercialisation. According to the report conducted by Mouton et al.53, South Africa invests too little in research and development. Gross Domestic Expenditure on R&D (GERD)/Gross Domestic Product (GDP) has remained unchanged at around 0.8% for the last 15 years, compared to an elusive national target of 1%. The number of full-time researchers in the broad field of agriculture has not increased between the early 1980s and 2014.53 Fortunately, the academic pipeline has expanded through master’s and doctoral graduates.53 It is promising to see research projects like InnoFoodAfrica trying to increase the dietary diversity of affordable, nutrient-dense and healthy food products from IACs. There is also research across multiple academic institutions on insect techno-functional properties, allergenicity, microbial aspects, and new product development for human food (KaMshayisa V, 2022, Research and Lecturer at Cape Peninsula University of Technology, personal communication, 11 April). Research in South Africa is relatively cost-effective and significant research can be conducted at a fraction of the cost (Bessa L, 2022, Co-founder & CSO of De Novo Dairy, personal communication, 25 April). However, the lack of scale-up capabilities to bring new technologies to market results in complicated logistics and high costs for overseas trials (Bessa L, 2022, Co-founder & CSO of De Novo Dairy, personal communication, 25 April).
It is also evident from the research that for many of these UEFSTs to become available to South Africans, a progressive and agile regulatory environment needs to be in place, which is not the case today. For example, Singapore’s Food Agency approved the sale of cultured meat in 2020, enabling start-ups like Eat Just to test and scale this technology in that country.54 The South African government also needs to provide funding, tax incentives and an enabling environment for various stakeholders to collaborate and innovate to unlock new food production technologies. In 2022, the Netherlands government, for example, announced an initial
USD60 million funding to expand and develop its domestic cultured meat and seafood ecosystem.55
Industry, too, needs to shift R&D investment and focus on supporting research and capability building. Food and beverage multinationals traditionally spend far less on R&D than other sectors like the healthcare, automotive and technology sectors.56 Some overseas food and beverage companies have created venture capital divisions that are seen as an extension of their R&D departments and are far less risky than significant merger and acquisition deals.56 This is an example for South African food and beverage manufacturers to follow. It is promising to see Tiger Brands utilising its recently launched venture capital fund to invest in the plant-based protein start-up Herbivore Earthfoods.
recommendations
Future diets of South Africans could be far more diverse and nutritious and have less impact on the climate and environment if we invest in UEFST research and commercialisation. This requires a collaborative stakeholder effort from academia, government and industry to ensure UEFSTs reach everyday South Africans. Some recommendations from the research are for:
• government funding and incentives for research, development, infrastructure and commercialisation;
• an agile regulatory framework to assess safety and enable novel technologies to be commercialised; and
• industry venture capital appetite to assess and invest in start-ups and research looking to develop and commercialise UESFT.
Limitations
The experts identified for the survey to map underutilised and emerging food sources to provide safe, affordable, and nutritious foods for South Africans, were from the researchers’ professional network. To reduce bias, a statistically significant sample size of respondents was recruited that represents the various role players of academia, government, and industry.
Acknowledgements
Dr Scott Drimie, Maricel Krügel and Dr Melvi Todd from Stellenbosch University are acknowledged for providing guidance during the study. Dr Leah Bessa and Dr Vusi Mshayisa are acknowledged for their review and contribution to this research. We thank all the food science professionals who participated in the survey and L-C.R-R.’s employers during the study for providing time and financial assistance.
Data availability
The data supporting the results of this study are available upon request to the corresponding author.
Declarations
We have no AI or LLM use to declare. L-C.R-R. worked in the South African food and beverage industry while conducting this research as part of her PhD. Ethical approval was obtained from Stellenbosch University’s Ethics Council (project number 22423).
Authors’ contributions
L-C.R-R.: Conceptualisation, methodology, project leadership, investigation, formal analysis, validation, data curation, writing – the original draft. G.O.S.: Conceptualisation, methodology, supervision, writing –review and editing. Both authors read and approved the final manuscript.
r eferences
1. The World Bank. Poverty & equity brief South Africa [document on the Internet]. 2025 [cited 2025 Apr 25]. Available from: https://documents.wo rldbank.org/en/publication/documents-reports/documentdetail/0995420042 22542658
2. Statistics South Africa. Quarterly Labour Force Survey P0211 [document on the Internet]. c2024 [cited 2025 Apr 25]. Available from: https://www.statss a.gov.za/publications/P0211/P02114thQuarter2024.pdf
3. Statistics South Africa . Assessing food inadequacy and hunger in South Africa 2021 using the General Household Survey (GHS) [document on the Internet]. c2021 [cited 2025 Apr 25]. Available from: https://www.statssa.go v.za/publications/03-00-20/03-00-202021.pdf
4. Statistics South Africa . Living conditions of households in South Africa: An analysis of household expenditure and income data using the LCS 2014/2015 [document on the Internet]. c2017 [cited 2020 Sep 21]. Available from: http: //www.statssa.gov.za/publications/P0310/P03102014.pdf
5. Pietermaritzburg Economic Justice & Dignity Group. Household affordability index April 2024 [document on the Internet]. c2024 [cited 2025 Apr 25]. Available from: https://pmbejd.org.za/wp-content/uploads/2024/04/PMBEJD_ Key-Data_April-2024_24042024.pdf
6. Claasen N, van der Hoeven M, Covic N. Food environments, health and nutrition in South Africa. Working Paper 34. Cape Town: PLAAS, UWC and Centre of Excellence on Food Security; 2016.
7. Ronquest-Ross LC, Vink N, Sigge GO. Food consumption changes in South Africa since 1994. S Afr J Sci. 2015;111(9/10), Art. #2014-0354. https://d oi.org/10.17159/sajs.2015/20140354
8. Institute for Health Metrics and Evaluation. Health data [webpage on the Internet]. No date [cited 2025 Apr 25]. Available from: https://www.healthdat a.org/research-analysis/health-by-location/profiles/south-africa
9. Simelane T. Almost 50% of adult South Africans are overweight or obese. Poverty and poor nutrition are largely to blame. The Conversation. 2024 March 17 [cited 2025 Apr 25]. Available from: https://theconversation.com/a lmost-50-of-adult-south-africans-are-overweight-or-obese-poverty-and-poo r-nutrition-are-largely-to-blame-224286
10. International Diabetes Federation. Key information: South Africa [webpage on the Internet]. No date [cited 2025 Apr 25]. Available from: https://idf.org/ou r-network/regions-and-members/africa/members/south-africa/
11. Micha R, editor. Global nutrition report: Stronger commitments for greater action. Bristol: Development Initiatives; 2022. Available from: https://media.globalnutritionr eport.org/documents/2022_Global_Nutrition_Report_updated.pdf
12. Global Alliance for the Future of Food. Untapped opportunities for climate action: An assessment of food systems in nationally determined contributions [document on the Internet]. c2022 [cited 2023 Mar 23]. Available from: https://futureoffood.org/wp-content/uploads/2022/03/assessment-of-food-s ystems-in-ndcs.pdf
13. Von Bormann T. Agri-food systems: Facts and futures. How South Africa can produce 50% more by 2050. Cape Town: World Wide Fund for Nature; 2019. Available from: www.wwf.org.za/report/agrifood_systems
14. World Wide Fund for Nature. Water [webpgage on the Internet]. No date [cited 2021 Apr 16]. Available from: https://www.wwf.org.za/our_work/water/
15. Tub C, Seba T. RethinkX disruption, implications and choices. Rethinking food and agriculture 2020–2030. RethinkX; 2019. https://doi.org/10.61322/IJIP9096
16. Pyett S, de Vet E, Trindade LM, van Zanten HHE, Fresco L. Chickpeas, crickets and Chlorella: Our future proteins [document on the Internet]. Wageningen: Wageningen University & Research; 2019. Available from: http://edepot.wu r.nl/496402
17. Vanhercke T, Colgrave M. What’s brewing? Precision food proteins from fermentation [webpage on the Internet]. c2022 [cited 2022 Apr 18]. Available from: https://research.csiro.au/synthetic-biology-fsp/food-australiaprecision-fermentation/
18. Ronquest-Ross LC, Vink N, Sigge GO. Application of science and technology by the South African food and beverage industry. S Afr J Sci. 2018;114(9/10), Art. #4757. https://doi.org/10.17159/sajs.2018/4757
19. Ngige L. Meet the founder: Mzansi Meat’s co-founders on building a global foodtech company with African roots [webpage on the Internet]. c2022 [cited 2025 Apr 25]. Available from: https://agfundernews.com/mzansi-meat-co-fo unders-on-building-a-global-foodtech-company-with-african-roots
20. Ministry of Food, Agriculture and Fisheries of Denmark. Danish action plan for plant-based foods [document on the Internet]. c2023 [cited 2025 Apr 25]. Available from: https://en.fvm.dk/Media/638484294982868221/Danish-ActionPlan-for-Plant-based-Foods.pdf
21. Knorr D, Augustin MA, Tiwari B. Advancing the role of food processing for improved integration in sustainable food chains. Front Nutr. 2020;7, Art. #34. https://doi.org/10.3389/fnut.2020.00034
22. Chivenge P, Mabhaudhi T, Modi AT, Mafongoya P. The potential role of neglected and underutilised crop species as future crops under water scarce conditions in sub-Saharan Africa. Int J Environ Res Public Health. 2015;12:5685–5711. https://doi.org/10.3390/ijerph120605685
23. Raheem D. The need for agro-allied industries to promote food security by value addition to indigenous African food crops. Outlook Agric. 2011;40:343–349. https://doi.org/10.5367/oa.2011.0063
24. Taylor JRN, Belton PS, Beta T, Duodu KG. Increasing the utilisation of sorghum, millets and pseudocereals: Developments in the science of their phenolic phytochemicals, biofortification and protein functionality. J Cereal Sci. 2014;59:257–275. https://doi.org/10.1016/j.jcs.2013.10.009
25. Adebiyi JA, Obadina A, Adebo OA, Kayitesi E. Fermented and malted millet products in Africa: Expedition from traditional/ethnic foods to industrial valueadded products. Crit Rev Food Sci. 2016;58:463–474. https://doi.org/10.10 80/10408398.2016.1188056
26. Onyeoziri IO, Kinnear M, de Kock HL. Relating sensory profiles of canned amaranth (Amaranthus cruentus), cleome (Cleome gynandra), cowpea (Vigna unguiculata) and Swiss chard (Beta vulgaris) leaves to consumer acceptance. J Sci Food Agric. 2017;98:2231–2242. https://doi.org/10.100 2/jsfa.8710
27. Akinola R, Pereira LM, Mabhaudhi T, de Bruin FM, Rusch L. A review of indigenous food crops in Africa and the implications for more sustainable and healthy food systems. Sustainability. 2020;12, Art. #3493. https://doi.o rg/10.3390/su12083493
28. South African Department of Agriculture, Land Reform & Rural Development. Most common indigenous crops of South Africa [document on the Internet]. c2013 [cited 2020 Jun 20]. Available from: https://www.nda.agric.za/docs/B rochures/Indigfoodcrps.pdf
29. Shaver D. Future 50 foods [document on the Internet]. c2019 [cited 2021 Apr 16]. Available from: https://www.wwf.org.uk/sites/default/files/2019-02/Kno rr_Future_50_Report_FINAL_Online.pdf
30. Rumpold BA, Schlüter O. Insect-based protein sources and their potential for human consumption: Nutritional composition and processing. Anim Front. 2015;5:20–24.
31. Bessa LW, Pieterse E, Sigge G, Hoffman LC. Insects as human food; from farm to fork. J Sci Food Agric. 2017;100(14):5017–5022. https://doi.org/1 0.1002/jsfa.8860
32. Kim TK, Yong HI, Kim YB, Kim HW, Choi YS. Edible insects as a protein source: A review of public perception, processing technology, and research trends. Food Sci Anim Resour. 2019;39:521–540. https://doi.org/10.5851/k osfa.2019.e53
33. Iwuoha JP. The top 4 most eaten insects in Africa; and why insect farming has become a big business opportunity [webpage on the Internet]. c2016 [cited 2021 Apr 16]. Available from: https://www.linkedin.com/pulse/top-4-most-e aten-insects-africa-why-insect-farming-has-iwuoha/
34. Van Huis A. Potential of insects as food and feed in assuring food security. Annu Rev Entomol. 2013;58:563–583. https://doi.org/10.1146/annurev-ent o-120811-153704
35. Mishra SS, Ray RM, Panda SK, Montet D. Technological innovations in processing of fermented foods – An overview. In: Ray RC, Montet D, editors. Fermented foods part II: Technological Intervention. Boca Raton, FL: CRC Press; 2017. https://doi.org/10.1201/9781315205359
36. Specht L, Crosser N. 2020 State of the industry report. Fermentation: Meat, eggs, and dairy. Washington DC: The Good Food Institute; 2020. Available from: https://gfi.org/wp-content/uploads/2021/04/COR-SOTIR-Fermentatio n-2021-10-01-1.pdf
37. Floros JD, Newsome R, Fisher W, Barbosa-Cánovas GV, Chen H, Dunne CP, et al. Feeding the world today and tomorrow: The importance of food science and technology: An IFT scientific review. Compr Rev Food Sci Food Saf. 2010;9:572–599. https://doi.org/10.1111/j.1541-4337.2010.00127.x
38. Stephens N, Di Silvioc L, Dunsford I, Ellis M, Glencross A, Sexton A. Bringing cultured meat to market: Technical, socio-political, and regulatory challenges in cellular agriculture. Trends Food Sci. 2018;78:155–166. https://doi.org/1 0.1016/j.tifs.2018.04.010
39. Swartz E. SBE Special Section: Industrial Biotechnology: Meeting the needs of the cell-based meat industry. CEP. 2019;Oct:41–45. Available from: https://gfi .org/images/uploads/2020/02/Cell-Based_Meat_CEP_Oct2019.pdf
https://doi.org/10.17159/sajs.2025/17116
40. Buss D. How radical innovation will shape the future of food. Food Technology Magazine. 2020 August 01. Available from: https://www.ift.org/news-and-p ublications/food-technology-magazine/issues/2020/august/features/how-ra dical-innovation-will-shape-the-future-of-food?token =b8b01179-5807-484 9-8818-bffb21cc4102
41. Post M, Levenberg S, Kaplan D, Genovese N, Fu J, Bryant CJ, et al. Scientific, sustainability and regulatory challenges of cultured meat. Nat Food. 2020;1(7):403–415. https://doi.org/10.1038/s43016-020-0112-z
42. Minchin J. Cultivated meat can cause up to 93 percent less global warming says study. New Food Magazine. 2021 March 09. Available from: https://ww w-newfoodmagazine-com.cdn.ampproject.org/c/s/www.newfoodmagazine. com/news/140769/cultivated-meat-global-warming/amp/
43. Food and Agriculture Organization of the United Nations (FAO). Global food losses and food waste – Extent, causes and prevention. Rome: FAO; 2011. Available from: https://www.fao.org/3/i2697e/i2697e.pdf
44. Nahman A, de Lange W. Costs of food waste along the value chain: Evidence from South Africa [document on the Internet]. c2013 [cited 2021 Apr 16]. Available from: https://researchspace.csir.co.za/dspace/bitstream/handle/10 204/7115/Nahman2_2013.pdf?sequence=3&isAllowed=y
45. Oelofse SHH, Polasi T, Haywood L , Musvoto C. Increasing reliable, scientific data and information on food losses and waste in South Africa. Waste Research Development and Innovation Roadmap Research Report, CSIR External Report CSIR/SPLA/SECO/ER/2021/0019/A. Pretoria: CSIR Smart Places Cluster; 2021. Available from: https://wasteroadmap.co.za/wp-conte nt/uploads/2021/06/17-CSIR-Final_Technical-report_Food-waste.pdf
46. Vigani M, Parisi C, Rodríguez-Cerezo E, Barbosa MJ, Sijtsma L, Ploeg M, et al. Food and feed products from micro-algae: Market opportunities and challenges for the EU. Trends Food Sci. 2015;42: 81–92. https://doi.org/10. 1016/j.tifs.2014.12.004
47. Deepthi Hebbale MD, Subash Chandran NVJ, Ramachandra TV. Energy and food security from macroalgae. J Biodivers. 2017;8(1):1–11. https://doi.org/ 10.31901/24566543.2017/08.01.01
48. Kovač DJ, Simeunović JB, Babić OB, Mišan AC, Milovanović IL. Algae in food and feed. Food Feed Res. 2013;40:21–31. Available from: https://foo dandfeed.fins.uns.ac.rs/uploads/Magazines/magazine_123/Algae-in-food-a nd-feed.pdf
49. Poinski M. How algae’s potential could make other ingredients green with envy [webpage on the Internet]. c2021 [cited 2021 Apr 16]. Available from: https://www.fooddive.com/news/algae-ingredient-trends/593095/
50. Becker EW. Micro-algae as a source of protein. Biotechnol Adv. 2007;25: 207–210. https://doi.org/10.1016/j.biotechadv.2006.11.002
51. Schutz E. Termites on the menu: Protecting South Africa’s edible insects [webpage on the Internet]. c2020 [cited 2021 Apr 16]. Available from: https://www.dw.com/en/termites-on-the-menu-protecting-south-africas-edi ble-insects/a-55949049
52. Consumer Goods Council of South Africa. Consumer Goods Council of South Africa (CGCSA) launches the South African food loss and waste voluntary agreement [webpage on the Internet]. c2020 [cited 2021 Apr 16]. Available from: https://www.dffe.gov.za/consumer-goods-council-south-africa-cgcsa-launches-s outh-african-food-loss-and-waste-voluntary#:~:text=Johannesburg%20%E2% 80%93%20The%20Consumer%20Goods%20Council%20of%20South,%28SDG %29%20to%20halve%20global%20food%20waste%20by%202030
53. Mouton J, Basson I, Blanckenberg J, Boshoff J, Prozesky H, Redelinghuys H, et al. The state of the South African research enterprise [document on the Internet]. c2020 [cited 2022 May 12]. Available from: http://www0.sun.ac.z a/crest/wp-content/uploads/2019/08/state-of-the-South-African-research-e nterprise.pdf
54. Ives M. Singapore approves a lab-grown meat product, a global first. NY Times. 2020 December 02 [cited 2022 May 28]. Available from: https://www .nytimes.com/2020/12/02/business/singapore-lab-meat.html
55. Selby G. Dutch government invests record €60 M to boost cellular meat & agriculture [webpage on the Internet]. c2022 [cited 2022 May 28]. Available from: https://www.foodingredientsfirst.com/news/dutch-government-invest s-record-%E2%82%AC60m-to-boost-cellular-meat-agriculture.html
56. Geller M. Food revolution: Megatrends turn to small start-ups for big ideas. Reuters. 2017 May 24 [cited 2022 May 28]. Available from: https://www.reu ters.com/article/us-food-investment-insight-idUSKBN18K18O
https://doi.org/10.17159/sajs.2025/17116
AuthorS: Suné Henning1
Sinazo Matika1
Ayodeji B. Oyenihi2
AFFILIAtIoNS:
1Department of Food Science and Technology, Cape Peninsula University of Technology, Cape Town, South Africa
2Functional Foods Research Unit, Cape Peninsula University of Technology, Cape Town, South Africa
*Current: Medical Diagnostics Laboratory, Institute for Biomarker Research, Hamilton, New Jersey, USA
CorrESPoNDENCE to: Suné Henning
EMAIL: hennings@cput.ac.za
DAtES:
r eceived: 20 Jan. 2025
r evised: 11 June 2025
Accepted: 11 June 2025
Published: 11 Aug. 2025
hoW to CItE:
Henning S, Matika S, Oyenihi
AB. Proximate and fatty acid compositions of smoked underutilised South African mussel Choromytilus meridionalis. S Afr J Sci. 2025;121(7/8), Art. #21022. https://doi.org/10.17159/sajs.2 025/21022
ArtICLE INCLuDES:
☒ Peer review
☐ Supplementary material
DAtA AVAILAbILItY:
☒ Open data set
☐ All data included
☐ On request from author(s)
☐ Not available
☐ Not applicable
EDItorS: Annchen Mielmann
Leslie Swartz
KEYWorDS: nutrition, protein, fatty acids, food security, hot smoking, underutilised
FuNDING:
Cape Peninsula University of Technology Pre-Seed Fund, South African National Research Foundation (grant no. 117998)
Proximate and fatty acid compositions of smoked underutilised South African mussel Choromytilus meridionalis
Research Article
Seafood is valued for its nutritional content; however, overfishing necessitates the focus on underutilised species to promote sustainable utilisation. This study investigated the proximate and fatty acid compositions of hot-smoked Choromytilus meridionalis (black mussels) using AOAC International methods and gas chromatography. Lipid nutritional quality indices were calculated. Moisture content in mussels significantly (p < 0.05) decreased by 19% after hot smoking, whilst ash, protein, lipid, and carbohydrate contents increased by 98%, 42%, 46% and 49%, respectively. Hot smoking significantly increased the polyunsaturated (37.70 ± 1.06%) and omega-3 fatty acid (33.36 ± 1.23%) contents. Conversely, omega-6 and saturated fatty acids of hot-smoked mussels were significantly (p < 0.05) lower than those for raw mussels. The atherogenicity index and thrombogenicity index showed a significant reduction (p < 0.05), whilst the hypocholesterolaemic to hypercholesterolaemic ratio and the sum of EPA+DHA showed significant increases. This study shows that C. meridionalis is a valuable food with a high protein content and a well-balanced fatty acid composition, rich in omega-3 fatty acids. This study was the first to investigate the macronutrients of C. meridionalis
Significance:
Choromytilus meridionalis is one of three bivalve species cultivated on a commercial scale along the West Coast of South Africa; however, it is underrealised as a commercial food product. The growing mussel industry has been considered a great potential for the alleviation of poverty, job creation, and food security. This research may provide mussel farmers, fish processing industries, and the community with information about processing opportunities using C. meridionalis. Successful product development may contribute to alleviating malnutrition and increasing food security.
Introduction
The demand for seafood has increased over recent years because of growth in the population along with knowledge of the health benefits associated with the consumption thereof.1-3 This increase in seafood demand has led to a concerning decline in global wild fish stocks.4,5 The decline in fish stock paired with the growing population of an estimated 10 billion by the year 2050 may leave large groups of people at risk of nutrient deficiencies.6 Approximately 39% of the seafood species found in South Africa are overexploited.7 In this regard, there has been a growing need to explore underutilised aquaculture seafood species as an alternative to producing cheap value-added products.2 5
Seafood products, such as mussels, have been appreciated for their excellent source of essential long-chain polyunsaturated fatty acids (LC-PUFAs), including eicosapentaenoic acid (EPA), docosahexaenoic acid (DHA), docosapentaenoic acid (DPA), and, to a smaller degree, arachidonic acid (ARA).5 8 The LC-PUFAs have been reported to have positive effects on human health and its maintenance. Some of the health benefits include the improvement and prevention of cardiovascular heart diseases, obesity, insulin sensitivity, and bone resorption, and the maintenance of muscle health.9 10 Therefore, the promotion of the consumption of mussels in the human diet may be a feasible strategy to enhance human health.11 Furthermore, mussels as part of the human diet may provide essential vitamins, minerals, and high-quality proteins with all the dietary essential amino acids required for the maintenance and growth of the human body.12,13 The nutritional quality of lipids can be assessed and quantified by nutritional quality indices (NQIs), such as the omega-3/omega-6 fatty acid (FA) ratio, the polyunsaturated FA/saturated FA (PUFA/SFA) ratio, and the functional efforts of the FA, such as the hypocholesterolaemic to hypercholesterolaemic ratio (h/H), atherogenicity index (IA), and thrombogenicity index (IT).14 15
The mass production of mussels through aquaculture is sustainable, cost-effective, and environmentally friendly because they feed directly from the water column and therefore avoid the environmental pollution and impacts caused by feed production and nutrient input to the water column.5,10 Mussels are usually marketed as raw, unshelled, or frozen but can also be processed by various cooking methods16 before consumption or used as an ingredient in many delicate dishes, such as pasta, pizza, salads, and soups. Choromytilus meridionalis, commonly known as the black mussel, is native to southern Africa17 and is one of the three bivalve species currently cultivated on a commercial scale in Saldanha Bay, South Africa.18 Choromytilus meridionalis has a blue-black shell that is more compressed than the common mussels Perna perna, Mytilus galloprovincialis, and Aulacomya atar 19 20 Female mussels can be distinguished from male mussels by the brown colour of their gonadal tissue, whereas the male individuals have yellow to off-white gonads.21 In this context, the mussel has not gained acceptance in the market because of the unusual dark brown colour of the female flesh.21,22 Most of the research on C. meridionalis is centred around growth, reproductive cycle and biology, accumulation rates of trace elements and toxins, and ecophysiology.23-25 Thus, there is currently limited information on the proximate and FA compositions of C. meridionalis, as well as the effects of heat treatment on the nutritional quality thereof.21 26 27 Hence, the aim of this study was to determine the effects of hot smoking on the proximate and FA compositions of C. meridionalis and the lipid NQIs thereof. The results from this study can assist in evaluating the effects of hot smoking on the quality
https://doi.org/10.17159/sajs.2025/21022
and quantity of nutrients in ready-to-eat products of processed mussels, an underutilised species.
Materials and methods
sample collection
Frozen half-shelled C. meridionalis mussels (20 kg) were obtained from a local seafood processor at Velddrif (32.7690°S, 18.1590°E), Western Cape, South Africa. The frozen mussels were directly transported to the laboratory in a cooler box containing ice. On arrival, the frozen mussels were stored at 20 °C until processing and analysis.
sample preparation and hot smoking
The mussels were thawed overnight at 4 °C and removed from the shells. The mussels were randomly pooled from the 20 kg supply into six groups, each weighing 100 g. Each of the six groups was subsequently divided into two samples of equal weight (i.e. 50 g): one sample was randomly designated as a raw sample and the other was assigned for hot smoking. This process yielded six raw samples and six hot-smoked samples, effectively serving as six repetitions of the smoking process. Each of the six hot-smoke samples was individually smoked as follows: mussel meat was steamed for 5 min at 80 °C, followed by salting in a 4% NaCl brine solution for 15 min at 45 °C. The ratio of mussels to the brine was 1:2. The brined mussels were transferred onto a smoking tray and dried for 10 min at 60 °C, followed by smoking for 15 min at 80 °C in a smoker (Junior Butcherquip, model J536, South Africa). French oak wine barrel sawdust (LK’s) was used to produce smoke within the smoker. Each 50 g sample served as a composite sample for analysis.
Cooking loss and sodium content
Cooking loss, expressed as a percentage, was determined by calculating the difference in weight between the raw and smoked samples. Sodium (Na) content was determined according to the Volhard method28, where 2 g of mussel homogenate was mixed with 50 mL of distilled water. A volume of 25 mL of 0.1 N silver nitrate [Ag(NO3)2] was added, and the flask was placed on top of a hot plate. A volume of 10 mL of nitric acid (HNO3) was slowly added to the mixture and left to boil for 10 min. The mixture was cooled down and 2 mL of nitrobenzene was added, followed by three drops of iron(III) indicator. The solutions were thoroughly mixed and titrated against 0.1 M ammonium thiocyanate (NH4SCN) until a reddish-brown colour was observed. The Na content was calculated according to Equations 1 and 2:
g Na in sample
[(25 × N of Ag(NO 3 ) 2)
=
(titre volume × N of NH 4 SCN ) ] 1000
× Mr of Na
g Na / 100 g of sample
= g Na in sample / sample weight × 100
Equation 1
Fatty acid composition
For the FA analysis, mussel samples were subjected to lipid extraction by chloroform : methanol (2:1) before being esterified according to Oyenihi et al.30 The individual fatty acid methyl esters (FAMEs) were separated and quantified using a Focus GC gas chromatography system (Thermo Scientific) equipped with a 60 m BPX-70 fused silica capillary column with an internal diameter of 0.25 mm and a 0.25 µm film thickness and an Al/AS 3000 autosampler. The injector and flame ionised detector temperatures were maintained at 200 °C and 250 °C, respectively. The oven was programmed to increase from 160 °C to 220 °C at a rate of 2 °C/min. The injection was set in the split mode (50 mL/min), and a constant flow rate of 2 mL/min was used for the hydrogen carrier gas. A full separation of FAMEs was obtained after a total run of 32 min. The FA contents in mussels were calculated relative to the heptadecanoic acid (C17:0) internal standard and the FAMEs reference standard mixture (18919-1 AMP, Sigma-Aldrich) and expressed as a percentage of the total lipids.
Lipid nutritional quality indices
The NQI of the lipid proportion of raw and hot-smoked samples was calculated and expressed as mg/g of the total lipids using the FA composition data. Equations 5 31 and 6 31 were used to calculate the IA and IT. The hypocholesterolemic FA ratio (h/H) was calculated according to Equation 7. 15 The PUFA/SFA, n-6/n-3 ratios, and the sum of EPA+DHA were calculated using Equations 8, 9, and 10, respectively.
where Mr is the relative molar mass and N is the concentration.
Proximate composition
Moisture, ash, and protein contents were analysed following the official methods of analysis of AOAC International.29 Crude protein was determined using the Leco method (TruSpecTMLeco). Crude fat was determined using the chloroform : methanol (2:1) solvent extraction method, containing 0.01% butylated hydroxytoluene as an antioxidant.30 The percentage carbohydrates (CHO) was calculated by the difference using Equations 3 and 4
CHO (%) = Dry matter crude protein (%) + total lipids (% ) + ash (%)
where
dry matter (% ) = 100 – moisture (%)
Equation 3
Equation 4
PUFA / SFA = ΣPUFA / ΣSFA Equation 8 n 6 / n 3 = Σn 6 / Σn 3 Equation 9 EPA + DHA = ΣEPA + ΣDHA
statistical analysis
Equation 10
All samples were analysed in triplicate. Data analyses were performed using SPSS (version 28.0, 2021), and results are presented as mean ± standard deviation. A one-way analysis of variance was performed to test for a significant effect of hot smoking on each parameter considered. Significant differences between means were determined using a t-test and a probability value of p < 0.05 was considered statistically significant.
r esults
Cooking loss, sodium, and proximate composition
Hot smoking resulted in a cooking loss of 40.54 ± 6.24%. The Na content obtained for the raw mussels significantly (p < 0.05) increased after brining and hot smoking (Table 1). The mean moisture content for raw mussels was 72.76 ± 2.10%, whilst the smoked mussels had a significant (p < 0.05) moisture reduction of up to 19%. Hot smoking significantly increased the ash, protein, and total fat contents. Smoking resulted in a significant increase of 49% in carbohydrates.
Fatty acid composition
The FA composition of the raw and hot-smoked mussel presents a dominance of SFA and PUFA (Table 2). The sum of SFA identified in the raw mussels was 52.93 ± 1.81% followed by PUFA (30.68 ± 2.10%), and monounsaturated fatty acids (MUFAs). Within the SFA fraction for raw mussels, palmitic acid was the most abundant FA, followed by
table 1: Proximate composition (% mean ± standard deviation) and sodium content (g/100 g) of raw and hot-smoked Choromytilus meridionalis
a,bValues within a row with different superscripts are significantly different (p < 0.05).
tridecanoic, undecanoic, pentadecanoic and stearic acids. Palmitoleic acid was the predominant MUFA in raw mussels with an average of 8.66 ± 1.12%, followed by vaccenic and myristoleic acids. The PUFAs were dominated, in decreasing amounts, by EPA (13.97 ± 1.52%), DHA (7.15 ± 0.71%), and linoleic acid (5.29 ± 0.47%). The total omega-3 and omega-6 obtained for the raw mussels were 23.96 ± 1.69% and 6.81 ± 0.52%, respectively.
The smoking process resulted in a significant (p < 0.05) decrease in the SFA, whilst a significant increase was observed in the PUFA content. Although there was an increase in the MUFA content, it was not significant (p > 0.05). The decrease in the SFA content may be a result of the significant (p < 0.05) reduction in tridecanoic, pentadecanoic and stearic acids. A significant decrease was observed for the MUFAs vaccenic acid and elaidic acid. The increased proportion of PUFAs was a result of an increase in the contents of EPA and DHA. Linoleic acid significantly decreased from 5.34 ± 0.42% to 2.79 ± 0.54% in the smoked mussels. The smoking process resulted in a significant decrease in the omega-6 content, whilst a significant increase was observed for omega-3 FAs.
Lipid nutritional quality indices
The NQIs (Table 3) were estimated in order to evaluate the nutritional quality and propensity of the mussels to influence the rate of coronary heart disease. Hot smoking resulted in a significant (p < 0.05) increase in the EPA+DHA value from 32.87 ± 6.03 mg/g to 71.12 ± 9.37 mg/g. The raw mussels had n-6/n-3 and PUFA/SFA ratios of 0.28 ± 0.02 and 0.58 ± 0.05, respectively. The n-6/n-3 ratio significantly decreased after smoking to 0.13 ± 0.02, whilst the PUFA/SFA ratio significantly increased.
The potential health benefits of the lipids in mussel meat were additionally assessed by the h/H, IA, and IT.32 The h/H ratio significantly increased (p < 0.05) from 1.60 ± 0.15 to 1.95 ± 0.04 after hot smoking. The IA and IT obtained for raw black mussels were 0.69 ± 0.07 and 0.26 ± 0.03, respectively. Hot smoking significantly decreased the IA and IT to 0.60 ± 0.02 and 0.18 ± 0.01, respectively.
Discussion
The positive perception and consumption of seafood is increasing because of the growing recognition of its medicinal qualities, especially in terms of the presence of health-promoting macronutrients, micronutrients and nutraceuticals.33 34 Hot smoking resulted in a loss in moisture and a significant increase in protein, lipid, ash, and carbohydrate contents, attributed to the concentration effect because of the loss of moisture. Similar results were reported by Abu and Eli35, Biji et al.36 and Liu et al.37 in thermally heated bivalve shellfish. The water loss in mussel meat can be described in terms of the relationship between heat treatment and protein denaturation.38 Protein denaturation does not result in protein loss but is associated with the reduction in the water-binding capacity of the proteins.36
table 2: Fatty acid composition (% mean ± standard deviation) of raw and hot-smoked Choromytilus meridionalis
Fatty acid methyl esters r aw hot-smoked
C8:0 4.38 ± 1.33a 3.31 ±
C11:0 (undecanoic)
C12:0
± 0.20a 0.18 ± 0.02a
C13:0 (tridecanoic) 8.31 ± 0.39a 6.04 ± 0.66b
C14:0 (myristic acid) 3.90 ± 0.37a 4.11 ± 0.24a
C15:0 (pentadecanoic) 6.99 ± 0.56a 5.62 ± 0.50b
C16:0 (palmitic) 15.96 ± 0.95a 15.54 ± 0.38a
C18:0 (stearic) 4.94 ± 0.32a 3.87 ± 0.43b
C20:0 0.37 ± 0.07a 0.35 ± 0.02a
C24:0 0.23 ± 0.06a 0.25 ± 0.05a
ΣSFA
± 2.02b
C14:1 (myristoliec) 1.86 ± 0.45a 2.44 ± 0.52a
C16:1 (palmitoleic) 8.66 ± 1.12a 9.81 ± 1.31a
C18:1n9 trans (elaidic) 0.71 ± 0.16a 0.31 ± 0.07b
C18:1n9 cis 1.03 ± 0.12a 1.05 ± 0.22a
C18:1n7 (vaccenic) 3.22 ± 0.09a 2.64 ± 0.15b
C20:1 0.81 ± 0.07a 0.97 ± 0.07b
C24:1 0.10 ± 0.05a 0.18 ± 0.10a
ΣMuFA 15.66 ± 1.36a 16.23 ± 1.47a
C18:2n6 (LA) 5.29 ± 0.47a 2.79 ± 0.54b
C18:3n3 0.27 ± 0.06a 0.28 ± 0.05a
C18:3n6 0.60 ± 0.18a 0.10 ± 0.04b
C20:3n6 0.14 ± 0.03a 0.43 ± 0.29a
C20:3n3 1.17 ± 0.16a 1.49 ± 0.11b
C20:4n6 (ArA) nda 0.09 ± 0.02b
C20:5n3 (EPA) 13.97 ± 1.52a 21.91 ± 1.21b
C22:4n6 0.46 ± 0.08a 0.63 ± 0.05b
C22:5n6 0.23 ± 0.05a 0.30 ± 0.01b
C22:5n3 (DPA n-3) 1.41 ± 0.27a 1.68 ± 0.22a
C22:6n3 (DhA) 7.15 ± 0.71a 8.01 ± 0.22a
ΣPuFA 30.68 ± 2.10a 37.70 ± 1.06b
Σn-6 6.72 ± 0.55a 4.34 ± 0.61b
Σn-3 23.95 ± 1.69a 33.36 ± 1.23b
ΣSFA, total saturated fatty acid; ΣMUFA, total monounsaturated fatty acid; ΣPUFA, total polyunsaturated fatty acid; LA, linoleic acid; ARA, arachidonic acid; EPA, eicosapentaenoic acid; DPA n-6, docosapentaenoic acid omega-6; DPA n-3, docosapentaenoic acid omega-3; DHA, docosahexaenoic acid; Σn-6, total omega-6 fatty acid; Σn-3, total omega-3 fatty acid
nd, not detected
a,bValues within a row with different superscripts are significantly different (p < 0.05).
table 3: Lipid nutritional quality indices (mean ± standard deviation) of raw and hot-smoked Choromytilus meridionalis
Nutritional index r aw hot-smoked EPA+DhA (mg/g) 32.87 ± 6.03a 71.12 ± 9.37b
IA, atherogenic index; IT, thrombogenicity index; h/H, hypocholesterolemic fatty acid ratio a,bValues within a row with different superscripts are significantly different (p < 0.05).
Sodium is predominantly consumed as salt (NaCl), an ingredient used in different amounts during the processing and preservation of seafood.39 40 The recommended daily limit of salt intake is 4–6 g per day (1600–2400 mg of Na per day).41 42 The Na content for the hot-smoked mussels was 0.88 ± 0.05 g/100 g (875.65 mg). This value is lower than the recommended daily limit, indicating that the brine of 4% NaCl did not increase the Na content to unacceptable levels.
The fat content for the raw mussels was higher than those reported by Firth21 (1.80 ± 0.09%) and Kyriacou26 (1.10 ± 0.40%) for the same species. This variation could be because of differences in the age of the mussels, the season, or natural and physiological status.43 The protein in bivalves is considered a high-quality protein because it contains essential amino acids and is classified as a highly digestible protein source.44 Protein is usually the principal biochemical constituent of edible mussels, followed by carbohydrates and lipids.45 The protein content found in the current study was similar to values reported in previous studies26 36 43 for various mussel species. The carbohydrate content was 11.99 ± 1.80% for the raw mussels and 17.87 ± 1.80% for the hot-smoked samples. Similar findings were reported for clam46 (Meretrix casta) (13.89%–15.67%) and Babylonia spirata47 (16.65%). Mussels typically contain glycogen as a principal carbohydrate reserve.48 Compared to other mussel species, the carbohydrate content in the present study was higher.48,49 This difference could be because of different species, gender, maturity, feeding32, and seasons48
Although mussels generally have a low lipid content, these lipids are a good source of essential PUFAs, such as EPA and DHA. The most dominant FA group in raw and hot-smoked mussels was SFA, followed by PUFA and MUFA. These findings are similar to those reported for M. galloprovincialis50 and for the green mussel, Perna viridis51. A significant decrease in SFA was observed for the hot-smoked mussels. In contrast, the PUFA significantly increased, whilst MUFAs did not increase significantly (p > 0.05). Similar observations regarding SFA, MUFA, and PUFA contents were reported for raw and steamed oysters.37 It is argued that these changes are related to SFAs and MUFAs being more substantially represented in the neutral lipid fraction, which therefore makes them more prone to migration from the food during processing.52 Palmitic acid was the most plentiful SFA, which is a common trend in most mussel species.48
Mussels are generally valued for their content of essential n-3 PUFAs, mainly EPA, DPA, and DHA, which usually constitute 30–50% of the total FAs.53 In the present study, hot smoking significantly increased the ΣPUFAs from 30.68 ± 2.10% to 37.70 ± 1.06%. Whilst the Σn-3 PUFA content significantly increased after smoking (23.96 ± 1.69% to 33.36 ± 1.23%), the Σn-6 content was significantly reduced compared to the raw samples. In contrast, a study54 that investigated the effects of barbecue grilling, boiling, microwaving, oven cooking, and frying on the FA composition of M. galloprovincialis found that all cooking methods resulted in a general decrease in n-3 PUFAs, including EPA and DHA. The n-3 PUFAs are more sensitive to heat, oxygen, and light than n-6 PUFAs.55 Omega-3 PUFAs, such as EPA and DHA, have a higher number of double bonds and therefore more bisallylic methylene positions compared to
n-6 PUFAs, such as linoleic acid or ARA. This makes n-3 PUFAs more susceptible to autoxidation and are more sensitive to conditions that promote oxidation initiation and propagation, such as heat, oxygen, and light. Cooking methods, such as boiling, microwaving, grilling, and oven baking, often result in the oxidation of these PUFAs because of exposure to high temperatures and oxygen, leading to a reduction in total n-3 PUFA content. In contrast, hot smoking uses moderate heat (60–82 °C) and inhibits lipid oxidation55 because of the antioxidant effects of phenols generated during the thermal decomposition of phenolic acids and lignin.
The most dominant n-3 PUFAs in raw mussels were EPA and DHA, with a significant increase after smoking. DPA was lower than EPA and DHA. DPA is typically found at lower concentrations compared to EPA and DHA in mussels32,48,56 and other molluscs57. In New Zealand Perna canaliculus, across raw and processed samples for both male and female mussels, the concentration of DPA was consistently lower than both EPA and DHA.56 In M. galloprovincialis, EPA and DHA were noted32 as major PUFAs, with DPA in wild and farmed at lower concentrations. In Mytilus edulis from South Korea, DPA was consistently lower than both EPA and DHA across different seasons.48 However, in raw clams, DPA was higher than EPA57 but significantly lower than DHA. When the clams were cooked, these PUFAs, including DPA, EPA, and DHA, were reduced. Within the n-6 PUFA fraction, ARA was not detected in the raw mussels, but low levels were detected after hot smoking. The antioxidant55 and concentration effects of hot smoking could have concentrated ARA, resulting in a higher concentration in smoked mussels. Similarly, Bejaoui et al.57 reported an increase in the content of ARA after steaming, baking, grilling, and frying of clams
The combination of EPA+DHA has been recognised and used greatly worldwide as a nutritional indicator.58 The recommended daily intake of EPA+DHA is set between 100 mg and 250 mg for children up to the age of 10 years, 250 mg for healthy adults, and 300 mg for pregnant people. The EPA+DHA value of 32.87 ± 6.03 mg/g of hot-smoked mussels may contribute to the recommended daily intake of these omega-3 FAs in a serving of as little as 10 g. The n-6/n-3 ratio has been used as an indicator when comparing the relative nutritional value of seafood.53 Although both n-6 and n-3 FAs have positive benefits for human health, it is important to consume the correct balance. A low n-6/n-3 ratio is considered as nutritionally beneficial to human health.59 The n-6/n-3 ratio for the raw mussels significantly decreased after hot smoking. This decrease is attributed to the overall reduction in n-6 FAs, particularly linoleic acid and C18:3n6, and an increase in Σn-3 FAs, with significant increases in C20:3n3, EPA, and DPA. These findings are similar to those of previous studies32,54 for M. galloprovincialis
The PUFA/SFA ratio has been described as a useful indicator for evaluating the nutritional quality of food lipids.5 The recommended PUFA/SFA ratio for food is ≥0.45, and any foods with a ratio below this may be considered detrimental to human diets as it may result in elevated blood cholesterol levels.5 According to published data5,53, the PUFA/SFA ratio for bivalve shellfish is usually above 0.45. Hot smoking significantly increased the PUFA/SFA ratio (0.84 ± 0.05) above the recommended ratio of 0.45 because of the overall decrease in the SFA and increase in PUFA.
The IA and IT are usually used to evaluate the potential effects of FA compositions on cardiovascular health.31,59 In this study, the IA and IT obtained for raw mussels significantly decreased after hot smoking. Low IA and IT values show that FAs have better nutritional quality, and thus diets containing smoked mussels could be a good source of healthy FAs. The h/H ratio considers the functional activity of FAs in the metabolism of lipoproteins, which are involved in the transportation of plasma cholesterol.14 The type and quantity of these FAs are related to the higher or lower risk of cardiovascular disease. Although there is no recommended value for the h/H ratio for seafood14, a value of 2.0 has been allocated to meat products and could therefore be used as a reference. In addition, from a nutritional outlook, values >2.0 conform to products with a desirable FA composition.14 The h/H ratio of the mussels significantly increased after hot smoking, indicating the nutritional benefit of smoked mussels. Similar h/H ratios were reported for steamed M. galloprovincialis32; however, a decrease in the h/H ratio was reported for the raw mussels (2.98 ± 0.15) after steaming (2.20 ± 0.17) at 90 °C for 10 min. Peycheva et al.32 argued that steaming caused a
https://doi.org/10.17159/sajs.2025/21022
significant increase in the SFA content, mainly because of changes in C14:0 and C16:0 levels. These two FAs are the components of the denominator in the h/H ratio formula. An increase in the denominator would lead to a decrease in the overall ratio. Steaming also resulted in a significant decrease in total content. Various PUFAs are components of the numerator in the h/H ratio formula. A decrease in the numerator would contribute to a decrease in the overall ratio. In the present study, there were no significant changes in C14 and C16 after hot smoking, whilst several PUFAs significantly increased, contributing to the numerator, resulting in a significant increase in the h/H ratio.
Conclusions
The hot smoking of C. meridionalis had a positive effect on the nutrient indices investigated in this study. The hot-smoking process decreased the moisture content from 72.76 ± 2.10% to 58.98 ± 2.64%, whilst the ash, crude protein, total lipid, and carbohydrate values were significantly increased by 98%, 42%, 46%, and 49%, respectively. Hot-smoked black mussels contained significantly higher levels of the beneficial omega-3 PUFAs, EPA (21.91 ± 1.21%), and DPA n-6 (8.01 ± 0.72%) than their raw counterparts. The favourable n-6/n-3 (0.13 ± 0.02) and PUFA/SFA (0.84 ± 0.05) ratios of the smoked mussels may indicate an excellent source of essential FAs. The changes in the n-6/n-3, PUFA/SFA, IA, IT, h/H ratios, and EPA+DHA contents of the hot-smoked mussels also indicate that smoked C. meridionalis constitute good quality lipids and can be a good source of essential FAs in the human diet. The overall observations from the study indicate that hot-smoked C. meridionalis has potential as a functional food or as an ingredient to improve the nutritional quality of ready-to-eat proteins or omega-3-supplemented and omega-6-supplemented marine-based food products. This study is the first study to describe the effects of hot smoking on the proximate and FA compositions of the indigenous and underutilised South African C. meridionalis. Future studies should evaluate the mineral, vitamin, and amino acid contents in smoked C. meridionalis in addition to determining the shelf-stability in terms of FA stability and microbiological safety. Research to explore the consumer acceptance of the smoked mussel is also recommended, with the aim of investigating the potential larger-scale commercialisation and marketing of ready-to-eat smoked C. meridionalis
Acknowledgements
This study was supported by the Cape Peninsula University of Technology. We are grateful to Buhle Mpahleni (Functional Foods Research Unit) for technical assistance with the gas chromatography analysis.
Funding
This work was supported by the Cape Peninsula University of Technology Pre-Seed Fund and the South African National Research Foundation under the Thuthuka funding track (grant number 117998).
Data availability
The data supporting the findings of this study are openly accessible from the Cape Peninsula University of Technology figshare at https://doi.org/1 0.25381/cput.27014896.v1 under a CC BY-NC-SA 4.0 licence.
Declarations
We have no conflicts of interest to declare. The funders associated with this study had no role in the design of the study or in the collection and interpretation of the published results. We have no competing interests in the outcomes and/or results from this study as described. We have no AI or LLM use to declare. We included parts of this paper in a preprint at https://www.preprints.org/manuscript/202407.0298/v1
Authors’ contributions
S.H.: Conceptualisation, methodology, data analysis, validation, data curation, writing – revisions, student supervision, project leadership, project management, funding acquisition. S.M.: Data collection, sample analysis, data analysis, data curation, writing – the original draft, writing – revisions. A.B.O.: Methodology, data collection, data analysis, validation, data curation, writing – the original draft, writing – revisions, student supervision. All authors read and approved the final version.
r eferences
1. Venugopal V, Gopakumar K. Shellfish: Nutritive value, health benefits, and consumer safety. Compr Rev Food Sci Food Saf. 2017;16:1219–1242. https ://doi.org/10.1111/1541-4337.12312
2. Messina CM, Arena R, Ficano G, Randazzo M, Morghese M, la Barbera L, et al. Effect of cold smoking and natural antioxidants on quality traits, safety and shelf life of farmed meagre (Argyrosomus regius) fillets, as a strategy to diversify aquaculture products. Foods. 2021;10(11), Art. #2522. https://doi .org/10.3390/foods10112522
3. Willer DF, Nicholls RJ, Aldridge DC. Opportunities and challenges for upscaled global bivalve seafood production. Nat Food. 2021;2:935–943. https://doi.or g/10.1038/s43016-021-00423-5
4. Fisher R. Possible causes of a substantial decline in sightings in South Africa of an ecologically important apex predator, the white shark. S Afr J Sci. 2021;117(1/2), Art. #8101. https://doi.org/10.17159/sajs.2021/8101
5. Tan K, Ma H, Li S, Zheng H. Bivalves as future source of sustainable natural omega 3 polyunsaturated fatty acids. Food Chem. 2020;311, Art. #125907. https://doi.org/10.1016/j.foodchem.2019.125907
6. Gephart JA, Golden CD, Asche F, Belton B, Brugere C, Froehlich HE, et al. Scenarios for global aquaculture and its role in human nutrition. Rev Fish Sci Aquacult. 2020;29:122–138. https://doi.org/10.1080/23308249.2020.1782342
7. South African Department of Environment, Forestry and Fisheries (DEFF). Status of the South African marine fisheries resources 2020. Cape Town: DEFF; 2020.
8. Panayotova V, Merdzhanova A, Stancheva R, Dobreva DA, Peycheva K, Makedonski L. Farmed mussels (Mytilus galloprovincialis) from the Black Sea reveal seasonal differences in their neutral and polar lipid fatty acids profile. Reg Stud Mar Sci. 2021;44, Art. #101782. https://doi.org/10.1016/j.rsma.2021.101782
9. Hosomi R, Yoshida M, Fukunaga K. Seafood consumption and components for health. Glob J Health Sci. 2012;4:72–86. https://doi.org/10.5539/gjhs.v4n3p72
10. Yaghubi E, Carboni S, Snipe RMJ, Shaw CS, Fyfe JJ, Smith CM, et al. Farmed mussels: A nutritive protein source, rich in omega-3 fatty acids, with a low environmental footprint. Nutrients. 2021;13(4), Art. #1124. https://doi.org/ 10.3390/nu13041124
11. Carboni S, Kaur G, Pryce A, McKee K, Desbois AP, Dick JR, et al. Fatty acid: Mussel consumption as a “food first” approach to improve omega-3 status. Nutrients. 2019;11(6), Art. #1381. https://doi.org/10.3390/nu11061381
12. Cherifi H, Sadok S. Effects of marinating process on mussels physicochemical and microbiological quality attributes during refrigerated storage. Bull Inst Natl Sci Technol Mer Salammbô. 2016;43:5–17.
13. Ersoy B, Şereflişan H. The proximate composition and fatty acid profiles of edible parts of two freshwater mussels. Turk J Fish Aquat Sci. 2010;10:71–74.
14. Gualda IP, de Santos VJ, Figueiredo IL, Petenuci ME, Visentainer JV. Centesimal composition, fatty acids profile and the nutritional quality index of four seafood species from the southern region of Brazil. Acta Sci Technol. 2018;40(1), Art. # e39351. https://doi.org/10.4025/actascitechnol.v40i1.39351
15. Santos-Silva J, Bessa RJB, Santos-Silva F. Effect of genotype, feeding system and slaughter weight on the quality of light lambs. II. Fatty acid composition of meat. Livest Prod Sci. 2002;77:187–194. https://doi.org/10.1016/S030 1-6226(02)00059-3
16. Grkovic N, Dimitrijevic M, Teodorovic V, Karabasil N, Vasilev D, Stajkovic S, et al. Factors influencing mussel (Mytilus galloprovincialis) nutritional quality. IOP Conf Ser Earth Environ Sci. 2019;333, Art. #012062. https://doi.org/10 .1088/1755-1315/333/1/012062
17. Lombard AT, Grant WS. Biochemical population genetics of the black mussel Choromytilus meridionalis. S Afr J Zool. 1986;21:131–135. https://doi.org/1 0.1080/02541858.1986.11447969
18. Heinecken C, Japp D, Olivier D. Concept for a proposed sea-based aquaculture development zone in Saldanha Bay, South Africa. Cape Town: Capricorn Marine Environment Report; 2017.
19. Carpenter KE, de Angelis N. Mussels: Mytilidae. In: Carpenter KE, de Angelis N, editors. The living marine resources of the eastern central Atlantic. Vol. 2: Bivalve, gastropods, hagfishes, sharks, batoid fishes, and chimaeras. Rome: Food and Agriculture Organization of the United Nations; 2016. p. 708–711.
https://doi.org/10.17159/sajs.2025/21022
20. Grant WS, Cherry MI, Lombard AT. A cryptic species of Mytilus (Mollusca: Bivalvia) on the west coast of South Africa. S Afr J Mar Sci. 1984;2:149–162. https://doi.org/10.2989/02577618409504366
21. Firth DC. Temporal and inter-species variations in the proximate and contaminant compositions of farmed mussels, Choromytilus meridionalis and Mytilus galloprovincialis, from Saldanha bay, South Africa. Stellenbosch: Stellenbosch University; 2018.
22. Van Erkom Schurink C, Griffiths CL. Factors affecting relative rates of growth in four South African mussel species. Aquaculture. 1993;109:257–273. http s://doi.org/10.1016/0044-8486(93)90168-X
23. Du Plessis AJ. Larval development, settlement and growth of the black mussel Choromytilus meridionalis in the Saldanha Bay region. Trans R Soc S Afr. 1977;42:303–316. https://doi.org/10.1080/00359197709519919
24. Firth DC, O’Neill B, Salie K, Hoffman LC. Monitoring of organic pollutants in Choromytilus meridionalis and Mytilus galloprovincialis from aquaculture facilities in Saldanha Bay, South Africa. Mar Pollut Bull. 2019;149, Art. #110637. https://doi.org/10.1016/j.marpolbul.2019.110637
25. Hubbart B, Pitcher GC, Krock B, Cembella AD. Toxigenic phytoplankton and concomitant toxicity in the mussel Choromytilus meridionalis off the west coast of South Africa. Harmful Algae. 2012;20:30–41. https://doi.org/10.1 016/j.hal.2012.07.005
26. Kyriacou K. Intertidal shellfish as a source of protein and energy for the Middle Stone Age inhabitants of the southwestern Cape and northern KwaZulu-Natal, South Africa. Quat Int. 2017;438:30–39. https://doi.org/10.1016/j.quaint.20 17.01.032
27. Matika S, Oyenihi A, Henning S. Proximate analysis and fatty acid composition of hot-smoked underutilised South African black mussel (Choromytilus meridionalis, Krauss 1848) [preprint]. Preprints.org. Version 1. 2024. https:/ /www.preprints.org/manuscript/202407.0298/v1
28. Haouet MN, Altissimi MS, Framboas M, Galarini R. Validation of the Volhard method for chloride determination in food. Accredit Qual Assur. 2006;11:23–28. https://doi.org/10.1007/s00769-006-0116-x
29. Association of Official Analytical Chemists (AOAC). Official methods of analysis of the Association of Official Analytical Chemists. 15th ed. Rockville, MD: AOAC; 1990.
30. Oyenihi AB, Opperman M, Alabi TD, Mpahleni B, Masola B. Centella asiatica alleviates diabetes-induced changes in fatty acid profile and oxidative damage in rat testis. Andrologia. 2020;52(10), Art. #e13751. https://doi.org/10.111 1/and.13751
32. Peycheva K, Panayotova V, Stancheva R, Makedonski L, Merdzhanova A, Cammiller G, et al. Effect of steaming on chemical composition of Mediterranean mussel (Mytilus galloprovincialis): Evaluation of potential risk associated with human consumption. Food Sci Nutr. 2022;10:3052–3061. https://doi.org/10.1002/fsn3.2903
33. Murray GD, Fail R, Fairbanks L, Campbell LM, D’Anna L, Stoll J. Seafood consumption and the management of shellfish aquaculture. Mar Policy. 2023;150, Art. #105534. https://doi.org/10.1016/j.marpol.2023.105534
34. Nguyen L, Gao Z, Anderson JL. Perception shifts in seafood consumption in the United States. Mar Policy. 2023;148, Art. #105438. https://doi.org/10.1 016/j.marpol.2022.105438
35. Abu OMG, Eli NP. Effect of smoke drying on proximate composition and some heavy metals in shrimp and oyster from Buguma Creek, Rivers State, Nigeria. Int J Poult Fish Sci. 2018;2:1–5. https://doi.org/10.15226/2578-1898/2/1/00108
36. Biji KB, Shamseer RM, Mohan CO, Ravishankar CN, Mathew S, Gopal TKS. Effect of thermal processing on the biochemical constituents of green mussel (Perna viridis) in tin-free-steel cans. J Food Sci Technol. 2015;52:6804–6809. https://doi.org/10.1007/s13197-015-1757-8
37. Liu C, Ji W, Jiang H, Shi Y, He L, Gu Z, et al. Comparison of biochemical composition and non-volatile taste active compounds in raw, high hydrostatic pressure-treated and steamed oysters Crassostrea hongkongensis. Food Chem. 2021;344(5), Art. #128632. https://doi.org/10.1016/j.foodchem.2020.128632
38. Lawrie RA, Ledward DA. Lawrie’s meat science. 7th ed. New York: CRC Press; 2006. https://doi.org/10.1533/9781845691615
39. Muñoz I, Guàrdia MD, Arnau J, Dalgaard P, Bover S, Fernandes JO, et al. Effect of the sodium reduction and smoking system on quality and safety of smoked salmon (Salmo salar). Food Chem Toxicol. 2020;143, Art. #111554. https:/ /doi.org/10.1016/j.fct.2020.111554
40. Cardinal M, Knockaert C, Torrissen O, Sigurgisladottir S, Mørkøre T, Thomassen M, et al. Relation of smoking parameters to the yield, colour and sensory quality of smoked Atlantic salmon (Salmo salar). Food Res Int. 2001;34:537–550. https://doi.org/10.1016/S0963-9969(01)00069-2
41. Pedro S, Nunes ML. Reducing salt levels in seafood products. In: Beeren C, Groves K, Titoria PM, editors. Reducing salt in foods. Sawston: Woodhead Publishing; 2019. p. 185–211.https://doi.org/10.1016/B978-0-08-100890-4.00008-1
42. Pretorius B, Schönfeldt HC. The contribution of processed pork meat products to total salt intake in the diet. Food Chem. 2018;238:139–145. https://doi.org/ 10.1016/j.foodchem.2016.11.078
43. Fernández A, Grienke U, Soler-Vila A, Guihéneuf F, Stengel DB, Tasdemir D. Seasonal and geographical variations in the biochemical composition of the blue mussel (Mytilus edulis L.) from Ireland. Food Chem. 2015;177:43–52. https://doi.org/10.1016/j.foodchem.2014.12.062
44. Wright AC, Fan Y, Baker GL. Nutritional value and food safety of bivalve molluscan shellfish. J Shellfish Res. 2018;37:695–708. https://doi.org/10. 2983/035.037.0403
45. Grković N, Teodorović V, Djordjević V, Karabasil N, Stajković S, Vasilev D, et al. Biochemical composition and biometric parameters of Mytilus galloprovincialis from Boka Kotorska Bay in Southern Adriatic Sea. J Hell Vet Med Soc. 2020;71:2338–2348. https://doi.org/10.12681/jhvms.25095
46. Srilatha G, Chamundeeswari K, Ramamoorthy K, Sankar G, Varadharajan D. Proximate, amino acid, fatty acid and mineral analysis of clam, Meretrix casta (Chemnitz) from Cuddalore and Parangipettai Coast, South East Coast of India. J Mar Biol Oceanogr. 2013;2(2), Art. #1000111. https://doi.org/10 .4172/2324-8661.1000111
47. Periyasamy N, Srinivasan M, Devanathan K, Balakrishnan S. Nutritional value of gastropod Babylonia spirata (Linnaeus, 1758) from Thazhanguda, Southeast coast of India. Asian Pac J Trop Biomed. 2011;1:S249–S252. http s://doi.org/10.1016/S2221-1691(11)60164-0
48. Neri TA, Nguyen TT, Nguyen THP, Rohmah Z, Jeong SB, Hwang DJ, et al. Effect of season and processing steps in nutritional components and bioactivities of blue mussel (Mytilus edulis). Int Food Res J. 2021;28(4):752–762. https://d oi.org/10.47836/ifrj.28.4.12
49. Prato E, Biandolino F, Parlapiano I, Giandomenico S, Denti G, Calò M, et al. Proximate, fatty acids and metals in edible marine bivalves from Italian market: Beneficial and risk for consumers health. Sci Total Environ. 2019;648:153–163. https://doi.org/10.1016/j.scitotenv.2018.07.382
50. Merdzhanova A, Dobreva DA, Stancheva M, Makedonski L. Fat soluble vitamins and fatty acid composition of wild Black Sea mussel, rapana and shrimp. Ovidius Univ Ann Chem. 2014;25:15–23. https://doi.org/10.2478/ auoc-2014-0003
51. Chakraborty K, Chakkalakal SJ, Joseph D, Asokan PK, Vijayan KK. Nutritional and antioxidative attributes of green mussel (Perna viridis L.) from the southwestern coast of India. J Aquat Food Prod Technol. 2016;25:968–985. https://doi.org/10.1080/10498850.2015.1004498
52. Moruf OR, Ogunbambo MM, Taiwo MA, Afolayan OA. Marine bivalves as dietary source of high-quality lipid: A review with special reference to natural n-3 long chain polyunsaturated fatty acids. Bull Univ Agric Sci Vet Med ClujNapoca Food Sci Technol. 2020;78:11–18. https://doi.org/10.15835/buasv mcn-fst:2020.0064
53. Swanson D, Block R, Mousa SA. Omega-3 fatty acids EPA and DHA: Health benefits throughout life. Adv Nutr. 2012;3(1):1–7. https://doi.org/10.3945/a n.111.000893
54. Biandolino F, Parlapiano I, Denti G, di Nardo V, Prato E. Effect of different cooking methods on lipid content and fatty acid profiles of Mytilus galloprovincialis. Foods. 2021;10, Art. #416. https://doi.org/10.3390/food s10020416
https://doi.org/10.17159/sajs.2025/21022
55. Akoh CC, Min DB. Food lipids. Chemistry, nutrition, and biotechnology. 2nd ed. New York: Marcel Dekker; 2002.
56. Zhou M, Balaban MO, Gupta S, Fletcher GC. Comparison of lipid classes and fatty acid profiles of lipids from raw, steamed, and high-pressure-treated New Zealand greenshell mussel meat of different genders. J Shellfish Res. 2014;33:473–479. https://doi.org/10.2983/035.033.0216
57. Bejaoui S, Rabeh I, Ghribi F, Aouini F, Chetoui I, Telahigue K, et al. Change in fatty acid composition and evaluation of lipids and protein oxidation in the commercial cooked clams (Ruditapes decussatus). Grasas Aceites. 2019;70(4), Art. #e324. https://doi.org/10.3989/gya.1045182
58. Chen J, Liu H. Nutritional indices for assessing fatty acids: A mini review. Int J Mol Sci. 2020;21:1–24. https://doi.org/10.3390/ijms21165695
59. Simopoulos AP. The importance of the ratio of omega-6/omega-3 essential fatty acids. Biomed Pharmacother. 2002;56:365–379. https://doi.org/10.10 16/S0753-3322(02)00253-6
AuthorS: Mosima M. Mabitsela1
Sydney Mavengahama2
Marthinus J. Booysen3 Ethel E. Phiri4
AFFILIAtIoNS:
1Department of Agronomy, Stellenbosch University, Stellenbosch, South Africa
2Food and Safety Focus Area, North-West University, Mmabatho, South Africa
3Department of Industrial Engineering, Stellenbosch University, Stellenbosch, South Africa
4Dean’s Division, Faculty of AgriSciences, Stellenbosch University, Stellenbosch, South Africa
CorrESPoNDENCE to: Ethel Phiri
EMAIL: ephiri@sun.ac.za
DAtES:
r eceived: 18 June 2024
r evised: 11 Apr. 2025
Accepted: 17 Apr. 2025
Published: 11 Aug. 2025
hoW to CItE:
Mabitsela MM, Mavengahama S, Booysen MJ, Phiri EE. Characterisation of Bambara groundnut landraces: Nutritional and proximate composition. S Afr J Sci. 2025;121(7/8), Art. #18925. https:// doi.org/10.17159/sajs.2025/18925
Characterisation of Bambara groundnut landraces: Nutritional and proximate composition
Bambara groundnut (BGN) is a promising but underutilised legume, and there is limited research on its nutritional composition. In this study, we sought to assess the nutritional makeup of 70 BGN landraces, focusing on proximate, mineral, carbohydrate, amino acid, and fatty acid content. Results revealed sucrose as the predominant sugar (91%) with an average gross energy of 17.21 MJ/kg, and with fat content at 6.34% and crude protein at 19.20%. Tryptophan was the least available essential amino acid. Notable saturated fatty acids included linoleic acid (41%) and oleic acid (21%). Potassium and sodium emerged as primary macrominerals, whilst iron dominated amongst microminerals. In addition to these positive attributes, BGN was consistent in other nutritional parameters. The proximate analysis (ash, moisture, acid detergent fibre, and neutral detergent fibre content) fell within the typical ranges observed in most legumes. Of the 70 landraces, 6 (BGN 13, 23, 35, 48, 55, and 57) exhibited superior nutritional profiles. The identification of these specific landraces with superior nutritional profiles offers practical guidance for targeted cultivation efforts. That is, by strategically selecting and cultivating these landraces, it may become possible to maximise the nutritional benefits of BGN and address specific dietary deficiencies. This approach aligns with the overarching goal of ensuring food security and improving nutrition outcomes globally, and specifically on the African continent.
Significance:
• BGN holds promise for enhancing food security in sub-Saharan Africa.
• This research highlights the nutritional composition of BGN, addressing prevalent nutrient deficiencies in the region.
• Understanding the nutritional value of BGN enables informed agricultural strategies, promotes its cultivation as a sustainable nourishment source and enhances resilience against food insecurity.
• Identifying specific landraces with superior nutritional profiles offers practical insights for targeted cultivation efforts.
• Targeted cultivation can maximise the nutritional benefits of BGN.
• This research provides a tangible pathway to address dietary deficiencies and advocate for healthier, more sustainable diets.
Introduction
The production of nutritionally dense and healthy food is a pressing issue in agriculture.1,2 This issue has arisen because of growing populations, climate change, increasing food demand and the depletion of natural resources.3 In addition, climate-related challenges threaten the nutritional status of staple crops. In sub-Saharan Africa, more than 30 million people are reported to be malnourished as they do not have access to a healthy and nutritious balanced diet.4 The inability to access nutritious food promotes poor health and increases food insecurity challenges in many countries. It is therefore important to consider the cultivation of nutrition-dense crops, moving towards the direction of nutrient-sensitive agriculture, which recognises the critical link between agriculture and nutrition, promoting crops, such as legumes, that provide not only calories but also essential nutrients.5
Legumes stand out globally as economical and sustainable alternatives to meat, constituting a crucial source of proteins, carbohydrates, amino acids, fats, and a wide range of other essential nutrients.6 In particular, the prominence of proteins in legumes, coupled with a significant presence of the essential amino acid lysine, positions them as a nutritional powerhouse.7 This lysine content is particularly advantageous as it effectively complements cereals, which are commonly deficient in lysine and proteins.8 9
Despite the nutritional significance of legumes, their optimal utilisation relies on a comprehensive understanding of their functional properties and nutritional value.7 Unfortunately, many legumes have been overlooked, both in terms of potential improvement and consumption. Bambara groundnut (BGN), often classified as an underutilised legume, emerges as a standout example with considerable untapped potential. Recognised as a comprehensive food source, BGN seeds boast richness in various essential nutrients, rendering them a valuable dietary resource.10-12 Expanding dietary choices to incorporate lesser-known legumes, such as BGN, presents a unique opportunity to not only enrich nutritional intake but also effectively address dietary deficiencies.13 The multifaceted benefits of incorporating such underutilised legumes highlight the importance of broadening our perspectives on dietary diversity for enhanced overall nutrition.
Bambara groundnut is increasingly promoted for cultivation owing to its status as a low-input crop, requiring minimal external inputs for successful growth.14 15 This classification indicates that BGN requires fewer agricultural resources (i.e. seeds, fertilisers, herbicides, etc.) to attain satisfactory yields compared to other crops, such
https://doi.org/10.17159/sajs.2025/18925
as maize and wheat.16,17 This makes BGN an attractive and sustainable option for farmers, particularly in regions where resources are limited or where a focus on reducing input costs is essential. Cultivating this underutilised legume can contribute to food security and improve agricultural sustainability.18
Bambara groundnuts are cultivated from landraces whose nutritional composition is poorly studied and documented. Siwale et al.19 estimated the protein content, starch components as well as selected minerals and their bioavailability in 59 BGN landraces. In another study, Mbuma et al.20 analysed 64 southern African BGN landraces for protein content, selected minerals, oil content and fatty acids, whilst Hlanga et al.21 evaluated the mineral, protein, moisture, ash, and starch contents of 19 BGN landraces. Yao et al.22 evaluated the fatty acid, amino acid, and mineral compositions of 10 BGN landraces from Côte d’Ivoire. Atoyebi et al.23 assessed the mineral, total carbohydrate, amino acid, and proximate compositions of 20 BGN landraces from Nigeria, whilst Baptista et al.24 determined the fat, fatty acid, amino acid, and protein contents of two BGN landraces from Mozambique. All these studies reported significant variation in the nutritional profiles of BGN but did not provide a full and comprehensive analysis of the nutritional profiles of all the landraces that they studied. That is, they focused only on a few nutritional parameters and did not specify which landraces were under investigation. There is also a lack of studies evaluating crude protein and amino acids, gross energy, and carbohydrates in the form of sugars.
Therefore, a comprehensive analysis of the nutritional composition of individual BGN landraces is vital to identify those landraces that are superior to others. This study fills this research gap through the evaluation of the nutritional composition of 70 BGN landraces. We determined the carbohydrate, amino acid, fatty acid, and mineral contents and proximate composition (acid detergent fibre [ADF], neutral detergent fibre [NDF], ash, crude protein, fat, gross energy, and moisture) of the 70 landraces.
Materials and methods
sample and preparation
Bambara groundnut seeds used in this study were obtained from subsistence farmers in the Limpopo Province (23.4013°S, 29.4179°E) of South Africa. The seeds were sorted and grouped by seed coat colour/pattern, eye colour/pattern, and testa colour/pattern according to
the International Plant Genetic Resources Institute’s BGN identification guidelines.25 Seventy landraces were identified (Figure 1). The nutritional content of these landraces was determined from mature seeds harvested in a soilless cultivation study that was conducted over two trial periods during the 2021/2022 and 2022/2023 planting seasons at Stellenbosch University’s Welgevallen Experimental Farm (33.9427°S, 18.8664°E). Preliminary results on the nutritional analysis of seeds harvested in aeroponics and hydroponics showed no significant differences between the treatments. Therefore, the data from different replications were pooled for further analysis. At harvest, pods were dried at ambient temperature (25–30 °C), after which they were manually shelled, with only healthy seeds used in the nutrition analysis. Prior to analysis, the seeds were ground into a fine powder using a Philips HR2141/90 Daily Collection Blender. The blending was carried out for 15 min until a uniform, fine-textured powder was obtained.
Nutritional analysis
Carbohydrates in the form of sugars, amino acids, and fatty acids
Sugars, amino acids, and fatty acids were analysed using a gas chromatography–mass spectrometer (6890N, Agilent Technologies Network) coupled to an inert XL EI/CI mass selective detector (5975, Agilent Technologies Inc., Palo Alto, CA, USA).
Mineral content
Macro- and microminerals were determined using an inductively coupled plasma optical emission spectrometer (PerkinElmer, USA) according to method 999.11 of the Association of Official Analytical Chemists (AOAC).26
Gross energy
Gross energy was determined using the C-6000 bomb calorimeter (IKA, Staufen, Germany). The gross energy value was presented in MJ/kg.
Acid detergent fibre and neutral detergent fibre
ADF and NDF were determined using the Ankom Fibre Analyser (ANKOM200, Ankom Technology, New York, USA), according to the method of Van Soest et al.27
Figure 1: Bambara groundnut seeds (landraces) as used in this study. Seed separation and sorting were performed according to the International Plant Genetic Resources Institute’s25 descriptors for Bambara groundnut.
Crude protein, fat, moisture, and ash
Crude protein (method: 992.23 using the LECO 828/928 series instrument), total fat (method: 920.38), ash content (method: 942.05), and moisture content (method: 934.01) were all determined according to the methods of the AOAC.26
data analysis
Data were analysed and visualised using R version 4.3.2 statistical software. Basic statistics (minima, maxima, ranges, means, standard errors [SE] and coefficients of variation) were determined for each nutritional parameter, using the descry function of the summary tools package. Principal component analysis was conducted to provide a description of the variance and covariance of landraces in relation to the nutritional parameters. This was carried out using the prcomp function of the factoextra package.
r esults and discussion
Carbohydrates in the form of sugars
Carbohydrates are an excellent source of the energy required by humans for metabolic regulation. Sucrose (91%), with a mean of 2.756 mg/g (SE±0.069), was the most abundant sugar in BGN, followed by myo-inositol (2%) and D-glucose (2%) (Table 1, Supplementary table 1).
Sucrose had the highest coefficient of variation, indicating that there was a large variation of this sugar between the landraces (Table 1, Supplementary table 1).
Unpublished research by Zidubule28 also indicated that sucrose was the dominant sugar in BGN, but the values reported were much lower than those in the current study. Similarly, the sucrose, fructose, and glucose amounts found in this study (Table 1) were much higher than those reported by Apata29 when assessing the effect of cooking methods on the available and unavailable carbohydrates of BGN landraces from Nigeria.
Compared with other landraces, BGN 23 had the highest sucrose (4.126 mg/g), D-fructose (0.090 mg/g), sorbitol (0.0972 mg/g), and glucose (0.077 mg/g) contents (Supplementary table 1), whereas BGN 3 had the lowest amounts of sucrose (0.158 mg/g), D-fructose (0.002 mg/g), sorbitol (0.001 mg/g), and glucose (0.002 mg/g) (Supplementary table 1). The abundance of sucrose, glucose, and D-fructose in the mature seeds contributes to the sweetness of BGN, with sucrose being the highest contributor (Table 1). Massawe et al.30 reported that the sweet taste of BGN is an important trait for farmers in Botswana, Namibia and Eswatini when selecting landraces.
D-Galactose (0.015 mg/g) and mannitol (0.019 mg/g) were the least abundant sugars in the landraces (Supplementary table 1). Similar results were observed by Bravo et al.31 who assessed the composition of underutilised Indian pulses. They reported that monosaccharides (galactose and maltose) were the least available in green gram, haricot bean, black gram, and chickpea. Oligosaccharides, such as raffinose and stachyose, were not detected in the landraces (Table 1). These
sugars contribute to the indigestibility of legumes and, consequently, abdominal discomfort.31
Within the biplot, there were two clear groupings of sugars. Group 1 consisted of two disaccharides (D-maltose and sucrose) and one monosaccharide (myo-inositol), and Group 2 consisted of five monosaccharides (D-glucose, D-fructose, D-galactose, sorbitol, and mannitol) (Figure 2). The two principal components accounted for 64.9% of the variation in the total sugar content among the landraces (Figure 2). Dimension-1 accounted for 49.3% of the total variation and dimension-2 for 15.6% of the total variation (Figure 2). BGN 12, 20, 22, 23, 26, 27, 29, 39 and 60 were positively associated with dimension-1, showing that they contained high levels of sucrose, myo-inositol, D-galactose, D-maltose, sorbitol, and mannitol (Figure 2). Landraces in the second and third quadrants showed no association with the sugars, indicating that they contained below average quantities of all identified sugars (Figure 2). BGN 3 showed below mean values for mannitol and sorbitol and a weak association with all the sugars.
When studying the nutritional profile of cultivated and wild jute, Choudhary et al.32 reported that genotypes that normally group alone might be highly superior and diverse from other lines in one or more nutritional parameters.
Fatty acids
There is a worldwide interest in identifying low-cost legumes that are high in essential fatty acids. The main unsaturated fatty acids found in BGN were linoleic acid (41%) and oleic acid (21%), with a mean (±SE) of 2.202±0.0709 mg/g and 1.141±0.0392 mg/g, respectively (Table 2, Supplementary table 2). The linoleic acid content varied from 1.355 mg/g to 4.892 mg/g, with a range of 3.457 mg/g, whilst the oleic acid content varied from 0.686 mg/g to 2.301 mg/g (Table 2, Supplementary table 2). The high accumulation of linoleic and oleic acids in the landraces quantifies BGN as a major source of essential fats required by humans. BGN 13 contained the highest linoleic acid (4.892 mg/g), which was higher than the total average of 3.58 mg/g reported by Yao et al.22 in BGN, Grelaap and Giinterb33 in field peas (2.100 mg/g), and Rybiński et al.34 in white lupins (2.029 mg/g). Overall, the mean linoleic acid (4.892 mg/g) and oleic acid (2.301 mg/g) of BGN 13 were comparable to that of soybean (5.4 mg/g and 2.3 mg/g, respectively) (Supplementary table 2).
Reports have shown that fats normally found in legumes are mostly unsaturated, in contrast to animal protein that is mostly composed of saturated fats.35 This is in agreement with our findings, with unsaturated fatty acids being the most abundant in the landraces (Table 2, Supplementary table 2). Unsaturated fats are categorised into omega 3, 6, and 9 fatty acids. The most common omega 3 fatty acid present in the landraces was alpha-linoleic acid, with linoleic acid being the most common omega 6. Oleic acid and erucic acid were the most common omega 9 fatty acids (Table 2, Supplementary table 2).
https://doi.org/10.17159/sajs.2025/18925
table 1: Carbohydrates in the form of sugars identified in Bambara groundnut landraces
PCA - Biplot
Figure 2: Principal component analysis of the landrace–trait relationship between carbohydrates in the form of sugars and Bambara groundnut landraces.
table 2: Summary statistics of fatty acids identified in the Bambara groundnut landraces
acid + alpha-linoleic acid (C20:1 + C18:3n3)
acid (C22)
acid (C22:2)
Lingoceric acid (C24)
In the biplot, the principal components accounted for 88.9% of the total variation in the fatty acid content between the landraces (Figure 3). Dimension-1 accounted for 81.6% of the total variation, and dimension-2
https://doi.org/10.17159/sajs.2025/18925
accounted for 7.3% of the total variation. In the second quadrant, BGN 57 and 67 were positively associated with palmitoleic acid (Figure 3). In the third quadrant, BGN 1,3, 4, and 13 were positively associated with
linoleic acid, arachidic acid, behenic acid, palmitic acid, heptadecanoic acid, and eicosenoic acid + alpha-linoleic acid (Figure 3). Landraces in the first and fourth quadrants showed no association with the fatty acids.
amino acids
Essential amino acids cannot be produced by the body; therefore, they must be obtained through the diet. The studied BGN landraces are a good source of amino acids as they contain all essential amino acids in varying amounts (Table 3, Supplementary table 3). Of the essential amino acids, lysine was the most abundant (13%), with tryptophan being the least abundant (Table 3, Supplementary table 3).
Landraces in this study were low in sulfur-containing amino acids, i.e. methionine and cysteine (Table 3). Similar findings of low levels of sulfur-containing amino acids were observed by Erbersdobler et al.36 when evaluating the nutrients and protein of lupins and faba beans.
BGN 57 showed the highest mean values for lysine (27.76 mg/g), histidine (8.42%), and methionine (2.9%). In contrast, BGN 33, 2, and 62 had the lowest mean values for methionine (0.076 mg/g), histidine (1.19 mg/g), and lysine (3.64 mg/g), respectively. Even though tryptophan was the least abundant essential amino acid, BGN 70 (0.12 mg/g) and BGN 46 (0.07 mg/g) indicated higher tryptophan mean values than all other landraces (Table 3, Supplementary table 3). Glutamic acid (35.44 mg/g) and aspartic acid (26.84 mg/g) were the most abundant non-essential amino acids (Table 3, Supplementary table 3). Yao et al.22 and Baptista et al.24 observed similar results when evaluating the nutritional profile of BGN.
Within the biplot, dimension-1 accounted for 73.7% of the total variation and dimension-2 accounted for 15.5% of the total variation (Figure 4).
BGN 14, 19, 35, 57, 66, and 70 were positively associated with
(81 6%)
dimension-1 as they contained higher levels of lysine, histidine, valine, isoleucine, methionine, cysteine, and tryptophan. BGN 40, 54, and 55 were not in proximity to any of the amino acids, meaning that they contained the lowest amounts of all the amino acids when compared with other landraces (Figure 4).
Minerals and proximate analysis
Minerals
Whilst there have been studies on the macro- and micromineral diversity of BGN, many of these studies have not adequately addressed a representative variation of landraces. This gap in the literature highlighted the need for more comprehensive and inclusive studies that encompass a wider range of landraces to gain a more holistic understanding of their mineral composition and nutritional potential. In this study, potassium (42%), iron (13%) and sodium (12%) were the most abundant minerals in the landraces (Table 4, Supplementary table 4).
Magnesium (6%) and calcium (1%) were the least abundant macrominerals, whilst manganese (6%) and copper (2%) were the least abundant microminerals (Supplementary table 4). The high accumulation of potassium, phosphorus, magnesium, zinc, and iron in the landraces (Table 4, Supplementary table 4) makes BGN comparable with other common legumes, such as soybean, lupins, peanuts, and chickpeas.37
The potassium, sodium and iron contents found in this study were higher than those reported by Affrifah et al.38 in cowpeas, namely potassium (1.112%), sodium (0.0016%), and iron (0.0083%).
BGN 55 had the highest mean percentage for potassium (2.13%), phosphorus (0.57%), sodium (0.56%), zinc (0.34%), magnesium (0.22%), and calcium (0.08%) (Table 4, Supplementary table 5). BGN 30 had
C16
C16A1
C17
C18
C18A1c is C18A2c is C20 C20A1PC18A3n3 C22
Figure 3: Principal component analysis of the landrace–trait relationship between fatty acids and Bambara groundnut landraces.
*Essential amino acid
the highest mean percentage for iron (0.54%) and copper (0.06%), whilst BGN 61 had the highest mean percentage for manganese (Supplementary table 4).
Proximate composition
Proximate analyses provide crucial information on the nutritional value of food. However, information on the proximate composition related to the quality of BGN landraces is scarce. In addition, there have been no studies that report on the gross energy levels of BGN, making this study the first report. BGN contained higher amounts of crude protein (32%), NDF (30%), moisture (14%) and fat (13%) when compared to other proximate parameters (Table 4, Supplementary table 5). The mean crude protein of the landraces was 19.20%, which was higher than that reported by Anaemene and Fadupin39 in maize (10%) and by Tasie40 in sorghum (12%).
Amongst the BGN landraces studied, BGN 16 exhibited the highest crude protein content at 36.87%, whilst BGN 30 had the lowest at 16.44% (Table 4, Supplementary table 5). This observation emphasises the significance of BGN as a valuable source of protein. Moreover, the substantial protein content in BGN 16 and other landraces highlights the potential of BGN to alleviate protein deficiencies, positioning it as a vital plant-based protein resource in areas with restricted access to animal-derived proteins and regions where economically accessible meat-based protein sources may be limited.
The NDF content within the BGN landraces exhibited a significant variation, ranging from 10.52% to 65.09%, with a total range of 54.56%. BGN 38 displayed the highest NDF percentage at 65.08%, whilst BGN 19 had the lowest NDF percentage at 11.40% (Table 4).
The ADF content ranged from 0.797% to 18.612%, with BGN 40 demonstrating the highest ADF percentage at 18.72%, in contrast to BGN 31, which had the lowest ADF content at 0.80%. This observation aligns with Eskandari et al.’s41 findings, indicating that foods with a low ADF
https://doi.org/10.17159/sajs.2025/18925
content tend to have higher energy and digestibility compared to those with a high NDF content (Table 4, Supplementary table 5). Consequently, BGN 38, with its higher NDF value, is considered a relatively low-energy food source, whilst BGN 31, with its lower ADF content, is considered a more energy-rich and digestible option, reflecting the nutritional diversity within BGN landraces.
The ash and moisture content of the BGN landraces displayed variations, with ash content ranging from 0.28% to 5.81% and moisture content ranging from 3.50% to 15.90% (Table 4, Supplementary table 5). Specifically, BGN 39 exhibited the lowest ash content at 0.28%, whilst BGN 34 had the highest ash content at 5.81%. These findings are in alignment with the guidelines reported by Harris and Marshall42, suggesting that the ash content of any food should ideally fall within the range of 0–12% to be considered suitable for human consumption. Therefore, the ash content of BGN landraces falls well within this recommended range, affirming their suitability for human consumption and underlining their nutritional value and safety as a food source.
In this study, the average total fat content amongst the BGN landraces was found to be 6.35%. BGN 48 exhibited the highest fat content at 8.84%, whilst BGN 67 had the lowest fat content at 3.98% (Supplementary table 5). In general, legumes are recognised for their relatively low-fat content, with peanuts being a notable exception because of their higher fat content. This characteristic is attributed to the fact that legumes like BGN typically store low quantities of lipids and high amounts of carbohydrates in their mature, dry seeds, thereby contributing to their overall low-fat content, as reported in previous research.43
The principal component accounted for 56.9% of the total variation in the mineral content between the landraces. Dimension-1 accounted for 38.6% of the total variation, and dimension-2 accounted for 18.3% of the total variation (Figure 5). BGN 3, 20, 26, 30, and 55 were positively associated with dimension-1 as they contained higher amounts of
table 3: Summary statistics of the amino acids identified in Bambara groundnut landraces
potassium, phosphorus, iron, sodium, calcium, zinc, and magnesium (Figure 5). Landraces in quadrant 2 showed no association with the minerals in quadrant 4, that is, phosphorus, zinc, sodium, calcium, iron, and copper (Figure 5). Landraces in quadrant 3 were associated with manganese, indicating that those landraces had a higher mean percentage for manganese and a lower mean percentage for magnesium and potassium (Figure 5). These findings emphasise the distinct mineral profiles of different BGN landraces, highlighting the need for targeted
PCA - Biplot
cultivation and utilisation of specific landraces based on their nutritional attributes and mineral content.
The two principal components accounted for 43.1% of the total variation. Dimension-1 accounted for 25.7% of the variation, and dimension-2 accounted for 17.4% of the variation (Figure 6). In the first quadrant, BGN 52, 61, 68, and 69 were positively associated with moisture, indicating that these landraces had the highest moisture
...table 4 continues on next page
Leuc ine
oleuc ine
Figure 4: Principal component analysis of the landrace–trait relationship between the amino acids and the 70 Bambara groundnut landraces.
table 4: Summary statistics of the macrominerals, microminerals and proximate composition of Bambara groundnut landraces
table 4 continued...
Figure 5: Principal component analysis of the landrace–trait relationship amongst the mineral elements and Bambara groundnut landraces.
content (Figure 6). BGN 38 had a higher NDF content than all other landraces; it therefore shows a strong positive association with NDF in the second quadrant (Figure 6). Landraces in quadrant 3 were closely associated with gross energy and showed no association with moisture in quadrant 1. In quadrant 4, the landraces were positively associated with ADF, ash, and crude protein.
The gross energy levels varied from 17.10 MJ/kg to 18.31 MJ/kg, with a mean±SE of 17.63±0.023 MJ/kg, indicating that there was little to no variation in the gross energy levels between the landraces (Supplementary table 5). BGN 49 demonstrated the highest gross energy
https://doi.org/10.17159/sajs.2025/18925
level, measuring at 18.31 MJ/kg (Supplementary table 5), whereas the lowest gross energy was observed in BGN 11, with a value of 17.10 MJ/kg (Supplementary table 5). The gross energy level of BGN 49 positions it as a relatively good source of energy when compared to other landraces. The mean gross energy in the landraces was higher than that reported by Gemede and Birhanu44 in lima beans (14.19 MJ/kg) and by Liman45 in wild cowpea (14.40 MJ/kg) and Bosso cowpeas (15.78 MJ/kg) (Supplementary table 5). However, the mean gross energy of the studied landraces was lower than that reported by Zdunczyk et al.46 in soybean (19.1 MJ/kg) and pumpkin seeds (21.9 MJ/kg) and by Renaudeau et al.47 in clover (19.2 MJ/kg) and lucerne (20.5 MJ/kg).
PCA - Biplot
Conclusion
This comprehensive study of 70 BGN landraces has provided valuable insights into the nutritional profile of this underutilised legume. BGN has been shown to be a promising crop with significant potential to address food and nutrition insecurity, particularly in sub-Saharan Africa, where malnutrition remains a critical challenge. This research identified specific landraces with superior nutritional profiles, offering the potential for targeted cultivation to address specific dietary deficiencies.
The nutritional analysis revealed the richness of BGN in essential nutrients, making it a valuable source of protein, essential amino acids, fats, and minerals. Sucrose was identified as the predominant sugar, contributing to the legume’s sweetness, whilst essential fatty acids, such as linoleic acid and oleic acid, were found in substantial quantities, enhancing its dietary value. The presence of all essential amino acids, with lysine being the most abundant, highlights its potential to complement diets deficient in certain amino acids. Moreover, the mineral composition, notably high levels of potassium, iron, and sodium, emphasises its potential as a nutrient-dense crop.
In a world facing increasing food demand and climate-related challenges, diversifying diets with underutilised legumes like BGN could play a crucial role in improving nutrition and reducing food insecurity. Further research and promotion of this legume are essential to harness its full potential in addressing global nutritional needs and ensuring food security. The findings also align with the growing emphasis on nutrition-sensitive agriculture, as recommended by international organisations like the United Nations Food and Agriculture Organization.
Funding
The South African National Research Foundation provided funding to E.E.P. (grant SRUG220328968). MTN South Africa provided funding to M.J.B. through the MTN Mobile Intelligence Lab (grant S003061).
Data availability
The data are available upon request to the corresponding author.
Declarations
We have no competing interests to declare. We have no AI or LLM use to declare.
Authors’ contributions
M.M.M.: Conceptualisation, methodology, data collection, sample analysis, data analysis, validation, data curation, writing – the original draft, writing – revisions. S.M.: Conceptualisation, student supervision, validation, writing – revisions. M.J.B.: Conceptualisation, student supervision, project management, funding acquisition, validation, writing –revisions. E.E.P.: Conceptualisation, student supervision, project leadership, project management, funding acquisition, validation, writing –revisions. All authors read and approved the final manuscript.
r eferences
1. Duncan E, Ashton L, Abdulai AR, Sawadogo-Lewis T, King SE, Fraser EDG, et al. Connecting the food and agriculture sector to nutrition interventions for improved health outcomes. Food Secur. 2022;14(3):657–675. https://doi.or g/10.1007/s12571-022-01262-3
2. Fiedler JL. Food crop production, nutrient availability, and nutrient intakes in Bangladesh: Exploring the agriculture-nutrition nexus with the 2010 Household Income and Expenditure Survey. Food Nutr Bull. 2014;35(4):487–508. https:/ /doi.org/10.1177/156482651403500410
3. Fanzo J, Hunter D, Borreli T, Mattei F. Diversifying food and diets: Using agricultural biodiversity to improve nutrition and health. Issues in agricultural biodiversity. Rome: Bioversity International; 2013. https://cgspace.cgiar.org /bitstream/handle/10568/76788/Diversifying_food_and_diets.pdf?sequenc
Figure 6: Principal component analysis of the landrace–trait relationship amongst the proximate composition and the 70 Bambara groundnut landraces.
4. Owolade A, Mashavakure H, Babatunde AO, Aborode AT. Time to relook into non-communicable diseases (NCDs) in Africa: A silent threat overwhelming global health in Africa. Ann Med Surg. 2022;82, Art. #104522. https://doi.o rg/10.1016/j.amsu.2022.104522
5. Food and Agriculture Organization of the United Nations (FAO). Second International Conference on Nutrition (ICN2). Proceedings of the Roundtables. Rome: FAO; 2016. Available from: https://www.fao.org/3/i5483e/i5483e.pdf
6. Maphosa Y, Jideani VA, Maphosa L. Bambara groundnut production, grain composition and nutritional value: Opportunities for improvements. J Agric Sci. 2022;160(6):448–458. https://doi.org/10.1017/S0021859622000521
7. Mazahib AM, Nuha MO, Salawa IS, Babiker EE. Some nutritional attributes of bambara groundnut as influenced by domestic processing. Int Food Res J. 2013;20(3):1165–1171.
8. Huma N, Anjum M, Sehar S, Khan MI, Hussain S. Effect of soaking and cooking on nutritional quality and safety of legumes. Nutr Food Sci. 2008;38(6):570–577. https://doi.org/10.1108/00346650810920187
9. Temba MC, Njobeh PB, Adebo OA, Olugbile AO, Kayitesi E. The role of compositing cereals with legumes to alleviate protein energy malnutrition in Africa. Int J Food Sci Technol. 2016;51(3):543–554. https://doi.org/10.1111/ijfs.13035
10. Hillocks RJ, Bennett C, Mponda OM. Bambara nut: A review of utilisation, market potential and crop improvement. Afr Crop Sci J. 2012;20(1):1–16. Available from: https://www.ajol.info/index.php/acsj/article/view/78601
11. Effa EB, Uko AE. Food security potentials of bambara groundnut (Vigna subterranea (L.) Verdc.). Int J Sustain Dev. 2017;6(12):1919–1930.
12. Egedigwe-Ekeleme CA, Famurewa AC, Egedigwe UO, Onyeabo C, Kanu SC, Ogunwa SC, et al. Comparative studies on the amino acids, pesticide residue content, biogenic and toxic elements in an underutilized nut: Bambara groundnut (Vigna subterranea). J Trace Elem Min. 2023;3, Art. #100051. https://doi.org/10.1016/j.jtemin.2023.100051
13. Tan XL, Azam-Ali S, Von Goh E, Mustafa M, Chai HH, Ho WK, et al. Bambara groundnut: An underutilized leguminous crop for global food security and nutrition. Front Nutr. 2020;7, Art. #601496. https://doi.org/10.3389/fnut.2 020.601496
14. Aliyu S, Massawe F, Mayes S. Beyond landraces: Developing improved germplasm resources for underutilized species – a case for bambara groundnut. Biotechnol Genet Eng Rev. 2014;30(2):127–141. https://doi.org/ 10.1080/02648725.2014.992625
15. Muhammad I, Rafii MY, Ramlee SI, Hazim Nazli M, Harun AR, Oladosu Y, et al. Exploration of bambara groundnut (Vigna subterranea (L.) Verdc.), an underutilized crop, to aid global food security: Varietal improvement, genetic diversity and processing. Agronomy. 2020;10(6), Art. #766. https://doi.org/ 10.3390/agronomy10060766
16. Adu-Dapaah HK, Sangwan RS. Improving bambara groundnut productivity using gamma irradiation and in vitro techniques. Afr J Biotechnol. 2004; 3(5):260–265. https://doi.org/10.5897/AJB2004.000-2048
17. Mubaiwa J, Fogliano V, Chidewe C, Linnemann AR. Hard-to-cook phenomenon in bambara groundnut (Vigna subterranea (L.) Verdc.) processing: Options to improve its role in providing food security. Food Rev Int. 2017;33(2):167–194. https://doi.org/10.1080/87559129.2016.1149864
18. Khan MMH, Rafii MY, Ramlee SI, Jusoh M, Al-Mamun M. Bambara groundnut (Vigna subterranea L.): A climate-resilient crop to address food and nutritional security. J Underutil Crops Res. 2024;3(1):1–15. https://doi.org/10.4102/ju cr.v3i1.2
19. Siwale J, Labuschagne M, Shegro Gerrano A, Paterne A, Mbuma NW. Variation in protein content, starch components, selected minerals and their bioavailability in bambara groundnut accessions. J Food Compos Anal. 2023;115, Art. #104991. https://doi.org/10.1016/j.jfca.2022.104991
20. Mbuma NW, Labuschagne M, Siwale J, Hugo A. Diversity in seed protein content, selected minerals, oil content and fatty acid composition of the southern African bambara groundnut germplasm collection. J Food Compos Anal. 2022;109, Art. #104477. https://doi.org/10.1016/j.jfca.2022.104477
21. Hlanga N, Modi AT, Mathew I. Evaluating nutritional content among bambara groundnut lines. J Food Compos Anal. 2021;102, Art. #104053. https://doi. org/10.1016/j.jfca.2021.104053
22. Yao D, Kouassi K, Erba D, Scazzina F, Pellegrini N, Casiraghi M. Nutritive evaluation of the bambara groundnut Ci12 landrace [Vigna subterranea (L.) Verdc. (Fabaceae)] produced in Côte d’Ivoire. Int J Mol Sci. 2015; 16(9):21428–21441. https://doi.org/10.3390/ijms160921428
https://doi.org/10.17159/sajs.2025/18925
23. Atoyebi JO, Osilesi O, Adebawo O, Abberton M. Evaluation of nutrient parameters of selected African accessions of bambara groundnut (Vigna subterranea (L.) Verdc.). Am J Food Nutr. 2020;5(3):83–89. https://doi.or g/10.12691/ajfn-5-3-1
24. Baptista A, Pinho O, Pinto E, Casal S, Mota C, Ferreira IMPLVO. Characterization of protein and fat composition of seeds from common beans (Phaseolus vulgaris L.), cowpea (Vigna unguiculata L. Walp) and bambara groundnuts (Vigna subterranea L. Verdc) from Mozambique. J Food Meas Charac. 2017;11(2):442–450. https://doi.org/10.1007/s11694-016-9412-2
25. International Plant Genetic Resources Institute (IPGRI). Descriptors for bambara groundnut (Vigna subterranea). Rome: IPGRI; 2000. https://cgspac e.cgiar.org/handle/10568/97488
26. Association of Official Analytical Chemists (AOAC). Official methods of analysis. 19th ed. Rockville, MD: AOAC International; 2020. Available from: https://www.aoac.org/official-methods-of-analysis/
27. Van Soest PJ, Robertson JB, Lewis BA. Carbohydrate, methodology, metabolism and nutritional implications in dairy cattle. Methods for dietary fiber, neutral detergent fiber, and nonstarch polysaccharides in relation to animal nutrition. J Dairy Sci. 1991;74(10):3583–3597. https://doi.org/10.3 168/jds.S0022-0302(91)78551-2
28. Zidubule S. Use of biostimulants to assess the production of the underutilised legume, bambara groundnut [thesis]. Stellenbosch: Stellenbosch University; 2021. https://scholar.sun.ac.za/server/api/core/bitstreams/93017c4f-f0d4-4 321-8b33cfef3fb431a7/content
29. Apata DF. Effect of cooking methods on available and unavailable carbohydrates of some tropical grain legumes. Afr J Biotechnol. 2008;7(16):2940–2945.
30. Massawe FJ, Mayes S, Cheng A, Chai HH, Cleasby P, Symonds R, et al. The potential for underutilised crops to improve food security in the face of climate change. Procedia Environ Sci. 2015;29:140–141. https://doi.org/10.1016/j. proenv.2015.07.228
31. Bravo L, Siddhuraju P, Saura-Calixto F. Composition of underexploited Indian pulses. Comparison with common legumes. Food Chem. 1999;64(2):185–192. https://doi.org/10.1016/S0308-8146(98)00140-X
32. Choudhary SB, Kumar SH, Gobinda KP, Kumar AA, Ranjan SA, Hazra P, et al. Nutritional profile of cultivated and wild jute (Corchorus) species. Aust J Crop Sci. 2013;7(13):1973–1982.
33. Grelaap ER, Giinterb KD. Animal feed fatty acid composition and tocopherol content of some legume seeds. Anim Feed Sci Technol. 1995;52(3–4):325–331. https://doi.org/10.1016/0377-8401(94)00733-P
34. Rybiński W, Święcicki W, Bocianowski J, Börner A, Starzycka-Korbas E, Starzycki M. Variability of fat content and fatty acids profiles in seeds of a Polish white lupin (Lupinus albus L.) collection. Genet Resour Crop Evol. 2018;65(2):417–431. https://doi.org/10.1007/s10722-017-0542-0
35. Goldstein N, Reifen R. The potential of legume-derived proteins in the food industry. Grain Oil Sci Technol. 2023;5(4):167–178. https://doi.org/10.1016 /j.gaost.2022.06.002
36. Erbersdobler HF, Jahreis G, Erbersdobler HF, Barth CA. Legumes in human nutrition nutrient content and protein quality of pulses. Ernahrungs Umschau. 2017;64(9):M508–M515. https://doi.org/10.4455/eu.2017.034
37. Olaleye AA, Adeyeye EI, Adesina AJ. Chemical composition of bambara groundnut (V. subterranea L. Verdc) seed parts. Bangladesh J Sci Ind Res. 2013;48(3):167–178. https://doi.org/10.3329/bjsir.v48i3.16580
39. Anaemene DI, Fadupin GT. Effect of fermentation, germination and combined germination–fermentation processing methods on the nutrient and antinutrient contents of quality protein maize (QPM) seeds. J Appl Sci Environ Manage. 2020;24(9):1625–1630. https://doi.org/10.4314/jasem.v24i9.21
40. Tasie MM, Gebreyes BG. Characterization of nutritional, antinutritional, and mineral contents of thirty-five sorghum varieties grown in Ethiopia. Int J Food Sci. 2020;2020, Art. #8243617. https://doi.org/10.1155/2020/8243617
41. Eskandari H, Ghanbhari A, Javanmard A. Intercropping of cereals and legumes for forage production. Not Sci Biol. 2009;1(1):7–13. https://doi.o rg/10.15835/nsb113479
42. Harris GK, Marshall MR. Ash analysis. In: Nielsen SS, editor. Food analysis. 5th ed. Cham: Springer International Publishing; 2017. p. 287–297. https://d oi.org/10.1007/978-3-319-45776-5_16
43. Venkidasamy B, Selvaraj D, Nile AS, Ramalingam S, Kai G, Nile SH. Indian pulses: A review on nutritional, functional and biochemical properties with future perspectives. Trends Food Sci Technol. 2019;88:228–242. https://doi. org/10.1016/j.tifs.2019.03.012
44. Gemede HF, Birhanu E. Nutritional, antinutritional and phenolic properties of lima bean (Phaseolus lunatus) accessions: Underutilized legume in Ethiopia. Acta Universitatis Cibiniensis Series E: Food Technology. 2020;24(2):195–204. https://doi.org/10.2478/AUCFT-2020-0018
45. Liman B. Nutritional and toxicological studies on wild cowpea (V. unguiculata ssp. dekindtiana var. pubescens). Int J Environ Res Public Health. 2019;6(3):32–44. https://doi.org/10.15739/irjpeh.19.005
46. Zdunczyk Z, Minakowski D, Frejnagel S, Flis M. Comparative study of the chemical composition and nutritional value of pumpkin seed cake, soybean meal and casein. Food. 1999;43(6):392–395. https://doi.org/10.1002/(SICI) 1521-3803(19991201)43:6<392::AID-FOOD392>3.0.CO;2-2
47. Renaudeau D, Jensen SK, Ambye-Jensen M, Adler S, Bani P, Juncker E, et al. Nutritional values of forage-legume-based silages and protein concentrates for growing pigs. Animal. 2022;16(7), Art. #100572. https://doi.org/10.101 6/j.animal.2022.100572
https://doi.org/10.17159/sajs.2025/18925
AuthorS: Vuyelwa Nkoi1
Maryna de Wit1
Angeline van Biljon2
Johan van Niekerk1
Brandon van Rooyen1
Wilben Pretorius1
AFFILIAtIoNS:
1Department of Sustainable Food Systems and Development, University of the Free State, Bloemfontein, South Africa
2Department of Plant Sciences, University of the Free State, Bloemfontein, South Africa
CorrESPoNDENCE to: Vuyelwa Nkoi
EMAIL: NkoiVF@ufs.ac.za
DAtES:
r eceived: 29 June 2024
r evised: 28 May 2025
Accepted: 16 June 2025
Published: 11 Aug. 2025
hoW to CItE:
Nkoi V, de Wit M, van Biljon A, van Niekerk J, van Rooyen B, Pretorius W. Impact of nitrogen fertilisation on cactus pear mucilage functionality. S Afr J Sci. 2025;121(7/8), Art. #19012. https://doi.org/10.17159/sa js.2025/19012
Impact of nitrogen fertilisation on cactus pear mucilage functionality
The spineless cactus pear (Opuntia ficus-indica) mucilage is a physically slimy, green extract that is sourced from the cladodes (modified stems) of the crop. The mucilage can be freeze-dried into a powder, and this powder has shown potential to be considered as a novel functional food biopolymer because it exhibits good functional properties, especially with regard to emulsification. The main objective of this study was to investigate whether nitrogen fertilisation had an effect on the functionality of O. ficus-indica (L.) Mill ‘Morado’ mucilage. The functionality of the mucilage was attributed to its protein content. Nitrogen is one of the main elements in soil that makes up proteins. Nitrogen fertilisers from three nitrogen sources (urea, limestone ammonium nitrate, and ammonium sulfate) were applied at four application levels (0 kg/ha, 60 kg/ha, 120 kg/ha and 240 kg/ha). The functionality of mucilage was also compared to high-protein content commercial food biopolymers known to have good functional properties. Of the parameters tested, the oil-holding and oil-absorption capacities of the mucilage were significantly affected by nitrogen fertilisation. Scanning electron microscopy revealed that all freeze-dried mucilage samples resembled broken glass or showed a flake-like structure. Different nitrogen fertilisation sources and levels appeared to have no visible morphological implications on the different freeze-dried mucilage samples evaluated.
Significance:
• The study sheds light on the functionality of freeze-dried mucilage from spineless cactus pear. It highlights the impact of nitrogen fertilisation on mucilage properties.
• The mucilage exhibits promising functional properties, particularly in emulsification. This makes it a potential novel biopolymer for food applications.
• Understanding how nitrogen affects the mucilage functionality provides insights into crop management and sustainable food production.
• The ammonium-sulfate-treated mucilage performs similarly to high-protein commercial biopolymers, suggesting its practical use in food formulations.
• These findings contribute to food science knowledge and offer sustainable alternatives for food ingredient development.
Introduction
The spineless Opuntia ficus-indica (L.) Mill., commonly known as cactus pear, is a crop from the Cactaceae family. The family Cactaceae consists of approximately 145 accepted genera and 1519 accepted species. The genus Opuntia Mill., to which O. ficus-indica belongs, currently includes 152 accepted species.1 The cultivar of interest for this study is ‘Morado’. It is one of the most popular cultivars in the arid and semi-arid regions of southern Africa. ‘Morado’ produces a white-green fruit.2 Opuntia ficus-indica cladodes (also called modified stems) contain insoluble fibre and soluble fibre. The insoluble fraction is mostly composed of cellulose, and the soluble fraction is composed of mucilage.3
Native mucilage has a unique, branched structure that contains various charged fractions.4 Mucilage is seen as a hydrocolloid because it has a long-chain biopolymeric structure (composed of polysaccharides and proteins) that dissolves in aqueous substances for a viscous-inducing effect. There is a wide range of interest in exploring exciting new sources of hydrocolloids, mainly because of their usefulness in many industries, including the food industry.5 Hydrocolloids have different applications in foods, including thickening, gelation, emulsification and stabilisation.6
Mucilage has shown potential to be considered as a novel functional food biopolymer because it exhibits good functional properties, especially with regard to emulsification. The functionality of the mucilage has been attributed to its protein fraction.7 Proteins are known to have the ability to form and stabilise emulsions at the oil–water interface and to form and stabilise foams at the air–water interface, or the ability to solubilise (binding water and proteins). In addition, proteins have hydrodynamic properties based on intermolecular interactions, including gelling, texture and sensory (taste and odour) properties.8
Soy protein isolate (SPI) is a fine surfactant with extensive application in the food industry because of its high functionality in stabilising oil–water emulsions and air–water foams.9 SPI has a high-protein content of 90%, achieved by alkaline extraction and isoelectric precipitation of soya bean meal.10 The high-protein content in SPI, health benefits, and its protein’s functionality make it a model functional ingredient to compare mucilage proteins. The protein content found in mucilage is low. However, it is important as it gives the mucilage the ability to form emulsions and foams.11 Whey (a by-product of cheese making) and egg albumin are the most popular animal-derived globular proteins used in food processing. Like SPI, whey and egg albumin also have a high-protein content; attractive functional properties such as high-water solubility; and are excellent gelling, foaming and emulsification agents.12
Research Article
https://doi.org/10.17159/sajs.2025/19012
A previous study investigated the effect of nitrogen (N) fertilisation on the protein content of Opuntia mucilage.7 Three N sources were evaluated: urea, limestone ammonium nitrate (LAN), and ammonium sulfate (AmSul) (Omnia Holdings Ltd., Johannesburg, South Africa; Kynoch Fertilisers, Johannesburg, South Africa). Each of the N sources was applied at four levels (0 kg/ha, 60 kg/ha, 120 kg/ha and 240 kg/ ha).7 These N sources and levels were applied to the crops as part of the orchard management practices. Furthermore, the functionality of the mucilage was assessed to analyse whether a higher protein content would result in improved functionality (emulsification and foaming) of the Opuntia mucilage. According to LECO analysis, the protein content of the mucilage ranged from 1.5% to 7.0%. All the mucilage samples from the N fertilisation trial had higher protein contents than the control mucilage sample (0 kg N/ha). SPI and egg albumin, the high-protein content commercial biopolymers used in the study to compare the functionality of mucilage, recorded protein contents of 81.1% and 79.1%, respectively.7 N fertilisation also improved the functionality of the mucilage in terms of foam capacity and emulsion capacity and stability, with all the mucilage samples from the N fertilisation trial possessing higher values for these functionality tests than the control mucilage sample (0 kg N/ha).7 Although its foam capacity values were lower, the mucilage sample from the AmSul 60 kg/ha fertiliser application obtained similar foam stability and emulsion capacity and stability as SPI. Recently, Van Rooyen et al.4 studied the effect of native mucilage precipitates from different O. ficus-indica cultivars on the mechanical and microstructural properties of blended pectin and alginate biopolymer films. Mucilage was also studied for its potential as a functional bio-based polymer to address some limitations associated with homopolymer–pectin and homopolymer–alginate films.
In the current study, the same N fertilisation sources and levels were evaluated to assess their effect on the oil-holding capacity (OHC), the water-holding capacity (WHC), and stability and microstructures of the mucilage. These three fertiliser sources were chosen for application in this study because they are the most popular fertilisers sold by South African retailers, and they are also most commonly used by South African farmers. At present, the recommended fertiliser application levels in South Africa for cactus pear fruit production are 60 kg N/ha for 2-year-old trees and 90 kg N/ha for 3-year-old trees. The recommended application levels for phosphorus (P) are 13 kg P/ha and 16 kg/ha for 2-year-old and 3-year-old trees, respectively. For potassium (K), it is 60 kg K/ha and 80 kg K/ha for 2-year-old and 3-year-old trees, respectively.13
Recent research has shown that agronomic factors, such as irrigation and fertilisation, can influence the yield and quality of O. ficus-indica mucilage. Luna-Zapién et al.14 found that irrigation levels affect mucilage yield and composition, whilst Hasanzadeh et al.15 reported that N and P fertilisation impacts plant productivity under water stress. Additionally, Quintero-García et al.16 demonstrated that preprocessing methods alter mucilage’s chemical and functional properties. These findings highlight the importance of exploring how N fertilisation affects mucilage functionality, particularly in relation to its protein content and structural characteristics.
In addition to food-related applications, mucilage and other hydrocolloidrich materials from O. ficus-indica have gained increasing attention for their potential in environmental remediation. Recent studies have demonstrated that Opuntia mucilage and biomass can serve as effective, low-cost bio-adsorbents for removing dyes and other pollutants from wastewater, particularly in the textile industry. These findings underscore the versatility of Opuntia hydrocolloids and their relevance in both food and environmental applications.17-19
The effects of N fertilisation on the functional and structural properties of O. ficus-indica mucilage remain underexplored, particularly in relation to OHC, WHC, stability and microstructure. We aimed to address this gap by evaluating how different N sources and application levels influence these properties. The null hypothesis (H₀) is that N fertilisation will improve the functionality of Opuntia mucilage, whilst the alternative hypothesis (Ha) is that N fertilisation will have no effect.
Materials and methods
sample preparation
Samples included freeze-dried mucilage powder from cladodes grown with different N fertiliser sources (urea, LAN and AmSul) at four application levels (0 kg/ha, 60 kg/ha, 120 kg/ha and 240 kg/ha), as previously described in Nkoi et al.7 The orchard was established in 2016 at the University of the Free State, Bloemfontein, South Africa, and the N treatments were applied annually from the 2017/2018 to 2020/2021 seasons. Treatments were administered in October/December and February/April of each season, and all plants received recommended P and K supplements. Cladodes were harvested on 22 April and 12 May 2021, from 5-year-old plants, between 9:00 and 11:15, from the east side of the orchard at hip height, selecting cladodes that had not borne fruit. One cladode per treatment combination per replication was collected, totalling 30 samples.7 SPI powder and egg albumin powder were also analysed as commercial high-protein standard products. The mucilage was extracted and freeze-dried into a powder according to the patented method described by Du Toit and De Wit20 and Van Rooyen et al.4
Protein content
The protein content of the samples used in this study has been previously determined and reported.⁷ The same batches were used in the current experiments. The N content of the freeze-dried mucilage samples was determined by thermal combustion. Approximately 0.1 g of each sample was placed in foil containers and analysed using a LECO Nitrogen Analyzer (FP-528, LECO Corporation). Crude protein content was automatically calculated by multiplying the measured N content by a factor of 6.25.
scanning electron microscopy
Freeze-dried mucilage (from all N sources and N levels), SPI powder and egg albumin powder were subjected to scanning electron microscopy (SEM) imaging according to the methods described in Van Rooyen et al.4
Functional properties
Water-related properties of dried mucilage powder
Water-holding capacity
Traynham et al.21, Ayadi et al.22, López-Cervantes et al.23 and Du Toit2 described the WHC method that was used with minor modifications. Briefly, 1 g of freeze-dried mucilage was dissolved in 20 mL distilled water by first making a paste using only 2 mL of water and blending it using a Vortex Genie for 10 s. This procedure was followed in order to form a paste that could dissolve more easily without the formation of lumps in the larger amount of water. The rest of the distilled water (18 mL) was then added and vortexed again for 10 s. The mucilage was homogenised for 30 s using a Kenwood stick blender and allowed to stand for 1 h in order to dissolve fully. It was centrifuged using a PLC-024 centrifuge (KK centrifuge, Taiwan) for 10 min at 7155×g. The supernatant was decanted and weighed, and the centrifuge tube was inverted for 30 min. The same method was used for the SPI powder and egg albumin powder. The amount of water held by the powder was calculated using Equation 1:
Water-absorption capacity (WAC) is the volume of water (in mL) retained by a powder after centrifugation. It is calculated as the difference between the initial volume of water added and the volume of water recovered after centrifugation. This value reflects the amount of water absorbed and held within the powder matrix. WAC is expressed in mL of water absorbed per gram of powder (mL/g) and was calculated using Equation 224,25:
WAC (mL / g ) = water initially added (mL) supernatant (mL) dried precipitate (g)
Equation 2
oil-related properties of dried mucilage powder
oil-holding capacity
The methods described by Ayadi et al.22 and Du Toit2 were slightly modified to determine the OHC. Freeze-dried mucilage, SPI powder and egg albumin powder (0.1 g) were each added to 2 mL sunflower oil (Pick n Pay Group) and shaken for 5 min using a Vortex Genie. The solution was centrifuged using a 5417C centrifuge (Eppendorf, Germany) for 30 min at 2090×g. The supernatant oil was separated carefully using a pipette and weighed, and the centrifuge tube was inverted for 12 h. The precipitate was weighed, and the amount of oil held by the powder was calculated using Equation 3:
Oil-absorption capacity (OAC) was determined by using the method described by Samia El-Safy25 and Du Toit2, with slight modifications. Freeze-dried mucilage, SPI powder and egg albumin powder (0.1 g) were each added to 2 mL sunflower oil (Pick n Pay Group) and shaken for 5 min using a Vortex Genie. The solution was centrifuged (5417C centrifuge) for 30 min at 2090×g. Similar to the method used for WAC, the amount of supernatant oil was deducted from the initial amount of oil added. This value was divided by the value of the original sample (g) added and expressed in mL/g:
Data obtained for the functional properties of O. ficus-indica mucilage from different fertiliser sources and levels, along with SPI and egg albumin, were entered into a Microsoft Excel spreadsheet. The Excel package XLSTAT (2022) was used for statistical analysis. The means, standard deviations and coefficients of variation were calculated for each treatment. An analysis of variance was performed to detect significant differences (p < 0.05) between different fertiliser treatment means. A further post-hoc test, the Tukey’s HSD (honestly significant difference), was conducted to determine the exact differences between the samples.
r esults
scanning electron microscopy
The microstructures of freeze-dried mucilage from ‘Morado’ cactus pear cladodes treated with different N sources and levels, along with those of the commercial powders – SPI and egg albumin – were observed using SEM, as shown in Figure 1. The results show that all freeze-dried mucilage samples resembled broken glass or showed a flake-like structure. The particle morphology had random sizes, shapes and orientations, and the particles randomly aggregated with one another. The freeze-dried mucilage was ground with a mortar and pestle, which
1: Scanning electron micrographs (×200 magnification) of freeze-dried
from ‘Morado’
pear
treated with different nitrogen sources and application levels: control 0 kg/ha (a); commercial reference powders – soy protein isolate (b) and egg albumin (c); limestone ammonium nitrate 60 kg/ha (d), 120 kg/ha (g) and 240 kg/ha (j); ammonium sulfate 60 kg/ha (e), 120 kg/ha (h) and 240 kg/ha (k); and urea 60 kg/ha (f), 120 kg/ha (i) and 240 kg/ha (l).
https://doi.org/10.17159/sajs.2025/19012
Figure
mucilage
cactus
cladodes
resulted in varying degrees of fineness between the freeze-dried mucilage samples. Different N fertilisations had no visible morphological effects on the different freeze-dried mucilage samples evaluated. In contrast, the commercial SPI and albumin samples had consistent spherical-shaped particles of different sizes, with smooth surfaces and some dents. There was also aggregation of smaller particles into larger particles. The SPI and albumin particles were smaller than the freeze-dried mucilage particles.
Protein content
The protein content of the samples used in this study has been previously determined and reported7, and the same batches were used in the current experiments. Briefly, the protein contents were: Control (0) – 1.5%, LAN 60 – 3.9%, LAN 120 – 7.0%, LAN 240 – 6.5%, Urea 60 – 1.9%, Urea 120 – 4.4%, Urea 240 – 5.0%, AmSul 60 – 2.4%, AmSul 120 – 5.4%, AmSul 240 – 3.2%, SPI – 81.1% and egg albumin – 79.1%.7
Functional properties
Water-related properties of dried mucilage powder
Water-holding capacity
WHC is the amount of water that is held by the powder after the supernatant is decanted following centrifugation and the reaction tube inverted for 30 min.2,17 WHC is an important protein–water interaction that occurs in various food systems. WHC represents the ability of a protein matrix to absorb and retain bound, hydrodynamic, capillary and physically entrapped water against gravity.20 The WHC of the freeze-dried mucilage ranged from 0 g/g (AmSul 240 and Urea 120) to 0.4242 g/g (AmSul 60). WHC did not differ significantly (p = 0.662) among the different N sources and N levels (Figure 2). The LAN treatments and the control recorded similar WHC on average, and their WHC was higher than those of the AmSul and Urea treatments. An interesting phenomenon occurred, namely AmSul 240 and Urea 120 recorded a WHC of 0 g/g, although the freeze-dried mucilage samples looked wet when they were measured for WHC. This happened because, when the supernatant was decanted after centrifugation, a portion of the mucilage sample was dissolved in the supernatant, and this portion of mucilage was decanted along with the supernatant. Therefore, the wet precipitate left in the reaction tube had less mucilage powder than initially reacted with the water. Therefore, the WHC calculation method should be modified to account for the loss of powder in samples that contained a highly soluble fraction.
The WHC of the freeze-dried mucilage (all samples from N-fertilised plants) and albumin (Figure 3) differed significantly (p < 0.0001) from SPI as it recorded a WHC value (5.420 g/g) that is significantly higher than that of all the other samples. The hypothesis states that a higher protein content will result in a higher functionality of the sample.7 Therefore, it was expected that SPI and albumin would perform much better than freeze-dried mucilage in terms of WHC. This hypothesis was true for SPI but not true for albumin. The low WHC of albumin may be because of its high solubility in water.12 Albumin recorded a WHC of 0 g/g, as already explained with AmSul 240 and Urea 120, and when the supernatant of the albumin sample was decanted after centrifugation, a portion of the albumin powder was dissolved in the supernatant, and this portion of albumin powder was decanted along with the supernatant. Therefore, the wet precipitate left in the reaction tube had less albumin powder than what had initially reacted with the water.
Water-absorption capacity
WAC is the volume of water (in mL) retained by a powder after centrifugation. It is calculated as the difference between the initial volume of water added and the volume of water recovered after centrifugation.2 25 WAC is related to the presence of hydrophilic constituents in the powder, such as proteins or polysaccharides.2 The WAC of the freeze-dried mucilage ranged from 1.166 mL/g (AmSul 240) to 2.786 mL/g (AmSul 60). The WAC did not differ significantly (p = 0.445) among the different N sources and N levels (Figure 4). The LAN treatments recorded a constant WAC as the N levels increased, and the control also recorded similar WAC values. The AmSul and Urea treatments showed similar trends, with WAC values decreasing with an increase in N level. As with WHC, AmSul 60 was also the best N treatment for the highest WAC.
The WAC of the freeze-dried mucilage (all samples from N-fertilised plants) and albumin (Figure 5) differed significantly (p < 0.0001) from that of SPI (9.041 mL/g), which was significantly higher than that of all the other samples. The hypothesis states that a higher protein content will result in a higher functionality of the sample.7 Therefore, it was expected that SPI and albumin would perform much better than freeze-dried mucilage in terms of WAC, but this hypothesis was true only for SPI. Of the freeze-dried mucilage samples, LAN 120 was expected to perform the best for WAC, but the hypothesis was not true for WAC. Urea 60 and the control were expected to perform the worst, but again this was not true for WAC. All the mucilage samples had a WAC similar to that of albumin. In essence, a high-protein content resulted in a high WAC for SPI only.7
Data are the mean ± SE of three replicates (n = 3).
a,b,cBars with different superscripts differ significantly.
Figure 2: Effect of nitrogen sources (limestone ammonium nitrate [LAN], AmSul and Urea) and nitrogen levels (0 kg/ha, 60 kg/ha, 120 kg/ha and 240 kg/ha) on the water-holding capacity of reconstituted mucilage.
Nitrogen fertilisation on cactus pear mucilage functionality
Page 5 of 10
Data are the mean ± SE of three replicates (n = 3).
a,b,cBars with different superscripts differ significantly.
Figure 3: Effect of nitrogen sources (LAN, AmSul and Urea) and nitrogen levels (0 kg/ha, 60 kg/ha, 120 kg/ha and 240 kg/ha) on the water-holding capacity of reconstituted mucilage, soy protein isolate (SPI) and albumin.
Data are the mean ± SE of three replicates (n = 3).
a,b,cBars with different superscripts differ significantly.
Figure 4: Effect of nitrogen sources (limestone ammonium nitrate [LAN], AmSul and Urea) and nitrogen levels (0 kg/ha, 60 kg/ha, 120 kg/ha and 240 kg/ha) on the water-absorption capacity of reconstituted mucilage.
oil-related properties of dried mucilage powder oil-holding capacity
The OHC is the amount of oil that is held by the freeze-dried mucilage sample after the supernatant is decanted following centrifugation and the reaction tube is inverted for 12 h.2,23 The functional properties of the freeze-dried mucilage sample are normally linked to the interaction between the water/oil and sample. They are also associated with properties related to the protein structure and the compatibility with other food components.26 The OHC of the freeze-dried mucilage ranged from 0.2961 g/g (LAN 60) to 1.383 g/g (Urea 240). These values simply translate to, after 12 h of the reaction tube being inverted, 1 g of freeze-dried mucilage that had
Research Article
https://doi.org/10.17159/sajs.2025/19012
retained 0.2961 g or 29.61% and 1.383 g or 138.3% of oil for the LAN 60 and Urea 240 samples, respectively. The OHC differed significantly (p = 0.009) among the different N sources and N levels (Figure 6); specifically, the OHC of LAN 60 was significantly lower than that of Urea 240. The LAN treatments recorded the lowest OHCs, even lower than
Page 6 of 10
that of the control. The AmSul and Urea treatments recorded OHC values comparable to the control.
The OHC of the freeze-dried mucilage (all samples from N-fertilised plants), SPI and albumin (Figure 7) differed significantly (p < 0.000). SPI
Data are the mean ± SE of three replicates (n = 3). a,b,cBars with different superscripts differ significantly.
5: Effect of nitrogen sources (limestone ammonium nitrate [LAN], AmSul and Urea) and nitrogen levels (0 kg/ha, 60 kg/ha, 120 kg/ha and 240 kg/ha) on the water-absorption capacity (WAC) of reconstituted mucilage, soy protein isolate (SPI) and albumin.
Data are the mean ± SE of three replicates (n = 3). a,b,cBars with different superscripts differ significantly.
6: Effect of nitrogen sources (limestone ammonium nitrate [LAN], AmSul and Urea) and nitrogen levels (0 kg/ha, 60 kg/ha, 120 kg/ha and 240 kg/ha) on the oil-holding capacity (OHC) of the reconstituted mucilage.
https://doi.org/10.17159/sajs.2025/19012
Figure
Figure
Data are the mean ± SE of three replicates (n = 3). a,b,cBars with different superscripts differ significantly.
Figure 7: Effect of nitrogen sources (limestone ammonium nitrate [LAN], AmSul and Urea) and nitrogen levels (0 kg/ha, 60 kg/ha, 120 kg/ha and 240 kg/ha) on the oil-holding capacity (OHC) of the reconstituted mucilage, soy protein isolate (SPI) and albumin.
(0.1028 g/g) recorded an OHC that was significantly lower than that of the Urea 240 (1.383 g/g) freeze-dried mucilage sample. SPI also recorded the lowest OHC value compared to all the other mucilage samples. Albumin (0.4107 g/g) recorded a low OHC value compared to the control, AmSul and Urea treatments. The hypothesis states that a higher protein content will result in more functionality of the sample.7 Therefore, it was expected that SPI and albumin would perform much better than freeze-dried mucilage in terms of OHC, but this hypothesis was not true for OHC. Of the freeze-dried mucilage samples, LAN 120 was expected to perform the best for OHC, but the hypothesis was again not true for OHC for the LAN 120 samples. Urea 60 and the control were expected to perform the worst, although this was not observed for OHC of Urea 60 and the control. In essence, a high-protein content seems to not have had a positive effect on the OHC of SPI, albumin and freeze-dried mucilage.7
oil-absorption capacity
The OAC is the volume of oil (in mL) retained by a powder after centrifugation. It is calculated as the difference between the initial volume of oil added and the volume of oil recovered after centrifugation.2,25
The OAC of the freeze-dried mucilage ranged from 0.020 mL/g (LAN 120) to 4.279 mL/g (AmSul 240). These values simply translate to 1 g of freeze-dried mucilage that had absorbed from 0.020 mL (LAN 120) to 4.279 mL (AmSul 240) of oil, in relation to the original weight of the freeze-dried mucilage. Unlike OHC, OAC is immediately determined after centrifugation. OAC differed significantly among the different N sources and application levels (p = 0.031; Figure 8), indicating a potential overall effect of N fertilisation. However, post hoc comparisons (Tukey–Kramer) did not reveal statistically significant differences between specific treatment combinations. This suggests that, whilst there was some variation in OAC amongst treatments, the effect was not strong or consistent enough to attribute to any particular N source or level. The LAN group recorded the lowest mean OAC value, although this was not statistically distinct from the others.
The OAC of the freeze-dried mucilage (all samples from N-fertilised treatments), SPI and albumin (Figure 9) differed significantly (p = 0.013). LAN 120 (2.020 mL/g) recorded an OAC that is significantly
lower than that of AmSul 240’s (4.279 mL/g) freeze-dried mucilage. SPI (2.383 mL/g) and albumin (2.777 mL/g) recorded lower OAC values compared to the control, AmSul and the Urea treatments.
Discussion
When comparing the influence that different N fertilisation sources and levels had on the morphology of the freeze-dried mucilage, no variation could be attributed to N fertilisation as all the mucilage samples had broken glass, flake-like microstructures. Similar broken glass, flake-like microstructures were observed for freeze-dried mucilage2, freeze-dried egg albumin27 and freeze-dried SPI28. Similar spherical-shaped particles with a smooth surface and some dents were observed for spray-dried egg albumin27, spray-dried mucilage29 and spray-dried SPI28. The results indicate that different drying methods were used to dry the mucilage and the commercial SPI and albumin powders. The spray-drying method created smaller atomised droplets with spherical shapes for SPI and albumin. However, the freeze-drying method (used in this study) lacked the forces that allow the splitting of the frozen native mucilage into spherical droplets during the vaporisation process. This method led to large freeze-dried mucilage particles with broken-glass-like microstructures.27
Although the freeze-drying method used in this study likely contributed to the formation of larger, irregularly shaped particles, it is also plausible that the observed differences in aggregate size and compactness were partially influenced by the protein content of the mucilage. Higher protein concentrations may promote intermolecular interactions, such as hydrogen bonding and hydrophobic associations, which could lead to the formation of more cohesive or denser aggregates during the drying process.30 31 These structural differences may, in turn, influence the functional properties of the mucilage, particularly its WHC, OHC and stability. Therefore, whilst the drying method plays a significant role in determining the final morphology, the protein content of the mucilage may also contribute to the observed microstructural variations.
In addition to the effects of the drying method and protein content, the potential presence of calcium oxalate crystals, commonly referred to as druses, may also warrant consideration. These crystals are
Nitrogen fertilisation on cactus pear mucilage functionality
Data are the mean ± SE of three replicates (n = 3). a,b,cBars with different superscripts differ significantly.
Figure 8: Effect of nitrogen sources (limestone ammonium nitrate [LAN], AmSul and Urea) and nitrogen levels (0 kg/ha, 60 kg/ha, 120 kg/ha and 240 kg/ha) on the oil-absorption capacity (OAC) of reconstituted mucilage.
Data are the mean ± SE of three replicates (n = 3). a,b,cBars with different superscripts differ significantly.
Figure 9: Effect of nitrogen sources (limestone ammonium nitrate [LAN], AmSul and Urea) and nitrogen levels (0 kg/ha, 60 kg/ha, 120 kg/ha and 240 kg/ha) on the oil-absorption capacity (OAC) of reconstituted mucilage, soy protein isolate (SPI) and albumin.
frequently observed in the tissues of Opuntia species and are known to contribute to structural rigidity and a glass-like appearance under SEM. However, no calcium oxalate crystals were observed in the freeze-dried mucilage samples of previous studies, such as in Du Toit2 and Sáenz et al.32 It has been speculated that these crystals may not co-extract with the mucilage because of their low solubility and the predominantly soluble fibre nature of mucilage.33 Additionally, they may be removed during filtration or lost during the drying process. Whilst their contribution to the observed morphology cannot be entirely ruled out, current evidence suggests that calcium oxalate druses are unlikely to be a major factor in the microstructure of freeze-dried mucilage.
Research Article
https://doi.org/10.17159/sajs.2025/19012 Page 8 of 10
WHC is related to the availability of polar amino groups of proteins for hydrogen bonding with water molecules.8 Other factors affecting WHC are protein denaturation and unfolding, and the presence of non-protein components such as carbohydrates.26 N fertilisation did not have a significant effect on the WHC of O. ficus-indica freeze-dried mucilage (Figure 2). SPI recorded a WHC value that was significantly higher than those of the albumin and mucilage samples (Figure 3). With reference to the protein content of the mucilage samples7, LAN 120 was expected to perform the best for WHC, but the hypothesis was not true for WHC. Urea 60 and the control were expected to perform the worst, but this was also not true for WHC. In essence, a high-protein content had a positive effect on the WHC for SPI only. No scientific journal references on the effects of N fertilisation or any other form of fertilisation on the WHC of O. ficus-indica freeze-dried mucilage seem to exist. According to Du Toit2, cultivar did not have a significant effect on the WHC of freeze-dried mucilage. The month of harvest had a significant effect on the WHC of freeze-dried mucilage, with June being the month when WHC values were the highest.2 A WHC average of 0.89 mL/g was recorded for four cultivars, and ‘Robusta’ was the best cultivar for WHC.2 The values obtained by Du Toit2 for WHC are higher than the values found in the current study. The difference is probably because the harvesting dates in the two studies differed significantly. The WHC of powders added to food is an important functional property because it affects the sensory attributes, such as the taste, texture and juiciness of food, and it also affects the shelf life of food, particularly baked products.26
N fertilisation did not have a significant effect on the WAC of O. ficus-indica freeze-dried mucilage (Figure 4). As with the WHC, SPI recorded a WAC value that was significantly higher than those of the albumin and mucilage samples (Figure 5). There appear to be no research outputs on the effects of N fertilisation or any other form of fertilisation on the WAC of O. ficus-indica freeze-dried mucilage. According to Du Toit2, cultivar did not have a significant effect on the WAC of freeze-dried mucilage. The month of harvest had a significant effect on the WAC of freeze-dried mucilage, with August being the month when WAC was best.2 A WAC average of 8.04 g/g was recorded for four cultivars, and ‘Morado’ had the highest WAC value.2 The values obtained by Du Toit2 do not compare well with the values found in the current study, probably because the harvesting dates differ significantly. A WAC range of 2.45–4.60 mL/g was reported for okra mucilage.24 The mean WAC recorded for the Opuntia mucilage samples (2.23 mL/g) in the current study is lower than the mean WAC recorded for okra mucilage (3.51 mL/g).34
The literature suggests a positive correlation between a high OHC and a protein structure consisting of many amino acids with nonpolar side chains.35 N fertilisation had a significant effect on the OHC of freeze-dried mucilage (Figure 6). SPI and albumin recorded OHC values that were lower than those of the mucilage samples (Figure 7). To postulate, compared to SPI and albumin, mucilage may have a higher fraction of amino acids with non-polar side chains. No scientific journal references on the effects of N fertilisation or any other form of fertilisation on the OHC of O. ficus-indica freeze-dried mucilage could be found. According to Du Toit2, cultivar did not have a significant effect on the OHC of freeze-dried mucilage. The month of harvest had a significant effect on the OHC of freeze-dried mucilage, with February being the month when OHC was best.2 An OHC range of 1.10–1.32 g/g was recorded for four cultivars and ‘Morado’ recorded an average OHC of 1.23 g/g.2 In the current study, Urea 240 was the best N source and level for an optimal OHC of freeze-dried mucilage from ‘Morado’. Powders with high OHC are desirable for use in the cold meat industry, particularly for sausages, where the protein can bind the fat and water in these products.26
The OAC is commonly attributed to the physical entrapment of oil by the protein.26 Oil-absorption properties are vital because they are associated with a positive mouth feel and an improved flavour perception of the food product into which they are incorporated.25 N fertilisation significantly affected the OAC of freeze-dried mucilage (Figure 8). Whilst a statistically significant overall effect of N fertilisation on OAC was observed, the lack of significant pairwise differences between treatments limits the strength of this conclusion. The observed variation may suggest a trend, but further studies with larger sample sizes or more sensitive designs are
needed to confirm specific treatment effects. SPI and albumin recorded lower OAC values than most of the mucilage samples (Figure 9). The hypothesis states that a higher protein content will result in more/ higher functionality of the sample. Therefore, it was expected that SPI and albumin would perform much better than the freeze-dried mucilage samples in terms of OAC, but this hypothesis was not true. Of the freeze-dried mucilage samples, LAN 120 was expected to perform the best for OAC because of its protein value, but the hypothesis was not true. Urea 60 and the control samples were expected to perform the worst, and again this was not true for OAC. In essence, a high-protein content seems to not have had a positive effect on the OAC of SPI, albumin and freeze-dried mucilage samples. SPI and albumin may have recorded lower OAC values than the freeze-dried mucilage samples because they are more soluble in oil.
There appear to be no references on the effects of N fertilisation or any other forms of fertilisation on the OAC of O. ficus-indica freeze-dried mucilage. According to Du Toit2, cultivar did not have a significant effect on the OAC of freeze-dried mucilage. The month of harvest had a significant effect on the OHC of freeze-dried mucilage, with February being the month when OAC was best.2 An OAC range of 3.46–3.70 mL/g was recorded for four cultivars, and ‘Morado‘ recorded an average OAC of 3.70 mL/g.2 Kaur and Singh recommended that plant powders have OAC values equal to or higher than 2 mL/g to impart adequate emulsion capacities to the food in which the plant powders are incorporated. All the freeze-dried mucilage powders in the current study fall into this ideal range for OAC. Gemede et al.24 recorded an OAC range of 2.02–3.64 mL/g for okra mucilage. The mean OAC recorded for the Opuntia mucilage samples (3.19 mL/g) in the current study is higher than the mean OAC recorded for okra mucilage (2.69 mL/g).32
Conclusion
We have demonstrated that N fertilisation significantly influences the OHC of freeze-dried mucilage, with statistically significant differences observed amongst treatments. Our findings also show an overall, although not treatment-specific, effect on OAC. These findings have direct implications for optimising food-processing techniques and enhancing ingredient functionality within sustainable food systems. By understanding the impact of N fertilisation, farmers can fine-tune crop management practices to improve functionality in mucilage. Processors stand to gain by incorporating N-fertilised mucilage into food products, thereby enhancing texture and stability. Consumers benefit from healthier, functional foods. Environmentally, utilising mucilage – often considered waste – aligns with sustainability goals by reducing waste and optimising resource use. Economically, creating value-added products and streamlining processes benefit all stakeholders.
Funding
This work was supported by the University of the Free State Central Research Fund. We acknowledge GrainSA and the South African National Research Foundation (NRF) for funding provided to V.N.
Data availability
All data are included.
Declarations
We have no competing interests to declare. We have no AI or LLM use to declare.
Authors’ contributions
V.N.: Methodology, investigation, writing – original draft, writing –review and editing, project leadership. M.d.W.: Conceptualisation, methodology, validation, writing – review and editing, supervision, project administration, funding acquisition. A.v.B.: Methodology, validation, review and editing, supervision. J.v.N.: Supervision, funding acquisition. B.v.R.: Methodology, investigation, review and editing. W.P.: Formal analysis, data curation. All authors read and approved the final manuscript.
r eferences
1. Royal Botanic Gardens, Kew. Opuntia ficus-indica (L.) Mill. Plants of the world online [data repository]. No date [cited 2025 May 23]. Available from: https:// powo.science.kew.org/taxon/urn:lsid:ipni.org:names:30000028-2
2. Du Toit A, De Wit M. Patent PA153178P – A process for extracting mucilage from Opuntia ficus-indica, Aloe barbadensis and Agave americana Bloemfontein: University of the Free State; 2011.
3. Saenz C, Yoong M, Figuerola F, Chiffelle I, Estevez AM. Cactus pear cladodes powders as a source of dietary fibre: Purification and properties. Int J Food Sci Nutr. 2012;63(3):283–289. https://doi.org/10.3109/09637486.2011.624492
4. Van Rooyen B, De Wit M, Osthoff G, Van Niekerk J, Hugo A. Effect of native mucilage on the mechanical properties of pectin-based and alginate-based polymeric films. Coatings. 2023;13, Art. #1611. https://doi.org/10.3390/co atings13091611
5. Du Toit A, De Wit M, Fouche H, Taljaard M, Venter SL, Hugo A. Mucilage powder from cactus pears as functional ingredient: Influence of cultivar and harvest month on the physicochemical and technological properties. J Food Sci Technol. 2019;56(5):2404–2416. https://doi.org/10.1007/s13197-01903706-9
6. Saha D, Bhattacharya S. Hydrocolloids as thickening and gelling agents in food: A critical review. J Food Sci Technol. 2010;47(6):587–597. https://doi. org/10.1007/s13197-010-0162-6
7. Nkoi V, De Wit M, van Biljon A, van Niekerk JA. Comparison and integration of cactus mucilage protein and soy protein in functional food systems. Acta Hortic. 2022;1343:425–434. https://doi.org/10.17660/ActaHortic.2022.134 3.54
8. Foegeding EA, Davis JP. Food protein functionality: A comprehensive approach. Food Hydrocoll. 2011;25:1853–1864. https://doi.org/10.1016/j.f oodhyd.2011.05.008
9. Zhang X, Qi B, Xie F, Hu M, Sun Y, Han L, et al. Emulsion stability and dilatational rheological properties of soy/whey protein isolate complexes at the oil–water interface: Influence of pH. Food Hydrocoll. 2021;113, Art. #106391. https:/ /doi.org/10.1016/j.foodhyd.2020.106391
10. Chatterjee C, Gleddie S, Xiao CW. Soybean bioactive peptides and their functional properties. Nutrients. 2018;10, Art. #1211. https://doi.org/10.3 390/nu10091211
11. Du Toit A, De Wit M, Naudé S, Taljaard M, Fouche H, Hugo A, et al. Functional properties and sensory evaluation of mucilage from South African cactus pear cladodes. Acta Hortic. 2019;1247:251–260. https://doi.org/10.17660 /ActaHortic.2019.1247.34
12. Sim SYJ, Srv A, Chiang JH, Henry CJ. Plant proteins for future foods: A roadmap. Foods. 2021;10(8), Art. #1967. https://doi.org/10.3390/food s10081967
13. Potgieter JP. Guidelines for the cultivation of spine-less cactus pears for fruit production. 2nd ed. Pretoria: Group 7 Trust Printers; 1997.
14. Luna-Zapién EA, Zegbe JA, Meza-Velázquez JA, Contreras-Esquivel JC, MoralesMartínez TK. Mucilage yield, composition, and physicochemical properties of cultivated cactus pear varieties as influenced by irrigation. Agronomy. 2023;13(2), Art. #419. https://doi.org/10.3390/agronomy13020419
15. Hasanzadeh H, Arba M, Bouasriya A. Effect of removing the spring flush and nitrogen and phosphorus fertilization on the late ripening of cactus pear (Opuntia ficus-indica (L.) Mill). World J Adv Sci Technol Sustain Dev. 2024;5(2):13–22. https://doi.org/10.53346/wjast.2024.5.2.0033
16. Quintero-García M, Gutiérrez-Cortez E, Bah M, Rojas-Molina A, CornejoVillegas MDLA, Del Real A, et al. Comparative analysis of the chemical composition and physicochemical properties of the mucilage extracted from fresh and dehydrated Opuntia ficus-indica cladodes. Foods. 2021;10(9), Art. #2137. https://doi.org/10.3390/foods10092137
17. Boumezough Y, Arris S, Carabineiro SA, Viscusi G. Optimized removal of methylene blue using chemically activated and thermally modified Opuntia ficus-indica bioadsorbent. Biomass Convers Biorefin. 2025;15:17427–17444. https://doi.org/10.1007/s13399-024-06370-y
18. Otálora MC, Wilches-Torres A, Lara CR, Cifuentes GR, Gómez Castaño JA. Use of Opuntia ficus-indica fruit peel as a novel source of mucilage with coagulant physicochemical/molecular characteristics. Polymers. 2022;14(18), Art. #3832. https://doi.org/10.3390/polym14183832
19. Das N, Ojha N, Mandal SK. Wastewater treatment using plant-derived bioflocculants: Green chemistry approach for safe environment. Water Sci Technol. 2021;83(8):1797–1812. https://doi.org/10.2166/wst.2021.100
20. Du Toit A. Selection, extraction, characterization and application of mucilage from cactus pear (Opuntia ficus-indica and Opuntia robusta) cladodes [PhD thesis]. Bloemfontein: University of the Free State; 2016.
21. Traynham TL, Myers DJ, Carriquiry AL, Johnson LA. Evaluation of water-holding capacity for wheat-soy flour blends. J Am Oil Chem Soc. 2007;84:151–155. https://doi.org/10.1007/s11746-006-1018-0
22. Ayadi MA, Maksoud W, Ennouri M, Attia H. Cladodes from Opuntia ficus-indica as a source of dietary fiber: Effect on dough characteristics and cake making. Ind Crops Prod. 2009;30:40–47. https://doi.org/10.1016/j.ind crop.2009.01.003
23. López-Cervantes J, Sánchez-Machado DI, Campas-Baypoli ON, BuenoSolano C. Functional properties and proximate composition of cactus pear cladodes flours. Ciênc Tecnol Aliment. 2011;31:654–659. https://doi.org/10 .1590/S0101-20612011000300016
24. Oladele AK, Aina JO. Chemical composition and functional properties of flour produced from two varieties of tiger nut (Cyperus esculentus). Afr J Biotechnol. 2007;6:2473–2476. http://doi.org/10.5897/AJB2007.000-2391
25. Samia El-Safy F. Evaluation and utilization of cladodes flour in formulating functional sponge cake. World Appl Sci J. 2013;27:512–523.
26. Nguyen DQ, Mounir S, Allaf K. Functional properties of water holding capacity, oil holding capacity, wettability, and sedimentation of swell-dried soybean powder. Sch J Eng Tech. 2015;3:402–412.
27. Zhao JH, Liu LS, Sablani SS, Peng Y, Xiao H, Bai J, et al. Comparison of the thermal transitions of spray-dried and freeze-dried egg whites by differential scanning calorimetry. Food Bioprocess Technol. 2020;13:1329–1341. https: //doi.org/10.1007/s11947-020-02477-y
28. Bordón MB, Gabriela P, Maria B, Andrea C, María R, Pablo MM. Microencapsulation of chia seed oil (Salvia hispanica L.) in spray and freezedried whey protein concentrate/soy protein isolate/gum Arabic (WPC/SPI/GA) matrices. Proceedings. 2020;53(1), Art. #22. https://doi.org/10.3390/proc eedings2020053022
29. León-Martínez FM, Méndez-Lagunas LL, Rodríguez-Ramírez J. Spray drying of nopal mucilage (Opuntia ficus-indica): Effects on powder properties and characterization. Carbohydr Polym. 2010;81(4):864–870. https://doi.org/10 .1016/j.carbpol.2010.03.061
30. Harnkarnsujarit N, Kawai K, Suzuki T. Effects of freezing temperature and water activity on microstructure, color, and protein conformation of freeze-dried bluefin tuna (Thunnus orientalis). Food Bioprocess Technol. 2015;8:916–925. https://doi.org/10.1007/s11947-014-1460-1
31. Allmendinger A, Häuser C, Kumar L, Vollrath I. Formulation design for freezedrying: Case studies of stabilization of proteins. In: Jameel F, editor. Principles and practices of lyophilization in product development and manufacturing. Cham: Springer; 2023. p. 83–101. https://doi.org/10.1007/978-3-031-12634-5_5
32. Sáenz C, Yoong M, Figuerola F, Chiffelle I, María Estevez A. Cactus pear cladodes powders as a source of dietary fibre: Purification and properties. Int J Food Sci Nutr. 2012;63:283–289. https://doi.org/10.3109/09637486. 2011.624492
33. Rojas-Molina I, Gutiérrez-Cortez E, Bah M, Rojas-Molina A, Ibarra-Alvarado C, Rivera Muñoz E, et al. Characterization of calcium compounds in Opuntia ficus-indica as a source of calcium for human diet. J Chem. 2015;7, Art. #710328. https://doi.org/10.1155/2015/710328
34. Gemede HF, Haki GD, Beyene F, Rakshit SK, Woldegiorgis AZ. Indigenous Ethiopian okra (Abelmoschus esculentus) mucilage: A novel ingredient with functional and antioxidant properties. Food Sci Nutr. 2018;6:563–571. https: //doi.org/10.1002/fsn3.596
1Department of Animal Science, University of the Free State, Bloemfontein, South Africa
2B.T. Enterprises, Johannesburg, South Africa
3Department of Food Systems and Development, University of the Free State, Bloemfontein, South Africa
4Department of Microbiology and Biochemistry, University of the Free State, Bloemfontein, South Africa
CorrESPoNDENCE to: Arno Hugo
EMAIL: hugoa@ufs.ac.za
DAtES:
received: 28 June 2024
revised: 25 Mar. 2025
Accepted: 02 Apr. 2025
Published: 11 Aug. 2025
hoW to CItE: Opperman R, van Wyngaard BE, Cluff M, Bothma C, Roodt E, Hugo C, et al. Sustainable strategies for sodium reduction in biltong by improving healthiness without impairing safety.
S Afr J Sci. 2025;121(7/8), Art. #18999. https://doi.org/10.17159/sa js.2025/18999
Sustainable strategies for sodium reduction in biltong by improving healthiness without impairing safety
Biltong is a popular South African savoury meat snack, which is preserved by drying and adding vinegar and salt to inhibit microbial growth. It is stable at room temperature and can be considered a safe and sustainable local food system. Unfortunately, biltong has exceptionally high sodium (Na) levels, and there are currently no regulations regarding the Na content of biltong. Therefore, research needs to be conducted to determine the effect of Na reduction or replacement on South African biltong’s shelf life and chemical and sensory properties. In this study, sodium chloride (NaCl) inclusion levels in biltong models were altered to contain normal or 50% reduced NaCl in combination with various salt replacers – potassium chloride (KCl), organic potassium (K) salts and K-lactate – in different treatments. The treatments with the various levels of Na and replacers were evaluated against the positive control, the normal added NaCl levels and the negative control, which contained 50% of the normal NaCl levels. We found that a 50% reduction in NaCl was possible, and there were no serious adverse effects on the product’s chemical, sensory or microbial qualities. The treatments, which contained KCl, organic K salts and K-lactate as replacers, were successful at maintaining the sensory properties of biltong in comparison to the positive control. Overall, the treatment that contained the organic K salts, in conjunction with the K-lactate, was the most effective in inhibiting the growth of Escherichia coli, Staphylococcus aureus and lactic acid bacteria.
Significance:
Biltong has a very high salt content, but it is essential to ensure that this traditional South African delicacy keeps up and adheres to modern consumers’ health and nutritional demands. Our findings indicate that a 50% reduction in salt is possible without adverse effects on biltong’s chemical, microbial or sensory quality. These results also enable workers in the spice industry to reformulate spice packs with reduced salt, resulting in a sustainable, healthier product.
Introduction
Sodium (Na) is essential for normal human functioning, such as regulating the extracellular volume, maintaining the acid–base balance, neural transmission, renal function, cardiac output and myocytic contraction.1 However, the current average daily NaCl intake for adults of 14 g far exceeds the 5 g recommended for good health.2 There is a direct and undeniable connection between high levels of salt intake and high blood pressure, which could lead to coronary heart disease and stroke.3 In response to the increase in cardiovascular diseases in South Africa, the South African Department of Health has implemented regulations to lower the salt content of certain food products, with the goal to lower the Na intake of consumers.4
Biltong is a popular South African savoury meat snack. The biltong industry has an estimated annual turnover of ZAR2.4 billion.5 Biltong is preserved by drying and adding vinegar and salt to inhibit microbial growth. It is stable at room temperature and can be considered a safe and sustainable local food system.
Biltong has an extremely high Na content and is currently not included in these regulations. It is, therefore, important to ensure that these traditional South African delicacies keep up and adhere to the health and nutritional demands of the modern consumer.
The aim of this study was to determine the effect of 50% salt reduction and partial salt replacement on the chemical and microbial stability and the sensory quality of biltong.
Materials and methods
sourcing of lean meat, additives and spices
All the meat used during this project was sourced from an owner–operator meat-processing plant in Bloemfontein, South Africa. The meat was collected less than 24 h before required and transported to the meat-processing facility of the University of the Free State in Bloemfontein. The meat was then spiced and the vinegar was added, and the meat was kept at 4 °C overnight. The spices, Na replacers and additives were obtained from BT Enterprises in Johannesburg, South Africa.
Formulation of the biltong
According to an unpublished survey by this research team, the average %NaCl in biltong samples from various supermarkets and butcher shops is 4.73%. This value was used as the positive control, or Treatment A, and as the basis of the formulation of all the biltong treatments used in this study. The remaining treatments were formulated to contain 50% of the NaCl of Treatment A. The formulations were based on a 60% weight loss, as recommended by the South African Council for Scientific and Industrial Research.6 Table 1 summarises the targeted %NaCl, replacer and mg Na/100 g in the dry sample for each treatment at a 60% weight loss.
Research Article
https://doi.org/10.17159/sajs.2025/18999
E
Treatments B, C and D were formulated in accordance with 50% of the positive control NaCl inclusion level, in combination with various NaCl replacers. Treatment B was formulated to contain 1237.11 mg Na/100 g (2.365% NaCl) and 2.365% KCl was added as a salt replacer. Treatment C was formulated to contain 1236.52 mg Na/100 g (2.365% NaCl) and 2.365% organic K salts (potassium acetate and potassium diacetate) were added as replacers. Treatment D was formulated to contain 1236.52 mg Na/100 g (2.365% NaCl), and 2.365% K-lactate was added as a replacer. Treatment E, which was the negative control, was formulated with 2.365% NaCl (50% of the positive control) and contained 1236.98 mg Na/100 g. Treatment E did not include any replacers; therefore, the net weight had to be made up with a combination of maltodextrin and cereal binder to ensure that all the batch packs had the same net weight without altering the taste of the biltong. Monosodium glutamate (MSG) was added across all the treatments to override the possible sweetness impact of maltodextrin.
Manufacturing and sampling of the biltong
Three replicates of biltong were manufactured about 3 months apart, with fresh raw materials to compensate for variations in the raw materials, processing and environmental conditions. A single replicate consisted of five 3-kg batches.
To manufacture each replicate, 42 pieces of silver-side beef cuts (Musculus gluteobiceps and Musculus semitendinosus) weighing more or less 300 g were used. Eight pieces of meat were placed in a clean stainless-steel container and spiced, and then the vinegar was added and rubbed into the meat to ensure proper curing. In the case of treatments C and D, the K-lactate was first mixed thoroughly with the vinegar and then added to the meat pieces. The meat was turned every 8 h to ensure adequate curing.
After 16 h of curing, one piece from each treatment was sampled into a sterile bag for microbial analysis. Three pieces from each treatment were weighed and labelled using a sterile tag to be re-weighed daily for assessment of weight loss. The remaining pieces from each treatment were hung in a drying cabinet with a plastic hook until they reached the desired weight loss (60%). A conventional natural drying process was undertaken in a Crown Okto drying cabinet with the extraction fan on but without heating switched on and no humidity control. The temperature in the meat-processing facility was set at 21–23 °C to obtain an average of 22 °C. When the desired weight loss was reached, one piece of dry biltong from each treatment was sampled into a sterile bag for microbial analysis. After drying, four pieces of dry biltong (±400 g in total) per treatment were then chopped to a fine consistency using a 5-L Hobart bowl cutter, sampled into 20 mL plastic cuvettes and stored at -18 °C until analysis was carried out.
Chemical analysis
NaCl, Na and K content
For the determination of NaCl content, the Volhard method was used to volumetrically and quantitatively determine the amount of Cl present in the sample, which was then used to calculate the amount of NaCl present in the sample.7 Na and K contents were determined using atomic absorption spectroscopy. For atomic absorption spectroscopic analysis,
the samples were reduced to a mineralised form free from any organic compounds by dry ashing at 525 °C according to the modified method by Nielsen.8 Atomic Absorption spectroscopy was performed using an Agilent Technologies 240FS AA spectrometer (Agilent,USA) fitted with an air-acetylene burner. A Na and K hollow cathode lamp was used as a light source. Sample absorbance values were measured and processed using the Spectra AA version 5.3 Pro software (2015) package.
Water activity
Water activity (aw) was determined using a Novasina Thermoconstanter TH 200 (Labotec, Johannesburg, South Africa) water activity meter. After equilibrium was reached with deionised distilled water, quadruplicate measurements per treatment group and replicate were made at 25 °C. The results were reported as percentage relative humidity (%RH) and converted to a w values by dividing each value by a factor of 100.
Microbial analysis
A 10 g sample from each product was aseptically weighed and placed into a sterile 207 mL WhirlPakTM bag (Lasec, Bloemfontein, South Africa), after which 90 mL of sterile 0.1 M buffered peptone water solution was added to create a 10–1 dilution. The sample was homogenised using a stomacher (AME Stomacher Lab-Blender 400, Johannesburg, South Africa) for 1 min. Further dilutions (10–2 to 10–6) were made by adding 1 mL of the 100 mL sample (10–1 dilution) in McCartney bottles containing 9 mL sterile 0.1 M phosphate buffer solution.9 One millilitre of each dilution was then plated on different selective media using the pour plate technique, except for Staphylococcus aureus determination, which employed the surface plating technique. Unless otherwise indicated, all media were sourced from ThermoFisher (Pty) Ltd (Johannesburg, South Africa).
total bacterial count
Standard plate count agar (Oxoid CM0463) was used to enumerate the total viable counts, and the plates were incubated at 32 °C for 48 h. After incubation, the colonies were enumerated using a colony counter.
escherichia coli and coliforms
Violet red bile agar + 4-methylumbelliferyl-β-D-glucuronide (VRBM; Oxoid CM0978) was used for total coliform counts and detecting E. coli
The VRBM plates were incubated at 37 °C for 48 h, and fluorescence under ultraviolet light (366 nm, CAMAG Universal UV Lamp) was used to indicate the presence of E. coli
staphylococcus aureus
Baird Parker agar (Oxoid CM0275), with egg yolk tellurite supplement (Oxoid SR0054), was used to detect S. aureus. Incubation was at 37 °C for 24 h. Staphylococcus aureus typically forms colonies that are 1.0–1.5 mm in diameter, black, shiny, convex with a narrow white margin and surrounded by clear zones, extending 2–5 mm into the opaque medium.9
Yeasts and moulds
Yeast and mould enumeration were carried out using Rose-Bengal chloramphenicol agar (Oxoid CM0549), with chloramphenicol supplement (Oxoid SR0078), incubated at 25 °C for 4 days.
table 1: Biltong models formulation summary
Listeria monocytogenes
RAPID’L. mono (Biorad 356-4293; AEC-Amersham; Johannesburg, South Africa) was used with two supplements, namely, reconstituted RAPID’L. mono Supplement 1 (Biorad 3564294) and RAPID’ Listeria Supplement 2 (Biorad 3564746) to enumerate L. monocytogenes. Incubation was at 37 °C for 24 h, and light blue colonies were regarded as L. monocytogenes colonies.
enterobacteriaceae
Violet red bile glucose agar (CM0485) was used to detect Enterobacteriaceae. A double layer of agar was used to ensure anaerobic growth. Incubation was at 37 °C for 24 h.
Lactic acid bacteria
Man, Rogosa and Sharpe (MRS) agar consisting of MRS Broth (Oxoid CM0359) with 1.50% w/v agar bacteriological (Oxoid Agar No. 1, LP0011) was used to enumerate lactic acid bacteria. Incubation was at 37 °C for 24 h.
Consumer sensory evaluation
The samples of the five treatments were sliced up and placed in ziplock bags until they were evaluated. A 100-member panel of students and staff from the University of the Free State, men and women aged 20–60 years, evaluated the biltong samples and gave their opinion on the acceptability of the different biltong treatments. The nine-point hedonic scale was used, ranging from 1 (dislike extremely) to 9 (like extremely). The evaluation was carried out in separate booths, under red lights, to mask any colour differences. Diluted apple juice was provided as a palette cleanser.
statistical analyses
An analysis of variance10 was used to determine any effects that salt reduction and replacement levels had on various quality parameters of the biltong treatments. The Tukey–Kramer multiple comparison test (α = 0.05) was carried out to identify significant differences between the treatment means.10
r esults and discussion
Moisture content and water activity
There were significant differences (p < 0.001) in the moisture content for all treatments before and after drying (Table 2). Fresh beef has a moisture content of 65–80%.11 Treatments did not differ significantly in moisture content before drying or after drying. Dried biltong has a moisture content of 20–50%.12 Wet and dry biltong from all treatments in this study were within this range (Table 2). Treatments A and B had a significantly (p < 0.001) higher a w than Treatments C, D and E before drying (Table 2). Treatments C and D had a significantly (p < 0.001) higher a w than Treatments A, B and E after drying. NaCl is known to reduce a w by drawing out water from the meat tissue through osmosis, as in the study conducted on the effect of salt on the a w of dry-cured sausages.13 It was clear that the treatments with the higher Na content had a lower aw, after drying, but the organic K salts were not as successful in lowering the a w . Petit et al.14 grouped biltong into two groups, namely dry biltong, which has a moisture content between 21.5% and 25.3% and an a w range from 0.65 to 0.68, and moist biltong, which has a moisture content between 35.1% and 42.8% and an a w range from 0.85 to 0.89. The biltong manufactured in this study had a moisture content and a w closer to the ranges classified as dry biltong.
ash, NaCl, Na and K content
Each treatment consisted of a different formulation, with a different added NaCl content, that explained the different (p < 0.001) percentages of ash content. Treatment B (3.84%) differed significantly (p < 0.001) in ash content from Treatment E (2.78%) for the biltong samples before drying. After drying, the percentage of ash was approximately three times higher than that of the biltong samples before drying (Table 3); this is because the mixture of salt and replacers diffused slowly into the muscle tissue, reduced the free water and increased the protein density.15
The ash content of the five biltong treatments differed significantly (p < 0.001) in response to the added NaCl and replacers. The ash
table 2: Effect of salt replacer treatment and drying status on percentage (%) moisture and water activity (aw) of biltong before and after drying
time treatment % Moisture a w Before drying
A 69.81b ± 1.86 0.9543e ± 0.0159
b 71.34b ± 1.49 0.9404e ± 0.0204
C 71.29b ± 1.16 0.8988d ± 0.0160
D 70.60b ± 0.78 0.9129d ± 0.0255
A 24.82a ± 3.51 0.7231a ± 0.0058
b 25.97a ± 1.70 0.7295a ± 0.0081
C 27.26a ± 2.16 0.7803c ± 0.0070
E 70.57b ± 0.91 0.8963d ± 0.0163 After drying
D 25.94a ± 1.93 0.7543b ± 0.0093
E 27.49a ± 4.04 0.7313a ± 0.0071
Significance p < 0.001 p < 0.001
A = 4.73% NaCl; B = 2.365% NaCl + 2.365% KCl; C = 2.365% NaCl + 2.365% organic K salts; D = 2.365% NaCl + 2.365% K-lactate; E = 2.365% NaCl
Means with different superscripts in the same column differ significantly.
percentage of treatments A and B did not differ significantly after drying because the inorganic matter that remained was made up of metal oxides, which are enhanced by the amount of NaCl and KCl added.15 Treatments C and D had a significantly (p < 0.001) lower ash percentage than Treatments A and B after drying. Treatments C and D contained K-lactate, which has a lower mineral content than NaCl. Treatment E generally had a significantly (p < 0.001) lower percentage ash because it contained lower levels of NaCl and had no replacers. The cereal binder and maltodextrin were removed during the solvent wash for the ashing process.
Treatment A, the positive control, was the baseline for all the formulations. The end target for the %NaCl for Treatment A in the formulations after drying was 4.73% NaCl (Table 3), and the actual average %NaCl for Treatment A was 5.76% (Table 3). It is challenging to formulate the salt content of a product such as biltong because the NaCl is mixed in a brine solution, making it difficult to determine how much NaCl is absorbed within the meat sample and how much the NaCl content will increase after drying.
Table 3 indicates that, both before and after drying, the %NaCl of Treatments A and B differed significantly (p < 0.001) from all the other treatments, but Treatments C, D and E did not differ significantly (p < 0.001) from one another. Treatments B to E were formulated to contain half the %NaCl of Treatment A, but they also included replacers (except Treatment E), which is why Treatment A had a higher %NaCl than Treatments C–E (Table 1). The higher %NaCl in Treatment B was because the Volhard method, used to determine the amount of NaCl in a sample, also picked up the Cl from the KCl used as a replacer in Treatment B. The Volhard method determined the amount of chloride in the sample and because Treatment B contained KCl, the Cl– of KCl was also detected during the NaCl determination. If KCl is in the future used as a salt replacer in biltong, an alternative method of salt determination will have to be used. However, individual Na and K determinations are more important than NaCl determinations as far as Na reduction is concerned.
Although Treatment A had a numerically higher Na content than Treatments B–E, there were no significant differences in the Na content between the treatments before drying. However, the %NaCl indicated that there should be significant differences because the %NaCl differed significantly (p < 0.001). This lack of significant difference in Na content was probably due to the high moisture content of the products before drying, which caused a dilution effect of the Na. The Na content of Treatment A was significantly (p < 0.001) higher compared to the
table 3: Effect of salt replacer treatment and drying status on ash percentage (%), sodium chloride (NaCl), sodium (Na) and potassium (K) content of biltong before and after drying
Means with different superscripts in the same column differ significantly.
Na content from the other treatments after drying (Table 3), with nearly double the Na content, compared to Treatments B–E. Treatments A and E also had significantly (p < 0.001) lower K contents than Treatments B, C and D after drying. Treatments A and E were the only two formulations that did not contain added K, which is why, both before and after drying, they had the lowest K content.
All the treatments, except Treatment D, had a lower actual Na content than what was formulated for in the wet product (before drying), which can be attributed to the possibility that NaCl was not properly distributed through the biltong before hanging it to dry. The formulated Na content was calculated for the dry biltong sample at a 60% weight loss. Biltong from all dried treatments also had less Na than the formulated levels. However, they mainly differed only by 200–300 mg/100 g throughout all the treatments (Table 3). Treatment B was the only treatment with a lower actual K content than what was formulated for before and after drying. All the other treatments had higher K contents than what was formulated before and after drying. It is difficult to formulate a specific mineral content in a product like biltong that is dried because it is difficult to predict the absorption of brine.
Microbiological analyses
Although ready-to-eat meat products are produced under microbiallimiting steps, several spoilage and pathogenic bacteria have been associated with these products. Surveys of commercial biltong have shown total viable counts (TVC) of up to 7 log cfu/g, Enterobacteriaceae and coliforms up to 4 log cfu/g, yeasts up to 7 log cfu/g, moulds up to 5 log cfu/g, lactic acid bacteria (LAB) up to 8 log cfu/g, E. coli up to 1 log cfu/g, S. aureus up to 8.5 log cfu/g and L. monocytogenes were prevalent at very low incidence.16 Throughout the discussion, the main focus will be on the biltong samples after drying, because biltong is consumed in its dry state and should, therefore, be safe to eat.
There was a significant (p < 0.001) trend which indicated that the Enterobacteriaceae and coliform counts decreased after drying (Table 4). There were no significant differences in Enterobacteriaceae counts between the treatments before drying. Treatment A (0.83 log cfu/g) was significantly (p < 0.001) more effective in reducing Enterobacteriaceae counts in dry biltong compared to Treatments B, D and E. All the biltong samples before and after drying had Enterobacteriaceae counts less than the suggested 4 log cfu/g limit set by the Health Protection Agency.17
There was a decrease in coliform counts after drying in all the treatments. There were no significant differences in coliform counts between treatments before drying as well as after drying.
Although not significant, Treatment B, containing 4.75% NaCl (Table 3), was not as effective against the inhibition of coliforms as Treatment A, which contained 5.76 % NaCl.18 The detection of coliforms is used as a general indicator of sanitary conditions in the food-processing environment.19 According to Jones and co-workers12, commercial biltong may have Enterobacteriaceae and coliform counts of up to 4 log cfu/g, indicating that biltong manufactured from all treatments in this study was produced very hygienically with Enterobacteriaceae and coliform counts of the dry biltong generally below log 2 cfu/g.
Treatment B had significantly (p = 0.001) higher E. coli counts before drying than Treatments A, C and D (Table 4). There were no significant differences in E. coli counts between treatments after drying.
There were no significant differences (p = 0.752) in S. aureus counts between treatments of raw and dry biltong (Table 4). Commercial biltong could have up to 8.5 log cfu/g of S. aureus but should have less than 1 log cfu/g of E. coli.12 The S. aureus counts and E. coli presence for different treatments in this study conformed to these requirements.
No significant differences were found in the TVCs of biltong before drying and also after drying. Before and after drying, the TVCs of the biltong samples indicate that the overall microbial quality of the manufactured biltong was good because they fell within the acceptable range of 6–7 log cfu/g.17 When comparing the drying status, there was a significant (p < 0.001) increase in TVC from before drying to after drying.
No significant differences were observed in LAB counts for different treatments within the raw biltong samples, as well as within the dry biltong samples (Table 4). When comparing the drying status, there was a significant (p < 0.001) increase in LAB count from before drying to after drying. Although not statistically significant, Treatment C (5.10 log cfu/g) was the most effective, and Treatment D (5.98 log cfu/g) was the least effective in inhibiting LAB after drying (Table 4). According to Taormina20, potassium lactates, in conjunction with NaCl, at the correct concentrations, have been shown to inhibit LAB. The effects of lactate may be enhanced when used with other organic salts, such as diacetate salts21, which could explain why Treatment C, which contained 0.34% K-lactate with diacetate salts, was the most effective, and Treatment D, which contained 1.21% K-lactate without diacetate salts, was the least effective in inhibiting the LAB. A study conducted by Aaslyng et al.22 also found that Na reduction did not affect the growth of LAB. According to Jones et al.12, commercial biltong may contain up to 8 log cfu/g LAB. None of the wet or dry biltong treatments exceeded these counts.
There were no significant differences in yeast counts between the treatments before drying (Table 4). Although not always statistically significant, there was a trend towards lower yeast counts after drying compared to before drying. Treatments A, C and E had a significantly (p < 0.001) lower yeast count after drying in comparison to Treatment D. Treatment D had the same yeast count before and after drying (2.32 log cfu/g). The treatment with no replacers (E) and the treatment with organic K salts (C) were the most effective at inhibiting the growth of yeasts after drying.
No significant differences were observed in mould counts between the different biltong treatments before drying. After drying, Treatment A had significantly (p < 0.01) lower mould counts compared to Treatments B, D and E (Table 4), which indicates that the positive control was more effective at inhibiting moulds than the negative control, and the KCl and K-lactate replacers. Commercial biltong has been found to contain yeast counts of up to log 7 cfu/g and mould counts of up to log 5 cfu/g.12 None of the biltong treatments in this study exceeded these yeast and mould counts before or after drying.
Since the listeriosis outbreak of 2018, producers of ready-to-eat meat products have focused on the detection of L. monocytogenes in these products. Listeria monocytogenes is the most common bacterial contaminant present in ready-to-eat meat products post-processing.
Throughout all three replications of biltong manufactured, no Listeria monocytogenes was present before or after drying.
sensory analysis
The 100-member panel consisted of 70% female participants, and the range in age was between 20 and 60 years, with 50% of panel members in the age bracket of 20–29 years.
No significant differences were detected in the aroma of biltong from different treatments (Table 5). Consumers preferred (p = 0.008) the texture of Treatments A and C over E (negative control). Consumers gave the positive control group samples a higher score (p = 0.024) for overall liking when compared to the negative control group (Table 5). Although the positive control got the highest ranking for aroma, texture, aftertaste and overall liking, it did not differ significantly from the treatment with replacers B, C and D. This implies that reduced salt in combination with all the replacers used in this study can be used without the consumer detecting a significant difference. Saltiness received a statistically (p < 0.046) higher ranking for Treatment A compared to all other treatments. With a slower reduction in salt content (stealth principle), the difference in saltiness could possibly not be picked up by consumers.
Panellists could detect a small but significant difference between the positive and negative controls regarding saltiness, texture, aftertaste and
table 4: Effect of salt replacer treatment and drying status on the microbial stability (log cfu/g) of biltong before and after drying
E. coli, Escherichia coli; S. aureus, Staphylococcus aureus; TVC, total viable counts; LAB, lactic acid bacteria
A = 4.73% NaCl; B = 2.365% NaCl + 2.365% KCl; C = 2.365% NaCl + 2.365% organic K salts; D = 2.365% NaCl + 2.365% K-lactate; E = 2.365% NaCl
Means with different superscripts in the same column differ significantly.
table 5: Consumer sensory rankings of five biltong formulations based on different added NaCl and replacer levels
A = 4.73% NaCl; B = 2.365% NaCl + 2.365% KCl; C = 2.365% NaCl + 2.365% organic K salts; D = 2.365% NaCl + 2.365% K-lactate; E = 2.365% NaCl
Means with different superscripts in the same column differ significantly.
overall liking. Although not statistically significant, Treatment C scored the second-highest ranking for aroma, texture and aftertaste.
Conclusion
We found that a 50% reduction in NaCl and replacement of NaCl were possible, and with no significant adverse effects on the product’s chemical, microbial or sensory qualities. Therefore, reducing the extremely high Na content of biltong, a popular South African shelfstable meat snack is possible. Not only will the Na content of biltong be reduced, but also the K content will increase. The biltong will be chemically, microbiologically and sensorily acceptable if the NaCl is reduced by 50% and salt replacers are used. The meat industry can only benefit from reducing the Na content of biltong, even if there is currently no legislation that limits the Na content.
Funding
We acknowledge funding from Red Meat Research and Development –South Africa.
Data availability
The data supporting the results of this study are available upon request to the corresponding author.
Authors’ contributions
R.O.: Methodology, data collection, sample analysis, writing – the original draft. B.E.v.W.: Methodology, validation, student supervision. M.C.: Methodology, validation, student supervision. C.B.: Methodology, data collection, validation. E.R.: Methodology, validation. C.H.: Conceptualisation, methodology, validation, student supervision, project leadership, project management. A.H.: Conceptualisation, methodology, data analysis, validation, student supervision, project leadership, project management, funding acquisition. All authors read and approved the final manuscript.
Declarations
We have no competing interests to declare. We have no AI or LLM use to declare. Ethical approval was provided by the General/Human Research Ethics Committee of the University of the Free State (UFS-hsd2020/1561/0911).
r eferences
1. Dötsch M, Busch J, Batenberg M, Liem G, Tareilus E, Mueller R, et al. Strategies to reduce sodium consumption: A food industry perspective. Crit Rev Food Sci Nutr. 2009;49(9):841–851. https://doi.org/10.1080/1040839 0903044297
2. Bhat S, Marklund M, Henry ME, Appel LJ, Croft KD, Neal B, et al. A systematic review of the sources of dietary salt around the world. Adv Nutr. 2020;11(3):677–686. https://doi.org/10.1093/advances/nmz134
3. De Marco ER, Navarro JL, León AE, Steffolani ME. Sodium chloride replacement by potassium chloride in bread: Determination of sensorial potassium threshold and effect on dough properties and breadmaking quality. Int J Gastron Food Sci. 2022;27, Art. #100486. https://doi.org/10.1016/j.i jgfs.2022.100486
4. South African Department of Health (DoH). Regulations relating to the reduction of sodium in certain foodstuffs and related matters: Amendment. Foodstuffs, Cosmetics and Disinfectants Act, 1972 (act 54 of 1972). Government Gazette No. 42496, 31 May 2019. Government Notice No. 812.
5. Coleman A. ‘Biltong must secure geographical indication’ – economist. Farmers Weekly. 2019 September 30.
6. Council for Scientific and Industrial Research (CSIR). The preparation of biltong. Pretoria: CSIR; 1994. p. 5–16.
7. Association of Official Analytical Chemists (AOAC). Official methods of analysis. 18th ed. Washington DC: AOAC; 2005.
8. Nielsen SS. Sodium and potassium determinations by atomic absorption spectroscopy and inductively coupled plasma-atomic emission spectroscopy. In: Nielsen SS, editor. Food analysis laboratory manual. 2nd ed. New York: Springer; 2010. p. 87–93. https://doi.org/10.1007/978-1-4419-1463-7
9. Harrigan WF. Laboratory methods in food microbiology. 3rd ed. San Diego, CA: Academic Press; 1998.
11. Ren Y, Sun D. Monitoring of moisture contents and rehydration rates of microwave vacuum and hot air dehydrated beef slices and splits using hyperspectral imaging. Food Chem. 2022;382, Art. #132346. https://doi.or g/10.1016/j.foodchem.2022.132346
12. Jones M, Arnaud E, Gouws P, Hoffman LC. Processing of South African biltong – A review. S Afr J Anim Sci. 2017;47(6):743–757. https://doi.org /10.4314/sajas.v47i6.2
13. Patarata L, Fernandez L, Silva JA, Fraqueza MJ. The risk of salt reduction in dry-cured sausage assessed by the influence on water activity and the survival of Salmonella. Foods. 2022;11(3), Art. #444. https://doi.org/10.3 390/foods11030444
14. Petit T, Caro Y, Petit A, Santchurn SJ, Collignan A. Physicochemical and microbiological characteristics of biltong, a traditional salted dried meat of South Africa. Meat Sci. 2014;96(3):1313–1317. https://doi.org/10.1016/j.m eatsci.2013.11.003
15. Honikel KO. The use and control of nitrate and nitrite for processing of meat products. Meat Sci. 2008;78(1–2):68–76. https://doi.org/10.1016/j.meatsc i.2007.05.030
16. Naidoo K. The microbial ecology of biltong in South Africa during production and at point-of-sale [dissertation]. Johannesburg: University of the Witwatersrand; 2010.
17. Health Protection Agency. Guidelines for assessing the microbiological safety of ready-to-eat foods placed in the market. London: Health Protection Agency; 2009.
18. Kurlansky M. Salt: A world history. London: Vintage Books; 2003.
19. Fung DYC. Microbial hazards in food: Food-borne infections and intoxicants. In: Toldrá F, editor. Handbook of meat processing. Ames, IA: Blackwell Publishing; 2010. p. 481–500. https://doi.org/10.1002/9780813820897.ch28
20. Taormina PJ. Implications of salt and sodium reduction on microbial food safety. Crit Rev Food Sci Nutr. 2010;50(3):209–227. https://doi.org/10.108 0/10408391003626207
22. Aaslyng MD, Vestergaard C, Koch AG. The effect of salt reduction on sensory quality and microbial growth in hotdog sausages, bacon, ham and salami. Meat Sci. 2014;96(1):47–55. https://doi.org/10.1016/j.meatsci.2013.06.004
AuthorS: Enrike Maree1,2,3
James N. Blignaut2 4 5
Cornelius J.L. du Toit1
Heinz H. Meissner6
AFFILIAtIoNS:
1Department of Animal Science, University of Pretoria, Pretoria, South Africa
2ASSET Research, Sedgefield, South Africa
3GOALSciences, Rapperswil, Switzerland
4School for Public Leadership, Stellenbosch University, Stellenbosch, South Africa
5South African Environmental Observation Network (SAEON), Pretoria, South Africa
6Milk South Africa, Pretoria, South Africa
CorrESPoNDENCE to: Enrike Maree
EMAIL: enrike@agreetothisagri.com
DAtES:
r eceived: 07 July 2024
r evised: 24 June 2025
Accepted: 24 June 2025
Published: 11 Aug. 2025
hoW to CItE:
Maree E, Blignaut JN, du Toit CJL, Meissner HH. An environmental, economic and nutrient index for milk and plant-based beverages in South Africa. S Afr J Sci. 2025;121(7/8), Art. #18928. https://doi.org/10.1715 9/sajs.2025/18928
An environmental, economic and nutrient index for milk and plant-based beverages in
South Africa
Sustainable decision-making in the food sector is critical in addressing global challenges, such as climate change, resource scarcity, and malnutrition. Particularly, the milk and plant-based beverage sectors lack a comprehensive sustainability index tailored to assess economic, nutritional, and environmental impacts. We developed a specialised sustainability model for milk and plant-based beverages, adaptable to different countries. The Dairy Index for Environment, Economics, and Nutrition (DiEET) revealed that bovine milk scored 3.67 (nutritional), 0.161 (environmental), and 1.543 (economic); almond beverages scored 1.55, 0.172, and 1.103; soy beverages scored 2.21, 0.193, and 1.277; and oat beverages scored 1.204, 0.165, and 1. 083. These findings highlight the need to balance nutrition, economic viability, and environmental sustainability in food choices. The model, based on scientific data and requiring minimal user input, provides a practical tool for stakeholders to assess and compare sustainability across products. By enabling informed decision-making, this study promotes a more sustainable future, advocating for practices that consider all dimensions of sustainability in the food sector. Continuous refinement and validation of the model are essential to maintain its relevance amidst evolving data and industry practices, ensuring its effectiveness in guiding stakeholders towards sustainable dietary choices.
Significance:
This study provides a comprehensive sustainability index for milk and plant-based beverages, addressing critical gaps in current assessments. By integrating environmental, economic, and nutritional indicators, the DiEET offers a holistic approach to evaluating food products. The findings highlight the trade-offs between nutritional quality, economic viability, and environmental impact, emphasising the need for balanced decision-making in agricultural production. This model serves as a practical tool for stakeholders, promoting consumer education and guiding industry practices towards sustainability. Its application can enhance sustainability evaluations and contribute to global efforts in monitoring sustainable development goals.
Introduction
In the face of global challenges, such as climate change, resource depletion and nutrient distribution imbalances, sustainable decision-making in the food sector has become a pressing concern.1 2 The global food supply, while generally meeting demand, still suffers from inefficiencies, such as food waste, logistical issues and affordability constraints, impeding equal access to nutritious food.3-6 This issue is particularly acute in the dairy industry and plant-based beverages (PBBs), where the need to balance environmental, economic, and nutritional aspects is paramount. Current methods of assessing the sustainability of dairy and PBBs often lack a holistic perspective.7 Standard labelling and nutrient-profiling systems, while informative, do not capture the overall healthfulness of products. This gap is notable in the absence of specific nutrient indexes for dairy foods or proteins. Moreover, environmental sustainability assessments relying on single-metric results from life cycle analyses (LCAs) tend to oversimplify the complex sustainability landscape.8 These challenges underscore the necessity for more detailed and context-specific sustainability evaluations that consider various production systems, geographical locations, and broader impact metrics beyond carbon footprints.
South Africa faces unique challenges regarding nutrient deficiencies and changing consumer and market trends, which can have adverse effects on vulnerable populations, particularly the poor and malnourished.4 9 Rapid shifts in dietary preferences, influenced by global trends, local economic conditions, and consumer trends that alter the nutritional landscape, can potentially exacerbate nutrient deficiencies and health disparities.10 The dairy industry and the emerging market for PBBs are central to these changes, making it critical to understand and assess their sustainability in the South African context. This study aimed to develop a tailored sustainability index for milk and PBBs in South Africa, evaluating environmental sustainability, economic viability, and nutritional impact in a manner specific to the industry and country. By addressing the complexities of sustainability within the South African dairy and PBB industries, and integrating nutritional, environmental, and socio-economic indicators, this initiative seeks to foster informed consumer choices, enhance industry resilience, and ensure long-term sustainability. The goal was to create a comprehensive evaluation framework that prioritises simplicity, replicability, and thus transparency and education for both consumers and producers.
A systematic and comprehensive literature review was undertaken to conduct a data analysis on the subject of sustainability and sustainability modelling. Databases such as ResearchGate and Google Scholar were systematically searched for peer-reviewed articles, research reports, and studies published over the past two decades (2000–2023), encompassing the indicators mentioned (i.e. nutrition, economics, and the environment) related to the sustainability of milk and PBBs, as well as how these indices were measured. Peer-reviewed methods of measuring the indicators were identified and adopted according to the aims of this study. Subsequently, an index named Dairy Index for Environment, Economics, and NuTrition (DiEET) was developed to comprehensively evaluate
https://doi.org/10.17159/sajs.2025/18928
the environmental, nutritional, and economic profiles of milk and PBBs. The development of the model is elaborated on in the next section, and the process flow is represented in Figure 1
Model development overview
The Nutrient Rich Food (NRF) index, proposed by Drewnowski et al.11 and later adapted by Drewnowski and Fulgoni12 to the NRFh (hybrid), which includes nutrients to be encouraged and makes provision for adherence to recommended food groups, served as a foundational principle guiding the current model. Additional refinements were made, such as in the NRF for adequate intake (NRF-ai), which incorporates the prevalence of inadequate and excessive nutrient intake within populations, by means of weighting factors and subgroups to measure intake according to stratified population requirements.13 In addition to this, digestible indispensable amino acid score (DIAAS) values inspired the inclusion of protein quality.14 Beal et al.15 discussed the concept of priority micronutrient density in foods as a basis for classifying foods in terms of their supply towards recommended intakes of key identified priority nutrients. The Delta Model® as developed by the Sustainable Nutrition Initiative16 uses the supply of nutrients to deliver an understanding of food groups within the food system. These methodologies provided the foundational framework for the nutritional component of the DiEET model, shaping the implementation of the approaches taken, along with adaptations and refinements to suit a South African context.
The environmental component, being recognised as a sustainability indicator globally, is incorporated into the sustainability index as a key component by means of focusing on major contributing indicators, such as land use, electricity usage, efficiency, waste, and water use.17-19 Records of expenditures are maintained on farms and factories, whether by automatic management tools or manually by perusing invoices or weighbridge slips. Thus, the model was built with the goal of leveraging existing data for evaluating environmental impact as a midpoint between precision of data and data availability as provided by farmers. Ideally, thorough (LCAs) would be used for all relevant farms, yet a simplified method was used for the purposes of the model that accounts for a more realistic and industry-level availability of data.20 This method entailed the use of shared indicators amongst distinct products and processes, despite differences in farming operations and relying on data that are generally measured in everyday practice. From an economic perspective, the model incorporated consumer cost as a factor that was evaluated against the poverty levels of the entire population, considering various income groups in South Africa. In addition, the economic health of the producers was assessed by revenue, employment rates, and contribution to gross domestic product (GDP).21
data collection
In order to populate the model, as well as adapt indicators to be relevant to South Africa, both peer-reviewed sources and local online databases were used to source the most relevant information on local population demographics, nutrient requirements, prices, and market preferences. Comparisons and scenarios previously drawn to compare the nutrient
profiles of milk and PBBs were used to populate comparisons.22-27 Beverages were chosen to represent their broad possible classification; thus, a beverage of each relevant class was chosen, i.e. legume (soy beverage), wheat (oat beverage), nut (almond beverage), and ruminant (bovine milk), of which bovine milk consisted of full fat milk (long life and fresh). Financial constraints and relevance to local market preferences excluded rice and coconut milk, as well as fat-free or low-fat milk. Local market reports and scrutiny of local supplier websites offered guidance in terms of which studies and data sets were most applicable, e.g. most South African almond milk is produced using almonds from California, and hence Californian LCAs were used to draw information on the respective indicators.28 Similarly, data on oats are rarely available in South Africa, and thus data from wheat crops need to be inferred.29-31 Industry members and local processors were consulted for guidance as well; however, because of non-disclosure agreements with the industry members, the exact data collected were only used for guidance purposes. Literature-based sources were mostly used to compile hypothetical scenarios, solely to validate the efficacy of the model and provide guidance pertaining to different parameters employed.
Model outline
The DiEET model is the first iteration of a conceptual Sustainability index for the Environment, Economics, and Nutrition (SiEEN) model that currently applies only to dairy and potential alternatives. The model does not use the traditional expression of a single score for sustainability but rather scores each component separately, to avoid masking of a poor score for one indicator with a good score for another indicator. The three scores are expressed by means of shorthand notation. The following notations are used: NS, nutrient score; ps, protein score; EnS, environmental score; EcS, economic score. To simplify the interpretation of the results, the environmental and economic components were inverted to allow all increasing values to be favourable. The components are summarised in Figure 2
Nutrient component
Based on the core nutrients highlighted by the NRFi and NRFh models12, as well as the suggested nutrients to be included in nutrient indexing by Beal et al.15, the nutrients included in the model were potassium, dietary polyunsaturated and monounsaturated fats (PUFA+MUFA), saturated fats, iron, sodium, magnesium, calcium, protein, vitamin B12, vitamin E, vitamin A, folate (vitamin B9), and zinc11 12 15. Fibre and vitamin C were deliberately excluded because of their natural absence in dairy.32 Additionally, because of their relevance in the functioning of calcium, e.g. in the mineral complex formed during bone formation, phosphorus was included. Vitamin B2 was further included because of the prevalence of deficiencies in developing countries, such as African countries.33 Amino acids were included as individual nutrients but were also considered as a subcomponent of protein quality in a separate subscore. The above nutrients were expressed as content per 100 mL, as a percentage of the population nutrient requirements as reported in Supplementary table 1; however, the values were not capped at 100% DV as with the NRFi.11,14,34
Figure 1: Model development overview and components included.
The nutrient requirements provided in Supplementary table 1 were synthesised from different sources to synthesise daily recommended intakes14 35 36, with some supplementation from more recent epidemiological studies in terms of protein and fat intake37. Energy requirements are based on moderate physical activity, i.e. a physical activity level factor of 1.8, and average extra daily requirement for the whole pregnancy.35 Considerations were given to specific requirements within each age and gender group, such as being pregnant or ill.38 To manage lactation data challenges, pregnant and breastfeeding women are grouped together, with pregnancy assumed to last 9 months and lactation 3 months. In cases of non-lactation, higher nutritional demands were considered throughout postpartum recovery. As a result of their marginal impact, multiple births were excluded, assuming the nutritional needs of such cases to be equivalent to nonpregnant women. Recommendations were adjusted based on population age and gender demographics, as reported in Supplementary table 2, including the percentage of pregnant or lactating women as calculated in Supplementary table 3 for estimating average nutritional requirements. Fortified nutrients, important for sustainable food systems and common in products, were not excluded.
The subscores and subsequent formulas employed are summarised in Table 1. Weighting factors were applied to the nutrients based on existing deficiencies in supply, where a deficiency in the supply of a nutrient warrants an increase in weighting of the nutrient, as calculated by the supplementation coefficient (Sc), which is based on Supplementary table 4 16 Iron, vitamin A, and zinc were exceptions, where local deficiencies surpass global deficiencies and the prevalence of deficiencies in adolescents was used, with values of 29%, 42% and 63%, respectively.38-40 Similarly, a weight factor (contribution coefficient) is assigned to each product based on the fraction that each food group ((1) milk, excluding butter; (2) soya beans; (3) nuts and products; and (4) oats) contributes to the global supply of a specific nutrient, which is then adapted to the percentage of each raw material in the final product, as reported in Supplementary table 5 and Supplementary table 6. Protein quality (protein score or ps) is assessed as an additional score by calculating the indispensable amino acid score of each amino acid and, contrary to DIAAS, in which only the most limiting amino acid is highlighted, summed for a total view of protein quality.14,41,42 The amino acid scoring pattern has been adapted according to demographic strata as reported in Supplementary table 7
The NRFh utilisation of My Plate Food Groups has been replaced with the latest PURE Healthy Diet recommended intakes (g/day) of each food group in the healthy diet contribution coefficient (HDCc)12,37, i.e. legumes (48 g/day), nuts (28.20 g/day), dairy (185.50 g/day), and whole grains (40.90 g/day). Additionally, based on recent research on saturated fat and the latest insights on the food matrix effect pertaining to saturated fat, the limiting nutrient score (LIMz) has been removed.37 43 Limiting factors employed were sodium content, sugar content, and associated diseases or allergies, with some adaptations that are as follows: sugar content was used to calculate the glycaemic index coefficient (GIc), which penalises food based on high glycaemic index (above 55) or low glycaemic index
Etc = 1 – sum [allergy prevalence for product × % of raw material in final product]
NS = NSs + HDC – GI corr added sugar – GI corr natural sugar –/+ sodium(adj)
(below 55), based on the type of sugar present in the food, e.g. sucrose (GI:65), maltose (GI:105), and lactose (GI:46).44,45 Sodium was either a limiting or a contributing nutrient, depending on the content per standard serving, in order to avoid deficiencies of sodium. In the adjusted sodium level (Sodium(adj)), an upper limit was imposed where sodium was limited (deducted) from the nutrient score if the distance from target exceeded 50%, i.e. if the content was more than 50% of the recommended daily intake, and contributed positively to the score when the sodium content was 49% or less.46 An exclusion threshold was applied, based on the prevalence of allergies or intolerances to each product type, as reported in Supplementary table 8. The full equations and subscores are presented in Table 1 47
environmental
component
The common and major contributing indicators identified to be of importance in environmental footprint assessments were blue water (i.e. service and groundwater), fertiliser, fuel, pesticide, and land use.18,29 Although not all encompassing, these indicators offer a general idea regarding the impact on emissions, water use, and eutrophication or acidification potential. All inputs were adjusted for weight or litre (in the case of raw milk or final product) and adjusted for percentage raw material in the final product during the final calculation. On farm and factory levels, an additional point system was employed as a qualitative
Figure 2: Model outline and summary of main factors included.
table 1: Nutrient score formulas and subscores
measure of the longevity and sustainability of the production system, such as the frequency of soil analyses, cropping type (e.g. monocropping or regenerative), the frequency of sustainability assessments, and others.48
A simplified scale approach assigned points to the variant applied within each of these indicators, recognising varying degrees of environmental impact or benefit in each of the qualitative measures. A summary of the indicators and user input required is presented in Table 2, in which quantitative scores are awarded points from 0.06 or 0.05 to 0.01, with higher scores being less favourable. These inputs, along with the scenarios in Supplementary tables 9–12, were used in the calculations summarised in Table 3 to contribute to the final environmental score.
economic component
Inspired by the NRFPI, price was a key component in the economic score.49 In the current economic score, the price of a product was adapted according to local poverty lines and the amount a person within the poverty levels has each day for food into poverty-adjusted prices.7
The poverty levels a, b, and c account for 18.9%, 37.60%, and 57.10% of the population, which have ZAR22.10, ZAR29.67, and ZAR44.5/ca/day for food, respectively.4 36 An additional poverty level (diet-bound poverty level) was created to account for 65% of the population unable to afford a healthy diet, with ZAR57.13 to their availability, which was adapted from a recent publication by Ederer et al.50 on purchasing power parity base.36,51
Additional inputs for both farm and factory levels include (1) gross profit, (2) wages, (3) taxes, (4) subsidies, (5) expenses, (6) income from repurposing by-products or waste, (7) employee numbers, and (8) production potential. These were used to assess, amongst others, the extent to which a producer contributes to the GDP of South Africa and to the workforce, as well as the overall financial health of the producer.21 52 The calculations employed are reported in Table 4.
table 2: Environmental score user inputs
Farm and factory inputs Farm-only inputs
Product yield
By-product yield
Quantity recycled
Quantity repurposed
Production potential
Fuel use
Electricity use
Blue water use
Sustainability training or education frequency (never < 5–10 y < 2–5 y < yearly < 2xyear)
Fertiliser use
Pesticides use
Cropping type (mono < rotational <inter <cover <regenerative < agroforestry)
Livestock use (mixed pasture < single pasture < total mixed ration+ fodder carry, post-harvest grazing < total mixed ration(no fodder carry) < none)
Soil type (sandy < clay < loam < silt < peat)
Soil test frequency (never < 5–10 y < 2–5 y < yearly < 2xyear)
Water test frequency (never < 5–10 y < 2–5 y < yearly < 2xyear)
Crop health/livestock welfare assessment (never < 5–10 y < 2–5 y < yearly < 2xyear)
Factory-only inputs
Improvement in efficiency yearly (none < 1–2% < 2–5% < 5–10% < 10%+) Not 100% recycled packaging used
Nutrient profiles sourced from literature comparisons22-27 and previous local nutrient analysis data53 were used to compile the varying scenarios for a nutrient comparison as reported in Table 5. Protein quality could only be assessed from locally sourced data as sufficient published literature was unavailable. The main subscores and final nutrient score are shown in Table 5, with the full nutritional score outline used is reported in Supplementary table 13
Scenario: (1) local primary analysis (Maree et al.53); (2) South African products’ label information (Maree et al.53), supplemented with local primary analysis results; (3) literature results, supplemented with local results (Smith et al.16; Walther et al.27); (4) literature results, supplemented with local results (Fructuoso et al.24).
The quantitative inputs used in the environmental score were inferred from literature scenarios as follows: (1) oat and soya bean that are regeneratively produced, based on published available data, although not representative of all production systems in South Africa; (2) dairy production, based on pasturebased systems that represent a large majority of South Africa’s production systems54; and (3) conventionally produced almonds from California, representing 75% of globally produced almonds, including the majority of brands in South Africa28,55. On the processor level, some adaptations have been made to be representative of a South African production system where a single processor is responsible for multiple beverage types.
Qualitative measures were purely hypothetical and have been kept close to similar in all products to avoid the incorrect portrayal of results. Table 6 reports the main subscores. Major differences included between scenarios were only in the cropping type and use of livestock, where bovine milk utilised cover-cropping and pasture-based systems; almond production used monocropping without postgrazing or integration of livestock but
table 6: Subscores and environmental score results of bovine milk and plant-based beverages
used chicken manure, and therefore has been indicated as postharvest grazing in the form of manure spreading (because manure spreading is not an option itself at this point); soy used rotational cropping and no livestock; and oat milk utilised regenerative agriculture and postharvest grazing. The quantitative scenarios and numerical inputs used are reported in Supplementary table 9–12, based on inputs and outputs per year, whereas the full environmental score outline used is reported in Supplementary tables 14 and 15
Pertaining the economic score, large data gaps and differences between local and international data sets lead to insufficient data to populate the model. Hence, a decision was made to focus on locally available information (which is retail price), preventing skewed results. To scrutinise the effect of price on the economic score, a hypothetical scenario was thus created in which the same producer processes milk and PBBs, with results reported in Table 7. All other factors remained equal across all products, with retail price being the only differing factor.
table 7: Comparison of retail price effect in the economic score results of bovine milk and plant-based beverages
table 5: Nutrient score comparison
The fourth (diet-bound) poverty level was selected for the comparison of retail prices. The economic component outline is reported in Supplementary table 16
The results of the main scores (excluding protein score), according to the DiEET model, are shown in Figure 3. Considering the relationship between each component and one another, it is clear that a trade-off exists between the scores when aiming to achieve a high score on more than one parameter. When comparing each score of the PBBs, as a percentage of that of bovine milk as shown in Figure 4, a clear relationship emerges in which the magnitude of differences between the nutrition score and economic score appears, as well as the direction and component in which bovine milk needs to improve.
Discussion
The developed model, including nutritional, environmental, and economic scores as separate indicators, offers variations and scope beyond standard measures, such as the NRFh12, NRFPI49, nLCA8, or other single-metric indexes. This is, in general, a deviation from common practice and can provide opportunity for transparency in consumer decision-making and education. The environmental footprint simplifies comparisons by focusing on key indicators of environmental footprint rather than a single environmental footprint. On the one hand, this is an improvement
to standard measures, such as an LCA8, as it represents a broad range of outcomes other than carbon footprint, specifically considering the ongoing debate regarding the use of carbon dioxide equivalents in current metrics30,56. It further allows for industrial application by farmers and producers because of the simplicity of data required.
In the DiEET model results reported in Table 6, mostly similar trends in environmental scores compared to standard units of measure were observed. Notably, the environmental score of bovine milk was consistently lower than all PBBs. Factory inputs for the environmental score remained similar, especially in cases where processors handle both milk and PBBs on the same production line. However, it is essential to acknowledge that raw material processing, which typically occurs off-site for PBBs, is not fully represented in the environmental score calculation and may be under-represented. This highlights a data gap and the potential for increased industry collaboration and data sharing. Yet, it underscores the improvement required in better reporting on matters, such as carbon sequestration, as well as the overall decrease in the environmental footprint of bovine milk.
The DiEET nutrient score in Table 5, both as a subscore and in the final score after accounting for additional health factors, indicated that bovine milk offers a more favourable nutrient profile. This aligned with nutrient profiling but provided less variation than the NRFi, as results using the
Figure 3: DiEET results for bovine milk and plant-based beverages (bubble size: nutritional score).
Figure 4: DiEET results of plant-based beverages in relation to bovine milk.
NRFi are largely dependent or influenced by fortification. Protein quality, as assessed by protein score, however, showed that soy beverage contained more amino acids per gram of protein than bovine milk or other PBBs, although per 100 mL this might not be the case. This suggests that soy beverage could serve as a valuable protein supplement when considering gram-to-gram protein quality. It further sheds light on the limitations in the use of DIAAS, which does not provide an indication of the overall dietary supplementation that could be achieved by a product but solely focuses on digestibility, neglecting that amino acids in their singular form could act as supplements to an otherwise lacking diet.14 The model also provided a broader and country-specific contextualised view of the nutrient profiles of milk and PBBs.
From an economic perspective, the model results in Table 7 suggest that bovine milk has a more favourable economic score compared to other beverages when only taking affordability into account, making it more affordable for a larger portion of the population. Based on the nutritional score, this consequently allows for more affordable, high-quality nutrition. Although hypothetical data were used to populate the remaining values in the economic scores, the economic score in general provides a holistic view of economic sustainability by taking both consumer affordability and producer viability into account. Application in industry and consequent validation of these results with ground-truth data can provide further insights into the results and trends reported in this study.
As is, the model is a stepping stone towards more holistic and transparent sustainability measures, recognising that the scientific accuracy and data supporting the model requires more in-depth research and validation. Ideally, in subsequent iterations of the intended SiEEN model, subscores would apply where each production system (e.g. crops, livestock, mixed, intensive, and extensive) has their own analysis which contributes to the final scores.
Additional data sets need to be collected and made available by producers to validate the model and gain accurate results, as well as measure the alignment with current methods and trends to prevent any form of bias generated by the model. The model’s complexity requires careful interpretation but serves as a potential tool for decision-makers in the food industry, researchers, and policymakers, as well as consumer educators. To realise this, rapid adoption of the tool by stakeholders is needed to ensure validation and continuous improvement of the model, as well as for data collection to improve the accuracy of results. Such conclusions will aid policymakers in making recommendations on production systems and dietary inclusions and provide a holistic perspective on sustainable production and consumption, moving away from often one-dimensional policies.
Critical evaluation
Limitations in the model exist because of multiple factors, such as the omission of nutrient bioavailability57, which was an initial goal yet requires much more extensive research to include accurately. Limited research is currently available on the contribution of PBBs to global nutrient supply; hence, overestimations or underestimations are possible and require verification when considering the current weightings applied to nutrient supply and contribution of PBBs.
While the NRFh approaches used provide a useful framework for evaluating the nutrient density of foods, its application is limited by the inability to fully capture the complexities of individual dietary needs and the synergistic effects of whole diets. This model, focused on quantifying the nutritional value of single food items, overlooks the broader context of dietary patterns and the interplay between different foods and nutrients that influence health outcomes. Consequently, it may not adequately address the variability in nutritional requirements amongst individuals or the holistic nature of dietary health. Future research should, therefore, pivot towards exploring the impacts of whole diets and food groups within these diets to offer more comprehensive and personalised dietary recommendations. From an environmental perspective, although requiring simplified data, the model risks oversimplification of the environmental impact of products and requires large-scale studies to verify the relationships between these indicators with outcomes, such as eutrophication potential, acidification, or
biodiversity loss. This is especially relevant to the qualitative measures employed in the environmental component in which a scaling point system is used at equal intervals, whereas ground-truth data may indicate that the scaling intervals change according to different size intervals or based on the environmental impact of each production system (such as regenerative in comparison to conventional). A larger variety of options are further required to represent more diverse production systems.
In the economic component, verification is lacking in the results observed, particularly from a processor level, and consequently requires further research to investigate the relevant economic parameters in more detail. The lack of information from a processor perspective further eliminates room for comment on the success of the measures of economic parameters other than affordability.
Statistically, the model results are limited because of the availability of local data and consequent verification thereof. Thus, the results only provide an indication of whether the model can be implemented in industry, based on the general trends observed in the results and how well it compares to that found in the literature. The results should not be reported as definitive indications of the sustainability of milk and PBBs. In the future, the application of the model and collection of ground-truth data will provide sufficient data sets to validate the model and the results from an industry perspective and a statistical perspective.
Conclusion
The DiEET model’s approach has advanced the existing understanding of the sustainability of bovine milk versus plant-based alternatives, such as almond, soy, and oat beverages. This research emphasised the need for a holistic view of sustainability, incorporating nutrient density, bioavailability, environmental impacts through comprehensive life cycle assessments, and the socio-economic implications for food security in South Africa. It further indicated that the potential trade-off to be made between environmental sustainability and nutrient density or affordability, however, to shed light on the potential for the dairy industry to reduce its environmental impact. This is relevant to all beverages, as the use of regenerative practices has a clear impact on the final environmental score. In the aim towards sustainable food systems, the necessity for collaborative research, policy innovation, and informed decision-making is underscored. As a first step, this involves implementing the model in South Africa and continuing improvements based on producer and user feedback in order to inform policy and consumer choices.
Acknowledgements
We acknowledge Ms van der Elst for language editing of this manuscript.
Funding
We thank Milk South Africa for providing funding through ASSET Research (PRJ-0346-2023).
Data availability
All the data supporting the results of this study are included in this manuscript.
Declarations
The project was funded by Milk South Africa and conducted through an independent research organisation, ASSET Research, as part of an MSc degree. The funders had no direct involvement in the project’s design, data collection, analysis, or interpretation. All project results and conclusions were finalised prior to any report to the funders. Authors affiliated with the funders were excluded from the conclusion development and were given reviewer access only, without any influence on the final outcomes. After writing the first draft, ChatGPT version 4.0, Open AI was used for an initial language screening or to shorten lengthy sentences using the following two prompts: “Correct the language and grammar in this paragraph: [inserted paragraph]” or “Shorten this text to 50 words: [inserted text].” All resulting text was revised for accuracy before inclusion and submission to an official language editor.
Authors’ contributions
E.M.: Investigation, writing – original draft, writing – review and editing. J.N.B.: Writing – review and editing, supervision. C.J.L.D.T.: Writing –review and editing, supervision. H.H.M.: Writing – review and editing, supervision.
r eferences
1. Roser M, Ritchie H. Hunger and undernourishment [webpage on the Internet]. c2020 [cited 2023 Aug 19]. Available from: https://ourworldindata.org/hunge r-and-undernourishment#undernourishment-by-world-region
2. Galal S. National poverty line in South Africa [webpage on the Internet]. c2022 [cited 2023 Aug 19]. Available from: https://www.statista.com/statistics/112 7838/national-poverty-line-in-south-africa/#:~:text=As%20of%202022%2 C%20an%20individual,per%20month%20was%20considered%20poor
3. Food Systems Dashboard. Cost of a healthy diet [webpage on the Internet]. c2023 [cited 2024 Jan 13]. Available from: https://www.foodsystemsdashboard.org/indi cators/food-environments/food-affordability/cost-of-a-healthy-diet/map
4. World Bank. Poverty and equity brief, sub-Saharan Africa [document on the Internet]. c2020 [cited 2023 Jun 05]. Available from: https://databankfiles. worldbank.org/public/ddpext_download/poverty/33EF03BB-9722-4AE2-AB C7-AA2972D68AFE/Global_POVEQ_ZAF.pdf
5. Berners-Lee M, Kennelly C, Watson R, Hewitt CN. Current global food production is sufficient to meet human nutritional needs in 2050 provided there is radical societal adaptation. Elementa-Sci Anthrop. 2018;6, Art. #52. https://doi.org/10.1525/elementa.310
6. Smith NW, Dave AC, Hill JP, McNabb WC. Nutritional assessment of plantbased beverages in comparison to bovine milk. Front Nutr. 2022;9, Art. #957486. https://doi.org/10.3389/fnut.2022.957486
7. Drewnowski A. Measures and metrics of sustainable diets with a focus on milk, yogurt, and dairy products. Nutr Rev. 2018;76(1):21–28. https://doi.or g/10.1093/nutrit/nux063
8. Kayo C, Tojo S, Iwaoka M, Matsumoto T. Chapter 14: Evaluation of biomass production and utilization systems. In: Tojo S, Hirasawa T, editors. Research approaches to sustainable biomass systems. New York: Academic Press; 2014. https://doi.org/10.1016/B978-0-12-404609-2.00014-3
9. Vorster HH, Badham JB, Venter CS. An introduction to the revised food-based dietary guidelines for South Africa. S Afr J Clin Nutr. 2013;26(3):S5–S12.
10. Keri S, Moritz S, Ludwig R, Claire ET. South African consumer adoption of plant-based and cultivated meat: A segmentation study. Front Sustain Food Syst. 2021;5, Art. #744199. https://doi.org/10.3389/fsufs.2021.744199
11. Drewnowski A, Maillot M, Darmon N. Should nutrient profiles be based on 100 g, 100 kcal, or serving size? Eur J Clin Nutr. 2009;63:898–904. https:// doi.org/10.1038/ejcn.2008.53
12. Drewnowski A, Fulgoni III VL. New nutrient rich food nutrient density models that include nutrients and MyPlate food groups. Front Nutr. 2020;7, Art. #00107. https://doi.org/10.3389/fnut.2020.00107
13. Ridoutt B. An alternative nutrient rich food index (NRF-ai) Incorporating prevalence of inadequate and excessive nutrient intake. Foods. 2021;10(12), Art. #3156. https://doi.org/10.3390/foods10123156
14. Leser S. The 2013 FAO report on dietary protein quality evaluation in human nutrition: Recommendations and implications. Nutr Bull. 2013;38(4):421–428. https://doi.org/10.1111/nbu.12063
15. Beal T, Katz-Rosene R, Ortenzi F, McAuliffe GA. Levelling foods for priority micronutrient value can provide more meaningful environmental footprint comparisons. Commun Earth Environ. 2023;4, Art. #287. https://doi.org/10 .1038/s43247-023-00945-9
16. Smith NW, Fletcher AJ, Hill JP, McNabb WC. Modeling the contribution of milk to global nutrition. Front Nutr. 2021;8, Art. #716100. https://doi.org/10.338 9/fnut.2021.716100
17. De Boer IJM, Cederberg C, Eady S, Gollnow S. Greenhouse gas mitigation in animal production: Towards an integrated life cycle sustainability assessment. Curr Opin Environ Sustain. 2011;3(5):423–431. https://doi.org/10.1016/j.co sust.2011.08.007
18. Hoekstra AY, Chapagain AK, Aldaya MM, Mekonnen MM. The water footprint assessment manual: Setting the global standard. London: Earthscan; 2011.
19. McLaren S, Chaudhary A. Integration of environment and nutrition in life cycle assessment of food Items: opportunities and challenges. Rome: FAO; 2021. https://doi.org/10.4060/cb8054en
20. Zhang A, Heath R, Wiseman L, McRobert K, Rainbow R, Llewellyn R, et al. Who will benefit from big data? Farmers’ perspective on willingness to share farm data. J Rural Stud. 2021;88:346–353. https://doi.org/10.1016/j.jrurstu d.2021.08.006
21. Dynan K, Sheiner L. GDP as a measure of economic well-being. Hutchins Center on Fiscal and Monetary Policy. Hutchins Center Working Paper #43. Washington, DC: The Brookings Institution; 2018.
22. Vanga SK, Raghavan V. How well do plant based alternatives fare nutritionally compared to cow’s milk? J Food Sci Technol. 2018;55:10–20. https://doi.or g/10.1007/s13197-017-2915-y
23. Paul AA, Kumar S, Kumar V, Sharma R. Milk analog: Plant-based alternatives to conventional milk, production, potential and health concerns. Crit Rev Food Sci Nutr. 2020;60(18):3005–3023. https://doi.org/10.1080/10408398.2019 .1674243
24. Fructuoso I, Romão B, Han H, Raposo A, Ariza-Montes A, Araya-Castillo L, et al. An overview on nutritional aspects of plant-based beverages used as substitutes for cow’s milk. Nutrients. 2021;13(8), Art. #2650. https://doi.or g/10.3390/nu13082650
25. Sunidhi GS, Vij R, Katoch S. Comparison of dairy milk with vegan milk of different types available in India. Pharma Innov J. 2021;SP-10(11):24–29.
26. Singh-Povel CM, Van Gool MP, Rojas APG, Bragt MCE, Kleinnijenhuis AJ, Hettinga KA. Nutritional content, protein quantity, protein quality and carbon footprint of plant-based drinks and semi-skimmed milk in the Netherlands and Europe. Public Health Nutr. 2022;25(5):1416–1426. https://doi.org/10.1017 /S1368980022000453
27. Walther B, Guggisberg D, Badertscher R, Egger L, Portmann R, Dubois S, et al. Comparison of nutritional composition between plant-based drinks and cow’s milk. Front Nutr. 2022;9, Art. #988707. https://doi.org/10.3389/fnut .2022.988707
28. Marvinney E, Kendall A. A scalable and spatiotemporally resolved agricultural life cycle assessment of California almonds. Int J Life Cycle Assess. 2021;26:1123–1145. https://doi.org/10.1007/s11367-021-01891-4
29. De Kock L, Vienings E, Blignaut A, Pretorius W, Fourie P, Smith HJ. Determining the carbon footprint intensity of different winter grain farming regimes in the Western Cape. Annual progress report for Phase 1, for the Winter Cereal Trust, South Africa. Pretoria: GrainSA; 2018.
30. Blignaut A, Vienings E, Saywood K, Nel A, Smith HJ, Fourie P. Determining the carbon footprint of maize for different farming systems in South Africa’s summer rainfall regions. Annual progress report for Phase 1, for The Maize Trust, South Africa. Pretoria: ASSET Research; 2019.
31. Heusala H, Sinkko T, Sözer N, Hytönen E, Mogensen L, Knudsen MT. Carbon footprint and land use of oat and faba bean protein concentrates using a life cycle assessment approach. J Clean Prod. 2020;242, Art. #118376. https:/ /doi.org/10.1016/j.jclepro.2019.118376
32. Ţifrea A, Tita O. Deficiency of vitamin C in dairy products and supplementation in milk by adding the bioactive natural products. Bull Univ Agric Sci Vet Med Cluj-Napoca. 2011;68:272–276.
33. Mahabadi N, Bhusal A, Banks SW. Riboflavin deficiency. Treasure Island, FL: StatPearls Publishing; 2023. Available from: https://www.ncbi.nlm.nih.gov/b ooks/NBK470460/
34. Statista. Population of South Africa in 2022, by age group and gender [webpage on the Internet]. c2022 [cited 2025 Apr 05]. Available from: htt ps://www.statista.com/statistics/1330839/population-of-south-africa-by-ag e-group-and-gender/
35. NHMRC. Nutrient reference values for Australia and New Zealand including recommended dietary intakes. Canberra: National Health and Medical Research Council; 2005.
36. U.S. Department of Agriculture and U.S. Department of Health and Human Services (USDA). Dietary guidelines for Americans, 2020–2025. 9th ed. Washington, DC: USDA; 2020. Available from: http://DietaryGuidelines.gov
37. Mente A, Dehghan M, Rangarajan S, O’Donnell M, Hu W, Dagenais G, et al. Diet, cardiovascular disease, and mortality in 80 countries. Eur Heart J. 2023;44(28):2560–2579. https://doi.org/10.1093/eurheartj/ehad269
https://doi.org/10.17159/sajs.2025/18928
38. Statistics South Africa. National poverty lines [document on the Internet]. c2021 [cited 2023 Aug 19]. Available from: https://www.statssa.gov.za/publ ications/P03101/P031012021.pdf
39. Harika R, Faber M, Samuel F, Mulugeta A, Kimiywe J, Eilander A. Are low intakes and deficiencies in iron, vitamin A, zinc, and iodine of public health concern in Ethiopian, Kenyan, Nigerian, and South African children and adolescents? Food Nutr Bull. 2017;38(3):405–427. https://doi.org/10.1177 /0379572117715818
40. Sivaprasad M. Prevalence of vitamin deficiencies in an apparently healthy urban adult population: Assessed by subclinical status and dietary intakes. Nutrition. 2019;63, Art. #106. https://doi.org/10.1016/j.nut.2019.01.017
41. CVB. Table booklet feeding of ruminants 2016. Nutrient requirements for cattle, sheep and goats and nutritional values of feeding ingredients for ruminants. Lelystad: CVB; 2016.
42. Reynaud Y, Buffière C, Cohade B, Vauris M, Liebermann K, Hafnaoui N, et al. True ileal amino acid digestibility and digestible indispensable amino acid scores (DIAASs) of plant-based protein foods. Food Chem. 2021;338, Art. #128020. https://doi.org/10.1016/j.foodchem.2020.128020
43. Aguilera JM. The food matrix: Implications in processing, nutrition and health. Crit Rev Food Sci Nutr. 2019;59(22):3612–3629. https://doi.org/10.1080/1 0408398.2018.1502743
45. Qi X, Tester RF. Lactose, maltose, and sucrose in health and disease. Mol Nutr Food Res. 2020;64(8), Art. #1901082. https://doi.org/10.1002/mnfr. 201901082
46. O’Donnell M, Mente A, Alderman MH, Brady AJ, Diaz R, Gupta R, et al. Salt and cardiovascular disease: Insufficient evidence to recommend low sodium intake. Eur Heart J. 2020;41(35):3363–3373. https://doi.org/10.1093/eurh eartj/ehaa586
47. Schönfeldt HC. World Milk Day: ‘Milk and dairy products are an important component of a prudent diet’ writes UP expert. ARUA Centre of Excellence in Sustainable Food Systems [webpage on the Internet]. c2020 [cited 2023 Oct 24]. Available from: https://www.up.ac.za/arua-centre-of-excellence-in-sus tainable-food-systems/news/post_2898512-world-milk-day-milk-and-dair y-products-are-an-important-component-of-a-prudent-diet-writes-up-expert
48. ul Haq S, Boz I. Measuring environmental, economic, and social sustainability index of tea farms in Rize Province, Turkey. Environ Dev Sustain. 2020; 22:2545–2567. https://doi.org/10.1007/s10668-019-00310-x
49. Mendoza-Velázquez A, Guzmán-Rodríguez M, Lara-Arévalo J, Drewnowski A. The nutrient rich food price index: A nutrition-relevant adaptation of the Laspeyres price index to track the cost of affordable nutrient density. Front Nutr. 2023;10, Art. #1107573. https://doi.org/10.3389/fnut.2023.1107573
50. Ederer P, Baltenweck I, Blignaut JN, Moretti C, Tarawali S. Affordability of meat for global consumers and the need to sustain investment capacity for livestock farmers. Anim Front. 2023;13(2):45–60. https://doi.org/10.1093/ af/vfad004
51. Trading Economics. South Africa – GDP per capita, PPP (current international $) [webpage on the Internet]. c2025 [cited 2025 Jun 23]. Available from: https://tradingeconomics.com/south-africa/gdp-per-capita-ppp-us-dollar-w b-data.html
52. CSO. Gross domestic product: How it is measured [webpage on the Internet]. c2023 [cited 2023 Sep 08]. Available from: https://www.cso.ie/en/interacti vezone/statisticsexplained/nationalaccountsexplained/grossdomesticproduc thowitismeasured/
53. Maree E, Blignaut JN, Du Toit CJL, Meissner HH. Nutritional analysis of milk and milk analogues: A determinant of nutritional sustainability. Paper presented at: SAAFoST 25th Biennial Congress; 2023 August 28–30; Cape Town, South Africa.
54. Gertenbach W. Dairy farming in South Africa – where to now? Institute for Animal Production, Western Cape Department of Agriculture [document on the Internet]. No date [cited 2024 Jul 02]. Available from: https://www.fao.or g/fileadmin/templates/est/COMM_MARKETS_MONITORING/Dairy/Documen ts/18_William_Gertenbach__paper.pdf
55. Johnston J, Pretorius C. Report on the sale of plant based dairy imitation products in the South African retail market. Pretoria: Dairy Standard Agency (DSA) and the Consumer Education Project (CEP) of Milk SA; 2020.
56. Manzano P, Rowntree J, Thompson L, del Prado A, Ederer P, Windisch W, et al. Challenges for the balanced attribution of livestock’s environmental impacts: The art of conveying simple messages around complex realities. Anim Front. 2023;13(2):35–44. https://doi.org/10.1093/af/vfac096
57. Dave LA, Hodgkinson SM, Roy NC, Smith NW, McNabb WC. The role of holistic nutritional properties of diets in the assessment of food system and dietary sustainability. Crit Rev Food Sci Nutr. 2023;63(21):5117–5137. https ://doi.org/10.1080/10408398.2021.2012753
https://doi.org/10.17159/sajs.2025/18928
AuthorS: Manzimase Sishi-Vilakazi1 Henriette L. de Kock1
AFFILIAtIoN:
1Department of Consumer and Food Sciences, University of Pretoria, Pretoria, South Africa
CorrESPoNDENCE to: Manzimase Sishi-Vilakazi
EMAIL: manzisishi@gmail.com
DAtES:
r eceived: 02 Apr. 2025
r evised: 24 June 2025
Accepted: 25 June 2025
Published: 11 Aug. 2025
hoW to CItE:
Sishi-Vilakazi M, de Kock HL. Palm oil in salty snacks: A South African labelling audit on sustainability communication. S Afr J Sci. 2025;121(7/8), Art. #21341. https:// doi.org/10.17159/sajs.2025/21341
Palm oil in salty snacks: A South African labelling audit on sustainability communication
Palm oil is widely used in global food production and is highly valued in the salty snack industry for its frying performance, oxidative stability and cost-effectiveness. However, concerns about its environmental and social impacts persist. We investigated the prevalence of palm oil and its derivatives in salty snack products, the presence of sustainability claims, including the Roundtable on Sustainable Palm Oil (RSPO) certification logo, and other types of claims on salty snack product labels. A total of 638 in-market products across six categories (maize, potato, grain, vegetable and fruit chips, and ready-to-eat popcorn) were audited. Palm oil and its derivatives were declared in 59% of products; 27% used alternative oils and 14% listed only ‘vegetable oil’ without specifying the oil type. Maize chips (45%) and potato chips (31%) were the largest product categories, with 60% and 69%, respectively, containing palm oil and its derivatives. Vegetable chips showed the lowest reliance on palm oil. Despite the prominence of palm oil, none of the products featured the RSPO certification logo or any certification indicating sustainable palm oil sourcing. Instead, product claims primarily highlighted dietary information, flavour characteristics and production methods. These findings reveal that while palm oil use is widespread in salty snacks, engagement with palm oil sustainability concerns is lacking. This gap presents an opportunity for manufacturers to adopt certified sustainable palm oil or eco-friendly alternatives, aligning with Sustainable Development Goal (SDG) 12 (responsible consumption and production) and growing consumer demand for transparency and environmental responsibility.
Significance:
This study uncovered a disconnect in South Africa’s salty snack industry: while palm oil is a dominant ingredient, its sustainability remains overlooked. Despite global efforts to promote certified sustainable palm oil, none of the audited products featured the RSPO certification logo or communicated sustainable palm oil sourcing practices. This gap highlights a missed opportunity for manufacturers to align with Sustainable Development Goal 12 (responsible consumption and production). By adopting and promoting certified sustainable palm oil, the industry can meet rising consumer demand for ethical practices, reduce its ecological footprint and position itself as a leader in sustainable food production.
Introduction
The consumption of salty snack products is a significant and growing trend within global food markets1, driven by shifting consumer preferences2 coupled with increased urbanisation3 and stress levels4. Salty snacks, which include an array of products such as potato chips, nuts, crackers, popcorn and pretzels are popular across various demographics due to their convenience5, appealing taste6 and variety7. These snacks are found in many households and are a popular choice for on-the-go consumption.8
There is a rising interest in the use of sustainable ingredients in the production of snack products.9 One such ingredient is palm oil, which is obtained from the fleshy, ripe mesocarp of palm fruit from palm trees (Elaeis guineensis). In its natural state, palm oil is semi-solid at room temperature and typically undergoes fractionation, a separation process, to yield its derivatives: palm stearin (solid) and palm olein (liquid).10 For palm oil to be considered sustainable, it must be produced in ways that minimise environmental and social harm.11 Palm oil and its derivatives are cost-effective, versatile and widely used ingredients in the food industry.10 They are found in a variety of packaged products, ranging from snacks to cosmetics, commonly sold in supermarkets.12 Notably, palm oil is particularly favourable for frying salty snacks due to its high-temperature stability, oxidation resistance and neutral odour.10
However, the production of palm oil is notorious for its significant negative environmental impacts, such as water pollution, deforestation and loss of biodiversity. Additionally, the expansion of palm oil plantations has negatively affected local communities through displacement, exploitation and child labour.13 These challenges have spurred the development of sustainable palm oil production practices, which are certified by organisations such as the Roundtable on Sustainable Palm Oil (RSPO).14 The RSPO, a global non-profit organisation, has established a certification scheme to identify products made with palm oil that is economically viable, socially beneficial and environmentally friendly. As the largest and most significant palm oil certification body, the RSPO is accredited by independent organisations to ensure credibility. Its globally recognised certification logo is aimed at helping consumers easily identify and choose products containing RSPO-certified sustainable palm oil.
As consumers become more environmentally and socially conscious, they increasingly prefer food products that reduce ecological footprints and adhere to ethical production practices.15 Incorporating sustainable palm oil into food products aligns with this growing demand for responsibly sourced ingredients. This shift reflects broader global goals, such as the United Nations’ Sustainable Development Goal (SDG) 12, which emphasises sustainable consumption and production patterns. SDG 12 encourages industries to adopt responsible sourcing practices and minimise their environmental impact. Furthermore, this shift aligns with SDG 3, which aims to ensure healthy lives and promote well-being for all at all ages.
https://doi.org/10.17159/sajs.2025/21341
Despite growing consumer interest, no research has been found on the use of sustainable palm oil in food products sold in South Africa. However, studies conducted in Italy16, France17, England18, Spain and Peru19, Germany20 21 and Switzerland11 have explored consumer perceptions of palm oil, awareness of the RSPO label and the impact of ‘palm oil free’ versus ‘sustainable palm oil’ claims on consumer perceptions22. According to the RSPO23:
South Africa is the largest consumer of certified sustainable palm oil (CSPO) [palm oil that is certified by the RSPO24] on the African continent, followed by Nigeria, Egypt and Kenya, accounting for 17% of total CSPO consumption in Africa. With South Africa having the highest number of RSPO supply chain certified facilities by an African country, it is a critical hub for downstream suppliers.
The objective of this research was to explore the use of palm oil and its derivatives as ingredients in salty snack products available on the South African market, and to assess the extent to which manufacturers communicate the use of sustainable palm oil through front- or back-ofpack claims, including the use of the RSPO certification logo or any other sustainability-related certifications and markings. In addition, we aimed to analyse the broader spectrum of product claims presented on product packaging, to determine whether and how sustainability, particularly in relation to fats and oils, is integrated into consumer-facing labelling. By examining these claims, this research provides valuable insights into the visibility, prioritisation and framing of sustainability narratives in the salty snack industry of South Africa.
Materials and methods
The audit consisted of two parts. The first part explored and described the use of palm oil and its derivatives as ingredients in selected salty snack products available on the South African retail market through a market analysis. The second part investigated whether any salty snack products claimed to use sustainable palm oil as communicated via the RSPO certification logo or any other forms of sustainability claims. Other claims found on product labels (both front and back) were also documented. To ensure comprehensive coverage, an Internet search supplementary to the in-store audit was conducted through retailer and manufacturer websites. Data collection and analysis were conducted between December 2023 and August 2024. Salty snack products were limited to maize (also referred to as corn in some parts of the world), potato, grain, vegetable and fruit chips, and ready-to-eat popcorn as defined in Table 1. The categories were chosen based on their reliance on significant amounts of oil during production (e.g. deep-frying, frying and popping).25,26 Additionally, the product categories were chosen to represent a wide spectrum of popular snack options available to consumers, ensuring a robust analysis of palm oil usage patterns across products, brands and flavours. Although brand names were recorded during data collection, they have been excluded in the results. This was done to avoid any perceived endorsement or criticism, reduce bias and maintain objectivity. All types of nuts, crackers, pretzels, sweet maize snacks, rice cakes and microwave popcorn were excluded in this study as they typically use lower amounts of oil in their production.
The market analysis was conducted exclusively in the Johannesburg Metropolitan Municipality, a major economic hub in South Africa30, where diverse food retailers cater to consumers across socio-economic groups31. Data were collected from a total of 13 stores: six grocery stores (Checkers, Pick ‘n Pay Hyper, Food Lover’s Market, Spar, Woolworths Food and Glenvale Hyper), two health stores (Clicks and Dischem), three wholesale stores (Makro, Devland Cash & Carry, Kit Kat Cash & Carry), one speciality snacks store (Tasko Sweets) and one clothing store selling its own brand of snack products (Mr Price). Some of these retailers were chosen for their large revenue and growth, providing an inclusive representation of where most consumers purchase their salty snacks.32
Both qualitative and quantitative data were collected, transcribed and categorised into a Microsoft® Excel® spreadsheet (Version 2409). Photographs of products within the selected salty snacks categories were captured with a smartphone for documentation purposes and supplemented with images from manufacturer websites. Information on
Salty snack category Definition
Potato chips
Maize/corn chips
Vegetable chips
Fruit chips
Grain chips
Ready-to-eat popcorn
Salty snacks made from fresh thin slices of fried or baked potatoes and coated with seasoning OR salty snacks that are potato-based and coated with seasoning.7
Salty snacks made from fried, baked or air-popped maize/corn and coated with seasoning. This includes all maize extrudes, puffs, pops, pellets, popped corn chips and tortilla chips.7
Salty snacks made from fresh slices of fried, baked or dried vegetables (other than potatoes and maize/ corn) and coated with seasoning, e.g. beetroot, sweet potato, carrot, kale.7 27
Salty snacks made from fresh slices of fried, baked or dehydrated fruit and coated with seasoning, e.g. banana, plantain.7,28
Salty snacks made from a single cereal, pseudo-cereal or legume grain or a mixture of different grains (besides maize/corn), either whole or in flour form that are fried, baked or air popped and coated with seasoning, e.g. rice, quinoa, oats.7 29
Salty snacks made from whole-popped and seasoned maize kernels that are prepared and packaged for immediate consumption.
the front and back of each product’s packaging was captured to ensure inclusion of ingredient lists, country of origin and all claims.
Data analysis
Descriptive statistics, analysed using Microsoft Excel 365, were used to report the declaration of palm oil and its derivatives, as well as other oils listed as ingredients. Each product label was assessed only once using a binary coding system (1=present/yes, 0=absent/no) to capture the declaration of the use of palm oil and its derivatives. When the same salty snack product was available in multiple packaging sizes, only one size (either the largest or the one available at the time of data collection) was recorded to avoid duplication. Similarly, if the same salty snack product was available at multiple store locations, it was included only once for analysis. Any other non-palm-oil-related claims identified on multiple products were grouped based on similarity, and regarded as one claim to eliminate double-counting. For example, gluten-free/ naturally gluten-free/certified gluten-free was regarded as one type of claim. Additionally, the countries of origin were analysed for all salty snack products included in the study. To maintain confidentiality, product brands and names were anonymised in this analysis.
r esults
The granular data collection approach provided a detailed understanding of the variations in labelling practices across different salty snack product categories and brands, particularly with respect to ingredient disclosures and any sustainability-related claims. Table 2 summarises the ratio of products per category, details of products with and without palm oil and its derivatives, and the distribution of locally made versus imported products. In total, 638 salty snack products were included in the analysis, consisting of maize chips (n = 289), potato chips (n = 199), ready-to-eat popcorn (n = 68), grain chips (n = 61), vegetable chips (n = 12) and fruit chips (n = 9). Of all the products assessed, as expected, a majority (59%) of the salty snack products explicitly declared the use of palm oil as an ingredient, while 27% of products did not make use of palm oil or its derivatives as an ingredient. The remaining 14% just specified ‘vegetable oil’ as an ingredient. The results highlight varying degrees of transparency and reliance on palm oil and its derivatives across salty snack product categories. Maize chips constituted the largest salty snack product category (45% of the total
table 1: Classification of salty snack categories
2: Comparison
Spain, United States of America (USA), United Arab Emirates (UAE)
Belgium, Germany, Indonesia, Latvia, Malaysia, UAE, USA
sample). Among these, 175 products (61%) declared the use of palm oil and its derivatives, demonstrating a significant reliance on this ingredient; 46 products (16%) did not list palm oil as an ingredient, but listed other vegetable oils (such as canola and sunflower oil) and 68 products (24%) specified the generic term ‘vegetable oil’. Additionally, 256 (89%) of the maize chip products were produced in South Africa while 33 (11%) were imported. Potato chips represented the second-largest category (31% of the total sample). For this category, 137 products (69%) declared the use of palm oil and its derivatives, 51 products (26%) stated use of other oils and 11 products (6%) specified the generic term ‘vegetable oil’. Of the potato chips analysed, 157 products (79%) were produced in South Africa and 42 products (21%) were imported. The ready-toeat popcorn category, representing the third-largest category, comprised 11% of the total sample; 33 products (49%) declared the use of palm oil, 30 products (44%) listed the use of other vegetable oils and 5 products (7%) specified the generic term ‘vegetable oil’. Within this category, 61 products (90%) were produced in South Africa, while 7 products (10%) were imported. Grain chips accounted for 10% of the total sample. The results for this category showed that 28 products (46%) declared the use of palm oil, 29 products (48%) the use of other vegetable oils and 4 products (7%) specified ‘vegetable oil’. All grain chip products analysed were produced in South Africa. Vegetable chips were a smaller category (2% of the total sample). None of the vegetable chips declared the use of palm oil or its derivatives; instead, all products (100%) stated the use of vegetable oils. Of these, 9 products (75%) were produced in South Africa and 3 (25%) were imported. The fruit chips category represented the smallest category with 9 products (1% of the total sample). Four products (44%) declared the use of palm oil while five products (56%) declared use of other vegetable oils. Five products (56%) were produced in South Africa and the rest (44%) were imported.
Table 3 outlines the types of claims recorded from the front and back labels of the 638 salty snack products assessed. The claims were grouped into seven categories: sustainable palm oil, flavour and/or texture, packaging, ingredients and nutrition, production methods/ locations, sustainability, and fats and oils. Each category provides insight into how manufacturers present and communicate product quality, health and sustainability to consumers.
No claims related to the use of sustainable palm oil and its derivatives, communicated using the RSPO certification logo or alternative wording, were recorded on any of the salty snack product labels. A total of 24 claims were recorded, which were flavour and/or texture related. Common descriptors in this category emphasised the intensity of flavours and satisfying textures, limited-edition offerings, product size
and endorsements of brand history. Examples include: “Roars with flavour”, “Beeg flavour”, “Crunchiest, munchiest, tastiest”, “Lekka flava” and “Krunching with flavour”.
Packaging claims, although less prevalent, were noted in three instances. These claims focused on new or improved packaging designs, as well as packaging techniques aimed at enhancing product quality. Examples include: “New recipe, new packaging” and “Foil packed for extra freshness”. These packaging claims suggest an effort to differentiate salty snack products based on improved quality preservation and consumer satisfaction.
The most frequently recorded claims (43) were related to ingredients, dietary information and nutritional content. These claims often promoted health-conscious ingredients or special dietary considerations, appealing to nutrition and dietary-preference-conscious consumers. Examples include: “Gluten free”, “Halaal”, “Vegetarian”, “No sugar added”, “Non-GMO corn”, “High in protein” and “Natural ingredients”.
Production methods were recorded through 10 claims, typically emphasising artisanal or traditional methods of production, along with innovative cooking processes aimed at improving product health and quality. Examples include: “Batch cooked”, “Air popped”, “Oven baked with real cheese” and “Handmade in SA”.
Sustainability-related claims were infrequent, with only four claims recorded, none of which directly addressed the use of sustainable palm oil and its derivatives. The sustainability-related claims that were present focused on production methods or sourcing of ingredients. Examples include: “Made with specially selected South African potatoes”, “Organic”, “Made with care” and “Seasonal potatoes”.
Nine claims were recorded about the use of fats and oils, primarily focused on the type of oils used or the health benefits associated with the product’s fat content. Claims in this category often emphasised lower fat content or the use of alternative and healthier oils. Examples include: “Fried in coconut oil”, “Fried in a canola-maize oil blend”, “Trans-fat free” and “Low in saturated fat”.
Discussion
This study provides valuable insights into the use of palm oil and its derivatives in salty snack products within the South African retail market, based on an analysis of 638 products across six distinct categories. As expected, the use of palm oil is widespread in salty snacks available in this market. This aligns with global trends, in which palm oil is favoured over other vegetable oils such as sunflower and canola oils due to its stability
table 3:
Summary of the types of claims recorded on the front and back labels of selected salty snack products (n = 638)
Sustainable palm oil (n = 0)
Flavour and/or texture (n = 24)
Roars with flavour
Beeg flavour
Hot! Smokin hot!
Crunchiest, munchiest, tastiest
Lekka flava
Krunching with flavour
Packed with flavour
Propvol smaak
Limited edition ghost pepper
Limited edition
New improved recipe
Same recipe, new size
Beeg, very beeg
Crispy
Honest, Simple, Lekker
Simple honest disclosure
The no.1 snack
Guilt-free snacking
Trusted since 1967
Local vibe
Traditional
Feel the flaming spicy ghost pepper crunch in the mouth
Light, crisp & crunchy
Double money back, quality guaranteed
Packaging (n = 3)
New recipe, new packaging
Same recipe, new packaging/ New look. Same great taste/ New look, same intensity
Vegetarian/ Suitable for vegetarians/ Vegetarian with milk/ Suitable for lacto-vegetarians
Vegan/ Vegan friendly
Tartrazine free
Sugared/ Only 1.1g sugar
No sugar added
Made with real cheese
Made from corn/ Authentic corn chips/ Made with 100% corn grains/ Original puffed corn/ Made with heirloom
Mexican organic corn/ Made with organic white corn/ Certified organic corn
Volcanic stone-ground
Non-GMO corn/ Non-GMO
No added MSG/ MSG free No azo-dye colourants/No colourants/ No artificial colours & flavours
Made with 37% lentil & chickpea flour
Source of/high in fibre/ Naturally high in fibre
High in energy & fibre/ High in energy/ Naturally high in fibre/ Naturally high in energy
Made with 45% quinoa flour
Made with 48% chickpea flour
Made with 70% lentils
Only 35/108/109/110/111 calories per serving/ Low in calories
High in resistant starch
Production method/ location (n = 10)
Air popped
Kettle popped
Oven baked with real cheese
Batch cooked
Always baked, never fried/ Baked, not fried/ Popped, never fried/ Not fried/ Popped, not fried
Baked and Flash Fried
Handmade in SA
Air dried
Hand-crafted
Made south of Mexico in Africa
Sustainability (n = 4) Fats and oils (n = 9)
Locally grown/ Made with specially selected South African potatoes/ Made with locally sourced vegetables/ Locally sourced potatoes
Made with care
Seasonal potatoes
Organic
With sunflower oil
Roasted with skin in sunflower oil
Made with 100% macadamia nut oil
Fried in coconut oil
Fried in a canola-maize oil blend
Use of high oleic sunflower oil
28%/30%/32%/33%/35% /38%/40%/50%/56%/63 %/65%/70% less fat
No trans-fat, never fried/ Trans-fat free
Low in saturated fat
table 3 continues on next page
Sustainable palm oil (n = 0)
Flavour and/or texture (n = 24)
Packaging (n = 3)
Ingredients, dietary and nutritional (n = 42)
Super food
High in potassium
10 g/10.2 g/10.3 g protein/ Source of protein/ High in protein
Natural ingredients
Plant based
Cholesterol free/ Naturally cholesterol free/ Low in cholesterol
No preservatives
Made with only 2/3/4/12/13/14 ingredients
0.0% alcohol
Plant based
Kilojoule controlled
100% raw
With legumes
66% green peas
1.9g Net Carbs
Perfect every time
Source of wholegrain
Seasoned with pure desert salt
Low GI
40% less salt
Carbon-neutral brewery
at high temperatures, oxidative resistance and cost-effectiveness.10 33
These functional properties make it a key ingredient in large-scale snack production, underscoring its importance in the industry.
A substantial portion of the products either did not use palm oil and its derivatives or did not specify its use, simply labelling the oil generically as “vegetable oil”. This lack of transparency in ingredient disclosure has substantial implications for consumer awareness and sustainability efforts. Without clear labelling, consumers concerned about the environmental or social impacts of palm oil may struggle to make informed choices. According to the South African foodstuffs labelling and advertising regulation (R.146), the class names of ingoing fats and oils (single and in combination) shall be indicated in the list of ingredients of foodstuffs as “vegetable”, “animal”, “fish” or “marine”. In addition, “each class name should be further qualified by an indication of all of its ingoing type(s) of fats and oils, in parentheses after the class name”. And, “in the case of vegetable fats and oils the particular part of the plant from which the fat or oil is derived, shall be specified”34 For example, if a product makes use of palm oil and/or its derivatives, it should be listed in the ingredient list as “vegetable oil (palm oil/palm kernel oil/palm olein/palm stearin)”.
The use of the generic term “vegetable oil” without specifying the oil type/s, could be a way for manufacturers to avoid disclosing the use of palm oil, non-compliantly so, thus potentially hindering efforts to
Production method/ location (n = 10)
Sustainability (n = 4) Fats and oils (n = 9)
educate consumers about sustainability. Alternatively, by not specifying the oil type, manufacturers could switch between different oils based on availability, cost or market conditions, without needing to relabel their products. This flexibility is particularly advantageous in volatile commodity markets where oil prices fluctuate.35 Interestingly, lack of specificity in oil-type labelling may also suggest that some salty snack producers may be shifting towards using alternative oils such as sunflower or canola oil, which are often perceived as healthier.33 This trend could indicate an opportunity for further market differentiation, particularly in the growing health, wellness and sustainability segments. As noted by Frey et al.15, sustainability is increasingly being used as a competitive advantage in global food markets. South African snack manufacturers could benefit from adopting similar strategies to attract health- and environmentally conscious consumers.
One of the most notable findings of this study was the absence of any claims related to the use of sustainable palm oil and its derivatives, as certified by the RSPO or other sustainability logos. This is particularly interesting given the increasing global consumer awareness of environmental sustainability and the growing demand for sustainably produced ingredients.36 In addition, although palm oil is widely used, the audit found no evidence of manufacturers promoting the use of CSPO or other eco-friendly alternatives in their products. This raises important questions concerning whether manufacturers are sourcing sustainable palm oil at all or whether they are simply not mentioning or promoting it.
The absence of RSPO certification logos on products could be attributed to several factors. Firstly, there might be logistical, supply chain or cost-related challenges in sourcing, verifying and using sustainable palm oil. For instance, RSPO-certified suppliers may be required to pay licensing fees to use the RSPO certification logo. Therefore, while RSPO-certified palm oil is environmentally friendly, it can be more expensive to source for manufacturers because of these fees37,38, the cost of complying with RSPO standards and supply chain limitations11. Verifying supply chain transparency and ensuring that the palm oil used is truly sustainable can also be perceived by manufacturers as overly complex. Additionally, packaging redesigns to accommodate sustainability logos may incur further operational and printing costs. For manufacturers focused on decreasing production costs, switching to sustainable palm oil may not be a priority, especially in a price-sensitive market like South Africa. Secondly, manufacturers may not see the immediate value in promoting sustainability, especially if they believe that South African consumers are more concerned with, for example, price, taste and convenience than with environmental responsibility.39 If consumers are not fully aware of the environmental and social impacts of conventional palm oil production, they may not actively demand sustainable alternatives. This creates a feedback loop where manufacturers are less inclined to source sustainable palm oil because there is no perceived market for it or return on investment. Lastly, there may be a knowledge gap in which manufacturers themselves are not fully aware of the benefits and opportunities associated with using certified sustainable palm oil. This lack of engagement with sustainability certifications, particularly RSPO, contrasts sharply with global trends in which numerous companies and brands are increasingly adopting sustainable palm oil practices to align with consumer expectations40, corporate social responsibility goals41 and SDGs42. Notably, while South Africa is recognised as the largest consumer of CSPO in Africa23, this study’s findings suggest that the local retail market for salty snacks has not yet capitalised on the environmental, social and competitive advantages of sustainable sourcing compared to the global market, where the RSPO has made strides in promoting sustainable palm oil. This gap offers manufacturers an opportunity to differentiate their products by incorporating meaningful sustainability claims, potentially appealing to the growing segment of ethically and environmentally conscious consumers.
In contrast to the lack of sustainability-related claims, the audit revealed that manufacturers place strong emphasis on flavour, health and ingredient-related claims, demonstrating a strong focus on sensory appeal. Flavour and texture claims were prevalent, reflecting the competitive nature of the salty snack market where sensory appeal is a key driver of consumer purchase decisions.6 These claims highlight the competitive emphasis on enjoyable eating experiences to attract and retain consumers. Additionally, they help differentiate products by creating a sense of exclusivity, loyalty or local pride, adding value beyond flavour and texture considerations. This sensory focus aligns with existing research, which highlights taste as a primary motivator for snack consumption43, particularly in indulgence categories like potato chips and popcorn. Ingredient-related claims were also prominent, with claims related to diet and nutrition such as “MSG/ Gluten-free” or “Non-GMO corn”. This implies that manufacturers are responding to growing consumer demand for ‘perceived to be healthier’ snack options44 by emphasising dietary inclusivity, clean labels and transparency concerning ingredient sourcing. In addition, these ingredient-related claims align with specific consumer dietary needs2 such as ‘low-fat’, ‘high-protein’, and ‘source of’ or ‘free-from’ attributes. Therefore, the prevalence of these claims suggests that provision of healthy salty snack product options is a priority for manufacturers, which aligns with broader health trends in which consumers are increasingly seeking lower-fat or healthier oil options in their salty snack products of choice. Claims related to production methods reflect a growing trend of highlighting small-scale, traditional or healthier cooking techniques as a way to appeal to consumers seeking authentic and healthier alternatives. The limited presence of sustainability-related claims, compared to the prevalence of other types of claims, suggests that, while manufacturers operating in this market are addressing certain consumer preferences, environmental concerns are not yet being prioritised in their marketing strategies. This imbalance reflects the industry’s current priorities where
sustainability is not yet a primary concern for salty snack producers in the South African market, as only a small number of brands are actively promoting their environmental credentials on their product labels. This contrasts with research indicating that sustainability is becoming an increasingly important factor in consumer food choices45, particularly among younger generations40 42. Manufacturers in South Africa may be missing an opportunity to engage with these consumers through more robust sustainability communication, particularly regarding palm oil sourcing. Additionally, manufacturers have the potential to have a positive impact on the environment and communities in palm-oilproducing countries by supporting sustainable production practices. This would help address critical issues such as deforestation of tropical rainforests, habitat destruction of palm oil plantations and unfair labour practices. Manufacturers and retailers could play a more proactive role in educating consumers about palm oil sustainability through clearer labelling, in-store promotions or online platforms. Such efforts would not only help bridge the current knowledge gap but also capture a larger share of the market, particularly among environmentally conscious consumers.
Overall, these findings address the objectives of the study. The audit confirmed the widespread use of palm oil and its derivatives in salty snack products across most categories, particularly maize and potato chips. It revealed a striking lack of on-pack communication regarding sustainable palm oil sourcing, with no instances of RSPO certification or similar sustainability logos observed. In addition, the analysis of front- and back-of-pack claims showed that although flavour, nutrition and production methods were frequently highlighted, environmental sustainability, especially in relation to palm oil, was notably underrepresented. Collectively, these results confirm a disconnect between ingredient sourcing and the promotion of sustainability in labelling practices, thereby fulfilling the study’s aim of evaluating both the prevalence of palm oil and the extent to which its sustainability is communicated to consumers.
This study provides a baseline understanding of palm oil usage and labelling practices in the South African salty snack industry. Future research could explore a few directions to build on these findings. Firstly, while this study focused on salty snacks, other snack products were observed during the audit. A broader audit inclusive of additional snack categories, including all types of sweet and savoury snack products, could provide deeper insights into palm oil usage across the entire snack industry. This would help determine whether the patterns observed in this study are consistent across other product types. Secondly, future research could explore consumer perceptions and awareness of palm oil and its derivatives, as well as their sustainability impacts. While this study focused on product labels and manufacturer claims, understanding how consumers interpret and respond to sustainability certification logos would provide valuable context for developing more effective marketing strategies. Focus group discussions or surveys with consumers, particularly targeting younger demographics, could shed light on the factors driving their snack purchasing decisions and the role of sustainability in their choices. Lastly, longitudinal studies could track changes in palm oil usage and sustainability claims over time. As global pressure to adopt sustainable palm oil practices continues to grow, monitoring how the South African snack industry responds will be critical in determining whether more products begin to utilise the RSPO certification logo or other sustainability certifications.
Conclusion
The findings of this study demonstrate that palm oil is a prominent ingredient in the South African salty snacks industry. Maize and potato chips, in particular, demonstrate a high reliance on palm oil and its derivatives, likely because of their functional properties such as frying stability, cost-effectiveness and texture enhancement. In contrast, smaller categories like vegetable and fruit chips use palm oil less frequently. Despite the growing global awareness of the environmental and social impact of palm oil production, none of the products audited displayed the RSPO certification logo or any other certification to communicate the use of sustainable palm oil. This highlights a significant gap in both the adoption and communication of sustainable palm oil practices in the South African salty snack market. This gap presents a major opportunity for manufacturers to differentiate themselves by sourcing
CSPO and prominently featuring the RSPO certification logo on their packaging. Doing so would not only contribute toward lessening the environmental and social impacts of palm oil production but also align with the increasing consumer demand for environmentally and socially responsible food products. The absence of the RSPO certification logo on products suggests that South African consumers may not be fully informed about the environmental and social impacts of palm oil or the value of sustainable options. In addition, the costs associated with RSPO logo licensing and packaging redesign may disincentivise manufacturers from communicating sustainability practices, especially in price-sensitive markets. This signals a need for further research to understand potential barriers such as lack of awareness, scepticism toward certifications and price sensitivity, as well as drivers such as environmental and social concerns. Insights from such research could guide new communication strategies and supply chain decisions, encouraging manufacturers to source and promote certified sustainable ingredients.
Acknowledgements
We acknowledge the University of Pretoria for awarding a postgraduate student bursary to M.S-V. in support of her doctoral studies.
Data availability
The data supporting the results of this study are not available.
Declarations
M.S-V. is an employee of PepsiCo Inc. We declare no additional conflicts of interest. In preparing this manuscript, AI (artificial intelligence)46 was used to assist in revising and editing the text, as well as summarising existing literature. The prompt that was used for some sections was “Suggest an improved version of this paragraph to enhance readability and flow”. This tool helped improve the clarity, coherence and grammatical accuracy of the writing. All content generated or refined with AI was thoroughly reviewed, validated and adjusted by the authors to ensure it aligned with the study’s objectives and maintained accuracy.
Authors’ contributions
M.S-V.: Conceptualisation, methodology, investigation, formal analysis, validation, data curation, writing – original draft, writing – review and editing, project leadership, project administration. H.L.d.K.: Conceptualisation, methodology, writing – review and editing, supervision. Both authors read and approved the final manuscript.
r eferences
1. Innova Market Insights. Global salty snack trends and innovation [webpage on the Internet]. c2024 [cited 2024 Dec 07]. Available from: https://www.inn ovamarketinsights.com/trends/global-snack-trends/
2. Mintel. Key trends driving growth in the salty snacks market [webpage on the Internet]. c2023 [cited 2024 Dec 18]. Available from: https://www.mintel.c om/insights/food-and-drink/key-trends-driving-growth-salty-snacks-market/
3. FAO Knowledge Repository. The state of food security and nutrition in the world. Urbanization is transforming agrifood systems and affecting access to affordable healthy diets across the rural-urban continuum [document on the Internet]. Rome: FAO, IFAD, UNICEF, WFP,WHO; 2023 [cited 2024 Dec 28]. Available from: https://openknowledge.fao.org/items/445c9d27-b396-412 6-96c9-50b335364d01
4. Gillebaart M, Schlinkert C, Poelman MP, Benjamins JS, De Ridder DT. Snacking for a reason: Detangling effects of socio-economic position and stress on snacking behaviour. BMC Public Health. 2022;22(1), Art. #2009. https://doi.org/10.1186/s12889-022-14384-2
5. Vollmers C, Vollmers S, Swenson J. Competing in the salty snack industry. In: Hall S, editor. Proceedings of the American Society of Business and Behavioral Sciences Conference; 17–21 February 2000; Nevada. Las Vegas, USA. San Diego, CA: ASBBS; 2000. p. 1–16. https://citeseerx.ist.psu.edu/ document?repid=rep1&type=pdf&doi=f73c67f26bb8e0f8b068a6be8e134 dd67280b62c#page=3
6. Schlinkert C, Gillebaart M, Benjamins J, Poelman M, De Ridder D. The snack that has it all: People’s associations with ideal snacks. Appetite. 2020;152, Art. #104722. https://doi.org/10.1016/j.appet.2020.104722
7. Bawa AS, Sidhu JS. Snack foods | Range on the market. In: Caballero B, editor. Encyclopedia of Food Sciences and Nutrition. 2nd ed. Cambridge, MA: Academic Press; 2003. p. 5322–5332. https://doi.org/10.1016/B0-12-227 055-X/01096-8
8. Hess JM, Jonnalagadda SS, Slavin JL. What is a snack, why do we snack, and how can we choose better snacks? A review of the definitions of snacking, motivations to snack, contributions to dietary intake, and recommendations for improvement. Adv Nutr. 2016;7(3):466–475. https://doi.org/10.1096/fas ebj.30.1_supplement.895.5
9. Boukid F, Klerks M, Pellegrini N, Fogliano V, Sanchez-Siles L, Roman S, et al. Current and emerging trends in cereal snack bars: Implications for new product development. Int J Food Sci Nutr. 2022;73(5):610–629. https://doi.o rg/10.1080/09637486.2022.2042211
10. Mba OI, Dumont M-J, Ngadi M. Palm oil: Processing, characterization and utilization in the food industry – A review. Food Biosci. 2015;10:26–41. https ://doi.org/10.1016/j.fbio.2015.01.003
11. Wassmann B, Siegrist M, Hartmann C. Palm oil and the roundtable of sustainable palm oil (RSPO) label: Are Swiss consumers aware and concerned? Food Qual Prefer. 2023;103, Art. #104686. https://doi.org/10 .1016/j.foodqual.2022.104686
13. Plasek B, Lakner Z, Badak-Kerti K, Kovács A, Temesi Á. Perceived consequences: General or specific? The case of palm oil-free products. Sustainability. 2021;13(7), Art. #3550. https://doi.org/10.3390/su13063550
14. Roundtable on Sustainable Palm Oil (RSPO). The RSPO Trademark [webpage on the Internet]. c2023 [cited 2024 Nov 01]. Available from: https://rspo.org /as-an-organisation/our-trademark/
15. Frey S, Am JB, Doshi V, Malik A, Noble S. Consumers care about sustainability—and back it up with their wallets [webpage on the Internet]. c 2023 [cited 2025 Jan 04]. Available from: https://www.mckinsey.com/indu stries/consumer-packaged-goods/our-insights/consumers-care-about-susta inability-and-back-it-up-with-their-wallets
16. Capecchi S, Amato M, Sodano V, Verneau F. Understanding beliefs and concerns towards palm oil: Empirical evidence and policy implications. Food Policy. 2019;89, Art. #101785. https://doi.org/10.1016/j.foodpol.2019.101785
17. Disdier A-C, Marette S, Millet G. Are consumers concerned about palm oil? Evidence from a lab experiment. Food Policy. 2013;43:180–189. https://doi. org/10.1016/j.foodpol.2013.09.003
18. Aguiar LK, Martinez DC, Caleman SM. Consumer awareness of palm oil as an ingredient in food and non-food products. J Food Prod Mark. 2017;24(3):297–310. https://doi.org/10.1080/10454446.2017.1266559
19. Guadalupe GA, Lerma-García MJ, Fuentes A, Barat JM, Bas MDC, FernándezSegovia I. Presence of palm oil in foodstuffs: Consumers’ perception. Br Food J. 2019;121(9):2148–2162. https://doi.org/10.1108/bfj-09-2018-0608
20. Hinkes C, Christoph-Schulz I. Consumer attitudes toward palm oil: Insights from focus group discussions. J Food Prod Mark. 2019;25(9):875–895. https://doi.org/10.1080/10454446.2019.1693468
21. Lieke S-D, Spiller A, Busch G. Can consumers understand that there is more to palm oil than deforestation? Sustain Prod Consum. 2023;39:495–505. https://doi.org/10.1016/j.spc.2023.05.037
22. Vergura DT, Zerbini C, Luceri B. “Palm oil free” vs “sustainable palm oil”: The impact of claims on consumer perception. Br Food J. 2019;121(9):2027–2035. https://doi.org/10.1108/bfj-01-2019-0020
23. Roundtable on Sustainable Palm Oil (RSPO). RSPO hosts first Africa downstream sustainable palm oil supply chain forum in Cape Town [media release on the Internet]. 2024 April 18 [cited 2024 Dec 05]. Available from: https://rspo.org/rspo-hosts-first-africa-downstream-sustainable-palm-oil-su pply-chain-forum-in-cape-town/
24. CSPO Watch. What is certified sustainable palm oil CSPO? [webpage on the Internet]. c2024 [cited 2024 Dec 20]. Available from: https://www.cspo-wat ch.com/defining_sustainable_palm_oil_cspo.html
25. Arslan M, Xiaobo Z, Shi J, Rakha A, Hu X, Zareef M, et al. Oil uptake by potato chips or French fries: A review. Eur J Lipid Sci Technol. 2018;120(10), Art. #1800058. https://doi.org/10.1002/ejlt.201800058
26. Zhang Y, Zhang T, Fan D, Li J, Fan L. The description of oil absorption behavior of potato chips during the frying. LWT - Food Sci Technol. 2018;96:119–126. https://doi.org/10.1016/j.lwt.2018.04.094
27. Frîncu M, Barbu A, Ion VA, Petre A, Bădulescu L. Processing methods used for organic vegetable chips–review. Sci Pap Ser B Hortic. 2022;66(2):384–391. https://horticulturejournal.usamv.ro/pdf/2022/issue_2/Art49.pdf
28. Fu H, Lee CH, Nolden AA, Kinchla AJ. Nutrient density, added sugar, and fiber content of commercially available fruit snacks in the United States from 2017 to 2022. Nutrients. 2024;16(2), Art. #292. https://doi.org/10.3390/n u16020292
29. Agrahar-Murugkar D, Zaidi A, Dwivedi S. Quality of nixtamalized, sprouted and baked multigrain chips. Nutr Food Sci. 2018;48(3):453–467. https://doi.org/ 10.1108/NFS-11-2017-0252
30. Quirk J. Making Johannesburg the epicentre. Camb Rev Int Aff. 2021; 34(6):888–894. https://doi.org/10.1080/09557571.2021.1994322
31. Thorne S. The cities where South Africans pay the most for food. Businesstech. 2024 April 04 [cited 2024 Nov 30]. Available from: https://bu sinesstech.co.za/news/lifestyle/765769/the-cities-where-south-africans-pa y-the-most-for-food/
32. The biggest retailers in South Africa: Shoprite vs Woolworths vs Spar vs Pick n Pay. Businesstech. 2024 May 20 [cited 2024 Dec 20]. Available from: https://businesstech.co.za/news/trending/772654/the-biggest-retailers-in-s outh-africa-shoprite-vs-woolworths-vs-spar-vs-pick-n-pay/
33. Parsons S, Raikova S, Chuck CJ. The viability and desirability of replacing palm oil. Nat Sustain. 2020;3(6):412–418. https://doi.org/10.1038/s4189 3-020-0487-8
34. South African Department of Health (DOH). Foodstuffs, Cosmetics and Disinfectants Act, 1972 (Act no. 54 of 1972): Regulations relating to the labelling and advertising of foodstuffs, Regulation no. R146. Pretoria: DOH; 2010. Available from: https://www.gov.za/sites/default/files/gcis_document/ 201409/32975146.pdf
35. Caputo R, Ordóñez F. Wars, cartels and COVID-19: Regime switching in commodity prices. Appl Econ Lett. 2022;31(4):338–345. https://doi.org/10. 1080/13504851.2022.2133892
36. Hattingh D, Ramlakan S. Stretched South African consumers put health and sustainability on the shopping list [webpage on the Internet]. c2022 [cited 2024 Nov 07]. Available from: https://www.mckinsey.com/za/our-insights/ stretched-south-african-consumers-put-health-and-sustainability-on-the-sh opping-list
37. Zizhu Z. Certification makes palm oil pricier, so why aren’t producers benefiting from it? Dialogue Earth. 2021 May 08 [cited 2024 Jan 30]. Available from: https://dialogue.earth/en/food/can-only-western-buyers-affo rd-sustainable-palm-oil/
38. Oliphant E, Simon AC. The cost of sustainable palm oil: Should an Indonesian smallholder pursue RSPO-certification? World Dev Perspect. 2022;26, Art. #100432. https://doi.org/10.1016/j.wdp.2022.100432
39. Magano NN, Tuorila H, De Kock HL. Food choice drivers at varying income levels in an emerging economy. Appetite. 2023;189, Art. #107001. https://d oi.org/10.1016/j.appet.2023.107001
40. Dauda S, Sidique SF, Sheng TY, Djama M. Consumer preference for certified sustainable palm oil with environmental sustainability attributes: A choice experiment approach. Stud Appl Econ. 2021;39(4):1–13. https://doi.org/10. 25115/eea.v39i4.4570
41. Khalil S, Ismail A, Ghalwash S. The rise of sustainable consumerism: Evidence from the Egyptian Generation Z. Sustainability. 2021;13(24), Art. #13804. https://doi.org/10.3390/su132413804
42. Su C-H, Tsai C-H, Chen M-H, Lv WQ. U.S. sustainable food market Generation Z consumer segments. Sustainability. 2019;11(13), Art. #3607. https://doi. org/10.3390/su11133607
43. Forbes SL, Kahiya E, Balderstone C. Analysis of snack food purchasing and consumption behaviour. J Food Prod Mark. 2016;22(1):65–88. https://doi.or g/10.1080/10454446.2014.949992
44. Innova Market Insights. Global snack market trends [webpage on the Internet]. c2024 [cited 2024 Dec 28]. Available from: https://www.innovamarketinsight s.com/trends/snack-market/
45. Allès B, Pénéau S, Kesse-Guyot E, Baudry J, Hercberg S, Méjean C. Food choice motives including sustainability during purchasing are associated with a healthy dietary pattern in French adults. Nutr J. 2017;16(1), Art. #58. https://doi.org/10.1186/s12937-017-0279-9
46. OpenAI. ChatGPT-4-turbo [software online]. 2023 [accessed 2025 Mar 31]. Available from: https://chatgpt.com/
https://doi.org/10.17159/sajs.2025/21341
AuthorS: Andrew Thatcher1
Olivier Crespo2
Peter Johnston2
Ammaarah Darsot1
AFFILIAtIoNS:
1Department of Psychology, University of the Witwatersrand, Johannesburg, South Africa
2Climate System Analysis Group, University of Cape Town, Cape Town, South Africa
CorrESPoNDENCE to: Andrew Thatcher
EMAIL: Andrew.Thatcher@wits.ac.za
DAtES:
r eceived: 28 June 2024
r evised: 12 Feb. 2025
Accepted: 03 Apr. 2025
Published: 11 Aug. 2025
hoW to CItE:
Thatcher A, Crespo O, Johnston P, Darsot A. Exploring farmers’ seasonal climate forecast needs: Co-producing forecasts for food security. S Afr J Sci. 2025;121(7/8), Art. #18998. https://doi.org/10.17159/ sajs.2025/18998
Seasonal climate forecasts (SCFs) are explored as an additional tool for farmers to use to act against seasonal climate fluctuations and to support greater food security for themselves and their customers. In this study, we compared the SCF needs and possible emerging farming actions of commercial farmers and smallholder farmers while exploring the prospects for developing SCF tools to aid farmers. Our intent was not to produce a new SCF, but to improve the farmers’ reception, understanding and uptake of existing SCFs. The results show that both farmer groups saw value in SCFs in improving their farming actions (and, by implication, improving their food security) and provided detailed information on their specific SCF needs to support their decision-making, such as how to improve trust, the type of information they would like to receive, how to make SCFs more understandable, and how to make SCFs relevant for their farming actions. The needs of the two groups differed marginally, but the major barrier for smallholder farmers was SCF access as a result of a lack of smartphones and network coverage.
Significance:
The findings help us to understand what farmers need to know to perceive a use and make use of SCFs, and to provide guidance in bridging the gap between existing SCF products and farmers taking more informed farming actions that will increase their resilience to climate change and improve their food security. This will enable us to build seasonal climate forecasting information tools that can be easily accessed and understood by commercial and smallholder farmers alike.
Introduction
While proportionally low in comparison to other African countries, malnourishment and perceptions of food insecurity are both on the rise in South Africa – 4.7 million South Africans are malnourished and 5.3 million report severe food insecurity.1 While South Africa is often viewed as food secure, large-scale commercial farmers are often financially incentivised to favour exports, leaving millions with reduced access to affordable food. The largest proportion of farmers in South Africa are smallholders with limited access to technology, finances or information, and they rely largely on rain-fed agriculture. Crop yields have already been negatively impacted by climate change in southern Africa2 and these are predicted to worsen by 2050 under current climate change predictions3. Reduced yields may have direct negative consequences for food security but will also impact the economy through the loss of income, job losses and the reduction of exports4,5, further exacerbating food insecurity. Despite these early warning signs, South African farmers have yet to fully develop their resilience to climate change.
Significant research efforts have explored adaptation strategies to mitigate the long-term effects of the changing climate through modelling and remote sensing assimilation6, but climate variability remains of near-immediate (i.e. this season) importance. In South Africa, climate variability affects the agricultural sector and results in fluctuating crop yields and the loss of crops on a seasonal timescale.7 To address growing food insecurity, farmers can adopt precision agriculture methods to boost their yields and output. Seasonal climate forecasts (SCFs) provide one opportunity for farmers to gain insights into medium-term meteorological conditions and thus adapt their meteorological-related inputs to support their food security. Where SCFs have been used, they have been shown to improve food production.8 SCFs offer crucial insights into potential climate anomalies expected in the upcoming season.9 While weather forecasts predict the timing and intensity of events a day to several days ahead, SCFs provide estimates of average seasonal conditions over a specified period, typically 1–3 months.10 While they cannot predict specific meteorological events, SCFs indicate whether the upcoming season is likely to be wetter, drier, hotter or cooler compared to typical regional averages. SCFs are therefore particularly useful in the agricultural sector because they may influence farmers' decisions regarding when and what to plant, what supplementary inputs to purchase or use, what yields to expect, and expected harvesting timing.11,12 Effective SCFs are therefore valuable for the agricultural sector to support routine farming decisions as well as to manage risks (e.g. drier seasons, late seasonal onsets or likelihood of frost), and to implement risk-reduction strategies (e.g. the crop mix, seed choices, insurance or land management). These decisions are important, even for smallholder farmers with limited resources.13 Hansen et al.14 reported that farmers in sub-Saharan Africa who responded proactively to SCFs produced proportionately higher crop yields (i.e. reduced food insecurity) than those who did not.
Although the benefits of SCFs are clear, historically they have not been frequently adopted in the agricultural sector15,16, apart from in the USA17. Farmers encounter challenges in accessing, interpreting and applying the forecasts.18 Generally, Bruno Soares and Dessai19 found that organisations in Europe failed to use SCFs because they were unaware of them, the skill and reliability were perceived as too low, there was a high level of perceived uncertainty in SCFs, and they often lacked the perceived relevance for their organisation. In a study on the value of SCFs for agriculture in Australia, Ash et al.20 noted that they were limited by poor skill, short lead times, were difficult to access and understand, and farmers struggled with understanding their relevance to agricultural decision-making. In the USA, Briley et al.21 reported that farmers experienced difficulties in understanding the information provided by SCF experts, were unrealistic in their expectations of what SCFs could produce, and were unsure when it was appropriate to make decisions based on SCFs.
2025 https://doi.org/10.17159/sajs.2025/18998
While there is recent and ongoing work contributing to the development of knowledge on SCF production (i.e. how to produce better-suited and easier-to-understand information), this study purposefully explored the users’ (farmers’) needs and how existing accessible SCFs could be better accessed, understood and appropriately weighted in farmers’ decision processes. Several literature reviews have summarised the problems experienced with SCF adoption by farmers across Africa. Hansen et al.14 identified three broad categories faced by sub-Saharan African farmers: content limitations, accessibility problems and a lack of resources to address seasonal variability. Content limitations included spatial scales that were too broad, imprecise timing of meteorological events, unclear forecast periods, and poor forecast accuracy. Accessibility problems included not knowing where to access SCFs, inequitable access to SCFs with differential technology availability, and the SCF not being available in the local language. Resource limitations prevent necessary adjustments for the coming season. A lack of resources included financial resources to purchase preferred cultivars, insufficient access to lines of credit, unsuitable soils for the meteorological conditions, and insufficient credit to purchase soil enrichment resources. Chisadza et al.’s22 review found similar issues being faced by African smallholder farmers. Muita et al.’s23 review of SCF problems experienced by Kenyan farmers identified accessibility problems, limited access to farm inputs (e.g. appropriate seeds or fertiliser), language barriers, a lack of trust in SCFs, and spatial and temporal limitations of the forecasts.
Ebhuoma8 provided the most comprehensive review of the problems experienced by South African farmers when considering SCFs. Some of the issues were similar to those identified elsewhere in Africa13,22,23, such as the lack of access to SCFs (especially in a local language), poor forecast accuracy, difficulties in understanding probabilistic forecasts, and the same spatial and temporal problems. However, there were also issues that were not present in these other reviews. Specifically, the South African farmers expressed greater trust in Indigenous knowledge systems and did not trust the producers of SCFs or the intermediary disseminators of SCFs (usually extension officers).8 Low literacy was a perceived barrier to SCF adoption, and younger farmers were more likely to consider adopting SCFs than older farmers.8
In summary, farmers expressed problems accessing SCFs, understanding the information on the SCFs if they could access them, and finding the relevance of SCFs for their farming decisions.
sCF tool co-production for south african farmers
Current SCF information available in South Africa is either produced in-country, either by the South African Weather Service for official dissemination or in an academic context (e.g. Forecast Worx), or is produced globally by, for example, the European Centre for Medium-Range Weather Forecasts or the International Research Institute for Climate and Society. Such products are largely developed as top-down data dissemination tools, although, for effective forecasting, the World Meteorological Organization24 calls for co-design with clients. For the World Meteorological Organization, this means strengthening collaborations between the forecast scientists and social scientists to determine what to communicate and how to reveal actionable information to end-users. Muita et al.23 made a similar recommendation based on their review of SCF use with farmers in Kenya. Other studies have shown the value of SCF co-design for end-users, such as Sanchez-Garcia et al.25 who co-developed SCFs tools for moderate and advanced users in Europe, and Steinke et al.26 who co-developed an SCF tool for a seed supply company in Zimbabwe. Bojovic et al.27 defined co-production as an iterative, interactive and collaborative approach between forecast scientists and users that aims to improve the quality and relevance of climate forecasts by tailoring the forecasts to users’ needs. For this study, we adopted an ergonomics/human factors participatory approach28 to co-designing an SCF tool to assist farmers to access, explore, understand and facilitate the extraction of actionable information on existing SCFs for decision-making that underpins their food security.
This study initiates the co-production process for an SCF exploration platform for crop farmers, which intends to address the needs of both smallholder and commercial farmers in South Africa. These are often the two groups into which farmers are placed in South Africa.29 Commercial
farmers have access to land and their produce is predominantly sold for a profit. Smallholder farmers have limited access to land, produce food predominantly for their household, with small surpluses sold for commercial gain, and mainly use family or shared labour with neighbours.29 In South Africa, both farmer groups are highly dependent on rainfed agriculture, which is susceptible to climate variability. The first step in the ergonomics/human factors approach28, when designing a new exploration tool, is to gather information about users’ needs and to understand the kinds of decisions that can be made.
The aims of this study were therefore twofold in comparing the smallholder and commercial crop farmers: (1) to compare the SCF exploration needs and (2) to compare the possible farming actions that enable sustainable food production. There are currently no studies comparing the SCF exploration needs of smallholder and commercial farmers in South Africa, or that have looked at how these two farmer groups might use SCFs to enhance their farming decision-making.
Methods
Procedure
The qualitative study followed ethical procedures for human participants approved by the respective ethics committees at the University of the Witwatersrand (MAORG/21/03 and MAORG/21/03) and the University of Cape Town (FSREC 064-2021). The data were collected in two stages. The sampling strategy was purposive, based on where the research team had contacts and access, to enable the comparison between commercial farmers and smallholder farmers, to be able to consider winter and summer crop farming, and to reflect experiences in locations known for differing SCF skills. Contacts in Overberg Agri helped identify potential interviewees and focus group participants in the Western Cape. Grain SA and extension officers helped identify potential interviewees and focus group participants in the Eastern Cape. The first stage involved semi-structured, in-depth interviews. Interviews took place in farmers’ homes, offices or community halls, in September and October 2021. Interviews were conducted in English or Afrikaans (Western Cape) and English or Xhosa (Eastern Cape) and lasted approximately 1 hour. The interviews were audio-recorded and professionally translated/transcribed into English for analysis. The second stage involved focus group discussions to corroborate the interview data and to identify new issues. Focus groups were held in Caledon (Overberg district, Western Cape) and Moorreesburg (Swartland district, Western Cape) in July 2022 and in Nqanqarhu, Mount Fletcher (Gqabi district, Eastern Cape) and Bizana, eMaxesibeni (Alfred Nzo district, Eastern Cape) in November 2022. The focus groups took place in the Overberg Agri offices (Western Cape) and community halls (Eastern Cape). Each focus group lasted approximately 120 minutes. In the Western Cape, the focus group facilitator spoke Afrikaans, whereas in the Eastern Cape, the facilitator was assisted by a Xhosa-speaking extension officer using the Xhosa version of the focus group questions. The geographical areas from where participants were drawn are shown in Figure 1. Data were collected until saturation was noted in the responses. The researchers were constantly reflexive during data collection and data analysis to understand how their own assumptions, beliefs and judgements might bias the research process.
Instruments
The interview schedule started with biographical questions about the farmer, their farming activities, and their use of climate services, to establish a rapport. Next, farmers were asked about their SCF exploration needs with regard to their farming activities. Last, farmers were asked about the types of actions they could take based on SCFs.
The focus group discussions started with an explanation of SCFs and the issues of probability and forecasting skill. Next, the farmers’ perceptions regarding the usefulness, understandability and trustworthiness of SCFs were probed, as well as suggested exploration capacity improvements. Finally, farmers were asked about the actions that they could adopt based on SCFs.
The interview and focus group schedules were developed in English and translated into Afrikaans and Xhosa.
Participants
Commercial farmers
Although the Western Cape encompasses commercial and smallholder farmers, all commercial farmers we interviewed were based in the Western Cape. In the Western Cape, 13 interviews were held with commercial grain farmers growing various winter rainfall grains, mostly wheat and barley, and 2 interviews were held with extension officers from Overberg Agri. All interviewees were white men who spoke Afrikaans as their home language. This was followed by two workshops with 52 commercial grain farmers and 2 extension officers as participants. Participants were assigned to smaller focus groups for the discussions and then each focus group reported back to the larger workshop (see Table 1). All participants were white Afrikaans speakers; 4 were women and 50 were men.
Smallholder farmers
Similarly, although the Eastern Cape encompasses commercial and smallholder farmers, all smallholder farmers we interviewed were based in the Eastern Cape. In the Eastern Cape, 16 interviews were held with smallholder crop farmers who grow a wide range of summer rainfall crops, including maize, cabbages, beans and potatoes. All interviewees were black and spoke Xhosa as their home language; 4 were women and 12 were men. Interviews were followed by four workshops with 93 smallholder crop farmers and 3 extension officers as participants. Participants were assigned to smaller focus groups as per the commercial farmers (Table 1). All participants were black Xhosa speakers; 51 were women and 45 were men.
analysis
After transcribing the interview and focus group recordings, a random sample of the transcriptions was checked against the recordings by an independent reviewer for accuracy. The interview and focus group data were imported into Nvivo and analysed using thematic analysis. The six-phase approach to a thematic analysis was followed30: (1) familiarisation with the data; (2) generating initial codes; (3) searching for themes; (4) reviewing potential themes; (5) defining and naming themes; and (6) writing the report.
r esults
Most interviewees had not used SCFs (77% of smallholder farmers and 77% of commercial farmers) and many had not even heard of SCFs (69% of smallholder farmers and 15% of commercial farmers), with some smallholder and commercial farmer interviewees sceptical that seasonal forecasting was even possible. For this reason, the focus groups started with a presentation on SCFs and what they were potentially capable of achieving. Attention was paid to the need to present SCF capacity as fairly as possible, including the various South African SCFs, and clarification of inherent uncertainties and skill variations.
sCF exploration needs
Six themes were identified from the interviews and focus groups regarding the needs of farmers from SCFs (see Table 2), although differences were noted between the commercial and smallholder farmers.
table 1: Breakdown of the participants of the focus group discussions
Figure 1: Geographical location of data collection sites.
table 2: Themes identified from the exploration of farmers’ seasonal climate forecast (SCF) needs
Commercial farmers
r eliability
• Must be better than chance (60%; 70%+)
Easier access
• Through apps on mobile phones or a website
• Information in Afrikaans
A complete picture
• Rainfall and temperature
• Wind (soil moisture)
• Intensity of extreme events
• Frequency/spread of rainfall
• Date of seasonal onset (e.g. date of first rains)
r elevance
• Exact location of farm on map
• Historical comparison
• Alignment with indigenous knowledge
Smallholder farmers
r eliability
• Must be better than chance
Easier access
• Through extension officers
• Through mobile phones (WhatsApp and text messages)
• Through radio broadcasts
• Information in Xhosa
A complete picture
• Rainfall and temperature
• Wind (wildfires)
• Hail
• Frost/snow
• Intensity of extreme event
• Frequency/spread of rainfall
r elevance
• Weather stations are too far away to provide meaningful information in their area
• ‘Above’ and ‘below’ normal is unclear (unless you know the normal range)
• Actual values, not ranges
• Less jargon (e.g. skill, probability)
• Short and simple explanations
• Colours are difficult to interpret
reliability
Both the commercial and smallholder farmers specified that they needed to appreciate SCF reliability for SCFs to be considered usable. The commercial farmers specified what they considered to be acceptable reliability levels (levels of either 60% or 70% accuracy), whereas the smallholder farmers indicated that reliability should be better than random chance (i.e. 50% or better).
easier access
While accessibility of SCFs was a theme for both the commercial and smallholder farmers, their needs were different. Commercial farmers wanted access either through an application on their mobile phone or from a website. The smallholder farmers had poorer access to
• Producers of SCFs must come and speak to them
understandability
• Training in how to interpret SCFs
• Avoid or simplify academic jargon (e.g. uncertainty, probability)
smartphones/computers and limited Internet/network connectivity, and therefore expressed a preference for access through their mobile phones either as text messages or WhatsApp messages or through radio broadcasts like weather forecasts. Smallholder farmers also expressed an interest in having SCFs explained to them by extension officers or other authority figures (e.g. by an experienced local farmer or by the SCF producers themselves). Both farmer groups wanted the information accessible in their home language.
a complete picture
To provide the necessary support for their farming operations, both groups of farmers felt that an SCF exploration tool should provide a “complete” picture of meteorological information. However, the two groups differed
in what was considered “complete”. Both groups indicated that rainfall, temperature, the likelihood of extreme events (e.g. heavy rainfall, floods and drought), and the spread of rainfall across the season (e.g. how many days of rain and when the rain was expected during the forecast period) were important. Both groups felt that wind information was important, but for different reasons. The commercial farmers needed this information in conjunction with rainfall and temperature to determine soil moisture. The smallholder farmers needed temperature and wind information to determine the likelihood of wildfires that might threaten their crops. Smallholder farmers were interested in the likelihood of hail, frost and snow that might damage their crops. All the farmers were interested in the onset date of the rainfall season (particularly in anticipation of the planting) as well as the distribution of rain across the season (i.e. whether it would fall regularly or whether there was a likelihood of extreme rainfall events).
relevance
Both farmer groups struggled to identify their own farms/locations on a larger map and wanted the functionality to zoom into the maps to more accurately identify their specific location (and therefore also their specific probabilistic estimates). The smallholder farmer group was also concerned that forecasts were being made based on data collection points that were far away and not relevant to their specific locality (e.g. the meteorological station was in a town 70 km away). Both groups of farmers expressed a need to consider the historical accuracy (i.e. against their own records or own recollections). This would allow the farmers to make a connection with the forecasts. Both farmer groups also wanted an SCF exploration tool aligned with their own indigenous knowledge experiences (e.g. March lilies flowering in March).
trust
Generally, both farmer groups felt that more could be done to improve user trust in SCFs. The smallholder farmers felt that trust could be established by the SCF producers speaking to them in person. They valued a personal connection and the ability to be able to ask questions and engage in dialogue. The commercial farmers wanted information on the sources of the SCFs to be able to identify whether the information came from trustworthy sources. They thought that understanding the science underlying SCFs and that demonstrating the historical accuracy of predictions would increase their trust in SCFs.
understandability
The smallholder farmers were aware that they would be unable to interpret the SCFs without some form of training or support (e.g. from extension officers, educated farmers, or younger farmers who would be familiar with technology). Commercial farmers also felt that they would benefit from training in how to interpret SCFs, but also suggested other ways to improve their understanding. Some of these issues relate to the existing SCF representations which are often presented as terciles (e.g. ‘above normal’, ‘normal’, or ‘below normal’ rainfall) using colours or colour gradients. The terms ‘above’ and ‘below’ normal were considered unhelpful unless the normal rainfall for the specific region and time of year were known. Instead, the commercial farmers wanted a short, simple explanation. The use of technical terms (e.g. ROC curves, skill, probability), which the farmers considered to be jargon, was also identified as problematic.
a ctions available at a seasonal scale
Farmers need to know that SCFs will add value to their farming practices. It was therefore important to understand what actions the different farmer groups felt they could take based on information obtained from exploring SCFs. It is unsurprising that the actions available to smallholder farmers were fewer than those for commercial farmers (Table 3), although there were still many actions available to smallholder farmers.
Input costs
All the farmers indicated that they could use SCF information to regulate their input costs. The number and variety of these input costs was far greater for the commercial farmers. Both farmer groups could regulate the choice of cultivars (e.g. drought-resistant cultivars in a dry season,
early or late maturing), the mix of crops (e.g. changing the proportion of different crops planted or the types of crops planted) to suit the expected conditions, and whether to buy fertiliser (i.e. if good rainfall was expected). The commercial farmers indicated that they could also switch to other types of farming (e.g. shifting to livestock farming). This might also have been possible for some smallholder farmers, although it was not mentioned. Related to this, commercial farmers could also decide how much seed to plant to optimise yields. Commercial farmers indicated that they could also make decisions about how much fertiliser, pesticide and fungicide (especially if rainfall was expected to be high) to purchase. Smallholder farmers were further limited to deciding whether to purchase insurance to secure against poor yields or crop failures. Presumably, this would also be available to commercial farmers, although it was not mentioned by them.
timing
Both farmer groups could use SCF information to adjust the time of planting, the time of harvesting, and the time when fertiliser would be applied. While the flexibility to adjust some of these timings was limited, the information could also help farmers in preparing for these activities (e.g. ensuring equipment was ready, personnel were in place, or the land was prepared). The smallholder farmers also indicated that they could use SCF information to adjust when they would start preparing their land and when they would need to weed the land (if rains had been good). For smallholder farmers, these activities are usually manual and labour intensive because they generally do not have regular access to motorised technology. They would therefore benefit from advanced warnings to enable preparation. Smallholder farmers also indicated that they could decide to stagger their planting rather than planting all their seeds at the same time. For example, if a dry season was expected, they could plant less seed at the start of the season and if the rains arrived, they could plant more seed.
General planning
The commercial farmers also indicated that there were other general planning activities that would benefit from SCFs. If irrigation possibilities existed (e.g. if they had a water-use licence for extracting from a water source or for storing water), they could start planning the irrigation distribution (e.g. laying pipes or digging irrigation channels). Most commercial farmers also had contractual agreements with grain buyers. The SCF information could help these farmers to determine profitable and realistic delivery contracts. Additionally, the commercial farmers indicated that they could use the SCF information to make general farming decisions, such as whether to suspend farming operations (e.g. if the predicted conditions were highly unfavourable). None of the smallholder farmers mentioned any general farm planning activities.
Fatalistic attitude
Both farmer groups also expressed responses that suggested that there was little direct, physical action that could be taken. Both farmer groups indicated that SCF information only promoted an emotional response. Farmers suggested that their emotional responses could range from hope (e.g. hope that the SCF was wrong or that it was correct) to despair (e.g. it is going to be a bad year). Both farmer groups felt that there was nothing that they could do in response to the future weather. The smallholder farmers suggested that they could ask their extension officer what they could do. Commercial farmers were more likely to feel that the SCFs were interesting, but not necessarily informative. Nevertheless, the commercial farmers did feel that exploring SCFs more efficiently would be a further resource to their existing decision-making processes. Despite the limitations, both groups of farmers welcomed additional information, which could confirm (or disconfirm) the decisions and actions that they were already thinking of making and which would either increase their confidence or result in uncertainty.
Discussion
The identified needs and concerns were broadly similar to those identified in previous literature reviews8,14,22,23: the lack of access, the lack of SCF skill and accuracy, the problematic spatial and temporal scales, and wanting SCFs in their local language. The accuracy and reliability of SCFs is difficult
table 3: Themes identified for actions that farmers could take to address seasonal fluctuations
Commercial farmers
Input costs
• Choice of cultivars
• Choice of crop mix
• Shift/diversification to other types of farming (e.g. livestock)
• How much seed to plant
• Buying fertiliser
• Buying fungicide
• Buying pesticides
timing
• Adjust time of planting
• Adjust time of harvesting
• Adjust time of applying fertiliser
• Fungicide application
• Adjust time of insecticide application
General planning
• Planning irrigation opportunities
• Planning delivery contracts
• Financial planning (when to cut losses)
Fatalistic attitude
• Interesting rather than informing decision-making
• Emotions (hope/despair)
• Nothing can be done, it’s all down to rainfall
to guarantee, but conveying these (and other) limitations of SCFs in an open and honest manner is crucial from the farmers’ perspective. Both farmer groups could see the potential of a tailored exploration of SCFs and suggested several content parameters that would improve their decision-making, including the distribution of rainfall events (commercial farmers), and the likelihood of frost, snow or hail (smallholder farmers). Both farmer groups expressed an interest in being trained on how to interpret and use the SCFs, especially in order to understand concepts such as probability and uncertainty, and what they mean for farmers. Hansen et al.14 and Hansen et al.18 have been successful in developing training techniques enabling farmers to understand probabilistic forecasts, which could be applied for this purpose.
Both farmer groups expressed the need for greater trust in SCFs. Alexander and Block15 also highlighted the importance of user trust in the adoption of SCFs. For the commercial farmers, trust needed to be built up through experience in seeing how the SCFs performed against real conditions. The smallholder farmers needed to develop trust through direct interactions with the SCF producers. Given the access issue, it is also possible that a trusted intermediary (e.g. an extension officer) might need to perform this role. This would mean improved training of extension officers to be able to translate the SCFs while applying local relevance. Much of the wariness appears to stem from the smallholders’ distrust of authorities. For the older farmers, this distrust was related to their past experience of authority figures under apartheid and the continuation of misinformation under post-apartheid governance regimes. These farmers tended to trust indigenous knowledge systems
Smallholder farmers
Input costs
• Choice of cultivars
• Choice of crop mix
• Buying fertiliser
• Purchase insurance
timing
• Adjust time to prepare the land
• Adjust time of planting
• Stagger planting
• Adjust time of harvesting
• Adjust time of applying fertiliser
• Determine weeding time
Fatalistic attitude
• Ask extension officers what to do
• Emotions (hope/despair)
• Nothing can be done, it’s all down to rainfall
more than scientific knowledge systems. The smallholder farmers also expressed concerns that the meteorological data stations were not co-located with their farms. They therefore doubted whether the SCFs would give them accurate information. Hansen et al.14 also noted that the historical data coverage that informs SCF modelling tends to be sparser in remote rural areas, which would correspond to the lived experiences of these smallholder farmers.
While both farmer groups wanted to access the SCFs in their home language, how the two groups envisaged accessing SCFs differed. The commercial farmers were more technologically inclined, preferring to access the SCFs through mobile phones or a website. Access for the smallholder farmers was more complicated. If smallholder farmers had mobile phones, they wanted to receive the SCF information as text (either text messages or WhatsApp messages). This is probably related to the sporadic network coverage in many of the more geographically remote farming areas. Smallholder farmers also considered accessing SCFs from radio (and television) broadcasts, which is the usual way of accessing weather forecasts. Independently of the medium, it is highly likely that smallholder farmers would need some type of intermediary mechanism (or person) to access or pre-interpret the SCFs.
Similarly to Hansen et al.14, we found that smallholder farmers were more limited than commercial farmers in their capacity to take up SCF information. While there were definite benefits from SCFs for early planning, from the pre-planting to the post-harvesting stages for smallholder farmers (e.g. given their heavy reliance on manual labour,
this gives them time to put the relevant resources in place), they were, however, more likely to feel that there was nothing that they could do and would rely on external inputs (e.g. from extension officers) to aid their decision-making. Commercial farmers already have more resources at their disposal and therefore have more alternatives. They could make a wide array of decisions based on SCFs, including more general planning for farming decisions such as financial planning.
Future developments and limitations
While it is not possible to address all the needs, seasonal climate information still offers some level of value that is largely unexploited. Without attempting to improve the inherent skill of SCFs, this study emphasises numerous avenues for improvement from a farmer’s perspective. Such improvement could arise from a farmer’s tailored exploration of SCFs to farmers’ needs, offering local relevance, and expressing more honestly the success and failure potential of SCFs. Equipped with this increased explorative capacity of seasonal climate information, farmers would be better able to support their farming operations for improved food security. On the other end of the spectrum, research31 has begun to look at the presentation format of SCF information from a producer’s perspective (in response to farmers’ needs) so that it can be correctly interpreted. Caution should also be taken in reading too much into the comparison of the two farmer groups. In addition to the differences in the sophistication of their farming practices, there are other parameters, such as the types of crops being farmed and the time of year when crops are grown, that makes them non-equivalent groups. It is not the claim that these respondents are representative of all commercial farmers and smallholder farmers in South Africa. The next steps would involve developing and testing prototypes that address the SCF exploration needs of each farmer group. It is important to consider what is possible with regard to the types of information that these farmers would consider useful. Some aspects such as the exact date of the seasonal onset, the distribution of rainfall events, and the intensity of extreme events are extremely difficult to represent with any degree of skill or accuracy. While improving the skill of SCFs in southern Africa would assist in increasing trust, skill will remain a challenge for physical reasons and we therefore advocate for a simpler and honest representation of reliability, which can help farmers appreciate this information. Other aspects, such as different language versions, pose their own challenges for the translation of highly specific scientific terms, but are arguably easier to implement. Given the high rate of technology adoption (especially mobile phones) in the commercial farming communities, access to SCFs for this group would be straightforward through a mobile phone application or web-based platform. There are considerable challenges around accessibility for smallholder farmers, especially in the more remote areas of the Eastern Cape which face the dual challenge of low smartphone ownership coupled with poor network coverage. Clearly, alternative methods of disseminating seasonal forecasting information to these farmers, through some intermediary person or organisation, would be preferred.
Acknowledgements
We thank the following postgraduate students who helped collect data: Sinazo Nyudwana (UCT), Abenathi Mantshiyose (UCT), Yanga-Inkosi Nocezo (UFH) and Tebogo Mathabela (Wits).
Funding
This research was made possible through a South African National Research Foundation grant for Global Change Social Sciences Research Programme, project UID 129479: “Engaging South African farmers on climate variability and change through the use of climate services: a behaviour change approach”.
Data availability
The data are available upon request to the corresponding author.
Authors’ contributions
A.T.: Conceptualisation, methods, data collection, data analysis, writing – the original draft, student supervision, funding acquisition. O.C.: Conceptualisation, project leadership, methods, data collection,
student supervision, writing – the original draft. P.J.: Conceptualisation, methods, data collection, data analysis, writing – the original draft. A.D.: Methods, data collection, data analysis, writing – the original draft. All authors read and approved the final manuscript.
Declarations
We have no competing interests to declare. We have no AI or LLM use to declare. The qualitative study followed ethical procedures for human participants approved by the respective ethics committees at the University of the Witwatersrand (MAORG/21/03 and MAORG/21/03) and the University of Cape Town (FSREC 064-2021).
r eferences
1. FAO, AUC, ECA and WFP. Africa – Regional overview of food security and nutrition 2023: Statistics and trends. Accra: FAO, AUC, ECA and WFP; 2023. https://doi.org/10.4060/cc8743en
2. Ray DK, West PC, Clark M, Gerber JS, Prishchepov AV, Chatterjee S. Climate change has likely already affected global food production. PLoS One. 2019;14(5), Art. #e0217148. https://doi.org/10.1371/journal.pone.0217148
3. Holleman C, Rembold F, Crespo O, Conti V. The impact of climate variability and extremes on agriculture and food security – An analysis of the evidence and case studies. FAO Agricultural Development Economics Technical Study no. 4. Rome: FAO; 2020. https://doi.org/10.4060/cb2415en
4. Berrang-Ford L, Ford JD, Paterson J. Are we adapting to climate change? Glob Environ Change. 2011;21(1):25–33. https://doi.org/10.1016/j.gloenvc ha.2010.09.012
5. Talanow K, Topp EN, Loos J, Martín-López B. Farmers’ perceptions of climate change and adaptation strategies in South Africa’s Western Cape. J Rural Stud. 2021;81:203–219. https://doi.org/10.1016/j.jrurstud.2020.10.026
6. Rusere F, Dicks LV, Mkuhlani S, Crespo O. Integrating a crop model with a greenhouse gas calculator to identify low carbon agricultural intensification options for smallholder farmers in rural South Africa. Clean Technol Environ Pol. 2022;24(6):1663–1680. https://doi.org/10.1007/s10098-022-02272-7
7. Masipa T. The impact of climate change on food security in South Africa: Current realities and challenges ahead. Jàmbá J Disaster Risk Stud. 2017;9(1):1–7. https://doi.org/10.4102/jamba.v9i1.411
8. Ebhuoma EE. Factors undermining the use of seasonal climate forecasts among farmers in South Africa and Zimbabwe: Implications for the 1st and 2nd Sustainable Development Goals. Front Sustain Food Syst. 2022;6, Art. #761195. https://doi.org/10.3389/fsufs.2022.761195
9. Palmer TN, Doblas-Reyes FJ, Weisheimer A, Rodwell MJ. Toward seamless prediction: Calibration of climate change projections using seasonal forecasts. Bull Am Meteorol Soc. 2008;89(4):459–470. https://doi.org/10. 1175/BAMS-89-4-459
10. Weisheimer A, Palmer TN. On the reliability of seasonal climate forecasts. J R Soc Interface. 2014;11(96), Art. #20131162. https://doi.org/10.1098 /rsif.2013.1162
11. Hansen JW. Integrating seasonal climate prediction and agricultural models for insights into agricultural practice. Philos Trans R Soc Lond B Biol Sci. 2015;360(1463):2037–2047. https://doi.org/10.1098/rstb.2005.1747
12. Parton K, Crean J, Hayman P, Mullen J. How do probabilistic seasonal climate forecasts compare with other innovations that Australian farmers are encouraged to adopt? Aust J Agric Res. 2007;58(10):975–984. https://doi. org/10.1071/AR06200
13. Guido Z, Zimmer A, Lopus S, Hannah C, Gower D, Waldman K, et al. Farmer forecasts: Impacts of seasonal rainfall expectations on agricultural decisionmaking in Sub-Saharan Africa. Clim Risk Manag. 2020;30, Art. #100247. https://doi.org/10.1016/j.crm.2020.100247
14. Hansen JW, Mason SJ, Sun L, Tall A. Review of seasonal climate forecasting for agriculture in sub-Saharan Africa. Exp Agric. 2011;47(2):205–240. https: //doi.org/10.1017/S0014479710000876
15. Alexander S, Block P. Integration of seasonal precipitation forecast information into local-level agricultural decision-making using an agent-based model to support community adaptation. Clim Risk Manag. 2022;36, Art. #100417. https://doi.org/10.1016/j.crm.2022.100417
16. Golding N, Hewitt C, Zhang P, Bett P, Fang X, Hu H, et al. Improving user engagement and uptake of climate services in China. Clim Serv. 2017;5:39–45. https://doi.org/10.1016/j.cliser.2017.03.004
17. Klemm T, McPherson RA. The development of seasonal climate forecasting for agricultural producers. Agric For Meteorol. 2017;232:384–399. https://do i.org/10.1016/j.agrformet.2016.09.005
19. Bruno Soares M, Dessai S. Barriers and enablers to the use of seasonal climate forecasts amongst organisations in Europe. Clim Change. 2016;137:89–103. https://doi.org/10.1007/s10584-016-1671-8
20. Ash A, McIntosh P, Cullen B, Carberry P, Smith MS. Constraints and opportunities in applying seasonal climate forecasts in agriculture. Aust J Agric Res. 2007;58(10):952–965. https://doi.org/10.1071/AR06188
21. Briley L, Brown D, Kalafatis SE. Overcoming barriers during the co-production of climate information for decision-making. Clim Risk Manag. 2015;9:41–49. https://doi.org/10.1016/j.crm.2015.04.004
22. Chisadza B, Mushunje A, Nhundu K, Phiri EE. Opportunities and challenges for seasonal climate forecasts to more effectively assist smallholder farming decisions. S Afr J Sci. 2020;116(1/2), Art. #4649. http://dx.doi.org/10.171 59/sajs.2020/4649
23. Muita R, Dougill A, Mutemi J, Aura S, Graham R, Awolala D, et al. Understanding the role of user needs and perceptions related to sub-seasonal and seasonal forecasts on farmers' decisions in Kenya: A systematic review. Front Clim. 2021;3, Art. #580556. https://doi.org/10.3389/fclim.2021.580556
24. World Meteorological Organization (WMO). Early warnings for all: Executive action plan 2023-2027. Geneva: WMO; 2023. Available from: https://library. wmo.int/doc_num.php?explnum_id=11426
25. Sánchez-García E, Rodríguez-Camino E, Bacciu V, Chiarle M, Costa-Saura J, Garrido MN, et al. Co-design of sectoral climate services based on seasonal prediction information in the Mediterranean. Clim Serv. 2022;28, Art. #100337. https://doi.org/10.1016/j.cliser.2022.100337
26. Steinke J, Ortiz-Crespo B, van Etten J, Borman GD, Hassena M, Kretschmer M, et al. Seasonal seed scenario planning: Co-design of a generic framework for matching seed supply and demand using seasonal climate forecasts. Clim Serv. 2023;32, Art. #100410. https://doi.org/10.1016/j.cliser.2023.100410
27. Bojovic D, Clair AL, Christel I, Terrado M, Stanzel P, Gonzalez P, et al. Engagement, involvement and empowerment: Three realms of a coproduction framework for climate services. Glob Environ Change. 2021;68, Art. #102271. https://doi.org/10.1016/j.gloenvcha.2021.102271
28. Dul J, Bruder R, Buckle P, Carayon P, Falzon P, Marras WS, et al. A strategy for human factors/ergonomics: Developing the discipline and profession. Ergonomics. 2012;55(4):377–395. https://doi.org/10.1080/00140139.201 2.661087
29. Carelsen CPR, Ncube B, Fanadzo M. Classification and characterisation of smallholder farmers in South Africa: A brief review. S Afr J Agric Ext. 2021;49(2):97–106. https://doi.org/10.17159/2413-3221/2021/v49n2a12821
30. Braun V, Clarke V. Thematic analysis. Washington DC: American Psychological Association; 2012.
31. Landman WA, Tadross M, Archer E, Johnston P. Probabilistic vs deterministic forecasts – interpreting skill statistics for the benefit of users. Water SA. 2023;49(3):192–198. https://doi.org/10.17159/wsa/2023.v49.i3.4058
https://doi.org/10.17159/sajs.2025/18998
AuthorS: Peter T. Jacobs1
Vandudzai Mbanda2
Sisonke Mtyapi1
AFFILIAtIoNS:
1Equitable Education and Economies, Human Sciences Research Council, Cape Town, South Africa
2Equitable Education and Economies, Human Sciences Research Council, Pretoria, South Africa
CorrESPoNDENCE to: Peter Jacobs
EMAIL: pjacobs@hsrc.ac.za
DAtES:
r eceived: 04 Nov. 2024
r evised: 09 June 2025
Accepted: 12 June 2025
Published: 11 Aug. 2025
hoW to CItE:
Jacobs PT, Mbanda V, Mtyapi S. Funding South Africa’s food and nutrition policy: Estimates for the 2018–2022 funding cycle. S Afr J Sci. 2025;121(7/8), Art. #20502. https://doi.org/10.17159/sajs.20 25/20502
ArtICLE INCLuDES:
☒ Peer review
☒ Supplementary material
DAtA AVAILAbILItY:
☐ Open data set
☐ All data included
☐ On request from author(s)
☒ Not available
☐ Not applicable
EDItorS:
Annchen Mielmann
Leslie Swartz
KEYWorDS:
food value chains, food assistance, funding gaps, food and nutrition policy
FuNDING: None
Funding South Africa’s food and nutrition policy: Estimates for the 2018–2022 funding cycle
Securing enough funds to roll out South Africa’s National Food and Nutrition Security Plan (NFNSP) has gained renewed momentum since 2017 when projections of cost to deliver on its outcomes were determined. Funding to implement the policy during the initial 5-year cycle (2018–2023) also involved identifying sources from which to finance actual policy actions as well as strategies to close funding gaps. Against the backdrop of global debates on food assistance financing, we used an elementary funding gap equation for a systematic calculation of the funds needed for NFNSP. To determine available funding sources, we built a unique data set based on historical spending information for 2018–2022. A key finding is that national and subnational government departments dominate funding sources for food and nutrition policy activities. Unlike poorer countries, non-state donors make ad hoc and smaller contributions, but this source of food and nutrition assistance is less accessible. Aggregation over all available funding sources reveals that authorities only met 50% of the Plan’s funding needs after 4 years and thus fell short of meeting its 2017 target. Our findings reinforce the case to urgently strengthen the principles, design and implementation systems for adequate food and nutrition policy spending.
Significance:
• In middle-income countries like South Africa, a holistic approach to financing food and nutrition policy is essential to achieve its constitutionally protected food rights and Sustainable Development Goals (SDGs) imperatives.
• Results and insights demonstrate the effective use of a straightforward method to document and monitor the financing of food and nutrition assistance in the absence of a standardised methodology.
• Conclusions guide innovations in anti-hunger activism grounded in evidence with benefits that cascade into intersecting policy domains.
• This article enriches thinking and practices in transformative social protection and equitable fiscal policy for higher human well-being outcomes.
Introduction
This article contributes to finding practical options to finance South Africa’s food and nutrition security plan based on costing targets that the government first developed in 2017. Compared to the country’s history of delayed and disjointed reactions to hunger, the 2017 National Food and Nutrition Security Plan (NFNSP) with its cost estimates heralds a shift in the right direction. This plan endeavours to better coordinate implementation across its diverse strategic objectives (SOs), a positive spin-off from the integrated approach which underpins the NFNSP. More importantly, it emphasises the need to secure enough funds to cover its estimated costs but stops short of identifying sources to finance the forecasted expenditure. Also absent from the NFNSP and previous studies is what amount of funding is likely to be secured from private donors, multilateral aid agencies and public finances in the fiscus. To help fill this knowledge gap, this article explains how to construct an integrated approach to determine funding gaps in the NFNSP and to identify potential sources to finance these gaps.
In 2013, the South African cabinet adopted a new food and nutrition security policy, thus heralding a step forward when comparing its content and operational vision to that in the previous policies it replaced.1 2 Comparisons of the 2013 National Policy on Food and Nutrition Security (hereafter referred to as the 2013 Policy) with the 2002 policy framework have highlighted compelling queries, such as questioning the intensity of grassroots participation in its development3 to its conceptual premises4-6. Older food policy frameworks, such as the 2002 Integrated Food Security Strategy and a chapter in the 2012 National Development Plan, were rooted in total farm output thinking. It reduced food security to the quantity of primary agricultural production in the country. However, crop and livestock outputs from South African farms are increasingly exported, thus negating presumptions that domestic agrofood outputs would automatically ensure adequate food for everyone who resides in the country.7 Food policy reduced to the quantity of crops and livestock produced within the borders of the country is unrealistic, one-sided and constricting.6 8 Furthermore, South African consumers eat foods that reach them through food system circuits that criss-cross the country, with food retailers often selling food imported from other continents.
By contrast, the conceptual thinking embedded in the 2013 Policy embraces a more comprehensive approach to overcoming hunger and malnutrition.2 Whilst the 2013 Policy underscores the need to produce and enable access to enough healthy food, it also prioritises food preparation; what people actually consume, the nutritional health outcomes of the right diets, and the roles of social protection also receive attention.6 9 Concerned with how to realise the food rights of people living in South Africa, the 2013 Policy reiterates the government’s obligations in achieving this constitutional right. State-financed social protection, which includes meal provision at public schools and other food delivery centres, has a vital role to play in this regard.10 Moreover, fiscal assistance to realise food and nutrition rights cannot overlook any segment of food value chains, such as crop and livestock farming, agro-processing in food manufacturing, local and global food trade or consumption, coupled with nutritional benefits for consumers.
2025 https://doi.org/10.17159/sajs.2025/20502
The 2013 Policy was jointly tabled by the Departments of Social Development and Agriculture, Land Reform and Rural Development – two departments with core mandates that usually concentrate on opposite extremes of food value chains. The Department of Agriculture, Land Reform and Rural Development oversees the full farming cycle that includes marketing and trade of farm outputs, whereas the Department of Social Development delivers social safety nets, such as suites of cash grants and food parcels or vouchers. Regular and multilevel sub-national interactions among government departments involved in different food sector activities signal the possibility for a convergence towards a unifying approach to food and nutrition security, with the potential to eliminate the inefficiencies of fragmented operations among stakeholders who ought to cooperate.5 Indeed, interdepartmental collaboration at the policy design level began to pave the way for institutionalised cooperation among state actors in implementing the 2013 Policy.2 10 Information gathered from key informant interviews with relevant government officials, non-state organisations and multilateral donors highlighted that decision-makers and implementers also started identifying the 2013 Policy financing needs and how to pay for them from state and non-state sources.
Aliber and Hall11 assembled South African public spending information on ‘food availability’ that sheds light on how much the state invests in crop and livestock farming. The Aliber–Hall study updates and extends a previous publication in an edited volume that examined fiscal investments in southern Africa in accordance with the 2003 Maputo Declaration on agricultural assistance.12 Although this collection of studies documented the amount and categories of fiscal allocations for food output (or bolstering the capacity to produce enough staple foods), almost all countries fell short of meeting their 2003 commitments.13 14 These studies prioritise budgetary support for household subsistence and smallholder farmers, and are restricted to the production dimension of food and nutrition security. In 2013, South Africa’s National Treasury commissioned a Performance and Expenditure Review aimed at assessing the ‘value for money’ from state spending on nutrition and food security for children under 5 years. Despite the technical mapping of spending along an input-activity-outcome cycle of project programming, substantively, the review did not go beyond costing nutrition interventions15 from a health outcome view for a vulnerable sub-population.
This article contributes to research on feasible practices for delivering better food and nutrition outcomes for all people in South Africa. We argue that pro-poor solutions to hunger and greater responsiveness of policy to local realities must start from a holistic food value chain viewpoint. Since the nascent conceptualisation of this new policy, food policy stakeholders have acknowledged that getting implementation right hinges on securing enough funding to operationalise the 2013 Policy. In 2017, the efforts to translate the 2013 Policy into a funded implementation plan culminated in forecasted costs over an initial cycle for 2018–2023.10 The government contracted DNA Economics, a private consultancy, to estimate the likely costs of the NFNSP for the first 5-year cycle. At that time, total implementation costs of the 2013 Policy for the 5-year period amounted to ZAR86.6 billion, but this costing exercise did not address tough questions on from where the money would be sourced.
The research questions addressed by this study are: If the state is the source of funding, then how will this be divided between national and subnational spheres of government? What are the implications for information systems and mechanisms to monitor and detect a shortfall or surplus in spending on food and nutrition activities to proactively mitigate funding gaps? What do learnings about funding to realise the aspirations of the 2013 Policy for the 2018/2019–2022/2023 period mean for costing and spending in future?
Financing food and nutrition assistance: Purposive global synthesis
This section situates South Africa’s policy-induced investments in food and nutrition assistance in a larger global context. An overarching question guiding this rapid and selective synthesis is: what insights can be harvested and distilled from global studies on financing food and nutrition policy for impactful rollout? Any systematic comparison of South Africa’s food and nutrition policy financing patterns with worldwide experience
will require the same criteria and measures as a reference point. Using a standardised and uniform yardstick is sensible but also foundational in testing the usefulness of comparative methods. Without such a yardstick, similarities and differences detected between South African data and that for comparable countries are highly likely to lack consistent and reliable explanations. Globally, explanatory inconsistencies across countries arise from the absence of a coherent database with indicators on funding for food and nutrition that will pass basic methodological criteria and tests at present.9 16 17
Even though an appropriate cross-country data set does not exist, studies to close this gap have progressed along exploratory tracks, with crucial lessons for South Africa. Conceptually, methodologically and technically, extant investigations differ in terms of the analytical principles that underpin them. These studies exploit purposeful and discretionary techniques that balance the need for funds with the potential or available funding sources. As a minimum, a comparative analysis demands ingredients such as reliable and up-to-date data on funding with meaningful and compatible variables measured in the same way for a large enough number of countries. Despite these gaps, ad hoc measurements of financing needs and resources continue to evolve. Analysts have opted for different definitions of what is being monitored and measured, and then customise the empirical methods in line with the content and scope of variables and underlying information.7 9 16 18
The financing of food and nutrition policies straddles multiple categories, such as the direct costs of nutritious food, the costs of administrative governance and grassroots delivery, and an integrated data management system that is fit for purpose.17 While the monetary value of providing consumable items is a major and dominant element of food aid and anti-hunger interventions, it has been acknowledged as but one category of financing food and nutrition assistance.18 Lentz and Barret16 show that food and nutrition policy goals, coupled with the food needs of the vulnerable when hunger emergencies break out, drive the demand for public investment in food and nutrition safety nets. In addition to insights drawn from these case studies, a quick overview of how India and Ghana have dealt with similar food and nutrition funding questions is particularly instructive.
In Rajasthan state, India, Ghai et al.19 examined funding requirements for adequate nutrition against available resources. This was done by conducting a gap analysis through comparing the costs of core nutrition programmes in Rajasthan with funding available for nutrition-specific programmes from state plans and budgets. The analysis found a 69% funding gap in the financial resources needed for fully scaling up the 13 fundamental nutrition interventions in 2016–2017. In addition, Ghai et al.19 established that government financing of nutrition interventions had been steadily declining, with a 3% reduction from 2014–2015 to 2016–2017. This resulted in the funding gap growing to 69% in 2016–2017, from 66% in 2014–2015.
Pomeroy-Stevens et al.20 assessed how nutrition is prioritised and funded in Uganda through the Uganda Nutrition Action Plan (UNAP) between the 2013–2014 and 2014–2015 fiscal years. They pointed out that data on expenditure are not always there for all funding means. As a result of gaps in data, it was not possible to identify and compare funding between projects in the government’s budget and non-state actors. Pomeroy-Stevens et al.20 also found that funding allocations for the UNAP seemed to be more than adequate for the projected costs for 2014 to 2015 as they were about 10 times the planned cost for the year. However, they observed that funding allocations did not always align with the priority for the respective objective in the costing exercise. A comparison of funding allocations with the cost requirements of the five UNAP objectives showed some discrepancies in relative proportions.
Coile et al.21 studied the national multisectoral nutrition plans of 26 countries to assess their effectiveness when planning and implementing nutrition interventions. Alongside how to implement and manage the multisectoral nutrition plan in sampled countries, the review also zoomed in on financial issues such as budgets and costs for the years 2014 through 2020.21 They found that significant gaps were common across the reviewed plans, including not properly designating each
https://doi.org/10.17159/sajs.2025/20502
nutrition action among responsible agencies, inadequate consideration and planning for risks in the implementation plan and required mitigation strategies, lack of specific mechanisms to organise and manage research, and lack of financial gap assessments and specified procedures to track allocation of financial and other resources. Of the 26 multisectoral nutrition plans assessed by Coile et al.21, only 7 estimated the funding gaps for the costed interventions, 6 described the criteria for allocating resources, and 4 included the mechanism for financial tracking, including allocations and expenditures as well as state and non-state funding.
One standout learning from this quick and purposeful synthesis is that low- and middle-income countries wrestling with high levels of food and nutrition insecurity often lack the fiscal space to provide food assistance to hungry populations.7 14 Poor countries that experience protracted food deficits coupled with tight fiscal constraints usually depend on external aid to meet their food and nutrition needs. Direct food assistance is one form of this external aid delivered by agencies such as the World Food Programme and private donors mainly based in Europe and North America. Food aid can also be in the form of financial donations, in which case the transferred money is conditional on its exclusive use to buy and distribute food. External development assistance, whether in the form of ringfenced money or not, is a prominent source to help realise the Sustainable Development Goals.18 Yet upper-middle-income countries like South Africa may not always qualify for multilateral or private financial donations, which are increasingly scarce and stringently allocated on the basis of narrow economic criteria. Developing countries in this group, however, also battle to stretch constrained public budgets across competing human well-being priorities in the context of growing public debt burdens, fiscal deficits, macroeconomic crises and sociopolitical conflicts that further undermine their limited capacity to fund all components of food and nutrition assistance.7
Guidance from emergent international evidence suggests that South Africa’s purposeful approach to food and nutrition financing aligns with current trends and practices. While authorities identify sources to adequately fund the implementation of policies and plans, it is also crucial to document experiences and build data platforms for the holistic monitoring and improvement of the food and nutrition situation in the country.
Funding data extraction, assembly and analysis methods
Estimating the gap in funds for the implementation of food and nutrition activities tied to the 2013 policy is a complex task because the data are scattered across hard-to-access systems of distinct government departments. Departmental and provincial expenditure estimates published by National Treasury are a traditional source of information about public funding for food and nutrition security. This source broadly classifies funding items for departmental sub-programmes but reports highly aggregated fiscal allocations. These departmental expenditures do not show spending on activities that can be linked across different state and non-state funding sources. Even though such aggregated fiscal spending information is publicly accessible, reported figures do not align with the costs per strategic objective of the NFNSP. To overcome the limitations of data in the public domain, we extracted spending on food and nutrition activities from administrative registers that state and non-state stakeholders maintain. Categories to organise the data ranged from direct production and consumption assistance to administrative operations and food system metrics that match the NFNSP’s strategic objectives.
Gaps in funding the NFNSP refer to shortfalls or surpluses in available funds relative to the projected implementation costs of food and nutrition activities. Framing this in elementary accounting terminology means that a funding gap is the difference between forecasted costs and allocated or spent funds. This study uses the high-level implementation cost framework of the NFNSP and projected monetary values for 2018–2023, but does not recalculate the 2017 financing targets. To construct the implementation costing framework, government officials and DNA Economics consultants started from the 2013 food and nutrition policy, translating it into specific outcomes, deliverables and activities. In the
context of the framework, they then determined the operational costs tied to activities for the specific deliverables mentioned above.10
Data on funds actually spent on food and nutrition activities were gathered from expenditure databases of state and non-state stakeholders. Additional information was gathered through key informant interviews with relevant officials from government, multilateral donors and non-state organisations. It is important to highlight that the interviews, conducted in line with the Human Sciences Research Council ethical standards and clearance requirements, were instrumental in overcoming the problem of accessing the data mentioned above as well as understanding the data collected.
The cost of the implementation plan was done at different levels of aggregation, layered in a base-to-apex pyramid. The overarching cost of the plan at the apex can be traced to lower levels that display more detailed costing information. Base-level cost estimates show the highest level of detail and disaggregation. It comprises micro-level costs to engage in activities (like food and nutrition awareness campaigns) and deliver outputs (such as meals served to school children, smallholder farmers’ production assistance, data sets). The most meaningful mid-level aggregation is costing for each Strategic Objective defined in the original plan.
Planned implementation costs, estimated for disaggregated variables, do not perfectly match the expenditures of stakeholders on 2013 Policy priorities. The main reason behind this mismatch is the non-existence of a decentralised spending monitoring tool with indicators that correspond with the costing dimensions captured in the 2017 Plan. If a proper spending monitoring tool had existed, it would have helped to document the flow of funds in real time. Over the middle range of aggregation, however, expenditure categories are well defined and correspond with ‘variables’ in the 2017 costed plan, as detailed in the next section.
Past expenditure is a useful benchmark for the funds that stakeholders are likely to have available in future, assuming that everything else remains constant. We exploit the benefits of historical spending data, processed and audited spending.
Information on the funds that stakeholders have committed in support of food and nutrition security is not stored in one centralised data repository but kept in reporting systems of multiple agencies. In our study, we accessed and combined documented expenditures from diverse stakeholders.
A funding gap [FG] is simply the difference (shortfall) between a desired or planned spending target and actual expenditure. In this study, the goal was to estimate the FG for each National Food and Nutrition Security (NFNS) Plan Strategic Objective (SO) as well as the sum total for all SOs. A simplified way to express the aggregate funding gap (FGTA) is:
YT XT = FGTA
Equation 1
• where YT is the DNA Economics’ target expenditure in ZAR for all years (subscript T = 5, or (τ1, , τ5)), with τ denoting a year and T the sum of consecutive years;
• where XT is the actual state and non-state expenditure in ZAR for all years (subscript T = 5);
• where superscript A denotes the aggregate figure for all SOs (A = α1, , α7 = ∀ α).
Given the value of YT, then as τ → T, FGTA depends on the value of XT However, the aggregate value of XT is as important as its composition ∀ τ, made up of diverse state and non-state sources, which can be defined as:
XT ≡ XTS + XTNS
Equation 2
• where S includes all expenditures of the state sector for τ1, , τ5 or ∀ τ
• where NS includes all expenditures of the non-state sector for ∀ τ
Following the aggregate expenditure relations outlined above, the funding gap per strategic objective (superscript: α1, , α7 or ∀ α) can simply be written as:
3
• where α1 denotes SO#1, and so forth ∀ α
2017 funding needs: DNA costing estimates
When DNA Economics initially costed the NFNSP, they looked at the cost drivers and offered best “guestimates” on quantifiable benefits, such as support for smallholder food production and delivering nutritious food to school children. In addition to the direct nutritional and health benefits, they also attempted to quantify cost savings due to the reduced prevalence of lifestyle diseases that flow from nutritious and healthier diets.
The DNA model fits costing parameters for the inputs, activities, outputs and outcomes tied to each strategic objective. To populate the DNA costing model with relevant monetary data, the research team conducted in-depth interviews and workshops with officials who implement and manage the food and nutrition mandates of government departments and non-state stakeholders.10 The framework defined priorities to implement the NFNSP and then estimated what it would cost to execute these activities, including assumptions and forecasted costs, by calculating the cost to host a meeting to coordinate the Plan (SO#1) or distribute nutrition supplements and food to women and babies through local clinics (SO#4), as summarised in Table 1
Table 1 sums up that, in 2017, DNA Economics and Cornerstone estimated that the overall costs of implementing the Plan ( YT) amounted to ZAR86.8 billion over the 5-year period from 2018/2019 to 2022/2023. However, not all the SOs contribute equally to the Plan’s overall costs. For example, SO#2 (ZAR68.8 bn), SO#3 (ZAR11.1 bn) and SO#4 (ZAR7 bn) account for 99.16% of the total costs, whilst the other three objectives contribute just 0.84%.
The reasons for the costs per strategic objectives being so uneven differ but predominantly arise from the higher priority given to direct farm-to-fork food value chain assistance and coordination.10 As is evident
table 1: Cost estimates per Strategic Objective (SO)
SO#1: Multisectoral governance and leadership structure
SO#2: Inclusive local food value chains
SO#3: Targeted social protection measures and sustainable livelihoods
SO#4: High-impact nutrition interventions
SO#5: Informed food and nutrition decisions (Communications Strategy)
SO#6: NFNSP M&E Unit (Data Platforms)
Source: DNA Economics Study10
from the descriptors in Table 1, summarised from the implementation costing framework, it costs more to deliver on these priorities. Projections based on historical spending patterns on farmland access, assistance to smallholder crop and livestock farmers, school feeding schemes and food distributed by nutrition programmes, underscore the need for a higher weight on these costs. Direct food and nutrition provision, the core purpose of the NFNSP, is understandably more expensive (or allocated the bulk of available resources) than collecting data and maintaining food and nutrition databases coupled with coordinating multiple operations in practice.
Funding gaps: Systematic calculations
2018/2019–2021/2022 fiscal spending
The administrative database on public spending secured from National Treasury allows for estimates that are closer to the NFNSP’s SOs because the database stipulates the primary objective of itemised expenditures. Strengths of this data set include the separation of programme management spending from public funding to support the food system in the provinces and at a national level.
In Table 2, there is no information on spending by the Department of Planning, Monitoring and Evaluation, the Office of the Deputy President, and the Offices of Premiers towards the establishment of food and nutrition security councils. The NFNSP estimated a cost of ZAR18.76 million over the period 2018/2019 to 2021/2022 towards the establishment of the multisectoral food and nutrition security councils. This is probably due to the lack of a reporting template to document the spending of stakeholder departments in the Plan’s administration costs.
The Department of Agriculture, Land Reform and Rural Development is the department in charge of everything under SO#2. With this emphasis on agrofood value chain development, this department committed 60% of the Comprehensive Agricultural Support Programme grant to the promotion of smallholder value chain participation through accessing more profitable agrofood markets.2 Closer scrutiny of the Department of Agriculture, Land Reform and Rural Development’s strategic documents and annual reports indicated that Japan International Cooperation Agency supported aspects of SO#2, reflected in the non-state funding sources in Table 3
Establish national and sub-national structures to coordinate implementation; operationalise this through national, provincial and district governance structures. Participating government structures should absorb implementation costs. 19
Support smallholder production capacity in key agrofood commodities, including costs of land acquisition, farming inputs and training; operationalise through certification of smallholder farmers; ensure enough qualified extension officers; cooperate with non-state actors where necessary and feasible. 67 879
Establish efficient information systems for full coverage of child support grants and provision of meals through early childhood development centres; quantify the number of people being provided with meals through community nutrition and development centres and the National School Nutrition Programme; strengthen inter-departmental data collection, storage, analysis and use (between the Departments of Social Development, Basic Education and Health).
11 156
Deliver targeted nutritional assistance across the life cycle, with a strong focus on health departments, with an emphasis on HIV/AIDS patients. 7025
Develop a food and nutrition communication strategy, coupled with awareness-raising circulars targeted at low-income consumers; use well-integrated communication and media platforms for maximum geographic reach. 704
Establish a dedicated Food and Nutrition Security Monitoring and Evaluation (M&E) Unit within the Department of Planning, Monitoring and Evaluation focused on information integration across state and non-state agencies; collaborate with StatsSA and other M&E directorates. 24
The Departments of Health, Home Affairs, Basic Education and Social Development drive SO#3. The figure reported in Table 2 falls short of the cost estimated by DNA Economics for the 5-year period from 2018/2019 to 2022/2023. Improved access to high-impact nutrition for vulnerable groups makes up the bulk of costing for SO#4.
The Department of Planning, Monitoring and Evaluation has developed an advocacy and communication strategy with the assistance of the United Nations Children’s Fund (UNICEF), but this advocacy and communication strategy has not been implemented significantly. Available information shows that the only funding towards this SO#5 subtheme is from UNICEF, totalling ZAR6.07 million over the period 2018/2019 to 2021/2022. Therefore, the funding gap for this strategic objective is equal to ZAR619.53 million. The Department of Basic Education spends a proportion of the National School Nutrition Programme (NSNP) Grant towards nutrition education (including deworming and hygiene practices) in schools. Specifically, according to the NSNP Grant framework, the Department was allowed to spend a maximum of 0.5 per cent in 2018, 0.4 per cent in 2019 and 2020 and 0.2 per cent in 2021 and 2022.
Nevertheless, nutrition education in early childhood development centres has not yet been implemented as the process of migration of the responsibility for early childhood development centres from the Department of Social Development to the Department of Basic Education is still underway. Other nutrition education programmes that aim to create awareness about the importance of healthy eating and obesity among consumers include the National Nutrition Week and the National Obesity Week, coordinated by the Department of Basic Education, Department of Health and Department of Social Development, in collaboration with other players, namely Nestlé, Milk Producers’ Organisation (MPO) and
Consumer Education Project (CEP) of Milk South Africa. However, the costs of these campaigns are not available.
SO#6 entails, among other tasks, harvesting food and nutrition security indicators from national surveys (such as the General Household Survey), including a customised Food and Nutrition Security survey. An amount of ZAR45 million from the Ilima/Letsema Programme was transferred to the Human Sciences Research Council to conduct the National Food and Nutrition Security Baseline Assessment for the food and nutrition security survey of South Africa’s Vulnerability Assessment Committee.
Earlier iterations of the NFNSP were confined to six strategic objectives without any explicit provision for entrepreneurship across agrofood value chains. Real and/or potential contributions of small-scale entrepreneurial activities under the auspices of the Department of Small Business Development were thus excluded from the 2018–2023 costing of the national plan. The introduction of Pillar 7 (SO#7) elevates the role of entrepreneurship through connecting the implementation and delivery of the NFNSP with the Small, Medium or Micro Enterprise Support Plan. Relative to the scope of funding needs, enterprise loans and subsidies cover a small amount to purchase some fixed assets (like infrastructure and machinery) as well as pay for operational activities.
With this snapshot of spending history extracted from administrative databases, exploratory interviews also probed the adequacy of funds relative to what is needed, expenditure in the pipeline and the certainty of access to available sources of finance beyond 2023. Interviews proved invaluable to interpret past spending patterns and think through the prospects for financing the Plan in the period ahead.
table 2: Spending per Strategic Objective (SO), excluding provincial food and nutrition spending (ZAR’000), 2018/2019–2021/2022
SO#5:
SO#6:
aDepartment of Social Development spending database (see Supplementary material) bSEFA funding approved for food sector entrepreneurial ventures
table 3: Donor spending on food and nutrition security interventions (ZAR), 2018–2022
Interviewees from government departments also confirmed receiving support from multilateral donors and non-state organisations. Donor support consists of a mix of administrative assistance, distribution of food and nutrition supplements to vulnerable populations, the promotion of healthy eating, and dissemination of statistical information about food and nutrition.
While donors use different technical categories of their support, their accountability and reporting systems require that they document the monetary value of all donations. Categorising these investments in terms of the Plan shows that donors render assistance in SO#4 (high-impact nutrition interventions), SO#5 (informed food and nutrition decisions across the life cycle) and SO#6 (data management and monitoring and evaluation).
Table 3 shows that the total contributions from non-state funding sources amounted to ZAR28.2 million, which is relatively small in relation to financing needs and resources for all the Strategic Objectives in the Plan.
2018/2019–2021/2022 subnational spending
The NFNS Policy and Plan recognise the necessity for subnational coordination and implementation of food security programmes because hunger is unevenly distributed across different localities. Targeted food and nutrition assistance usually combines food poverty status with its prevalence in a province, municipality or town. Localities with higher numbers of hungry people should also receive a higher proportion of food assistance funding, especially funding allocated to national and provincial government budgets.
Table 4 summarises the public funding given to provinces to finance their food and nutrition activities. Provinces received ZAR35.2 billion for food and nutrition activities from 2018/2019 to 2021/2022. Figures include transfers based on government’s equitable share formula and conditional grant transfers for the delivery of services such as food assistance to vulnerable populations. The NSNP is an example of such transfers and makes up 88% (±ZAR30.9 billion) of the total spending for this period.
Clearly, subnational government spending on food and nutrition activities cannot be excluded from resources available to cover the 2017 cost estimates. In light of the foregoing discussion on fiscal transfers to provinces, caution must be exercised when determining the funds available to implement the NFNSP. It is important to avoid double counting and apply the rules of equitable shares and conditional grant transfers, especially the NSNP.
Table 5 summarises the overall funding gap and the gap for each Strategic Objective, following the gap Equations 1 and 2. Itemised expenditures in National Treasury’s database (which is not in the public domain) make it possible to trace food activity spending and connect it to spending activities for each Strategic Objective. Careful analysis and piecing together expenditure on food and nutrition items reveal that the state has actually spent ZAR39 billion on Plan-related priorities since 2017. Compared to the 2017 cost target, this leaves a funding gap of ZAR47.6 billion. This includes provincial spending distributed through equitable share and conditional grant transfers to provinces.
table 4: Public spending on food and nutrition activities (ZAR’000) by provincial governments (excluding the National School Nutrition Programme; NSNP), 2018/2019–2021/2022
Source: National Treasury (2018/2019–2021/2022)22
table 5: Funding gap of planned versus actual spending per Strategic Objective SO (ZAR’000), 2018–2022
aEntrepreneurial Skills in Food and Nutrition Security Programme (expression of entrepreneurship in delivery mechanisms is a shared responsibility between state and non-state actors)
Funds that subnational state structures and non-governmental agencies have spent do not form part of Table 5. Provincial spending on food and nutrition security activities not counted in equitable share or conditional transfers (to avoid counting the same amount in both national and provincial expenditures) amounted to ZAR4.3 billion as reported in Table 4 Expenditures of provinces marginally cut the funding gap (FGTA = YT XT) = ZAR43.3 bn, which means that, since 2018, about 50% of the needed resources was secured.
Given the initial costing forecasts of DNA Economics, strategic objectives incorporate activities that involve cooperation and spending from different stakeholders. The layered presentation of actual expenditures on food and nutrition activities highlights the uneven contributions to the funding needs of the NFNSP as well as uneven funding gaps per Strategic Objective. Consider the zero expenditures recorded for the functionality of the national and sub-national coordinator structures (known as SO#1). The resulting deficit, ZAR18.76 million, did not stifle the operations of these structures because participating stakeholders evidently absorbed these costs. It was not possible to verify or corroborate actual expenditure on this vital administrative function, pointing to gaps and limitations in cost and expenditure monitoring systems that may also account for deficits (or surpluses) in other Strategic Objectives.
Starting from 2017, the estimated costs for an initial 5-year cycle (2018–2023) of the NFNSP ( YT) amounted to ZAR86.8 billion. Whilst resources exist in the state and non-state sectors to cover the financial needs of the NFNSP for the period 2018–2023, authorities only met 50% of the Plan’s funding needs. Options to cover the shortfall (FGTA) of ZAR43.3 bn require that coordinators of the NFNSP rethink its conceptual design and how to finance its effective and efficient execution.
The size of the FGTA for this initial costing cycle means the assumption among decision-makers that enough public funding should be available to cover the forecasted spending lacks reliable evidence. Insights from selected case studies and a systematic funding gap analysis to track funding flows have revealed that funding South Africa’s food and nutrition policy interventions almost exclusively relies on national and provincial budgets. Expenditures of multilateral donors and other non-state agencies account for less than 5% of the NFNSP spending targets, restricted to costs of administration and awareness campaigns.
The use of our systematic framework and method to estimate the overall funding gap presupposes that forecasted costs exist. Furthermore, this approach also caters for calculating funding surpluses and deficits for each Strategic Objective which captures the envisaged ways of streamlining the operations of food and nutrition support in practice. An exclusive focus on the overall funding needs of the NFNSP should avoid inferences that a deficit Strategic Objective can be balanced against one with a surplus – a plausible interpretation given the aggregation method hardwired into the 2017 implementation cost estimates. In practice, however, funding gaps per Strategic Objective cannot be written off against each other, even though the Strategic Objectives positively complement each other in terms of substance and scope. For example, direct nutrition assistance (especially through the school nutrition scheme) in SO#4 overlaps with publicity campaigns for better food and nutrition knowledge in SO#5. However, covering the deficit of SO#5 (FGTα5) of ZAR696.3 m with the surplus of SO#4 (FGTα4) ZAR22.9 bn is not feasible without the approval and willingness-to-pay by contributing stakeholders. Similarly, loans and subsidies ringfenced for smallholder farmers through SO#7 will require institutional agreements to draw on this surplus to cover the SO#2 deficit for food value chain funding needs.
Conclusion
We sought to determine the available funding sources to implement the Strategic Objectives of South Africa’s NFNSP by building a unique data set based on historical spending information for the 2018–2022 funding cycle. We used an elementary funding gap equation for a systematic calculation of the funds needed for NFNSP. We assembled fragmented food spending information and explored how state and non-state sources can be tapped to meet these funding needs. Our intuitive estimation framework concisely relates forecasted costs with actual expenditures, enabling a step-by-step calculation of funds that state and
non-state agencies spend on food and nutrition activities. Similar to the ad hoc and tailored approaches to financing food and nutrition policies internationally, this purposeful approach can be improved through ongoing application and testing. Using this approach to probe historical data, assembled from the administrative databases of National Treasury, different government departments with mandates to provide food and nutrition assistance and the donor community, has proven helpful to identify sources to finance the NFNSP in future planning cycles.
While the aspiration of adequate food and nutrition for all, entrenched in the 2013 policy and operationalised in the 2017 plan, is laudable, it is increasingly hard to achieve without a proactive approach to resourcing the NFNSP. Mobilising enough resources to finance all Strategic Objectives over the first 5 years of implementing the NFNSP remained an afterthought, yet it should have been resolved at the time of the initial costing estimates. Subsequent cycles of costing and funding systematic food and nutrition security interventions can be streamlined with a quarterly implementation cost monitoring system across national and sub-national coordination structures. Coordination meetings of food and nutrition authorities need to adopt and regularly update a clear outcomes-driven plan and monitoring template in which the use of secured funds is documented. In future, it will be crucial to institutionalise the coordination of Strategic Objectives in the mandates of different government departments responsible for the NFNSP that allow it to periodically revisit and improve the translation of the NFNS Policy into the National Plan to better inform future funding needs and resourcing decisions. Without a comprehensive food value chain perspective of fiscal support for food and nutrition policy, its funding imperatives will continue to elude the South African government.
Acknowledgements
Officials in government departments and the Food and Agriculture Organization (FAO) of the United Nations in South Africa supported access to unique administrative data not in the public domain. We acknowledge the expertise of the Human Sciences Research Council subject librarian, Ms Shingi Muzondo, who assisted with finding appropriate literature at short notice. We appreciate the guidance received from the anonymous editor and reviewers to improve the narrative. We acknowledge these contributions but remain solely responsible for the analysis, conclusions and any remaining errors.
Data availability
The data are not available. We obtained primary data from National Treasury with their permission to use it for our research but not to share input records with third parties.
Declarations
We have no competing interests to declare. We have no AI or LLM use to declare. Ethical clearance was provided by the Human Sciences Research Council’s Research Ethics Committee (protocol no. REC 10/24/11/21).
Authors’ contributions
P.T.J.: Conceptualisation, methodology, investigation, sample analysis, formal analysis, validation, data curation, writing – the original draft, writing – review and editing. V.M.: Conceptualisation, methodology, investigation, sample analysis, formal analysis, validation, data curation, writing – the original draft, writing – review and editing. S.M.: Conceptualisation, methodology, investigation, sample analysis, formal analysis, validation, data curation, writing – the original draft, writing –review and editing. All authors read and approved the final manuscript.
r eferences
1. Government of South Africa. The national policy on food and nutrition security for the Republic of South Africa. Government Gazette,No. 37915, 22 August 2014. Pretoria: Government of South Africa; 2014.
2. Parliamentary Monitoring Group (PMG). National food and nutrition security implementation plan. Committee Meeting Proceedings [webpage on the Internet]. 2017 November 14 [cited 2018 Nov 08]. Available from: https://pm g.org.za/committee-meeting/25488/
3. Pereira L, Drimie S. Governance arrangements for the future food system: Addressing complexity in South Africa. Environ Sci Policy Sustain Dev. 2016;58(4):18–31. https://doi.org/10.1080/00139157.2016.1186438
4. Hendriks S. Food security in South Africa: Status quo and policy imperatives. Agrekon. 2014;53(2):1–24. https://doi.org/10.1080/03031853.2014.915468
5. Termeer C, Drimie S, Ingram J, Pereira L, Whittingham MJ. A diagnostic framework for food system governance arrangements: The case of South Africa. NJAS - Wageningen J Life Sci. 2018;84:85–93. https://doi.org/10.10 16/j.njas.2017.08.001
6. Jacobs P, Nyamwanza A. Stronger policy coordination for better food and nutrition security outcomes. Pretoria: HSRC; 2020. https://repository.hsrc.ac .za/handle/20.500.11910/15229
7. FAO, IFAD, UNICEF, WFP, WHO. The state of food security and nutrition in the world 2024: Financing to end hunger, food insecurity and malnutrition in all its forms. Rome: FAO; 2024. https://doi.org/10.4060/cd1254en
8. Drimie S, Ruysenaar S. The integrated food security strategy of South Africa: An institutional analysis. Agrekon. 2010;49(3):316–37. https://doi.org/10.10 80/03031853.2010.503377
9. Marivoet W, Becquey E, Van Campenhout B. How well does the food consumption score capture diet quantity, quality and adequacy across regions in the Democratic Republic of the Congo (DRC)? Food Sec. 2019;11:1029–1049. https://doi.org/10.1007/s12571-019-00958-3
10. DNA Economics. NFNS plan costing chapter (Report Commissioned by the Department of Planning, Monitoring and Evaluation). Pretoria: DNA Economics; 2017.
11. Aliber M, Hall R. Support to smallholder farmers in South Africa: Challenges of scale and strategy. In: Jacobs P, editor. Equitable rural socioeconomic change: Land, climate dynamics, and technological innovation. Cape Town: HSRC Press; 2019. p. 45–60.
12. Aliber M, Hall R. The case for re-strategising spending priorities to support small-scale farmers in South Africa. In: Nyagah L, editor. Seeds of growth: Financing smallholder farming in southern Africa. Cape Town: Institute for Democracy in South Africa; 2011. p. 67–82.
13. Nyagah L, editor. Seeds for growth: Financing smallholder farming in southern Africa. Cape Town: Institute for Democracy in South Africa (IDASA); 2011.
14. African Development Bank (AfDB). Feed Africa: Strategy for agricultural transformation in Africa 2016–2025 [document on the Internet]. c2016 [cited 2024 Aug 14]. Available from: https://www.afdb.org/fileadmin/uploads/afdb/ Documents/Generic-Documents/Feed_Africa-_Strategy_for_Agricultural_Tra nsformation_in_Africa_2016-2025.pdf
15. National Treasury of South Africa. Nutrition and food security for children under five years old: 2015 – Performance and expenditure review (PER), health sector. Commissioned Research Report (Cornerstone Economic Research and consultants). Pretoria: National Treasury; 2015.
16. Lentz EC, Barrett CB. The economics and nutritional impacts of food assistance policies and programs. Food Policy. 2013;42:151–163. https:// doi.org/10.1016/j.foodpol.2013.06.011
17. United Nations (UN). Financing United Nations catalytic action to ‘rescue’ the Sustainable Development Goals: 2021 annual report. Joint SDG Fund [webpage on the Internet]. c2021 [cited 2023 May 21]. Available from: https ://annualreport.jointsdgfund.org/2021-financing-united-nations-catalytic-act ion-to-rescue-the-sustainable-development-goals/
18. Swinnen J, Kosec K. The road to resilience: Rethinking responses to food crises. In: International Food Policy Research Institute 2023 global food policy report: Rethinking food crisis responses. Washington, DC: International Food Policy Research Institute; 2023. https://doi.org/10.2499/9780896294417
19. Ghai K, Rana Y, Ahmad N, Clift J. Nutrition financing in Rajasthan: Trends and gaps in 2016–17. Rajasthan: Results for Development Institute (R4D); 2016. Available from: https://r4d.org/wp-content/uploads/Rajasthan-Nutrition-Finan cing-Policy-Brief-2016-17.pdf
20. Pomeroy-Stevens A, D‘Agostino A, Adero N, et al. Prioritizing and funding the Uganda nutrition action plan. Food Nutr Bull. 2016;37(4_suppl):S124–S141. https://doi.org/10.1177/0379572116674554
21. Coile A, Wun J, Kothari MT, Hemminger C, Fracassi P, Di Dio D. Scaling up nutrition through multisectoral planning: An exploratory review of 26 national nutrition plans. Matern Child Nutr. 2021;17(4):1–13. https://doi.org/10.111 1/mcn.13225
22. National Treasury of South Africa. National and provincial food and nutrition expenditure (electronic public spending, audited); 2018/19–2021/22. Pretoria: National Treasury; 2023.
https://doi.org/10.17159/sajs.2025/20502
AuthorS: Scott Drimie1,2 Julian May3 4
AFFILIAtIoNS:
1Division of Human Nutrition, Department of Global Health, Faculty of Medicine and Health Sciences, Stellenbosch University, Cape Town, South Africa
2Southern Africa Food Lab, Stellenbosch, South Africa
3DSI-NRF Centre of Excellence in Food Security, University of the Western Cape, Cape Town, South Africa
4UNESCO Chair in African Food Systems, University of the Western Cape, Cape Town, South Africa
CorrESPoNDENCE to: Scott Drimie
EMAIL: scottdrimie@mweb.co.za
DAtES:
r eceived: 28 June 2024
r evised: 20 May 2025
Accepted: 02 June 2025
Published: 11 Aug. 2025
hoW to CItE:
Drimie S, May J. A learning journey approach to food security in a South African foodshed. S Afr J Sci. 2025;121(7/8), Art. #19005. https:// doi.org/10.17159/sajs.2025/19005
European Union’s Horizon 2020 (grant no. 862555), South African National Research Foundation (UID: 91490, UID: 134109), ERA-Net Cofund FOSC (grant no. 862555)
A learning journey approach to food security in a South African foodshed
Despite South Africa’s relative wealth and positive food balance at a national level, the consequences of the food system include severe malnutrition, unviable agricultural production methods, and stark disparities. Resolving this paradox cannot be accomplished through conventional top-down policymaking, planning and scientific inquiry, because there is no agreement on the cause of the problem, there are no clear solutions, and there are multiple stakeholders and conflicting interests. ‘Learning journeys’ – a participatory process and action research method which reveals systemic issues through direct experience of a local environment – may offer one option to address this dilemma. A series of learning journeys, designed and facilitated in the Western Cape Province of South Africa, have shown the benefit of collective sense-making and problem-solving around key issues facing the local area. By bringing together those with the power to make decisions at scale and those directly experiencing or responding to the issue, these experiential journeys focus on learning and formulating collective plans of action for change. While the series initially focused on mapping food and nutrition insecurity issues, it revealed a host of interconnected issues, including those related to the economy, human mobility and social cohesion. As such, this method moves beyond extractive research towards collaborative learning. This approach can, with concerted follow-up, result in locally appropriate bottom-up systems change and the building of social compacts through which agreements can be reached and kept.
Significance:
• Through revealing systemic issues in the local food system through direct experience of a local environment, learning journeys can co-produce knowledge in support of responses to the underlying complexity.
• By bringing together those with the power to make decisions at scale and those directly experiencing or responding to the issue, learning journeys enable learning and formulating collective plans of action for change.
• Learning journeys move beyond extractive research towards collaborative learning that can, with concerted follow-up, result in locally appropriate bottom-up systems change.
Introduction
The South African food system can be characterised as a paradox.1 The nation is the most industrialised in Africa, and is categorised as an upper-middle-income country. Its positive food balance is advanced by a sophisticated agricultural sector with an array of food, nutrition and agricultural policies. Nonetheless, food system outcomes include severe under- and overnutrition, precarious agricultural livelihoods, unviable agricultural production methods and stark territorial disparities. Resolving a food system paradox that presents itself as a wicked problem cannot be accomplished through conventional scientific inquiry and requires knowledge co-production. This is because there is no agreement as to the cause of the problem, there are no clear solutions, and there are multiple stakeholders and conflicting interests. Learning journeys may offer one option to address a context such as this.
Learning journeys comprise place-based curated conversations between different stakeholders in the food system, with researchers and policymakers among them. They provide a space for co-learning by all who participate who, with reflexivity, can identify and commit to new ways of working with the food system. Learning journeys are grounded in a constructivist approach to learning and can link stakeholder engagement with research design to achieve research impact. Bringing together those with the power to make decisions at scale and those directly experiencing or responding to the issue, these experiential journeys focus on learning and formulating collective plans of action for change.
This approach contrasts with traditional top-down policymaking and planning that have been shown to be largely ineffective in addressing complex challenges related to food systems. Decades of misplaced plans and solutions designed through top-down technocratic processes have failed to understand the lived experiences and intricate survival strategies of the people who are directly confronted with the reality of complex urban vulnerability. These approaches assume that problems can be solved by a single actor, missing the necessity of inter- and extra-governmental collaboration.
A series of learning journeys has shown the benefit of collective sense-making and problem-solving around key issues facing the local area. These learning journeys have highlighted the value of interactive, participatory methods for joint problem-solving and policy. This method moves beyond extractive research towards collaborative learning that can, with concerted follow-up, result in locally appropriate bottom-up systems change.
Research Article
https://doi.org/10.17159/sajs.2025/19005
overview a food security crisis
The South African food system is still moulded by colonial-era injustices that were made worse by apartheid laws and the nation’s subsequent isolation. The continuation of extreme wealth and income inequality resulting from multifaceted poverty and unemployment shaped by previous racial policies, as well as growing asymmetries in power, efficiencies and information across food value chains and spheres of governance2, are all caused by this history, as well as the adoption of liberalisation policies, reintegration into the global food economy, and the neoliberal paradigm supported by international donors3. These factors have contributed to the persistence of food and nutrition insecurity despite the availability of sufficient food and public health interventions4, as well as the degradation of an already vulnerable natural environment5 It is a complex crisis.
Within the food system, different stakeholders’ positions and power result in competition, which affects the framing of food systems issues and the subsequent policy priorities.6 As a result of disparate personnel and financial resources, stakeholders do not have the same voice or access to information. This limits the ability of some to engage with policy processes and to influence decisions, while privileging others. Despite efforts to promote dialogue and foster engagement for co-production of knowledge and improved food democracy, there are still limited opportunities for stakeholder involvement in the policy debate, which reinforces power asymmetries amongst contributors to the food system.7 8
Two levers have been proposed to improve food system governance.1 The first is to improve inclusive stakeholder participation and enhance engagement to help address policy coherence and balance the current asymmetries in the food system. Although focused on installing the governance arrangements defined in the National Food Security and Nutrition Policy in terms of Food Councils, this has resonance with participatory processes at local level that could result in similar sub-national processes.
The second lever is to adopt a two-pronged place- and issue-based approach to food system governance. Food systems are ingrained in specific locations, and, in the context of South Africa, territorial inequalities are a major problem. Local scales are ideal for group participation in challenging power dynamics and identifying opportunities and barriers to sustainable development. To fully utilise multi-stakeholder participation in the design and implementation of food policies, local governments must be involved in such processes. It is this lever that learning journeys engage directly.
Here we examine the application of ‘learning journeys’ as a methodological approach to addressing complex food security challenges in South Africa’s Western Cape region. Through a series of carefully facilitated experiential journeys in the Breede Valley Municipality between 2019 and 2024, we demonstrate how this participatory action research method enables diverse stakeholders to collectively explore, understand and respond to systemic issues within the local food system. We present case studies from four distinct learning journeys, analysing how they revealed interconnected challenges across food environments; fostered new relationships between government officials from different spheres of government, community members and researchers; and catalysed specific commitments to action. We argue that this place-based, collaborative approach offers important advantages over conventional top-down policymaking and planning by democratising expertise, building social compacts, and generating locally appropriate responses to food system paradoxes that conventional scientific inquiry struggles to address.
Learning journeys: Curated spaces for co-learning
A ‘learning journey’ is a carefully designed process to develop a shared, grounded understanding of a system as part of a deeper learning process. It reveals systemic issues through direct experience of a local environment. A broad and inclusive range of participants undertake a physical journey to explore a complex system. The objective is to gain first-hand experience of challenges through a sequence of purposeful conversations, and investigate possible solutions to these challenges.
This provides both an opportunity to assemble a co-produced knowledge base, and a means for the co-design of interventions that can be focused at different levels, including responses that are ‘territorial’ or local. The underlying philosophy is that making a systemic transition needs an enactive approach which integrates different ways of looking into food systems. This recognises the embeddedness of all actors in the system including the researchers, relational engagement between stakeholders9, and an emphasis on listening and communicating10
Significantly, learning journeys bring together those with the power to make decisions and those directly experiencing or responding to the issue, viewing those facing the brunt of food issues as hosts or active informants in bringing about sustainable solutions to such problems. The immersive experiences within different aspects of the food system enable participants to engage with the physical space and people’s lived experiences through observation and conversation. In this way, a collective sense of the need for change is created – within and beyond the stakeholders directly involved – to identify strategies for affecting that change and to agree a course of action.11
Methodology
The aim of the article is to evaluate the effectiveness of ‘learning journeys’ as a participatory action research methodology for addressing complex food system challenges in South Africa. Specifically, we assess how this approach enables diverse stakeholders to co-produce knowledge about food security issues in the Breede Valley Municipality through direct experiential engagement with the local food environment.
The learning journey methodology is grounded in multi-stakeholder engagement, community-based learning and rigorous qualitative fieldwork. It was designed to enable collaboration and dialogue12, especially on place-based and community-led perspectives in understanding the socioecological challenges related to food security13
The research team, drawn from national and international universities, embarked on a place-based approach in 2019. The research team was multidisciplinary and included environmental geographers, political economists, public health researchers and urban designers. The team partnered with civil society organisations experienced in the design, facilitation and follow-up of the Southern Africa Food Lab and the Western Cape Economic Development Partnership to design and facilitate the dialogue process and learning journey methodology. These organisations serve as ‘intermediary organisations’ that facilitate stakeholder collaboration and assist with bidirectional knowledge brokerage.14
Our study site was the Breede Valley Municipality (BVM), a highly productive agricultural area in the Western Cape that forms part of the Breede–Olifants catchment area. After experiencing colonialism and land dispossession since the early 1700s, little remains of pre-colonial practices. Instead, the BVM has been a receiving area for migrants: from Europe and Asia since the 1800s, the former ‘homelands’ of South Africa since the 1900s, and more recently from other countries in sub-Saharan Africa. Much of the produce is high-value export crops, but the region includes important staple food crops including broiler poultry. Worcester, the fourth-largest city in the province, is in the BVM with three smaller towns, including Touws River which is situated in the Karoo biozone.15 Despite the availability of food, recent surveys show that over 25% of children under 5 years in Worcester suffer from malnutrition, and many of the adult population consumes meals low in nutrients, which has a negative impact on their health.16
The BVM was selected due to its generic characteristics as a rapidly growing urban area serving an agricultural hinterland. A memorandum of understanding between the University of the Western Cape and the BVM has been signed and a process has been established for the sharing of results and the co-production of knowledge. Previous activities include a large sample survey of dietary intake that was completed in early 2020, along with a food vendor survey. Additional research has included qualitative methodologies in the form of learning journeys, action research and in-depth interviews. Satellite imagery and administrative records have also been used. The learning journeys aligned to the work of The Nourished Child project undertaken in 2022.17
https://doi.org/10.17159/sajs.2025/19005
Conceptual framework
There is a growing body of experience surrounding the design of social dialogues to create spaces that can be used to enable transformation.18 19 According to Schäpke et al. one of their main goals is to generate social-ecological innovations aimed at challenging and changing existing roles and routines, power dynamics, relations among groups and networks, resource flows, as well as meaning and values (and culture) across different contexts and scales.20
This necessitates a particular kind of facilitation – one that promotes discussion, sense-making, introspection, and reflexive learning, while encouraging the rephrasing of problems to enable the co-creation and co-realisation of solutions, or, at the very least, an attempt at experimentation and transformation.21 Thus, the term ‘dialogue’ is employed as a catch-all to refer to a range of supported procedures that may also be used in knowledge co-production, participatory action research and future search procedures.
Traditional top-down policymaking and planning have been shown to be largely ineffective in addressing complex food security challenges, even when these form part of ‘consultative’ activities for local planning.22 23 Interventions motivated by top-down directives frequently encounter opposition and fall short because they do not give stakeholders a sense of ownership during the decision-making process and are improper for addressing cultural sensibilities.24 These approaches assume that problems can be solved by a single actor, missing the necessity of inter- and extra-governmental collaboration. Thus, decision-makers and researchers often fall into the trap of habitual thinking when responding to such crises, making assumptions about what is required without necessarily delving into the deep, structural underpinnings of the negative food outcomes of the complex system.
Embodying facilitated dialogue, the learning journey process of taking people out of their ‘comfort zones’ challenges automatic assumptions and habitual thinking can be ‘flushed out’ and new innovative thinking around solutions can emerge. Learning journeys are carefully planned processes intended to create ‘safe’ or ‘safe enough’ environments in which ideas can be promoted and developed. Based on a long history of action research, the underlying notion challenges who the experts are. By recognising that knowledge is also held by those embedded in systems, either formally or informally, the learning process embraces the full range of perspectives and opinions. The notion is both one of
democratising expertise, but also of ‘expertising democracy’ so that policy advice is derived from multiple sources.25
Learning journeys are a heuristic to link two important activities in contemporary research using the pedagogical tools familiar to researchers when in their teaching environments. Although multiple actions are possible in practice, an illustration of the process is depicted in Figure 1 as a theory of change underpinning learning journeys in a research context. The constructivist approach is widely used; this approach is one in which new knowledge is built on the foundation of stakeholders’ previous understandings. It encourages exploration, critical thinking and problem-solving, as those who are jointly learning interact with their environment and collaborate with peers to construct meaning.
Learning journeys concurrently initiate a co-learning process and the formal process of scientific discovery. The latter requires the preparation of a theoretical framework for the research: the interrelated concepts and theories that provide a structured foundation for understanding and analysing data concerning the selected topic. Conventional methodologies may have included consultation with stakeholders to guide some of these steps, but learning journeys require a systematic bidirectional flow between the knowledge and perceptions of stakeholders and these steps and learning in the research process. As a result, they go beyond simple consultation through curated place-based conversations between all stakeholders, with researchers being part of a continuum of stakeholders rather than external ‘expert’ observers.
A key element of each learning journey was an accompanying ‘learning lab’ – a space in which the research findings and co-created knowledge from the stakeholder engagement were brought together. This enabled the implications to be identified and, where possible, action plans to be developed. The process encouraged diverse input, engaged listening, creativity and shared understanding, enabling the exploration of complex issues and the development of innovative solutions. The bringing together of these methods into a structured process permitted the translation of research findings into outputs that could be easily communicated, widely disseminated and quickly exploited into actionable implementation.
r esults: Learning journey case studies
The first two learning journeys in Worcester focused on specific areas: Parkersdam and Durban roads, a lively commercial area in the town’s centre, and the neighbouring township of Zweletemba and informal settlement called Mandela Park. In the commercial area, the lens focused on the area’s history of settlement, forced removals and post-apartheid
Figure 1: An illustration of the learning journey theory of change.
renewal, and the commercial activity in the food sector. In Zweletemba and Mandela Park, activities were curated to explore the role played by early childhood development (ECD) centres, which are intended to ensure infants and young children receive adequate nutrition through direct provisioning, promote healthy eating habits, help educate caregivers and parents about the importance of nutrition, and promote the local sourcing of food. These areas were identified as integral elements within the town’s food system. Parkersdam and Durban roads are characterised by wholesale and informal retail trade in fresh fruit and vegetables, small- and large-scale butcheries, several non-franchise fast food outlets, and large formal food retailers and wholesalers. Mayinjana Avenue in Zweletemba is known for its educational establishments, including primary and high schools, and a concentration of ECD centres. This is situated next to the informal settlement of Mandela Square, which also has several ECD centres. Stakeholders included the principals and members of formal and informal ECD centres at which food was provided to pre-school children.
A subsequent learning journey focused on ‘governing the system’ and took place in the local municipality offices and in the local offices of other spheres of government that influence planning, zoning, regulations and service provision associated with the food system of the BVM. Stakeholders were largely government officials from a cross-section of departments dealing with economic development to social relief.
A third learning journey focused on the township economy following a horizontal transect along the Zweletemba Development Corridor and included spaza shops, street traders, formal cafés, restaurants, the local supermarket and the taxi association, which ferried commuters along the main thoroughfare. This started and ended in a Community Multi-Purpose Centre with catering provided by community groups.
At the request of the BVM, a fourth learning journey pivoted on the Karoo platteland, in the Touws River town and surrounding rural areas. Touws River was identified by municipal planners as being of specific concern because of the closure of local industry and its location in the Karoo. Originally a railway town, the decline of rail in the early 1990s resulted in economic decline, which was accelerated in the early 2000s. The broader politics of state-owned enterprises and Transnet have had a direct and profound impact on Touws River, with unemployment estimated at 80%. Stakeholders included civil society philanthropists, local business leaders, municipal officials, education and health workers and farmers.
Although each learning journey involved up to 60 participants, small teams of community members, government officials (local, district and provincial), academics, activists, food advocacy groups and ECD practitioners were constituted. The facilitation team encouraged participants to concentrate on both their external observations and internal experiences. Furthermore, they advised participants to consciously listen to messages from both these sources. In this way, the immersive experience would enable participants to explore the complexities of the food system, to gain first-hand experience of its challenges and opportunities with a broad and inclusive range of participants, hosted by people directly involved in the system.
New perspectives
During the learning journeys, new perspectives emerged on the complexity of processes related to food. Rather than looking at the issue generally, the teams were able to identify place-based challenges – and potential solutions – breaking with traditional modes of thinking that focus on one-size-fits-all solutions. As an example, participants were empowered to take stock of existing local potential to “activate local assets through direct engagement with the local population” (KII1). These include physical assets such as vacant land and water infrastructure, institutional assets such as ECD centres and schools, knowledge assets such as farming expertise and indigenous food practices, and social assets such as community networks and support systems.
As one example of new perspectives on place-based challenges, one of the food system assets identified was the informal ECD centres that provide meals and care to pre-school children living in Mandela Square. The constraints related to existing zoning requirements that prevented the issuing of lease agreements, proof of ownerships or permission to
occupy certificates, which meant that informal centres could not register with the relevant national department and benefit from the subsidies that would otherwise be available. The possible solution was to make use of the Department of Cooperative Governance and Traditional Affairs’ (CoGTA) Integrated Urban Development Framework (IUDF), together with the BVM’s Integrated Development Plan and the Municipal Land Use Planning By-Law to release this constraint. The learning journey process ensured that actions and responsibilities could be assigned. In 2024, the Manifesto for Early Childhood Development issued by a national civil society organisation, Real Reform For ECD, called for interventions similar to those proposed in BVM.26
At a broader level, the journeys also looked at service provision and infrastructure. As one local government official reflected: We plan as if we lived in Stuttgart or some other European city, not for the informal. Moreover, there is little infrastructure for subsistence farming, our lands and rivers are designed to support large commercial farming. (KII3)
This could be changed, he said, “by supporting amenities like water collection points and building infrastructure close to taxi ranks, among other things” (KII3). Practical suggestions included ensuring that storage facilities are provided and that shaded areas, tables and benches be established to provide a more conducive environment for street vendors to operate.
While undertaking the learning journey in Durban Street, team participants interacted directly with those involved in the food system, learning that crime is a problem in the area for food retailers as much as for consumers. A senior official suggested that if law enforcement officials “saw informal traders as partners rather than ‘illegal occupants’, then an active surveillance system could be created for the safety and security of the CBD” (KII5). In the ensuing conversation, this ambitious idea gained traction as practical suggestions emerged about traders routinely engaging law enforcement officers about activities on the street, including the presence of known criminals.
Another reflection was that a great deal of the fresh produce sold by retailers was sourced at the Epping Fresh Produce Market, Cape Town, rather than locally where much of it was grown. Similarly, butchers stocked frozen chicken imported from overseas locations, despite Worcester being home to a large poultry company that contributes 6% of South Africa’s broiler chickens, as well as several small- and medium-scale producers. These ideas led to discussions about re-establishing a local farmers’ market in Worcester with links to small-scale growers and a proposal to engage the poultry company about the chicken value chain being more beneficial to Breede Valley.
The journey into Zweletemba and Mandela Park revealed unique food system challenges. Principals of schools bemoaned that undeveloped public land could not be used for food gardens, that there was no access to municipal water to irrigate gardens, and the inability of parents to consistently pay ECD centre fees due to the seasonal nature of their employment as farmworkers. Opportunities for the supplementary role of urban agriculture caught the attention of district agriculture officials. At the same time, the presence of a local non-governmental organisation ensured that some centres received shelf-stable nourishing food, although the taste was not always to the liking of the children. The journey also identified a vibrant small-holding farming sector in vegetables and livestock despite receiving no support from any sphere of government. This situation would benefit from a local farmer’s market, as discussed above.
In the unique environment of Touws River, the learning journey sought to comprehend the relationship between the larger food system and niche solutions that have arisen in response to the high levels of hunger, food insecurity, and malnutrition. With the support of a nearby concentrator photovoltaics solar project, both school gardens and a hydroponic farm had been established, generating much-needed livelihoods in the community. At the same time, the organisers of a local soup kitchen reported that they had received no support from the municipality or local groups as their beneficiaries included stigmatised communities such as
https://doi.org/10.17159/sajs.2025/19005
substance abusers and the long-term unemployed. Instead, they relied upon support from an international non-governmental organisation. The learning journeys and subsequent labs were not without moments of contention. The learning journey in Parkersdam revealed that many food wholesalers and retailers were owned by first-generation migrants, largely from Bangladesh. Some participants lamented this fact, complaining that “locals” were sidelined by this development. With complex issues such as xenophobia, opening this space can lead to difficult conversations. This led to a fruitful discussion about what it meant to be considered “local” and the contributions that “outsiders” could make to a local food system. While progress was made, no agreement was reached on this issue during the learning lab, as this was a deeply contentious issue on its own in local politics. What was achieved was a stated acknowledgement that documented and undocumented migrants could contribute to food security, including through the provision of seasonal labour to commercial farms and as conduits of fresh produce through local channels. As part of an ongoing conversation, difficult topics needed to be constantly revisited to allow solutions to emerge, including topics that often polarised debates.
Commitments
The learning journeys provided rich information that, in the subsequent discussions, led in part to concrete initiatives, some of which appear in the Final Fifth Generation Integrated Development Plan 2022–2027 that recently closed for public comment.27 These opportunities hinged on supporting the development of social innovations combined with relationship building. A key issue was the need for collective reflection to discuss what could be done, followed by concrete statements of commitments, which the convenors were able to follow up on afterwards.
Despite agreement not being reached on some issues, particularly those of a politically sensitive nature, such as the ownership of informal trading outfits by immigrants, important progress was made in other areas through the learning processes. For example, a commitment was made by the provincial Department of Agriculture to work with the local ECD Forum in Worcester as well as several schools in Touws River to support food gardens in terms of training and the provision of inputs. Senior officials were mandated to visit these sites and to establish what was required to sustain this form of urban agriculture. Most importantly, long-term partnerships were established between government and civil society groups through the ECD and Young Child Forum to develop the ECD Policy for Breede Valley. A related commitment was made by the most senior provincial official in Agriculture to engage District Health on the question of people waiting in the long queues outside clinics and being able to access some form of sustenance, provided by a clinic garden and community kitchen.
Some councillors from Worcester and Zweletemba agreed to follow up on how vacant land plots could be used for food gardens, initiating a wider debate on how the BVM could work to overcome national restrictions on making use of unused land. This raised the question of the need for a land audit, and an executive in the Department of Provincial Agriculture committed to supporting the municipality in understanding which land parcel lay with which sector or sphere.
Some participants argued strongly for the creation of a fresh goods market in Worcester to avoid retailers having to travel to collect fresh produce in Cape Town. The Municipal Committee responsible for Economic Development committed to placing this issue on their agenda and requested the relevant officials from Local Economic Development to provide technical input into the process.
A public commitment was made by the Municipal Manager for municipal staff to shepherd the development of the ECD Policy, mandating them to consider some of the ideas discussed. Stakeholders have since constituted a municipal Task Team that has set out to develop a municipal ECD document and strategic plan to expedite the registration process of unregistered ECDs. Several infrastructure projects were identified, with the result that a few ECD centres managed to obtain their registration process. Overall, there was a broad recognition and appeal for greater coordination amongst local government departments and units to focus on nutritious food, raising a question about making this a core responsibility of a
dedicated unit, possibly the District or the Municipal Manager’s office. In closing one of the learning labs, an official reiterated the importance of finding opportunities for the Province to reinforce the efforts at district and local level, and in so doing, unlock additional resources. He acknowledged the significance of the fact that “the BVM had developed many ideas and initiatives in collaboration with non-state actors and that with provincial support, much could be done to strengthen these” (KII5).
Discussion
The goal of the learning journeys was to develop a deeper understanding of the food system and potential avenues for change and to mobilise support from diverse stakeholders, including businesses, civil society and national, provincial, district and local levels of government. As a senior manager related, learning journeys can help unlock new ways to address some of the town’s complex, interconnected challenges: “Government officials, the private sector and the local community must collaborate to ensure our people have access to sufficient, nutritious food and other resources” (KII6). A number of initiatives emerged in which this was achieved, ranging from municipal policy through to supporting ECDs to register for grants and direct support of inputs to enable production. The IDP confirmed these commitments.
The issues facing BVM cannot be solved by stakeholders working on their own. This was echoed by a senior academic:
It’s also not enough to just understand the problem. As the recent learning journey showed, we need the relevant actors to come together to find practical ways to address hunger and malnutrition. (KII8)
This was achieved in the various learning journeys as several actions emerged afterwards, driven by stakeholders who had committed to act. More than finding solutions, a sense of commitment and accountability emerged. As an example, a recurring element in the learning journey in Touws River was the feeling of being abandoned or cut off, which left a sense of disappointment in the community. It would take a persistent, long-term champion to investigate and drive new opportunities. Two local politicians, from different political parties, recognised this, making it clear that they would work with the diagnosis of the issues and support the various initiatives that emerged. It became imperative that government departments collaborate and interact effectively with non-state players at all levels to guarantee that policies, ideas and actions were transformative and complimentary to the system.
On reflection, a learning journey is an innovative research process whereby a broad and inclusive range of participants literally undertake a journey to explore a complex system – referred to as a ‘visit to the system’. Through this, participants gain first-hand experience of problems and apply innovative thinking to finding solutions. Another important function was that the learning methodology and process strengthened the capacity of researchers to interpret their findings. This helped the creation of models based on survey data to forecast the possible effects of alternative food and nutrition interventions.28
Similarly, learning journeys can help to guide research questions to ensure that the topics and the findings respond to needs on the ground and not only academic imperatives. Working with the BVM, for example, highlighted the desire to surface more data about the potential linkages between the food system and economic activities such as tourism. Beyond the research, the Western Cape government was also able to expand their understanding of how to address challenges within food systems through a more nuanced understanding of the BVM, which was chosen as a test site for the province’s food and nutrition security plan, ‘Nourish to Flourish’.
While one of the great strengths of the learning journey process is its ability to create spontaneous outcomes, the design of the process is crucial, including who is involved and invited and the nature of the curated spaces, and ensuring that people not normally engaged were given an opportunity to speak and be heard. Opportunities were created for decision-makers to speak about their intentions in a public forum so as to create accountability and momentum. Indeed, participants
https://doi.org/10.17159/sajs.2025/19005
were selected to ensure broad representation, and spaces created for thoughtfully framed conversation without these moments being co-opted by those more comfortable talking in public. Consideration must also be given to the risks of raising expectations, both among communities and among government officials who may find that they are unable to keep to the commitments that they made during the learning journey.
Whilst the immersive, experiential nature of these journeys creates powerful moments of commitment, translating these into sustained action requires structural support. Our evidence reveals mixed outcomes: some concrete initiatives materialized, such as the provincial Department of Agriculture’s commitment to support ECD food gardens and the formation of a municipal Task Team, whilst other commitments lacked clear implementation pathways.
There were several factors that enhanced follow-through. The continued engagement of intermediary organisations proved crucial in maintaining momentum beyond individual events. The public nature of commitments made during events introduced a form of social accountability that motivated action. Furthermore, our strategic selection of participants with decision-making authority proved essential for meaningful change.
However, there were limitations that constrained impact. Managing expectations remained challenging. If government officials are unable to keep to commitments made, it might potentially undermine trust. Without formal integration into administrative structures, actions often depended on individual champions rather than systemic change. Additionally, the time- and labour-intensive nature of learning journeys limited the follow-up capacity of the intermediary organisations.
Our experience suggests that whilst learning journeys excel at knowledge co-production and relationship building, they must be complemented by robust implementation mechanisms to fulfil their transformative potential. This includes documenting commitments with specific timelines, establishing regular accountability meetings, ensuring dedicated resources, and embedding commitments within formal institutional processes rather than relying solely on the goodwill generated through experiential learning. As with any policymaking or planning endeavour, there are no guarantees that the collection and analysis of evidence will result in action. However, the joint sense-making activities that are a key component of the journey do reduce the risk of evidence being easily disregarded, biased or selectively used.
Impetus beyond the ‘learning journey’ is sought by combining the new insights and new relationships with new commitment to act; participants are encouraged to publicly commit that they will do something. It speaks to the critical importance of including in the journeys those participants who have the power to have an impact on outcomes and make changes happen – both politically and technically. This reflects the broader intention to galvanise action through these processes; the intention is to move beyond learning about different kinds of interventions, or pathways of possible change, to action.
There are also ethical issues that need to be considered because learning journeys take participants into spaces where people live and work, where complicated dynamics of power and privilege play out. A respectful approach to these issues is critical, and there may be contexts in which the learning journey approach is not appropriate. In the case of the BVM, despite resources being available, it was agreed not to embark upon a learning journey in an area because of conflicts within the community which had previously led to violence. Basic issues relating to the safety of participants, ensuring that water is available when in hot environments, and providing safe transport must also be considered.
As a method to foster dialogue, the ‘learning journey’ has numerous applications where questions have become ‘stuck’, due to its ability to free people to step outside their established roles and experiment with new ideas, and be inspired to think differently. Although resources are not always available, as this approach is time and labour intensive and requires capacity to follow up, learning journeys have highlighted the value of these interactive, participatory methods for joint problem-solving and policy implementation. While the series initially focused on mapping food insecurity issues, it revealed a host of interconnected issues, including those related to the economy, mobility and social cohesion.
These intimate encounters with the reality of the issue humanise statistics, reveal what cannot be seen at a distance, and balance power relations.
Conclusion
The importance of recognising place-based constraints in the food system and coming up with creative solutions is even more urgent given the negative impacts that climate change is having on food production in the BVM. If the food system in the BVM is to provide food and nutrition security, and livelihoods and economic inclusion in an environmentally sustainable way, it needs to be relocalised so that it can become more resilient to the challenges ahead. Such a resilient food system will emerge only through local cooperation, knowledge co-production, collective action and the creation of a shared vision of what a socially just and sustainable food system looks like. The recent food journeys and learning labs in Worcester were important steps in this process.
Acknowledgements
Special thanks is directed to Marcela Guerrero Casas for her contribution and leadership in co-designing and facilitating the learning journeys in BVM whilst employed at WCEDP. We acknowledge the BVM for orientation, contacts and hospitality in the field; members of the project reference group for inputs; administrative staff at the DSI-NRF Centre of Excellence in Food Security at the University of the Western Cape; and the Southern Africa Food Lab and Faculty of Agri-Sciences at Stellenbosch University for financial and logistical assistance.
Funding
This project received funding from the European Union’s Horizon 2020 research and innovation programme under grant agreement no. 862555 and from the South African National Research Foundation (UID: 91490 & UID: 134109). The project, UrbanFOSC, was carried out under the ERA-Net Cofund FOSC (grant no. 862555), built upon and supported by experience from the Joint Programming Initiative on Agriculture, Food Security & Climate Change (FACCE-JPI) and the ERA-Net Cofund LEAP-Agri.
Data availability
Interview transcripts are available from the authors on request.
Declarations
We have no competing interests to declare. We have no AI or LLM use to declare. Ethical clearance and oversight was provided by the Humanities and Social Science Research Ethics Committee of the University of the Western Cape (reference number HS22/8/26, approval period 29/09/22–28/09/25).
Authors’ contributions
S.D.: Conceptualisation, methodology, data collection, data analysis, validation, writing – the original draft writing – revisions, project leadership, project management, funding acquisition. J.M.: Conceptualisation, methodology, data collection, data analysis, validation, writing – the original draft, writing – revisions, project leadership, project management, funding acquisition. Both authors read and approved the final manuscript.
r eferences
1. FAO, European Union, CIRAD, DSI-NRF Centre of Excellence in Food Security (CoE-FS). Food systems profile – South Africa: Catalysing the sustainable and inclusive transformation of food systems. Rome / Brussels / Montpellier / France / Cape Town:FAO / European Union / CIRAD / CoE-FS; 2022. https:/ /doi.org/10.4060/cc0071en
2. Ledger T. Power and governance in agri-food systems: Key issues for policymakers [document on the Internet]. c2016 [cited 2025 Feb 27]. Available from: https://www.tips.org.za/research-archive/trade-and-industry/item/3175-p ower-and-governance-in-agri-food-systems-keyissues-for-policymakers
3. Thow AM, Greenberg S, Hara M, Friel S, du Toit A, Sanders D. Improving policy coherence for food security and nutrition in South Africa: A qualitative policy analysis. Food Secur. 2018;10(4):1105–1130. https://doi.org/10.100 7/s12571-018-0813-4
4. May J, Witten C, Lake L, editors. South African child gauge 2020. Cape Town: Children’s Institute, University of Cape Town; 2020. Available from: https://ci .uct.ac.za/child-gauge/cg-2020-food-and-nutrition-security
5. Von Bormann T. Agri-food systems: Facts and futures: How South Africa can produce 50% more by 2050. Cape Town: WWF South Africa; 2019. Available from: https://www.wwf.org.za/?27341/agri-food-systems-facts-and-futures
6. Holt Giménez E, Shattuck A. Food crises, food regimes and food movements: Rumblings of reform or tides of transformation? J Peasant Stud. 2011;38(1):109–144. https://doi.org/10.1080/03066150.2010.538578
7. Drimie S, Hamann R, Manderson AP, Mlondobozi N. Creating transformative spaces for dialogue and action: Reflecting on the experience of the Southern Africa Food Lab. Ecol Soc. 2018;23(3), Art. #2. https://doi.org/10.5751/E S-10177-230302
8. Adelle C, Kroll F, Losch B, Görgens T. Fostering communities of practice for improved food democracy: Experiences and learning from South Africa. Urban Agric Reg Food Syst. 2021;6(1), e20007. https://doi.org/10.1002/ua r2.20007
9. Ozanne JL, Davis B, Murray JB, Grier S, Benmecheddal A, Downey H, et al. Assessing the societal impact of research: The relational engagement approach. J Public Policy Mark. 2017;36(1):1–14. https://doi.org/10.1509 /jppm.14.121
10. Sharp EL. The role of reflexivity in care-full food systems transformations. Policy Futures Educ. 2019;17(7):761–769. https://doi.org/10.1177/147821 0319874256
11. Carbajal ML, Baranauskas MC. Enactive interaction in support of creative learning: A systematic literature review. Int J Hum-Comput Interact. 2025; 41(8):4775–4800. https://doi.org/10.1080/10447318.2024.2353425
12. Greenberg S, Drimie S, Losch B, May J. From local initiatives to coalitions for an effective agroecology strategy: Lessons from South Africa. Sustainability. 2023;15(21), Art. #15521. https://doi.org/10.3390/su152115521
13. Losch B, May J. Place-based approaches to food system resilience: Emerging trends and lessons from South Africa. In: Béné C, Devereux S, editors. Resilience and food security in a food systems context. Cham: Springer Nature; 2023. p. 321–353. https://doi.org/10.1007/978-3-031-23535-1_10
14. Godfrey L, Funke N, Mbizvo C. Bridging the science-policy interface: A new era for South African research and the role of knowledge brokering. S Afr J Sci. 2010;106(5/6), Art. #247. https://doi.org/10.4102/sajs.v106i5/6.247
15. Western Cape Government. Municipal economic review outlook: Cape Winelands District 2023–2024, Western Cape Government [document on the Internet]. c2025 [cited 2025 May 30]. Available from: https://www.westernc ape.gov.za/provincial-treasury/sites/provincial-treasury.westerncape.gov.za/ files/atoms/files/2023-24%20MERO%20Cape%20Winelands%20District.pdf
16. Mabaso MK, Lenhoff A, Eley N, Menyatsoe M, Müller A, Manda S, et al. Nutritional status of children under five in Worcester, Breede Valley, Western Cape Province, South Africa. Johannesburg: Grow Great; 2021. Available from: https://www.growgreat.co.za/wp-content/uploads/2021/05/GG-WORCESTE R-REPORT-final4.pdf
17. Battersby J. Finding new pathways to addressing child malnutrition. Daily Maverick. 17 February 2022 [cited 2025 Jun 06]. Available from: https://w ww.dailymaverick.co.za/article/2022-02-17-finding-new-pathways-to-addre ssing-child-malnutrition
18. Drimie S, Magner C, Pereira L, Charli-Joseph L, Moore M-L, Olsson P, et al. Facilitated dialogues, Chapter 9. In: Biggs R, de Vos A, Preiser R, Clements H, Maciejewski K, Schlüter M, editors. The Routledge handbook of research methods for social-ecological systems. 1st ed. Abingdon: Routledge; 2021. p. 136–147. https://doi.org/10.4324/9781003021339
19. Pereira L, Vrettos C, Cramer L, Drimie S, Muiderman K, Schapendonk F, et al. Policies and design processes to enable transformation. In: Campbell B, Thornton P, Loboguerrero A, Dinesh D, Nowak A, editors. Transforming food systems under climate change through innovation. Cambridge: Cambridge University Press; 2023. p. 119–129. Available from: https://www.cambridge. org/core/books/transforming-food-systems-under-climate-change-through-i nnovation/policies-and-design-processes-to-enable-transformation/BC4CD5 CEDE00561E6C81434CBDC399B9
20. Schäpke N, Stelzer F, Caniglia G, Bergmann M, Wanner M, Singer-Brodowski M, et al. Jointly experimenting for transformation? Shaping real-world laboratories by comparing them. GAIA. 2018;27(suppl 1):85–96. https://doi .org/10.14512/gaia.27.S1.16
21. Sharpe B, Hodgson A, Leicester G, Lyon A, Fazey I. Three horizons: A pathways practice for transformation. Ecol Soc. 2016;21(2), Art. #47. https ://doi.org/10.5751/ES-08388-210247
22. Genesis Analytics. Implementation evaluation of the National Food and Nutrition Security Plan: Summary report [document on the Internet]. Pretoria: Department of Planning, Monitoring and Evaluation, Government of South Africa; 2023. Available from: https://www.dpme.gov.za/keyfocusareas/evalu ationsSite/Evaluation%20Reports/Genesis%20DPME%20NFNSP%20Full%20 Evaluation%20Report%2002.11.2023.pdf
23. Everatt D, Marais H, Dube N. Participation ... for what purpose? Analysing the depth and quality of public participation in the Integrated Development Planning process in Gauteng. Politikon. 2010;37(2–3):223–249. https://doi. org/10.1080/02589346.2010.522333
24. Freeth R, Drimie S. Participatory scenario planning: From scenario “stakeholders” to scenario “owners”. Environ: Sci Policy Sustain Dev. 2016;58(4):32–43. https://doi.org/10.1080/00139157.2016.1186441
25. Liberatore A, Funtowicz S. ‘Democratising’ expertise, ‘expertising’ democracy: What does this mean, and why bother? Sci Public Policy. 2003;30(3):146–150. https://doi.org/10.3152/147154303781780551
26. Real Reform for ECD. Manifesto for early childhood development in South Africa [document on the Internet]. c2024 [cited 2025 Jun 06]. Available from: https://www.ecdreform.org.za/uploads/ecd-manifesto-digital.pdf
27. Breede Valley Municipality. Review of the Integrated Development Plan (2023–2024): First review of the 5th generation IDP (2022–2027). Compiled in terms of the Local Government: Municipal Systems Act, Act 32 of 2000 [document on the Internet]. c2023 [cited 2025 Jun 06]. Available from: http s://bvm.gov.za/documents
28. Davis JT, Verburg PH, May JD. Diverse actor perspectives on African urban food systems: Lessons from participatory food system modeling in Worcester, South Africa. Ecol Soc. 2023;28(4), Art. #26. https://doi.org/10 .5751/ES-14285-280426