Research Article Page 3 of 7
Climate change and adaptation
An artificial weather station (i.e. a subset of the original weather station that was reparametrised based on future climate projection) was built into SAPWAT to calculate crop water requirements for the intermediate future in the absence of any information to that effect. It is hypothesised that with climate change, crop water requirements will increase. Two different types of irrigation technologies – drip and sprinkler irrigation systems – were considered and analysed. These are the most common types used in the Ceres region.
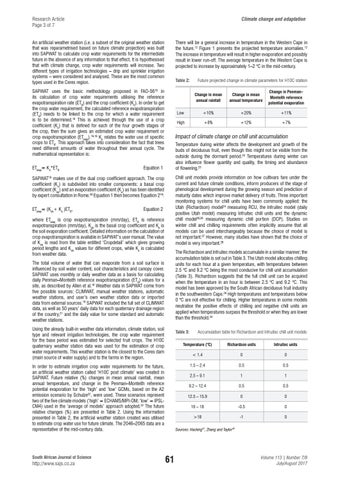
There will be a general increase in temperature in the Western Cape in the future.12 Figure 1 presents the projected temperature anomalies.12 The increase in temperature will result in higher evaporation and possibly result in lower run-off. The average temperature in the Western Cape is projected to increase by approximately 1–2 °C in the mid-century. Table 2:
SAPWAT uses the basic methodology proposed in FAO-5619 in its calculation of crop water requirements utilising the reference evapotranspiration rate (ET0) and the crop coefficient (Kc). In order to get the crop water requirement, the calculated reference evapotranspiration (ET0) needs to be linked to the crop for which a water requirement is to be determined.16 This is achieved through the use of a crop coefficient (Kc) that is defined for each of the four growth stages of the crop, then the sum gives an estimated crop water requirement or crop evapotranspiration (ETcrop).16,19 Kc relates the water use of specific crops to ET0. This approach takes into consideration the fact that trees need different amounts of water throughout their annual cycle. The mathematical representation is: ETcrop= Kc*ET0
Equation 1
Change in Penman– Monteith reference potential evaporation
Low
+10%
+20%
+11%
High
+8%
+12%
+7%
Chill unit models provide information on how cultivars fare under the current and future climate conditions, inform producers of the stage of phenological development during the growing season and prediction of maturity dates which improve market delivery of fruits. Three important monitoring systems for chill units have been commonly applied: the Utah (Richardson) model24 measuring RCU, the Infruitec model (daily positive Utah model) measuring Infruitec chill units and the dynamic chill model25,26 measuring dynamic chill portion (DCP). Studies on winter chill and chilling requirements often implicitly assume that all models can be used interchangeably because the choice of model is not important.27 However, many studies have shown that the choice of model is very important.28
Equation 2
The Richardson and Infruitec models accumulate in a similar manner; the accumulation table is set out in Table 3. The Utah model allocates chilling units for each hour at a given temperature, with temperatures between 2.5 °C and 9.2 °C being the most conducive for chill unit accumulation (Table 3). Richardson suggests that the full chill unit can be acquired when the temperature in an hour is between 2.5 °C and 9.2 °C. This model has been approved by the South African deciduous fruit industry in the southwestern Cape.29 High temperatures and temperatures below 0 °C are not effective for chilling. Higher temperatures in some models neutralise the positive effects of chilling and negative chill units are applied when temperatures surpass the threshold or when they are lower than the threshold.24
The total volume of water that can evaporate from a soil surface is influenced by soil water content, soil characteristics and canopy cover. SAPWAT uses monthly or daily weather data as a basis for calculating daily Penman–Monteith reference evapotranspiration (ET0) values for a site, as described by Allen et al.19 Weather data in SAPWAT come from five possible sources: CLIMWAT, manual weather stations, automatic weather stations, and user’s own weather station data or imported data from external sources.16 SAPWAT included the full set of CLIMWAT data, as well as 50 years’ daily data for each quaternary drainage region of the country,21 and the daily value for some standard and automatic weather stations. Using the already built-in weather data information, climate station, soil type and relevant irrigation technologies, the crop water requirement for the base period was estimated for selected fruit crops. The H10C quaternary weather station data was used for the estimation of crop water requirements. This weather station is the closest to the Ceres dam (main source of water supply) and to the farms in the region.
Table 3:
In order to estimate irrigation crop water requirements for the future, an artificial weather station called ‘H10C post climate’ was created in SAPWAT. Future relative (%) changes in mean annual rainfall, mean annual temperature, and change in the Penman–Monteith reference potential evaporation for the ‘high’ and ‘low’ GCMs, based on the A2 emission scenario by Schulze22, were used. These scenarios represent two of the five climate models (‘high’ = ECHAM5/MPI-OM; ‘low’ = IPSLCM4) used in the ‘average of models’ approach adopted.22 The future relative changes (%) are presented in Table 2. Using the information presented in Table 2, the artificial weather station created was utilised to estimate crop water use for future climate. The 2046–2065 data are a representative of the mid-century data.
http://www.sajs.co.za
Change in mean annual temperature
Temperature during winter affects the development and growth of the buds of deciduous fruit, even though this might not be visible from the outside during the dormant period.23 Temperatures during winter can also influence flower quantity and quality, the timing and abundance of flowering.23
where ETcrop is crop evapotranspiration (mm/day), ET0 is reference evapotranspiration (mm/day), Kcb is the basal crop coefficient and Ke is the soil evaporation coefficient. Detailed information on the calculation of crop evapotranspiration is available in SAPWAT’s user manual. The value of Kcb is read from the table entitled ‘Cropdetail’ which gives growing period lengths and Kcb values for different crops, while Ke is calculated from weather data.
South African Journal of Science
Change in mean annual rainfall
Impact of climate change on chill unit accumulation
SAPWAT19 makes use of the dual crop coefficient approach. The crop coefficient (Kc) is subdivided into smaller components: a basal crop coefficient (Kcb) and an evaporation coefficient (Ke) as has been identified by expert consultation in Rome.20 Equation 1 then becomes Equation 216: ETcrop= (Kcb+ Ke )ET0,
Future projected change in climate parameters for H10C station
Accumulation table for Richardson and Infruitec chill unit models
Temperature (°C)
Richardson units
Infruitec units
< 1.4
0
0
1.5 – 2.4
0.5
0.5
2.5 – 9.1
1
1
9.2 – 12.4
0.5
0.5
12.5 – 15.9
0
0
16 – 18
-0.5
0
>18
-1
0
Sources: Hacking41, Zhang and Taylor42
61
Volume 113 | Number 7/8 July/August 2017