Research Article Page 5 of 9
Recent trends in the climate of Namaqualand, South Africa
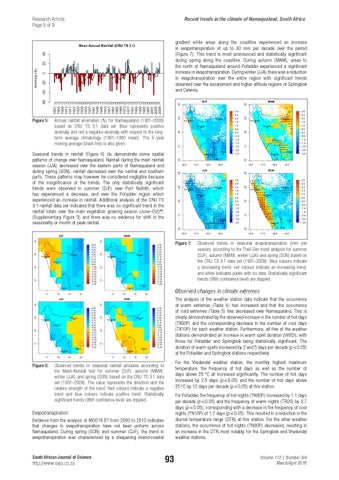
gradient while areas along the coastline experienced an increase in evapotranspiration of up to 30 mm per decade over the period (Figure 7). This trend is most pronounced and statistically significant during spring along the coastline. During autumn (MAM), areas to the north of Namaqualand around Pofadder experienced a significant increase in evapotranspiration. During winter (JJA) there was a reduction in evapotranspiration over the entire region with significant trends observed over the escarpment and higher altitude regions of Springbok and Calvinia.
Figure 5: Annual rainfall anomalies (%) for Namaqualand (1901–2009) based on CRU TS 3.1 data set. Blue represents positive anomaly and red a negative anomaly with respect to the longterm average climatology (1961–1990 mean). The 5 year moving average (black line) is also given.
Seasonal trends in rainfall (Figure 6) do demonstrate some spatial patterns of change over Namaqualand. Rainfall during the main rainfall season (JJA) decreased over the eastern parts of Namaqualand and during spring (SON), rainfall decreased over the central and southern parts. These patterns may however be considered negligible because of the insignificance of the trends. The only statistically significant trends were observed in summer (DJF) over Port Nolloth, which has experienced a decrease, and over the Pofadder region which experienced an increase in rainfall. Additional analysis of the CRU TS 3.1 rainfall data set indicated that there was no significant trend in the rainfall totals over the main vegetation growing season (June–Oct)49, (Supplementary Figure 5) and there was no evidence for shift in the seasonality or month of peak rainfall.
Figure 7: Observed trends in seasonal evapotranspiration (mm per season) according to the Theil-Sen trend analysis for summer (DJF), autumn (MAM), winter (JJA) and spring (SON) based on the CRU TS 3.1 data set (1901–2009). Blue colours indicate a decreasing trend, red colours indicate an increasing trend, and white indicates pixels with no data. Statistically significant trends (95th confidence level) are stippled.
Observed changes in climate extremes The analysis of the weather station data indicate that the occurrence of warm extremes (Table 4) has increased and that the occurrence of cold extremes (Table 5) has decreased over Namaqualand. This is clearly demonstrated by the observed increase in the number of hot days (TX90P) and the corresponding decrease in the number of cool days (TX10P) for each weather station. Furthermore, all five of the weather stations demonstrated an increase in warm spell duration (WSDI), with those for Pofadder and Springbok being statistically significant. The duration of warm spells increased by 2 and 5 days per decade (p<0.05) at the Pofadder and Springbok stations respectively. For the Vredendal weather station, the monthly highest maximum temperature, the frequency of hot days as well as the number of days above 25 °C all increased significantly. The number of hot days increased by 2.5 days (p<0.05) and the number of hot days above 25 °C by 12 days per decade (p<0.05) at this station.
Figure 6: Observed trends in seasonal rainfall amounts according to the Mann-Kendall test for summer (DJF), autumn (MAM), winter (JJA) and spring (SON) based on the CRU TS 3.1 data set (1901–2009). The value represents the direction and the relative strength of the trend. Red colours indicate a negative trend and blue colours indicate positive trend. Statistically significant trends (95th confidence level) are stippled.
For Pofadder, the frequency of hot nights (TN90P) increased by 1.1 days per decade (p<0.05) and the frequency of warm nights (TR20) by 0.7 days (p<0.05), corresponding with a decrease in the frequency of cool nights (TN10P) of 1.7 days (p<0.05). This resulted in a reduction in the diurnal temperature range (DTR) at this station. For the other weather stations, the occurrence of hot nights (TN90P) decreased, resulting in an increase in the DTR most notably for the Springbok and Vredendal weather stations.
Evapotranspiration Evidence from the analysis of MOD16 ET from 2000 to 2010 indicates that changes in evapotranspiration have not been uniform across Namaqualand. During spring (SON) and summer (DJF), the trend in evapotranspiration was characterised by a steepening inland-coastal
South African Journal of Science
http://www.sajs.co.za
93
Volume 112 | Number 3/4 March/April 2016