Research Article Page 3 of 9
Recent trends in the climate of Namaqualand, South Africa
Trend Analysis
where a value of +1 indicates a trend that consistently increases and never decreases with the opposite being true for a value of -1. A value of 0 indicates no consistent trend.
Spatial trends in temperature derived from the CRU TS 3.1 data set (1901–2009) and evapotranspiration derived from the MODIS MOD16 ET (2000–2010) data set were examined by applying the Theil–Sen (TS) median slope estimator.42,43 This is a robust non-parametric trend operator which is unaffected by the presence of outliers.44 The Theil-Sen operator is determined by calculating the slope between every pair-wise combination and then assessing the median slope value. The result is a spatially-explicit expression of the rate of change per year in each of the climate variables, where pixels with negative (positive) slopes indicate areas that have experienced a decline (increase). The trend analysis was calculated for seasonal means. The four major seasons are DecemberJanuary-February (DJF), March-April-May (MAM), June-July-August (JJA), and September-October-November (SON). For comparison, trends in annual temperature and rainfall for each of the weather stations were computed.
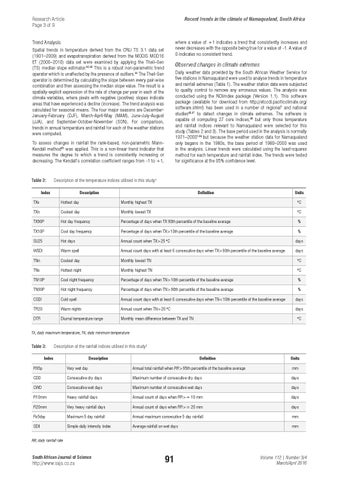
Observed changes in climate extremes Daily weather data provided by the South African Weather Service for five stations in Namaqualand were used to analyse trends in temperature and rainfall extremes (Table 1). The weather station data were subjected to quality control to remove any erroneous values. The analysis was conducted using the RClimdex package (Version 1.1). This software package (available for download from http://etccdi.pacificclimate.org/ software.shtml) has been used in a number of regional1 and national studies46,47 to detect changes in climate extremes. The software is capable of computing 27 core indices,48 but only those temperature and rainfall indices relevant to Namaqualand were selected for this study (Tables 2 and 3). The base period used in the analysis is normally 1971–20001,46 but because the weather station data for Namaqualand only begans in the 1980s, the base period of 1980–2000 was used in the analysis. Linear trends were calculated using the least-squares method for each temperature and rainfall index. The trends were tested for significance at the 95% confidence level.
To assess changes in rainfall the rank-based, non-parametric MannKendall method45 was applied. This is a non-linear trend indicator that measures the degree to which a trend is consistently increasing or decreasing. The Kendall’s correlation coefficient ranges from -1 to +1,
Table 2:
Description of the temperature indices utilised in this study1
Index
Description
Definition
Units
TXx
Hottest day
Monthly highest TX
°C
TXn
Coolest day
Monthly lowest TX
°C
TX90P
Hot day frequency
Percentage of days when TX 90th percentile of the baseline average
%
TX10P
Cool day frequency
Percentage of days when TX>10th percentile of the baseline average
%
SU25
Hot days
Annual count when TX>25 °C
days
WSDI
Warm spell
Annual count days with at least 6 consecutive days when TX>90th percentile of the baseline average
days
TNn
Coolest day
Monthly lowest TN
°C
TNx
Hottest night
Monthly highest TN
°C
TN10P
Cool night frequency
Percentage of days when TN>10th percentile of the baseline average
%
TN90P
Hot night frequency
Percentage of days when TN>90th percentile of the baseline average
%
CSDI
Cold spell
Annual count days with at least 6 consecutive days when TN<10th percentile of the baseline average
days
TR20
Warm nights
Annual count when TN>20 °C
days
DTR
Diurnal temperature range
Monthly mean difference between TX and TN
°C
TX, daily maximum temperature; TN, daily minimum temperature
Table 3:
Description of the rainfall indices utilised in this study1
Index
Description
Definition
Units
R95p
Very wet day
Annual total rainfall when RR>95th percentile of the baseline average
mm
CDD
Consecutive dry days
Maximum number of consecutive dry days
days
CWD
Consecutive wet days
Maximum number of consecutive wet days
days
R10mm
Heavy rainfall days
Annual count of days when RR>= 10 mm
days
R20mm
Very heavy rainfall days
Annual count of days when RR>= 20 mm
days
Rx5day
Maximum 5 day rainfall
Annual maximum consecutive 5 day rainfall
mm
SDII
Simple daily intensity index
Average rainfall on wet days
mm
RR, daily rainfall rate
South African Journal of Science
http://www.sajs.co.za
91
Volume 112 | Number 3/4 March/April 2016