Commentary Page 3 of 8
Institution
Rank
Exec
Rank
Instruct
Rank
NP Admin
Rank
Service
Rank
Spec
Rank
Technical
Rank
Crafts
Rank
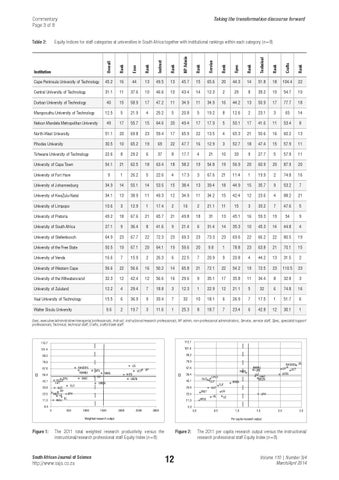
Equity Indices for staff categories at universities in South Africa together with institutional rankings within each category (n=8)
Overall
Table 2:
Taking the transformation discourse forward
Cape Peninsula University of Technology
45.2
16
44
13
49.5
13
45.7
15
65.6
20
44.3
14
51.8
18
104.4
22
Central University of Technology
31.1
11
37.6
10
46.6
10
43.4
14
12.3
2
29
8
39.2
10
54.7
10
Durban University of Technology
40
15
58.9
17
47.2
11
34.9
11
34.9
16
44.2
13
50.9
17
77.7
18
12.5
5
21.9
4
25.2
5
20.8
5
19.2
8
12.6
2
23.1
3
65
14
49
17
55.7
15
64.6
20
49.4
17
17.9
5
50.1
17
41.6
11
53.4
8
North-West University
51.1
20
69.8
23
59.4
17
65.9
22
13.5
4
65.3
21
50.6
16
60.2
13
Rhodes University
30.5
10
65.2
19
69
22
47.7
16
12.9
3
52.7
18
47.4
15
57.9
11
Tshwane University of Technology
22.6
8
29.2
6
37
8
17.7
4
21
10
33
9
27.7
5
57.9
11
University of Cape Town
54.1
21
62.5
18
63.4
18
58.2
19
54.8
19
56.9
20
60.9
20
87.9
20
9
1
26.2
5
22.6
4
17.3
3
67.6
21
11.4
1
19.9
2
74.8
16
University of Johannesburg
34.9
14
55.1
14
53.5
15
38.4
13
39.4
18
44.9
15
35.7
9
53.2
7
University of KwaZulu-Natal
34.1
13
38.9
11
49.3
12
34.9
11
34.2
15
42.4
12
23.6
4
88.2
21
University of Limpopo
10.6
3
12.9
1
17.4
2
16
2
21.1
11
15
3
33.2
7
47.6
5
University of Pretoria
49.2
18
67.6
21
65.7
21
49.8
18
31
13
45.1
16
59.3
19
54
9
University of South Africa
27.1
9
36.4
8
41.6
9
21.4
6
31.4
14
35.3
10
45.3
14
44.8
4
University of Stellenbosch
64.9
23
67.7
22
72.3
23
69.3
23
73.3
23
69.6
22
66.2
22
80.5
19
University of the Free State
50.5
19
67.1
20
64.1
19
59.6
20
9.8
1
78.8
23
63.8
21
70.1
15
University of Venda
16.6
7
15.9
2
26.3
6
22.5
7
20.9
9
20.8
4
44.2
13
31.5
2
University of Western Cape
56.6
22
56.6
16
50.2
14
65.8
21
72.1
22
54.2
19
72.5
23
110.5
23
University of the Witwatersrand
32.3
12
42.4
12
56.6
16
29.6
9
35.1
17
35.8
11
34.4
8
32.8
3
University of Zululand
12.2
4
29.4
7
18.8
3
12.3
1
22.9
12
21.1
5
32
6
74.8
16
Vaal University of Technology
15.5
6
36.9
9
33.4
7
32
10
18.1
6
26.9
7
17.5
1
51.7
6
Walter Sisulu University
9.6
2
19.7
3
11.6
1
25.3
8
18.7
7
23.4
6
42.8
12
30.1
1
Mangosuthu University of Technology Nelson Mandela Metropolitan University
University of Fort Hare
Exec, executive/administrative/managerial professionals; Instruct, instructional/research professionals; NP admin, non-professional administrators; Service, service staff; Spec, specialist/support professionals; Technical, technical staff; Crafts, crafts/trade staff.
EI
UNISA
UNISA
Figure 1: The 2011 total weighted research productivity versus the instructional/research professional staff Equity Index (n=8).
South African Journal of Science
http://www.sajs.co.za
WITS
EI
WITS
Figure 2: The 2011 per capita research output versus the instructional/ research professional staff Equity Index (n=8).
12
Volume 110 | Number 3/4 March/April 2014