
SYNTHESIS PROJECT
Group Members :
Ruchira Sardesai
Niyati Kale
Alec Harrigan

Region Under Consideration: Singapore
Software Used for Analysis : Climate Studio (Rhino)
Weather file: SGP_Singapore.486980 _IWEC
3. Psychrometric chart
ASHRAE Climate Zone Extremely Hot (0)
Heating degree days (64o F) 3,424
Heating design temperature 73o F
Cooling degree days (50o F) 1,573
Cooling design temperature 91o F


4. Hourly Heat Map of UTCI


Observation and Conclusions
Climate
• Singapore is located near the equator and it’s climate is classified as tropical rainforest climate with no true distinct seasons. It is a tropical city with warm and humid weather which has a dry and wet season with an average annual temperature of 80F where the temperature remains fairly constant throughout the year.
• The sun path diagram dictates two areas of sun cover where the summer months of March – August receive sun from the northern side and the remaining months get sun rays from the southern side.
• The skies are overcast most of the time and receive only 6hrs of sunlight on average. This reduces in the winter months where the average hours of sun reduces to 4.5hrs. The prevalent wind direction is the north-east and north.
Design strategies for Singapore’s Climate
• The basic requirement when designing a building in this climate is to reduce heat gain and maximize ventilation for cooling.
• Buildings should be designed with shading devices to reduce direct solar radiation and glare. Building orientation should be optimized to minimize east and westfacing glazing and take advantage of prevailing winds for natural ventilation. The building should be kept compact to minimize Surface/Volume ratio which would prevent heat gain and exposed surfaces.
• Thermal mass can be used to regulate the internal temperatures and appropriate placement of windows can aid cross-ventilation.
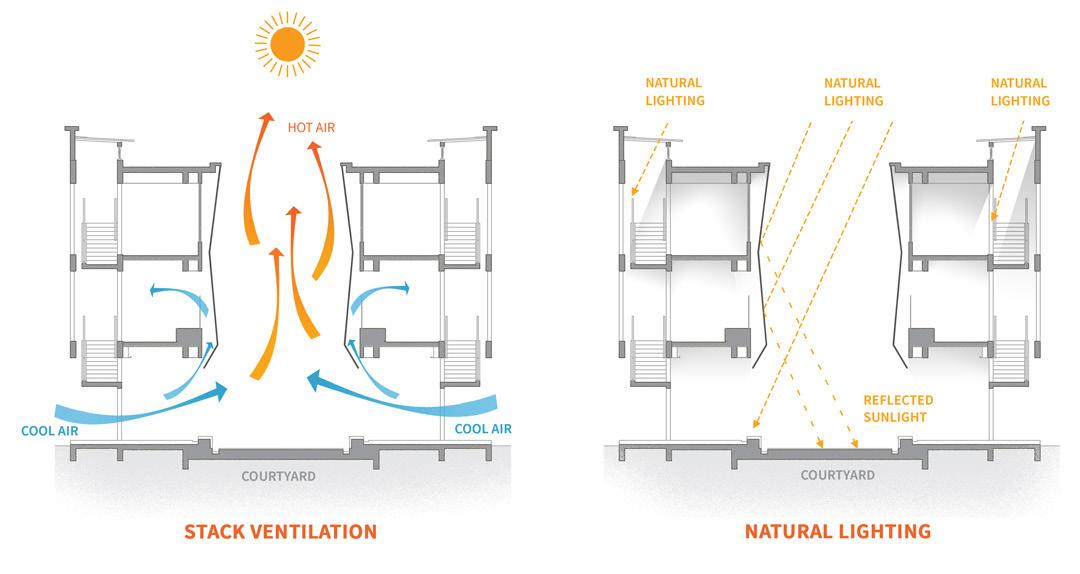
• Another strategy is use of courtyard which would draw in air or placing of a water body in the prevailing wind direction to bring in cooled air along with the breezes. Use of solar chimneys or wind catchers are traditional methods of cooling and ventilation which could be used too.
• Thus, a combination of these strategies while considering local surrounding conditions would result in a optimum building design for the climate of Singapore.
1. Singapore climate variable chart 2. Sun Path chart 2. Wind Rose chart B. Shaded and Wind protected A. Not shaded or wind protectedFirst Floor

Second Floor

Observation and Conclusions
Discussion of quantitative and qualitative daylighting conditions
• Starting with sDA, a total of 47.1% of the area meets target illuminance levels. This value is also influenced by the reflectivity of internal materials.
• The ASE here is 7.2% which is the amount of over lit areas due to sunlight which would cause discomfort. There is a need to reduce the % of these areas when looking to maximize daylight intake.
• The ASE directly corresponds to sDG which is the amount of disturbing glare received in a space. It is 8.9% over here which causes disturbance to the user.
First Floor

Second Floor

First Floor

Second Floor

Strength
There is a decent amount of daylight penetration which would allow the user to enjoy a naturally lit interior spaces and avoid artificial lighting which would eventually save money.
Weakness
The % of areas getting disturbing glare cannot be ignored. This type of glare and excess sunlight would render the natural lighting useless and force the user to resort to artificial lighting means for comfort.
Singapore, being located in a tropical climate region, experiences numerous overcast days that are ideal for utilizing natural light for daylighting. Therefore, it is essential to harvest natural light effectively to reduce the operational costs of lighting for users. Harnessing daylighting in buildings can help to optimize energy use, reduce dependence on artificial lighting, and provide a more comfortable environment for occupants.
Therefore, in a tropical climate like Singapore, it is crucial to prioritize the use of natural light for daylighting to maximize its potential benefits.
6. Baseline Model Showing Spatial Daylight Autonomy (sDA) Total baseline model sDA – 47.1% 7. Baseline Model showing Annual Sunlight Exposure (ASE) Total baseline model ASE – 7.2% 8. Baseline Model Showing Spatial Disturbing Glare (sDG) Total baseline model sDG – 8.9%9.


Observation and Conclusions
Observations
• The site EUI is 45 kBTU/sf. As per the energy flow chart, losses due to equipment are significant followed by the envelope infiltration losses. The EUI chart shows that cooling, lighting and equipment are the majority portion of energy usage in this region.
• As per the target finder results, average EUI is 55.7 kBTU/sf and the target EUI to get 80% better performance is 11.1 kBTU/sf.
• The PV production generated by 40% of roof area of the south side is 20,241.9 kBTU/yr. This was achieved by multiplying the annual solar radiation by the area of PV panels with an assumed panel efficiency of 17%. In total this produces 8.5% of the total target annual energy consumption
10. PV Production - Energy produced on site in the baseline design

11. Target EUI


Calculations
Annual energy output (kBTU/yr) = annual solar radiation for single PV (kBTU/sf2/yr) x area (sf2) of PV x 0.17(efficiency) = 486x245x0.17 =20,241.9 kBTU/yr
% of PV production = Estimated annual PV production (kBTU) / Target annual energy consumption (kBTU) = 20242 kBTU / 236430 kBTU = 0.085
Percentage of PV production is 8.5
Conclusion
• Based on the charts, it can be observed that a significant portion of energy loads in this region are attributed to cooling and lighting, as well as system and envelope losses. To address these concerns, it is important to carefully consider the design and implementation of passive strategies such as massing and shading, as well as energy modeling concepts, to develop effective solutions.
• One key area for improvement is reducing cooling loads, which can be achieved through strategies such as enhancing natural ventilation and minimizing solar heat gain within the building. These objectives may be accomplished through a range of approaches, including optimizing building orientation, incorporating shading devices, and incorporating vegetation.
12. Radiation Map Analysis and Massing Studies
Massing Option 1


Observation and Conclusions
Observations
Which massing options provide the best opportunities for passive design?
• Massing Option 4 with the courtyards provides the best opportunities for passive design. Compared to the other four options analyzed this configuration has both the least total solar exposure in all hours analyzed and warm hours. The total solar exposure in all hours is 405 kBTU/sf/yr and 393 kBTU/sf/yr in warm hours. Comparatively, the average solar exposure for the other four options in all hours was 443 kBTU/sf/yr and 430 kBTU/sf/yr for warm hours.
• While Option 4 remains the most effective design, Options 3 and 5 also showed significant improvement from Options 1 and 2.
Massing Option 3

Massing Option 5

13. Massing Analysis


Improvements for Option 4 (Design moves)
• The east/ west facades are shorter to prevent heat gain.
• Massing design promotes self-shading for branches which are forming offsets.
• Courtyards encourage cross-ventilation which is important in Singapore’s humid climate.
• Courtyards bring in increased natural light and establish an indoor-outdoor connection which is beneficial for user health.
• Narrow floor plates promote natural light penetration which reduces artificial lighting.
While Option 4 remains the most effective design, Options 3 and 5 also showed significant improvement from Options 1 and 2.


Therefore, taking into consideration all the analysis, option 4 is our preferred design module.


Observation and Conclusions
Observations
How productive might different PV schemes be? Can any PV schemes create a net-zero building?
Productivity of different PV schemes is based on several factors including PV efficiency, angle, location, and quantity. In the three analyses run, these factors were considered and designed to find the most productive scheme.
Scheme 1
• Scheme 1 is based on PV coverage of 40% of the roof area and PV’s are aligned in the North/South orientation.
• This orientation is ideal in Singapore to maximize the amount of solar energy received.
• Given the site’s location close to the Equator means the module’s compass orientation is not critical and laying the modules at a 20degree tilt will maximize exposure to the sun.
• In total there are 450 PV panels and the total solar exposure is 506 kBTU/sf/yr. The annual energy output is 709,493 kBTU/yr or 76.3% of the total target annual energy consumption.
Scheme 2
• Scheme 2 is based on PV coverage of 40% of the roof area, again with 450 panels, and PV’s are aligned to be parallel with the building’s orientation.
• As such, they are facing South-west, however, orientation is not too important. Rather, ensuring panels are at 20degrees is more critical for maximum efficiency.
• The total solar exposure is 505 kBTU/sf/yr, which is a marginal difference when compared with the ideal orientation.
• The annual energy output is 708,091 kBTU/yr or 76.2% of the total target annual energy consumption.
Scheme 3
• Scheme 3 is an attempt to get a net-zero building. It is identical to Scheme 2 with the exception of an additional 140 PV panels on the ground to the West of the building.
• Once again, the total solar exposure is 505 kBTU/sf/yr. The biggest change, however, is seen in the total annual energy output which is 928,468 kBTU/yr or 99.9% of the total target annual energy consumption.
Conclusion
• The main takeaways from the analyses are that angle of the PV is more important than orientation for the Singapore site.
• A couple analyses run with increased angle yielded lower kBTU/sf value indicating that 20degree is the ideal angle for maximizing the solar output.
• No rooftop PV schemes following the 40% maximum coverage will be able to create a net-zero building.
• Adding an additional 140 panels to the ground or increasing rooftop coverage is the only way to achieve this goal.
15.


Trial


No. Run Description SDA ASE UDI (Not Required)
1 Courtyard facing walls are all glazed. All windows are optigray(ar) which has 0.5 SHGC and 55% visible transmittance.
2 Glass changed from optigray (ar) to Solarban 90(2) on optibue – clear (krypton) with 0.18 SHGC and 36.3% visible transmittance.
3 Removed fully glazed facades from entry areas and replaced with walls containing eyelevel windows to reduce ase and excessive lux as seen in udi chart.
4 Skylight added where UDI was <100


5 Changed eye-level windows to clerestory in places like conference rooms where direct lighting isn’t required. Changed courtyard adjacent walls of full glazing to reduced glazing and optigray windows for better visibility.
6 Added more skylights to areas of low lux in corridors to remove areas falling below 100lux
Observation and Conclusions
Observations
Comments
87.8% 24.4% 53.3% Very high value of sda and ase. Trying to reduce sda and ase by using new window with lower SHGC and tvis
77.5% 21.8% 53.9% Fully glazed windows reduced in next run
68.6% 15.5% 53% Observation - Clerestory windows are capable of similar lighting levels as having a eyelevel window but doesn’t produce as much ase which is an advantage.
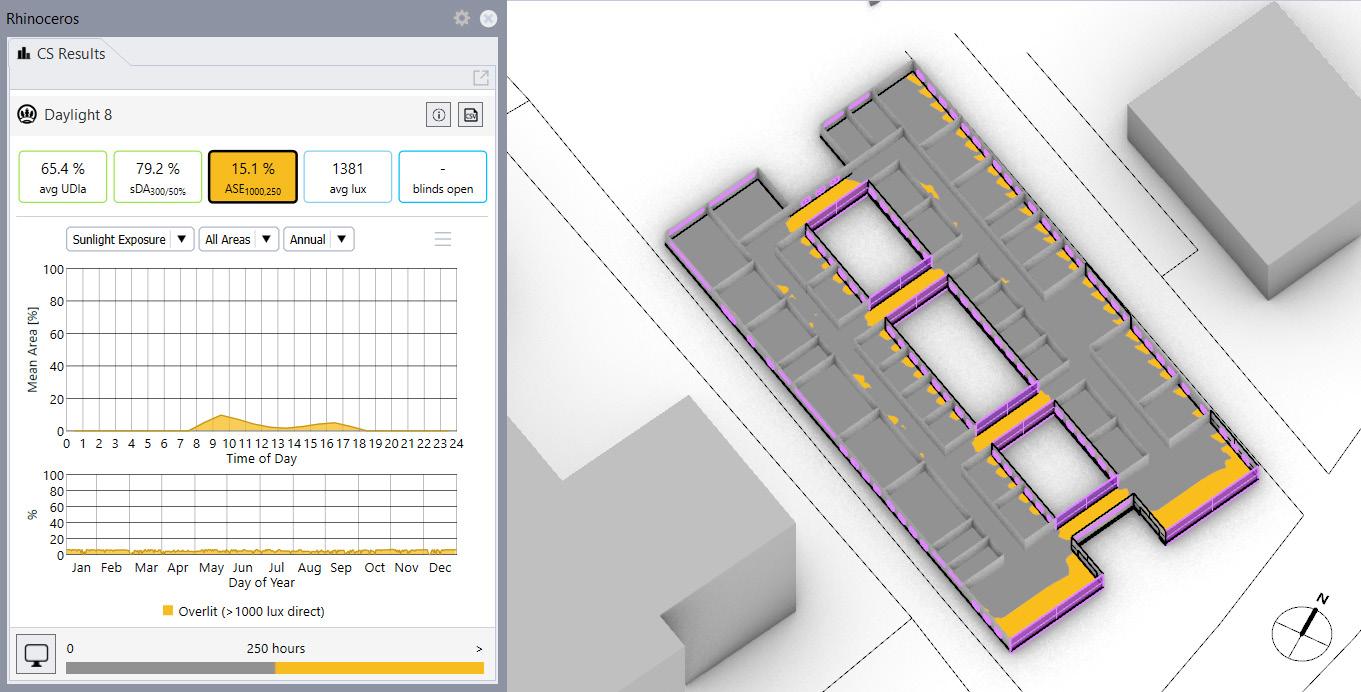
79.2% 15.1% 65.4% Skylight takes care of dimly lit corridors and brings it in the acceptable lux range
76% 12.7% 64.5%
New run shows other dimly lit areas and more skylights are added to cover those places
81.7 13.2% 69.9% SDA value is good. UDI is highest compared to all other runs. ASE can be taken care of using shading in further studies
Through six fenestration analyses, a range of results were collected and synthesized to create the optimal daylighting opportunity for the site. Three primary metrics were used in determining the quality of a design: SDA, ASE, and UDI. Additionally, the Solar Heat Gain Coefficient was considered given the hot humid climate of the site. The courtyards are useful in bringing in more natural light and promote cross ventilation for cooler interiors.
Key design interventions include:


• Utilization of Solarban 90(2) on optiblue – clear (krypton) with 0.18 SHGC and 36.3% visible transmittance. This change was necessary to reduce the visible transmittance and reduce the SHGC from the previously used optigray(ar) which has 0.5 SHGC and 55% visible transmittance.
• Focusing on eyelevel windows and clerestories instead of full height curtain walls to reduce ASE and excessive lux seen in the UDI charts.
• Results show that clerestory windows are capable of similar lighting levels as eyelevel windows with reduced ASE, however, views may be compromised.
• Addition of skylights where UDI was less than 100. Skylights were found to successfully illuminate dimly lit corridors with natural light and bring them into the acceptable lux range.
Conclusion
• Ultimately Fenestration Option 6 provides the most opportunity for daylighting and addresses the goal of achieving uniformly lit interior spaces.
• The glazing system is set to reduce SHGC, it has an SDA of 81.7% which is down 6.1% from the baseline, ASE is 13.2% which is down 11.2% from the baseline, and it has a UDI of 69.9% which is up 16.6% from the baseline. While different analysis runs produced more desirable SDA and ASE values, ultimately the most opportunity lies where all of the values are efficient and balanced.
• The results pair well with the massing of the interior spaces and allow the natural light to reach throughout all of the rooms. The effects of positive daylighting strategies like this will reduce the artificial lighting load and energy consumption of the building.
Energy Flow Chart Baseline EUI Baseline Chart

Observation and Conclusions
Observation

Based on the thermal analysis baseline, several factors are leading to a high Site EUI of 55 kBTU/sf. The primary areas of concern are envelope infiltration, energy transfer through windows, and equipment.
These three areas of concern take priority for reducing energy.
Reduce Envelope Infiltration:
Envelope infiltration is the biggest cause of heat gain in the building and addressing this is priority one. Several interventions can be used including increased insulation, utilizing reflective light-colored walls, and using a light reflective roof material.
Reduce Window Infiltration:
While part of the envelope, windows have their own specific solutions to infiltration. These can be passive solutions such as permanent shading and reflective films on the glazing or they can be active with shading and louvers which adjust based on need.
Energy Efficient Equipment:
The average temperature in Singapore is annually in the low 80’s Fahrenheit and thus requires year-round cooling. Addressing inefficient mechanical systems would reduce energy in a system that runs nonstop.
Final Thermal Zones


Observations
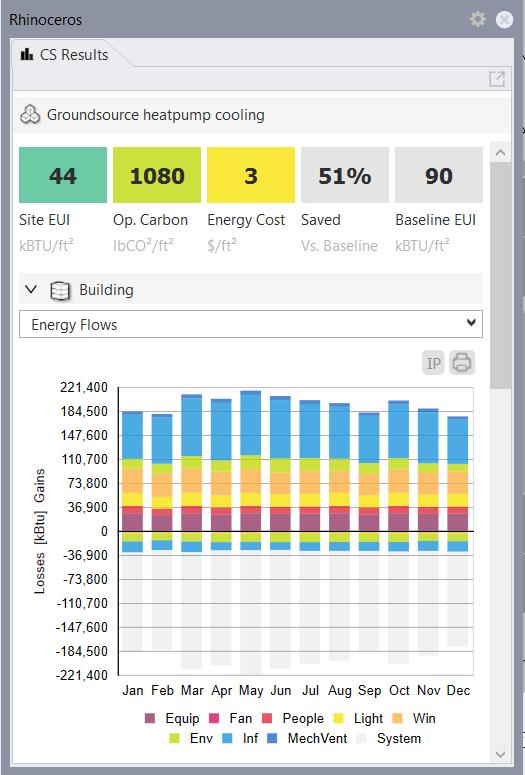
Observation and Conclusions Groundsource cooling EUI 3. Watercooled Chiller EF 2. Package Rooftop EF 1. Baseline EF 4. Airsource heatpump AC EF 5. Groundsource cooling AC EF System type Heating COP Cooling COP Site EUI Operational Carbon Energy Cost EUI relative to baseline
• After analyzing the packaged rooftop unit, water cooled centrifugal chiller, air sourced heat pump, and ground sourced heat pump, the ground sourced heat pump is the most efficient.
• The packaged rooftop unit and the air source heat pump are unrealistic with infeasible simple paybacks, high operational carbon, and energy costs, especially when compared to the centrifugal chiller and ground sourced heat pump.
• The centrifugal chiller and ground source heat pump both have low simple payback times of 23 and 20 years respectively as well as low operating costs.
• Additionally, they maintain similarly low site EUI’s of 48 and 44 and high cooling COPs of 4.5 and 5.5. Conclusion

AC EUI Annual Operating Cost

Annual Operating Cost SAVINGS System cost Simple Payback (unitless) (Unitless) kbtu/sf lb CO2/sf $/sf % $/yr $/yr $ Years 1 Baseline 0.81 3.4 55 1150 $2.59 $53,357 $122,000 2 Packaged rooftop unit 0.81 2.75 62 1193 $2.91 -13% $60,148 -$6,791 $122,000 -18 3 Water cooled centrifugal chiller 0.81 4.5 48 1105 $2.26 13% $46,566 $6,791 $154,480 23 4 Airsource heat pump 0.81 3.5 54 1144 $2.54 2% $52,387 $970 $168,480 174 5 Groundsource heat pump 0.81 5.5 44 1080 $2.07 20% $42,686 $10,671 $214,960 20
Run description
Wall (u-value) - 0.083
Roof (u-value) - 0.031
EUI - 44
Comments -
Basic envelope and roof value

Run description
Wall (u-value) - 0.081
Roof (u-value) - 0.025
EUI - 44
Comments -
Mineral wool value increased to 0.25, u-value achieved – 0.081. XPS board size increased – 0.025 u-value achieved. EUI is the same.
Observation and Conclusions
Observations
Given the location in Singapore, the building envelope should be optimized in a couple of ways. First, the temperature is hot year-round as it is in Climate Zone 0.
The proximity on the equator also plays a role as the angle of the sun is quite high leaving the roof exposed to increased solar gain. Because of this the building envelope should be optimized to reduce heat gain through the roof.
Alterations can be made to the exterior walls and glazing should have low SHGC to avoid heat infiltration through the windows.
• A typical wall assembly in Singapore would be concrete/brick wall with plaster/ stucco on interior and exterior. Roof used is concrete with xps board and felt on top. This combination gives us an EUI of 44 (Assembly 1)
• Adding mineral wool for insulation between the interior plaster and concrete wall reduces the overall u-value. Adding acoustic tile to the roof assembly increases the roof R-value. Increasing the mineral wool thickness and XPS board thickness gives us lower façade and roof u-values. Again, these changes yield no new results (Assembly 3)
• Changing the glazing type to one with lower SHGC resulted in a EUI of 43. Using Solarban 90(2) on optiblue - clear (krypton) and Vistacool on pacifica – clear (argon) significantly reduced the SHGC values consequently reducing thermal loads. (Assembly 5)
• Addition of insulation board to the façade and air gap(1’) between the concrete roof and acoustic tiles reduced the u-values significantly. An EUI of 42 was achieved by these changes. (Assembly 6)

Run description
Wall (u-value) - 0.068
Roof (u-value) - 0.019
EUI - 43
Comments -
Changing glazing from optigrey clear to solarban 90(2) on optiblue - clear (krypton) and courtyard glazing to Vistacool on pacifica – clear (argon)

Run description
Wall (u-value) - 0.016
Roof (u-value) - 0.009
EUI - 42
Comments -
Adding insulation board in the wall makes the u-value drop to 0.016, Adding air gap between the ceiling tiles and concrete forms a buffer and makes the U-value 0.009
Conclusion
Changes made to the interior partitions and ground slab u-values weren’t useful in reducing the EUI.
Increasing the roof air gap to 2’, adding wood shingles with backer and insulation and increasing the wall insulation thickness did not create any more difference in the EUI either.
Hence, the façade assembly with 0.1’ stucco, 0.75’ concrete wall, 0.3’ mineral wool, 0.82’ insulation board and 0.043’ plaster (u-value - was finalized. The roof is made up of 0.01’ vaporpermeable felt, 1’ XPS board, 0.66’ concrete wall, 1.5’ air gap and 0.2’ of acoustic tiles (u-value – 0.009)


Observation and Conclusions
Observations
Daylighting can be improved by reducing glare for users while maintaining useful natural light infiltration. In the analysis trials runs, various design interventions were used to reduce the glare within the building. Run 1 utilized no shading and the glazing system had a visible light transmittance of 50%. In conclusion, the analysis yielded 11.7% sDG.
To reduce this, subsequent trials implemented the following:
• Reducing tvis of windows resulted in a lower sDG which had scope for improvement. Location specific glazing allows for more control over the light entering the space. The skylights and East facing façade utilize Solarban 70(2)
• on Pacifica- Pacifica(krypton) and have a low tvis of 15% and SHGC of 0.16. The other façade windows utilize Solarban 70(2) on Solargray – clear and have a tvis of 33% and SHGC of 0.19 (Run 2 & 3)
• Introduction of both horizontal and vertical shades on the facades. Run 4 utilized shades with a high reflectivity which worsened the glare problem. Therefore, shades are finished with low reflectivity materials such as aluminum grey overhang with a reflectance of 20% in the next run.
• Changing reflectivity of floor and ceiling materials along with introduction of trees are useful in reducing glare and blocking direct sunlight respectively(Run 5)
Conclusion
After adjusting the model to reflect updated glazing and shading devices, the final the analysis yielded an 8.3% sDG which is a 3.4 % decrease from the baseline.
Plan


Scale - 1/32” = 1’

North-West Elevation
Scale - 1/32” = 1’

Section A-A’
Scale - 1/32” = 1’
South-West Elevation
Scale - 1/32” = 1’
22. Final Proposal
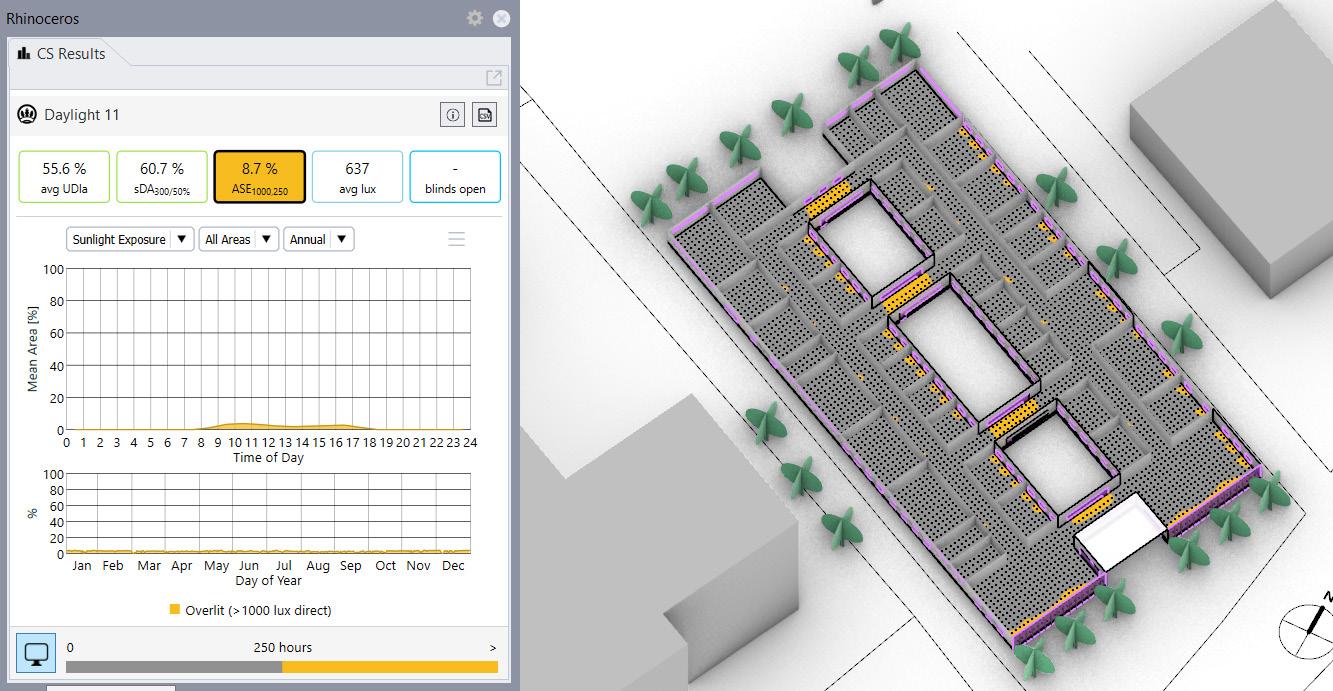
Final UDI

Final SDA

SDA, ASE, SDG analysis
Analysis shows good value of SDA and UDI. ASE is also low compared to previous runs. The major contributing factors here are SHGC and visible transmittance values of glazing.
Different window types are used for façade windows, skylights and internal courtyard windows such that it serves the rooms purpose and also helps in optimum illumination of interiors. All the materials used are mentioned in the adjecent image
Courtyard windows have high tvis (50%) for visual connection, skylights have low tvis(15%) and SHGC to tackle glare problem and heat gain problem respectively, façade windows have low SHGC and decent level of tvis(36%) for daylight penetration.
sDG analysis
Glare value is in double digits without shading devices. Hence, fins and overhangs are introduced on east and north+south façade respectively. This was done after experimenting with window types – changing tvis and SHGC values. Final glare value after run is 8.3%
Final ASE
Final sDG


Close up of shading devices

Close up of shading devices internal courtyard

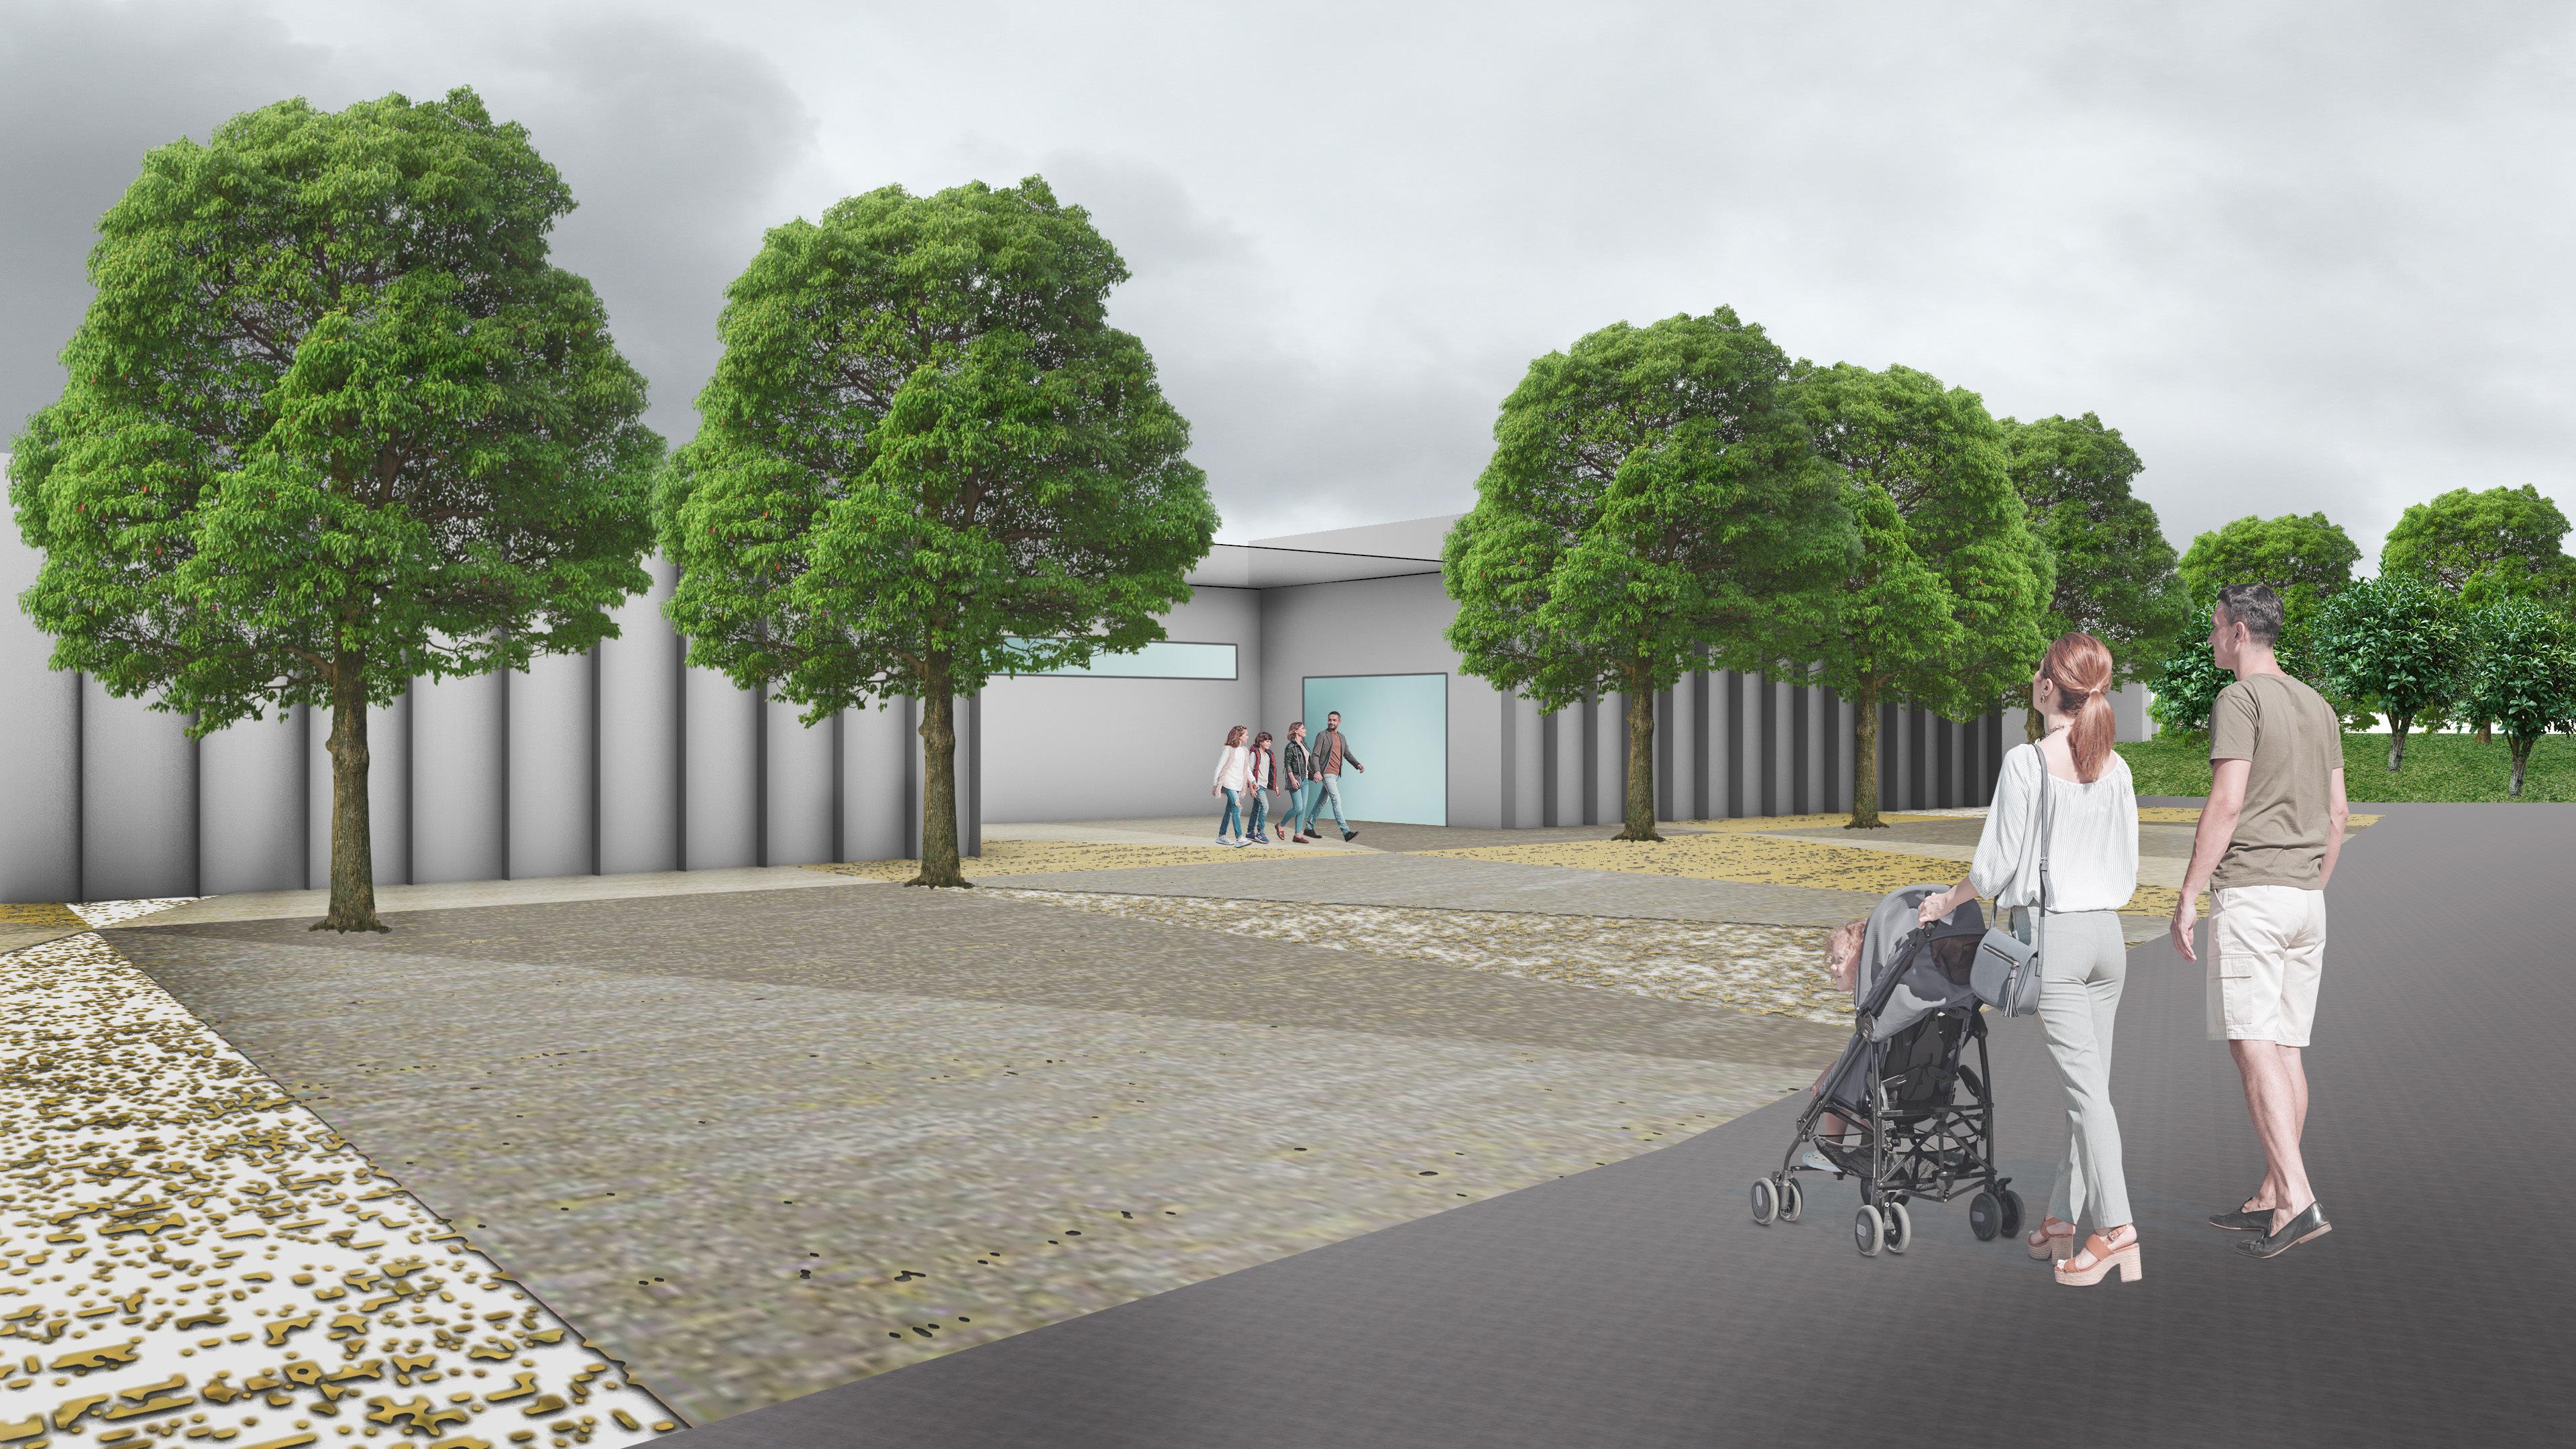
Courtyard reference
22. Final Proposal
1. Final Energy Use

3. Final EUI

Energy flow analysis (thermal analysis)
2. Final Energy Flows


To make building 80% better we are establishing design target using target finder
Target finder analysis–
Building type – Medical office
Target – 80% better than median source EUI
Gross floor area – 20641 sq.ft
Design target – 17.8 kBTU/sf
The final run yields an EUI of 42kbtu/sf compared to 55kbtu/sf of baseline Operational carbon is 1068
Radiation analysis
1. Radiation Mapping without PV
2. Radiation Mapping with pv (skylights are getting covered)
3. New PV position according to skylight (final)
Analysis run without pv yielded a result of 373kbtu/sf for all hours. The pvs on rooftop shade the roof and also reflect the sun rays which results in a lower all hours value – 288 kbtu/sf
Final Thermal zones

Radiation Mapping with no PV

Radiation Mapping with PV

Radiation Mapping with Optimized PV


Conclusion
As per target finder, 17.8 needs to be achieved. We have a final value of 42 after optimizing SDA, ASE, SDG, Thermal load considerations, mechanical systems and envelope. The baseline was 55 and after optimization it dropped to 42. Any more changes to envelope or glazing are not yielding any significant reductions in EUI, hence, finalizing this value.
23. Proposal Summary
The Climate Zone 0 designation of Singapore indicates it’s hot and humid climate with very little temperature variation throughout the year. This year-round heat gives design opportunities but also creates certain challenges for designers and projects in the region. The first step in creating an energy efficient and sustainable project is to focus on passive design techniques and then work on optimizing active systems. Throughout the synthesis project for Environmental Systems 3, our team collaborated on several areas of design to achieve a highly effective and sustainable design.
Key elements in the design approach include:
• Optimization of the building design through comparison of massing options, ultimately choosing massing with the lowest incident radiation. Factors such as reduction of building size, reduced east/west exposure, and narrowed floor plans were introduced and led to a highly effective massing layout.
• Introduction of features such as the courtyards help to draw out hot air through passive ventilation and increase natural light penetration to interior space.
• Internal planning is developed to maintain a visual connection with the outside world while giving respecting privacy requirements of certain program elements.
• Through daylighting analysis trials, fenestration was optimized to reduce excessive lighting conditions in over exposed areas and increase natural light in an effective manner where it was too dark. Different types of glazing systems with varied SHGC’s and visual transmittance values were analyzed to optimize the interior lighting conditions.
• Problem conditions concerning glare and over lit areas were corrected by designing shading systems to match the sun path and through an introduction of trees.
• Various types of mechanical systems were analyzed to determine which provides the best cooling while also being energy and cost-efficient.
• A selection of envelope assemblies was tested to decide which option reduced the thermal load and infiltration the most. A primary focus was the roof given the site’s location in Singapore, the sun’s high altitude, and the high solar exposure it receives as shown in analysis trials.
The final proposal provides for a highly efficient building with both benefits and drawbacks:
Pros
• The proposal implements many passive design strategies which reduce energy consumption and artificial lighting. Strategies include skylights, clerestory, and eye level windows for lighting, trees and fixed elements for shading, and a layout with interior courtyards for passive ventilation.
• Environmental systems are designed to be low cost, low energy, and low carbon. Systems include ground source heat pumps, photovoltaics, high efficiency lighting, and treated windows to optimize natural light for effective interior use.
• The building envelope is optimized to reflect excessive solar radiation and keep the interior spaces with a cool temperature. The location near the equator necessitates roof optimization given the high angle of the sun and its large amount of solar gain.
Cons
• The massing of the building is set up to include courtyard spaces. As a result, there is a larger building footprint which reduces exterior space and could potentially run into zoning issues with setbacks. Additionally, this design may not be ideal in a densely populated urban area.
• Despite the long-term benefits of a ground source geothermal cooling systems such as the one utilized in this project; short term drawbacks exist. These systems require an invasive and disruptive installation process and are custom designed and installed by a highly trained team compared to other cooling systems which raise initial costs. Additionally, they require extensive and accessible ground space for the thermal wells.
• The prosed building and its size do not relate to the surrounding context in terms of architectural aesthetic or square footage. This may go against plans for growth in the neighborhood, especially if the university is growing. Optimization of land use in Singapore is very important as its population is expected to increase from 5.6 to 6.9 million people by 2030, despite only have a land mass that is three fifths the size of New York City.