
Contents
Glossary
Introduction
Selecting corn conversion factors
Identifying sources
Assessing sources (where relevant)
Selecting sources for use by RTRS
Calculating whole corn equivalent
1. Demand allocation
2. Economic allocation
Key references
APPENDIX 1 – Austral University study
APPENDIX 2 – Public available sources of conversion factor data
Livestock feed conversion factors
i. Broiler poultry
Laying poultry
Dairy cattle
Beef cattle
Swine
Salmon
Livestock product conversion factors
Chicken
Egg
Milk and other dairy products
Beef and beef gelatine
Pork
Salmon
Manufactured product conversion factors
i. Popcorn
Corn cereal
Whisky
APPENDIX 3 – Data source quality review – FAO (2013)
ii.
iii.
iv.
v.
vi.
i.
ii.
iii.
iv.
v.
vi.
ii.
iii.
2 2 9 12 14 16 18 9 12 14 9 12 14 14 14 14 12 14 14 14 14 12 14 14 14 14 12 14 14 14 14 12 14 14 14 14 ROUND TABLE ON RESPONSIBLE SOY ASSOCIATION (RTRS) — 2
Glossary
Byproduct: A material derived from the processing of a product, which does not drive the production of that product, usually due to its low economic value.
Compound feed: Food given to animals raised in an agricultural setting, which contains a number of raw materials and is formulated to fit the nutritional requirements of the animal which will consume it.
Corn product: A material which is derived from the growing and processing of corn or maize, including cornmeal, corn oil, corn syrup and corn flour.
Corn conversion factor: Proportion of corn used in the production of a product.
Corn footprint: Physical volume of corn used in the production of a product.
Feed Conversion Ratio (FCR): The volume of feed required to produce a unit of livestock product output.
DDGS: Dried distiller grains with solubles are a product of ethanol production and can be used.
Livestock feed: Food, including compound feed, given to animals raised in an agricultural setting.
Livestock product: A food stuff which is derived from the body of an animal raised in an agricultural setting, such as meat, fish, eggs, and milk.
Maize product: See corn product.
Manufactured products: A product consumed or used by humans that uses one or more corn products or livestock products as an ingredient.
Whole corn equivalent: If a volume of corn product is expressed in whole corn equivalent, it is expressed in terms of the approximate volume of whole corn, or corn kernels, that the volume of corn product is equivalent to.
Whole corn: Whole corn and corn kernel are used interchangeably within this document.
ROUND TABLE ON RESPONSIBLE SOY ASSOCIATION (RTRS) — 3
Introduction
The Round Table on Responsible Soy Association (RTRS) is a not-for-profit and multistakeholder organisation promoting the growth of production, trade and use of responsible soy globally. Working with representatives of the soy supply chain and civil society from around the world, it sets the standards for responsible soy and chain of custody. In particular, the RTRS Standard for Responsible Soy Production scheme ensures that RTRS soy not only meets the highest environmental criteria but also a wide-reaching set of social and labour requirements.
The RTRS Standard for Responsible Soy Production is applicable worldwide, and additionally, continuous contact with producers confirmed the importance of creating synergies and opportunities to extend soybean certification to other grains, oils and seeds, mainly corn, a crop that is commonly included in the rotation with soy.
Therefore, launched in December 7th 2021, the RTRS Standard for Responsible Corn Production is an add-on to the existing soybean standard:
• Many of the requirements provided for in the soy standard are applicable to corn and that is why the integration of a soy/corn certification system is feasible.
• Soybean rotation with corn prevents soil erosion, helps maintain soil quality and improve soil fertility, and is a practice that the farmer must comply with to achieve soybean certification.
• It also enables capitalizing on sustainability gains resulting from certifying soy and a sustainable production process by extending soy certification to corn.
• It enables producers expanding the supply of crops produced in a responsible manner.
Therefore, as the new RTRS Standard for Responsible Corn Production is rolled out in practise, it is important that organisations can understand which of their products may have an associated corn footprint and how significant this is.
Corn is the most important cereal in terms of production globally, and the second most relevant in terms of planted area. Similarly to soy, corn has a wide range of uses including animal feed, biofuel and use as an ingredient in food products. Users may buy composite products that are premixed with corn (e.g., compound feed) or products with an embedded corn footprint (e.g.,meat, dairy, eggs). This means that the corn is not always visible in the final product or used directly in the product manufacturing process, reducing visibility of usage in supply chains. It may therefore be necessary to use conversion factors in order to estimate the equivalent volume of corn used to produce the products.
There is currently no resource available offering a comprehensive list of conversion factors for corn, but there are a number of studies available identifying information which can be used to collate conversion factors for different products or a selection of products. At the request of RTRS, 3Keel has used publicly available information and guidance from industry experts in order to calculate conversion factors to be used in a RTRS Corn Footprint Calculator which will allow the corn sector, organisations and consumers in general to determine the corn footprint of their products.
Each product may require one or more separate corn products in their production. As outlined by Austral University (see Appendix 1), each of these corn products have different characteristics
ROUND TABLE ON RESPONSIBLE SOY ASSOCIATION (RTRS) — 4
and economic values, so an allocation method is required in order for conversion factors to be addressed in terms of whole corn equivalent, thereby showing how much of a given crop is needed for production.
Two conversion factors are presented based on the way in which corn demand can be understood to occur:
Economic Allocation – Under this method it is recognised that there are multiple uses of corn and any one use will have associated corn products that will be applied in other sectors. The allocation method therefore occurs by aligning the demand to value of the various outputs to fairly represent how corn demand is not always driven by one particular output.
Demand Allocation – Under this method the physical volume of the corn needed to supply enough materials for the coproduct is presented. This does not account for the use of any by/ sub-products from the manufacturing process.
Conversion factors based on these allocations are given in the tables below and used in the calculator. These are based on the research outlined in the technical supporting documents, as well as the allocation method outlined in this document. Unless otherwise stated, the conversion factor gives the whole corn equivalent footprint for a product regardless of where it is produced.
Due to possible fluctuations in corn prices which may have an impact on conversion factors expressed as whole corn equivalent using the economic allocation, this document is subject to update periodically.
tonnes soy per tonne of product
Type Product Whole corn equivalent (economic)
Corn product
DDGS Brewery grits Maize flour
Hominy feed Corn silage Dextrose anhydrous Dextrose monohydrate
Crude
Maltodextrins Regular maltose corn syrup
Whole corn equivalent (demand)
3.344 1.923 14.286 2.564 2.000 1.621 1.490 15.873 28.571 1.340 5.988 27.027 1.175 1.241 1.307 35.714 1.618 1.333 1.610
Universidad Austral
Universidad Austral
Universidad Austral
Universidad Austral
Universidad Austral Universidad Austral
Universidad Austral
Universidad Austral
Universidad Austral Universidad Austral
Universidad Austral
Universidad Austral
Universidad Austral Universidad Austral
Universidad Austral
Universidad Austral
Universidad Austral Universidad Austral Universidad Austral
Primary source 2.090 1.299 2.433 0.395 1.000 1.337 1.151 0.796 0.590 1.213 0.306 1.468 0.912 0.937 0.982 2.320 1.275 0.996 1.146
Germ Germ meal Glucose syrup Gluten feed Gluten meal HFCS 42 HFCS 55 High-maltose corn syrup
corn oil
Starch
ROUND TABLE ON RESPONSIBLE SOY ASSOCIATION (RTRS) — 5
Type Product
tonnes soy per tonne of product
Whole corn equivalent (economic)
Whole corn equivalent (demand)
Primary source
Livestock feed
Cattle (Beef)
Cattle (Dairy)
Farmed fish (Salmon)
Poultry (laying)
Poultry (meat)
Pork
Livestock product (carcas weight)
Livestock product (retail weight)
Beef Pork Chicken
Farmed fish (salmon)
Beef Pork Chicken Farmed fish (salmon)
Eggs Milk Butter Cheese Chocolate Yoghurt Cream Gelatine
Corn based produc
Popcorn Corn cereal Whisky (bourbon)
Soft drink (US only)
Cooking oil (corn)
Potato chips
Ketchup Glue (corn germ based)
0.344 0.212 0.012 0.440 0.517 0.495 0.690 0.908 0.898 0.108 2.320 0.290 0.185 0.024
8.873 2.085 1.448 0.014 5.760 3.061 1.646 0.016 1.010 0.249 1.657 1.246 0.373 0.274 0.748 0.066
20.582 2.402 3.781 0.273 13.360 3.526 4.298 0.312 1.010 0.279 1.853 1.393 0.417 0.307 0.836 0.153
0.799 0.237 0.228 0.440 1.350 0.571 0.690 0.908 0.898 0.143 35.714 4.464 0.246 0.476
Blezinger (2003) and Roman et al. (2011)
FAO (2014)
Barents Watch (2016)
FAO (2013)
FAO (2013) and Baker & Chung (1992)
FAO (2014)
DEFRA (2010)
FAO (2013)
FAO (2013)
FAO (2017)
DEFRA (2010)
FAO (2013)
FAO (2013)
FAO (2017)
FAO (2013)
FAO (2014)
FAO (2014) FAO (2014)
FAO (2014)
FAO (2014)
FAO (2014)
DEFRA (2010) and Gac et al.
Multiple sources
Multiple sources
Multiple sources
Multiple sources Multiple sources
Multiple sources
Multiple sources
USDA (2008)
ROUND TABLE ON RESPONSIBLE SOY ASSOCIATION (RTRS) — 6
Selecting corn conversion factors
3Keel has developed a structured review process to identify the most appropriate factors for RTRS based on the need to have a single set of global factors applicable to users.
The three-step process is described in greater detail in this section:
Identify Suitable Sources
Identifying sources
Scoring Factors (livestock feed and products only)
Recomend Factors
Searches were conducted using Academic Search Complete, Google Scholar and Google Search. The following search terms, as well as the names of the products to be included in the calculator, were used in a variety of combinations in order to find an initial selection of literature. In addition, retailer and brand names were used to find sources for manufactured products.
Corn Maize1
Conversion factor
Calculations
Animal feed Corn usage Maize usage Conversion rate Feed conversion ratio Feed composition % in feed Feed efficiency ratio
Feed formulation
How much corn DDGA uses Embedded Measuring Feed Animal feed Footprint
Impact Aquaculture Europe Ingredients
When reviewing the results returned from each search, the short summary shown by the search engine was reviewed and a judgement was made as to whether the source was relevant and contained either a corn conversion factor or information which could be used to create a corn conversion factor. Each source was then reviewed to determine if it contained relevant information. Some sources which did not include numerical data were also identified as relevant because they contained information on the type of corn products contained within the product.
1 Although ‘corn’ and ‘maize’ are referring to the same product, search terms included both product names to ensure that all relevant sources were identified.
ROUND TABLE ON RESPONSIBLE SOY ASSOCIATION (RTRS) — 7
Scoring sources (where relevant)
A scoring method was created for livestock feed and livestock product conversion factors, with a system of scoring from 1-4 to provide a more objective way of determining the appropriate source. Sources for manufactured products were not scored because recipe specifications were typically used, and the scoring criteria would not apply in these cases.
Scores were given for the following indicators for each data source:
• Transparency of method – a number of sources did not explain their method, whilst some excluded important components or assumptions describing their approach. These sources could not be scored for reliability of method as this could not be assessed.
• Reliability of method – whether the use of the data and calculations made are judged to be conducive to accurate conversion factors.
• Geographical applicability – whether data used covers a wide range of countries or is more specific.
• Source credibility - whether the source has come from a reputable organisation or institution, and/or had undergone a peer review process before publication.
Due to the wide number of sources scored, detailed quality reviews have not been written for every source. However, further details are available in the appendices 2 and 3, including a data source quality review for the most widely used source (FAO, 2013).
Selecting sources for use by RTRS
When selecting a factor for use in the calculator, one of two methods was used:
1. Single factor selection: For some product types, one source scored significantly higher than other sources. In these cases, or when only one factor was available, this factor was selected for the RTRS calculator.
2. Average: Where no source scored significantly higher than the others, a mean average of up to five sources available was used. Due to the nature of available sources for manufactured products, this method was most commonly used to find factors for manufactured products as opposed to feed for livestock.
ROUND TABLE ON RESPONSIBLE SOY ASSOCIATION (RTRS) — 8
Calculating whole corn equivalent
Conversion factors found from the existing literature showed that many livestock feed products use multiple corn products in their production. Each has their own specific qualities and uses, so the factors within the RTRS calculator do not weight each equally but go beyond this to reflect the differences between each corn product.
To address the matter of what is a byproduct – and thus a driver of corn production – two different footprints are provided.
1. Demand allocation
The demand model for allocation of corn products is useful for understanding demand when a corn product makes up only a small proportion of the output of the processing of corn, but a large quantity of corn kernels are required. This approach shows the actual commodity demand and is helpful in illustrating the actual volume of corn that needs to be produced to produce the corn product
To inform the whole corn equivalent for different corn products, a model on the volumes of corn products produced per 1 tonne of whole corn was commissioned by RTRS to Austral University. The outputs from this model were used to calculate whole corn equivalent for each corn product by dividing 1 by the volume of corn product which can be obtained after processing one unit of corn kernels.
A user of the calculator may wish to use this model because it shows a clear link to how much corn is needed to produce a given corn product. It is important to note that this model may be seen to show a disproportionately large demand requirement for both low value products (e.g. hominy feed) or those that produce very little product on a per whole commodity basis (e.g. corn gluten meal). It also does not consider the value of other parts of the commodity which can be used after processing. This is a key difference between the demand and economic allocation model.
There are three key different manufacturing processes for corn: dry milling, wet milling and ethanol dry milling. Each of these produces a distinct set of corn products, as outlined by Austral University (2021). The below table shows the whole corn requirement for the products produced as outputs from the three processes.
ROUND TABLE ON RESPONSIBLE SOY ASSOCIATION (RTRS) — 9
Corn product
Whole maize
Germ
Crude corn oil
Germ meal
Gluten feed
Gluten meal
Starch
Maltodextrins
Glucose syrup
Dextrose anhydrous
Dextrose monohydrate
Regular-maltose corn syrup
High-maltose corn syrup
HFCS 42
HFCS 55
Brewery Grits
Maize flour
Hominy feed
Carbon-dioxide (CO2)
Hydrous Ethanol (96%)
Anhydrous Ethanol (99,5%) Fuel Ethanol
Ethanol (96%)
DDGS (10%)
Tonnes corn product per tonne whole corn
1.00 0.06 0.03 0.04 0.17 0.04 0.62 0.62 0.75 0.62 0.67 0.75 0.77 0.85 0.81 0.52 0.07 0.37 0.30 0.32 0.31 0.30 0.30
2. Economic allocation
Tonnes whole corn equivalent per tonne corn product
1.00 15.87 35.71 28.57 5.99 27.03 1.61 1.62 1.34 1.62 1.49 1.33 1.31 1.18 1.24 1.92 14.29 2.70 3.33 3.11 3.20 3.31 3.34
Two principles sit behind the economic model of allocation of corn products:
1. Corn production is driven by the corn products which have the highest share of the value of production outputs from one tonne of corn
2. The whole corn equivalent of all the products derived from one tonne of whole corn should sum up to one tonne of whole corn equivalent.
To inform the model, information on how much of each corn product can be produced per tonne of corn kernel was used from the Austral University model. A number of different sources were used to provide an economic value for each product, as shown in the table below.
ROUND TABLE ON RESPONSIBLE SOY ASSOCIATION (RTRS) — 10
Corn product Source $ / t corn coproduct $ / t corn kernel after processing t whole corn equivalent per t coproduct
Germ
Crude corn oil
Germ meal
Gluten feed Gluten meal
Starch
Maltodextrins
Glucose syrup
Dextrose anhydrous Dextrose monohydrate
Regular-maltose corn syrup
High-maltose corn syrup
HFCS 42
HFCS 55
Brewery Grits
Maize flour
Hominy feed
Carbon-dioxide (CO2)
Hydrous Ethanol (96%)
Anhydrous Ethanol (99.5%)
Ethanol (96%)
DDGS (10%)
Johnston et al. USDA
Johnston et al.
LMC International USDA
LMC International Echemi USDA Echemi Echemi
Sugar and sweetener guide Sugar and sweetener guide LMC International LMC International Trade India and India Mart Tridge Sharma et al. Reuters Financial Times Financial Times Financial Times Agfax
0.80 2.32 0.59 0.31 1.47 1.15 1.28 1.21 1.34 1.15 1.00 0.98 0.91 0.94 1.30 2.43 0.40 0.55 0.67 0.67 0.68 2.09
The method for calculating whole corn equivalent using the economic allocation is shown using the equation below. The value of outputs after processing of one tonne of corn kernels varies depending on the corn product because the outputs may vary depending on the production process used, as shown in Figure 1.
Whole corn equivalent of corn product =
Value of one t corn product
Value of output after processsing one t whole corn
The use this model recognizes the value of different corn products used. It is also important to note that this model could impact on demand requirements for corn when high value outputs are not demand drivers.
314 986 251 130 624 323 488 1039 620 410 320 320 330 310 275 515 84 61 74 74 74 231 20 28 9 22 23 201 302 775 383 275 240 245 281 250 143 36 33 18 24 23 22 69
ROUND TABLE ON RESPONSIBLE SOY ASSOCIATION (RTRS) — 11
Key references
Abioja et al. (2012) Growth, Mineral Deposition, and Physiological Responses of Broiler Chickens Offered Honey in Drinking Water during Hot-Dry Season, International Journal of Zoology, 2012(2), pp. 1-6. Available at: https://www.hindawi.com/journals/ijz/2012/403502/.
Agfax (2021) DDG market update. Available at: https://agfax.com/2021/01/25/ddg-market-updateprices-up-slightly-from-last-week-dtn/.
Arndt et al (2015) Feed conversion efficiency in dairy cows: Repeatability, variation in digestion and metabolism of energy and nitrogen, and ruminal methanogens, Journal of Dairy Science, 98(6), pp. 3938-3950. Available at: https://www.sciencedirect.com/science/article/pii/S0022030215002180.
Baker & Chung (1992) Ideal diet for swine and poultry, Journal of animal science, 70(3102).
Barrents Watch (2016) Feed composition and origin. Available at: https://www.barentswatch.no/en/ havbruk/feed-composition-and-origin.
Best (2011) Poultry performance improves over past decades. Available at: https://www.feedstrate gy.com/poultry/poultry-performance-improves-over-past-decades/.
Blezinger (2003) Using common sense when formulating cattle feeds. Available at: https://www. cattletoday.com/archive/2003/December/CT303.shtml.
Clark et al. (2019) The intake pattern and feed preference of layer hens selected for high or low feed conversion ratio, PLoS ONE, 14(9). Available at: https://journals.plos.org/plosone/article?id=10.1371/ journal.pone.0222304.
Consensus (2005) Towards Sustainable Aquaculture in Europe. Available at: https://www.learneu rope.eu/files/5813/7456/5881/Towards_sustainable_aquaculture_in_Europe.pdf.
DEFRA (2010) Review of nutrient efficiency in different breeds of farm livestock. Available at: http:// sciencesearch.defra.gov.uk/Document.aspx?Document=FinalReportIF0183.doc.
Deluchi (2015) Uso de DDGS de maíz en dietas para pollos parrilleros. Available at: https://www. engormix.com/avicultura/articulos/uso-ddgs-maiz-dietas-t32532.htm.
Echemi (2021) Market price and insight. Available at: https://www.echemi.com/weekly-price.html.
FAO (2013) Greenhouse gas emissions from pig and chicken supply chains - A global life cycle as sessment. Available at: http://www.fao.org/3/i3460e/i3460e.pdf.
FAO (2014) World Mapping of animal feeding systems in the dairy sector. Available at: http://www. fao.org/3/a-i3913e.pdf.
ROUND TABLE ON RESPONSIBLE SOY ASSOCIATION (RTRS) — 12
FAO (2017) Cultured Aquatic Species Information Programme: Salmo Salar. Available at: http:// www.fao.org/fishery/culturedspecies/Salmo_salar/en.
Financial Times (2021) Commodities. Available at: https://markets.ft.com/data/commodities.
Gac et al. (2014) Co-products from meat processing: the allocation issue. Available at: https://www. gcirc.org/fileadmin/documents/Proceedings/IRC1999Canberravol2/241.htm.
India Mart (2021) Maize grits for brewing. Available at: https://www.indiamart.com/navadhane-agro foods/maize-grits.html.
Ishler (2014) Calculating feed efficiency. Available at: https://www.progressivedairy.com/topics/ feed-nutrition/calculating-feed-efficiency.
Jabbar (2014) Dairy feeding management. Available at: https://www.slideshare.net/PakRose1/ dairy-feeding-management.
Kroes & Kuepper (Profundo) (2015) Mapping the soy supply chain in Europe. Available at: https:// wwfeu.awsassets.panda.org/downloads/mapping_soy_supply_chain_europe_wwf_2015.pdf.
Kroll (2018) Dairy Feeding strategy & Diet formulation for the Dairy Herd. Available at: https://www. dairyschool.co.il/feeding-strategy-diet-formulation-for-the-dairy-herd-by-dr-ofer-kroll/.
LMC International (2019) Cost & Price Monitor: Starches, starch sweeteners & fermentation prod ucts. Available at: https://www.lmc.co.uk/wp-content/uploads/2019/04/LMC_Cost_and_Price_Moni tor_Brochure_E-version_2019-4.pdf.
Neste (2021) Biodiesel prices (SME & FAME). Available at: https://www.neste.com/corporate-info/ investors/market-data/biodiesel-prices-sme-fame.
Queensland Government (2016) Performance standards. Available at: www.daf.qld.gov.au/ani mal-industries/pigs/managing-a-piggery/production-and-performance/performance-standards.
Reuters (2021) EU carbon price hits record 50 euros per tonne on route to climate target. Available at: https://www.reuters.com/business/energy/eu-carbon-price-tops-50-euros-first-time-2021-05-04/.
Roman et al. (2011) Performance of finishing beef cattle fed different diets containing whole-crop maize silage or sugarcane silage, Revista Brasileira de Zootecnia, 40(3), pp. 682-289. Available at: https://www.scielo.br/pdf/rbz/v40n3/29.pdf.
Rostagno et al. (2005) Tabelas Brasileiras para aves e suínos. Available at: https://www.agencia. cnptia.embrapa.br/Repositorio/Tabelas+brasileiras+-+Rostagno_000gy1tqvm602wx7ha0b6gs0x fzo6pk5.pdf.
Schroder & Sudekum (University of Kiel) (1999) Glycerol as a by-product of biodiesel production in Diets for ruminants. Available at: https://www.gcirc.org/fileadmin/documents/Proceedings/IRC 1999Canberravol2/241.htm.
ROUND TABLE ON RESPONSIBLE SOY ASSOCIATION (RTRS) — 13
Shahbandeh (2021) Corn production worldwide 2020/2021, by country. Available at: https://www. statista.com/statistics/254292/global-corn-production-by-country/.
Sharma et al. (2008) Increasing the value of hominy feed as a coproduct of fermentation, Applied biochemistry and biotechnology, 149(2), pp. 145-153.
Shike (2013) Beef cattle feed efficiency. Available at: https://lib.dr.iastate.edu/cgi/viewcontent.cgi?ar ticle=1027&context=driftlessconference.
Singh (2019) General guidelines for feed formulation of commercial poultry (broilers and lay ers). Available at: https://www.pashudhanpraharee.com/general-guidelines-for-feed-formula tion-of-commercial-poultry-broilers-layers/.
Sugar and sweeteners (2008) High maltose corn syrup. Available at: http://www.sugar-and-sweet ener-guide.com/high-maltose-corn-syrup.html.
Trade India (2021) Brewers maize. Available at: https://www.tradeindia.com/products/brewersmaize-corn-grits-brewers-for-beer-manufacturing-5558414.html.
Tridge (2021) Maize (Corn) Flour. Available at: https://www.tridge.com/intelligences/maize-cornflour/price.
USDA (2008) Utilizing corn germ meal in plywood clue. Available at: https://www.ars.usda.gov/AR SUserFiles/2542/Posters/M%20HojillaEvangelista_2008%20CUTC%20Poster_Corn%20germ%20 meal%20in%20plywood%20glues.pdf.
USDA (2021) Kansas City weekly feedstuff review. Available at: https://mymarketnews.ams.usda.gov/ filerepo/sites/default/files/2955/2021-08-17/494292/ams_2955_00077.txt.
USDA (2021) Oil Crops Yearbook. Available at: https://www.ers.usda.gov/data-products/oil-cropsyearbook/oil-crops-yearbook/.
USDA (2021) Sugar and Sweeteners Yearbook Tables. Available at: https://www.ers.usda.gov/da ta-products/sugar-and-sweeteners-yearbook-tables/.
Whisky.com (2020) Bourbon - Grain Selection and Mixture (Mash Bill). Available at: https://www. whisky.com/information/knowledge/production/overview/how-bourbon-whiskey-is-made/bour bon-grain-selection-and-mixture-mash-bill.html.
ROUND TABLE ON RESPONSIBLE SOY ASSOCIATION (RTRS) — 14
University Study
Appendix I Austral
Contents
Executive Summary
Chapter I: Introduction
Methodology
Acknowledgments
Chapter II: The corn plant. Introduction
Corn Kernel Cellular Structure and Composition
Commercial Classification and Corn Industrial Quality
Corn Industrial Quality
References
Chapter III: Corn wet milling
Description
Refining processes
Key Elements for corn wet milling
First refining steps: byproducts extraction
Second Processing: Starch processing
Corn conversion factors calculation in wet milling
Wet milling conversion factors. Overview
Process losses
Conversion factors on dry basis
Conversion factors on commercial basis (as is)
References
Chapter IV: Corn dry milling
Description
Dry milling products and their ues
grits
Fine corn meal
Byproducts
Key elements in corn wet milling
Corn Dry Milling
reception
Degermination
Milling and classification
Corn conversion factors calculation in dry milling
Process losses
Conversion factors
(i) Endosperm
(ii) Semolinas (iii)
(iv)
1. Corn
2. Conditioning 3.
4. Classification 5.
References 4 7 7 8 9 12 14 16 18 20 21 22 23 24 34 46 47 48 48 52 54 57 58 59 60 60 61 62 62 63 64 65 65 67 67 69 70 70 72 ROUND TABLE ON RESPONSIBLE SOY ASSOCIATION (RTRS) — 16
Chapter V: Corn-based ethanol production
Ethanol production process
Front-end processes
or milling
and saccharification
Fermentation
Front-end processes. Flow diagram
Back-end processes
Ethanol products purification and concentration
Byproducts recovery
Back-end processes. Flow diagram
Corn conversion factors calculation in ethanol production
Losses in the production of corn-based ethanol
Corn conversion factors (as is)
References
1. Reception 2. Grinding
3. Liquefaction
4.
5. Distillation 6.
7.
74 77 78 78 79 79 80 81 82 82 83 85 88 89 90 90 83 ROUND TABLE ON RESPONSIBLE SOY ASSOCIATION (RTRS) — 17
Executive Summary
In recent years, public awareness on the environmental and social impact associated to food pro duction has increased. Therefore, it is necessary to develop strategies and tools to increase supply chain transparency and have a clear communication about the operations associated to certain raw materials.
In 2019, RTRS fostered a method that allows to determine the volumes of soy products produced with one ton of soy (RTRS Conversion Factors System). The results obtained were used to calculate the soy equivalent in each soy product, and has become a key element to develop the RTRS Soy Footprint Calculator that gives soy value chain players, organizations and the general population the opportunity to know their soy footprint.
This research elaborates on the efforts lead by RTRS to define a corn conversion factors system. This research estimates corn conversion factors representative of corn wet milling, corn dry milling, and corn-based ethanol production at global level. To ensure that the results are representative and reliable, the conversion factors analysis considered the technologies and industrial processes most used in every industry, the types of corn used in the different processes and the more general technical specifications of the resulting corn products.
The corn conversion factors of 32 products are listed below. Most of the products are raw materi als for a second processing done by other industries, including pharmaceutical, textile, food and drinks, animal feed.
ROUND TABLE ON RESPONSIBLE SOY ASSOCIATION (RTRS) — 18
CORN WET MILLING
Average yield and tons required to obtain 1 ton of product or byproduct. COMMERCIAL (*) basis (as is)
Germ
Crude corn oil
Corn germ cake
Gluten Feed
Wet Gluten Feed Corn steep liquor Fiber
Gluten Meal
AlmidónStarch
Maltodextrins (DE 15 to 20)
Glucose syrup (DE 38)
Dextrose anhydrous Dextrose monohydrate
Maltose syrup
High maltose syrup HFCS 42 HFCS 55
Product Product
Hominy grits
2,8%
16,7% 33,4% 10,0% 10,5% 3,7% 62,1% 61,8% 74,6% 61,7% 67,1% 75,0% 76,5% 85,1% 80,6%
(*) Corn moisture content is estimated at 14.5% and total losses are estimated at 4.5% of the corn volume received in wet milling facilities (commercial basis, as is).
DRY MILLING OF DEGERMINATED CORN
Average yield and tons required to obtain one ton of product or byproduct COMMERCIAL (*) basis (as is)
Semolina for traditional polenta Semolina for instant polenta Semolina for extrusion
Brewery grits
Corn meal
Zootechnical flour
Yield (*) (% CB) Yield (*) (% CB)
Ton. Corn required (as is) Ton. Corn required (as is)
(*) Corn moisture content is estimated at 14.5% and total losses are estimated at 3% of the corn volume received in dry milling facilities (on commercial basis).
15,7 35,6 28,2 6,0 3,0 10,0 9,5 27,0 1,6 1,6 1,3 1,6 1,5 1,3 1,3 1,2 1,2 3,3 1,7 2,2 2,6 1,9 15 2,7 6,3%
3,5%
30% 58% 45% 39% 52% 7% 37%
ROUND TABLE ON RESPONSIBLE SOY ASSOCIATION (RTRS) — 19
CORN-BASED ETHANOL PRODUCTION FROM DRY MILLING
Average yield and tons required to obtain one ton or one m3 (1,000 liters) of product. On COMMERCIAL (*) basis
Product Average Yield Unit
Carbon dioxide (CO2)
Hydrous ethanol (96%)
Anhydrous ethanol (99.5%)
Ethanol (96%) - Extra neutral rectified DDGS
WDGS
Corn distillers oil Low-oil DDGS
301 kg/ton 410 lt/ton 398 lt/ton 386 lt/ton 302 kg/ton 790 kg/ton 12,2 kg/ton 280 kg/ton
tons of corn required by product unit
1 ton 1 m3 (1,000 liters)
1 m3 (1,000 liters)
1 m3 (1,000 liters) 1 ton 1 ton 1 ton 1 ton
(*) Corn moisture content is estimated at 14.5% and total losses are estimated at 2.9% of the corn volume received in ethanol facilities (as is). Ethanol products yield estimate does not include the denaturing additives. WDGS moisture content is 65% and in the traditional, low-oil DDGS, moisture is 10%.
3,32 2,44 2,51 2,59 3,32 1,27 81,97 3,58
ROUND TABLE ON RESPONSIBLE SOY ASSOCIATION (RTRS) — 20
Introduction
Corn ranks first for its global production and second for its planted area.
In the past 10 years, world corn production has increased by 40%; from 820 million tons in 2009 to over 1,100 million in 2019. Farmers have increased the area sown with corn: more than 200 million hectares in 2019. Furthermore, corn yields per hectare have also increased.
The U.S. is the largest corn producer worldwide with approximately 32% of the 2017-2019 total volume —360 million tons a year, on average— followed by China, 23%, Brazil, 8%, and Argentina, 5%.
Corn is highly valued economically all over the world thanks to its low cost and great versatility. Corn is mostly used for animal feed, as mature kernel, forage or as an ingredient in the animal feed industry. Corn ears can also be consumed or used as raw material for wet or dry milling, or to produce ethanol.
This research estimates corn conversion factors representative of corn wet milling, corn dry milling, and corn-based ethanol production at global level. Due to the integrated nature of the industries under analysis, first industrialization or first order industrialization are the refining processes typically integrated to production facilities2
In total, the corn conversion factors of 32 products were researched and analyzed. Most of the products are raw materials for a second processing done by other industries, including pharmaceutical, textile, food and drinks, animal feed.
Methodology
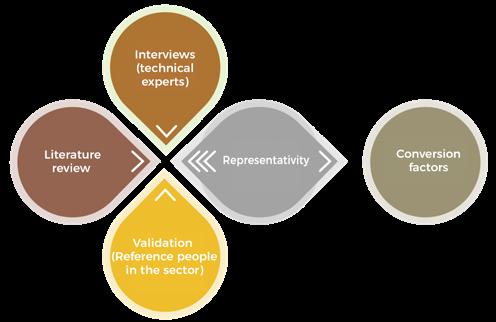
To ensure that the results are representative and reliable, the conversion factors analysis considered (i) the technologies and industrial processes most used in every industry, (ii) the types of corn used in the different processes and (iii) the most general technical specifications of the resulting corn products.
The methodology used in this research involved collecting information from different sources, and a validation process through triangulation strategies to ensure that the resulting conversion factors were representative and valid.
2 For example, corn wet milling uses kernel corn to obtain corn germ, gluten feed, gluten meal, and starch. Traditional wet milling facilities ad ditionally process starch to produce modified starches, corn syrups, and sweeteners. This research also refers to those processes and products.
Chapter I:
ROUND TABLE ON RESPONSIBLE SOY ASSOCIATION (RTRS) — 21
Triangulation Method to Validate the Results
A careful literature review was carried out as well as in-depth interviews with technical experts and industry referents to set up reference conversion values for each industry and product. All the conversion factors included in this summary have been validated by frequently consulted experts to ensure that the results are valid.
Acknowledgments
The information included below has been contributed by professionals and technical experts working in the industries analyzed by the research. While it is not possible to mention them individually, we thank all the referents who were interviewed.
Furthermore, the authors thank the information and feedback provided by the following institutional referents and experts: Eng. Alberto Morelli, President of Maizar, and former president of MAIZALL (Maize International Alliance); Eng. Anibal Avarez, Manager of CAFAGDA (Argentine Chamber of Starch, Glucose and Allied Products Manufacturers); MSc. Ch. Eng. Mario Aguilera Merlo, National University of San Luis, School of Engineering and Agricultural Sciences), Arch. Pablo Campodonico, President of the Chamber of Dry Milling Producers and Director of Molino Alimentos Tandil, Argentina, Lic. Silvio Pagnacco, flour milling consultant in the dry-milling industry in Latin America and Eng. Manuel Ron and Tristan Gagliesi, who work with Bio4 Rio Cuarto, Argentina, and referent of CADER (Argentina Chamber of Renewable Energies).
Source: Developed in-house by Austral UniversityROUND TABLE ON RESPONSIBLE SOY ASSOCIATION (RTRS) — 22
Corn Conversion Factors
corn plant. Introduction
conversion elements
Chapter II: The
Key
The corn plant. Introduction

Maize (Zea mays), also known as corn, is an annual grass2 in the family Gramineae, characterized by fine and fibrous roots, a thick stem and a special inflorescence called ear. The Gramineae family includes sugarcane, wheat, rice, barley, sorghum, and rye.
Reproduction is through crossed pollination. The female reproductive part or female flower (the cob or ear) and the masculine reproductive part or male flower (the tassel) can be found in different parts of the plant (Figure 1). The flower on the apex of the stem is the male flower and produces pollen (Figure 2). On the other hand, the female flower (the ear) is cylindric and covered by leaves. Elongated stigmas emerge from these flowers. The female flower produces the ovules that will become the seed, and, when pollinated (fertilized) by this same plant or by wind-blown pollen, the seed will mature into a corn kernel (Figure 3).
Chapter II
3 These plants are annual and sexually reproduce each year. ROUND TABLE ON RESPONSIBLE SOY ASSOCIATION (RTRS) — 24
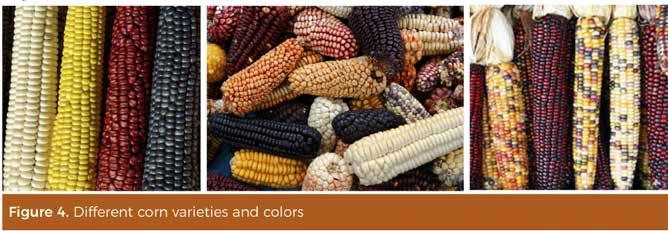
In the ear, each grain or seed is an independent fruit called caryopsis which weight depends on the different genetic, environmental and growing practices used. The kernel typically represents half of the plant dry matter4 not including the roots (Haros, Brites y Trigo, 2007). Corn is often white or yellow, though some varieties can be black, red or flecked. There are several types of corn, characterized by the different chemical compounds deposited or stored in the kernels (FAO, 1993). Those features determine the corn potential for diverse applications.
Hybrids
A corn hybrid results from the genetic breeding and crossing of two varieties with desirable characteristics.
When one corn variety pollen is used to pollinate the stigmas of a different variety with different genetic characteristics, a corn hybrid is created. Plants born from hybrid seeds are more resistant and have improved characteristics, including higher yields. Breeding efforts intend to supply hybrids with high yield potential and resistance to major diseases and pests, as well as tolerance to different stresses. (Jose Delgado Rodriguez, 2017)
4 Corn dry matter is what is left in the kernel after extracting all the moisture.
ROUND TABLE ON RESPONSIBLE SOY ASSOCIATION (RTRS) — 25
Corn kernel cellular structure and composition
Corn is basically starch, protein, oil and fiber, all contained in the plant three main structures: the pericarp, the endosperm and the embryo, usually called germ (Alvarez, 2006).
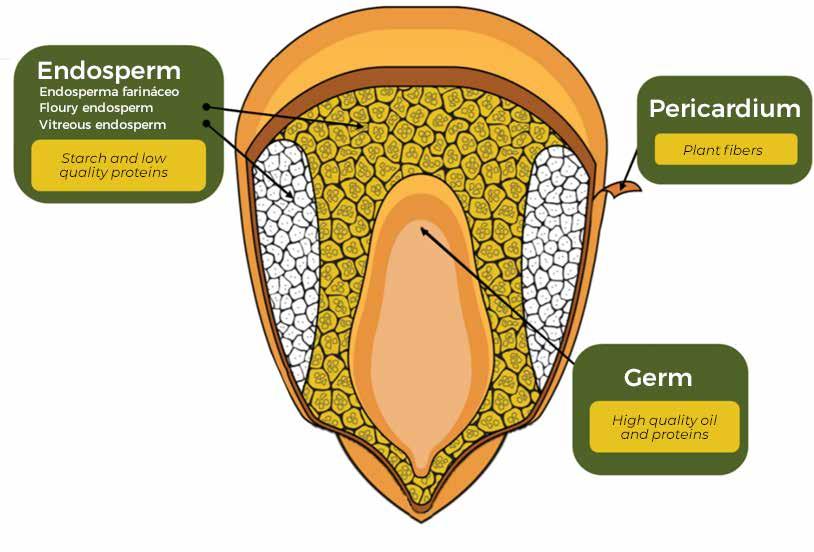
Figure 5: Corn kernel main structures
Starch is the kernel primary component; it typically represents 70-75% of the kernel weight (on dry basis6). Corn starch has multiple uses. It is easily modified, through chemical treatment or genetic improvement, and can be made into sweeteners, among many other uses.
Proteins follow starch as primary chemical components of the kernel. Proteins typically range from 8 -10% of the kernel dry weight, and are mostly found in the endosperm.
The oil is mainly found in the germ and generally represents 4-5% of the dry kernel weight. It is the raw material of corn oil and an important source of energy in animal diets.
Corn is also an excellent source of fiber. The total fiber content in corn kernels ranges from 9-12% of the kernel dry weight (FAO, 1993).
Source: Modified from the International Maize and Wheat Improvement Center (CYMMYT, Centro Internacional de Mejoramiento de Maíz y Trigo) (2019)55
Nutrient accumulation during the development of the ear. Aldo Rosales Nolasco y Natalia Palacios CIMMYT. 2019
6
Dry basis estimates do not consider the corn kernel moisture content, that is, they refer to the proportion of the kernel that is its dry basis.
ROUND TABLE ON RESPONSIBLE SOY ASSOCIATION (RTRS) — 26
As shown in Chart 1, the kernel main components feature a considerably different chemical composition.
Chart 1: Approximate weight distribution and chemical composition of the kernel main parts. In percentage (%)
Whole grain
Weight distribution (on dry basis %)
Weight %
Chemical composition (on dry basis %) Starch
Proteins
Fat/Oil Fiber Ashes
Other (*)
100% 72,0% 10,0% 5,0% 9,0% 1,4% 2,6%
Endosperm Germen
Pericarp 83% 87,6% 8,0% 0,8% 2,7% 0,3% 0,6%
12% 8,3% 18,4% 33,2% 8,8% 10,5% 20,8%
Source: Developed in-house by Austral University based on FAO (1993), Shukla & Cheryan (2001) (*) Soluble sugars, phytic acid, non-protein nitrogen, among others, are included.
5% 7,3% 3,7% 1,0% 86,7% 0,8% 0,5%
As shown in Figure 5, the external structure is called pericarp (the outer covering). The pericarp is a protective, hard and fibrous layer that surrounds the kernel. It is approximately 87% crude fiber (Watson, 1987) and used to produce fiber in different foods.
The pericarp contributes to the color of the kernel and is about 5-6% of its dry weight, depending on the corn genotype (Mansilla 2018, based on Arendt y Emanuele, 2013).
The germ (embryo) is in the lower part of the endosperm and represents 10-12% of the kernel dry weight (Watson, 1987). Most of the oil contained in the kernel is in the germ, that contains 80% of the total lipids (FAO, 1993).
Germ is important in corn processing for two main reasons: 1) it is a concentrated source of oil, and 2) it absorbs more moisture than other kernel components, facilitating endosperm separation in milling processes7
7 Tae
Hoon Kim, 2000.
“Physical
changes in maize grains during post-harvest drying”
ROUND TABLE ON RESPONSIBLE SOY ASSOCIATION (RTRS) — 27
Chart 2: Distribution of Kernel Main Chemical Components and Basic Corn Kernel Structures (in %)
EndospermComponent Germ
Source: Developed in-house by Austral University based on FAO (1993), Alvarez (2006), y Watson (1987).
The addition is not 100% due to rounding.
Finally, the endosperm is the storing structure and the most important reserve of energy. The endosperm represents 82-84% of the kernel dry weight when physiologically mature and contains 98% of the starch in the kernel8
The endosperm includes two basic types: the hard endosperm, rich in protein (also called vitreous endosperm) and the soft, starchy endosperm, rich in starch (Cirilo et al., 2011). Corn grown to consume the ears has a sugary endosperm, rich in sugars that give a sweet flavor and are low in starch (Nelson, 1978). Each endosperm proportions depend upon the genotype and environmental conditions; they determine the final use of the kernel (M. J. Cuitiño y V. Cardozo, 2018).
Commercial classification and corn industrial quality
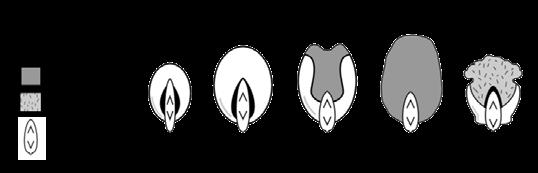
All corns are part of the same species; the different types or races of corn correspond to a simple and utilitarian, non-botanical classification (Juan R. E. Gear, 2006). Only a limited number of corn types are commercial. The most general classification is based on the endosperm, the color of the kernel and final use. Watson (1991) mentions the five most popular corn types: i) hard or flint corn, ii) dent corn, iii) soft corn, iv) popcorn, and v) sweet corn.
Figure 6: Endosperm distribution in the five main types of corn
Wet Milled
Source: Dickerson, 2003 8 Corn Refiners Association, 2006. “Corn
Feed Products.”
98% 74% 14% 16% 29% 1% 24% 85% 81% 14% Starch(*) Proteins Fat/Oil Ashes Crude fiber
(*)
Pericarp 0,5% 2% 1% 3% 57% ROUND TABLE ON RESPONSIBLE SOY ASSOCIATION (RTRS) — 28
i) Hard or flint corn
Flint corn (Zea mays L. subsp. mays Indurata Group) is a variety of corn which is extremely hard, with vitreous, hard endosperm (Figure 5). The representative race of corn is cristalino colorado and includes the plata argentino corn, highly appreciated by dry milling. It presents interesting uses, including popcorn, meal, semolina or polenta, brewery inputs, poultry production (it improves the color of chicken eggs).
ii) Dent corn
Dent corn (Zea mays L. subsp. mays Indentata Group) is a type of corn characterized by the pres ence of a soft starch at the center and hard starch at the sides and back of the kernels. Dent corn is also characterized by an indentation or dent at the crown of each kernel, due to the fast drying and contraction of the soft starch contained in that region. Dent corn is in great demand on the market worldwide; it is yellow and its kernels are between the hard and the soft types. Dent corn is high in starch but low in protein. It is very much used by dry milling facilities to produce alcohol, starches and fructose, important ingredients for the food industry. It is also used for animal feed (Haros, Brites y Trigo, 2007)9
iii) Soft corn
Soft corn kernels or flour corn (Zea mays L. subsp. mays Amylacea Group) have a soft endosperm (low-density, soft and starchy endosperm) and opaque kernels. They are usually consumed fresh (corn) and as ingredients for different traditional foods based on corn meal (Jugenheimer, 1959).
iv) Popcorn or expanding corn
This corn type (Zea mays L. subsp. mays Everta Group) is different because its endosperm is very hard and corneus; it can be thought of as a flint corn with small kernels. Popcorn pops due to the resistance of its pericarp that is associated to the relative percentage of hard , strong and elastic starch that, when pressed by heat, breaks the pericarp and exposes the endosperm giving shape to the crispy popcorn (Zinsly y Machado, 1991).
v) Sweet corn
The endosperm of sugar corn or sweet corn (Zea mays L. subsp. mays Saccharata Group) is high in sugar, low in starch and has recessive mutant genes that block sugar synthesis (Nelson, 1978). Sweet corn, unlike other corn types produced and consumed worldwide, is harvested when still immature. Water content is over 70%; therefore, the pericarp is soft and sugar accumulation in the endosperm is optimal.
9 Haros, Brites y Trigo, 2007. “De tales harinas, tales panes: granos, harinas y productos de panificación en Iberoamérica. Maiz. (From these flours, these breads: grains, flours and breads in Ibero-America, Corn).
ROUND TABLE ON RESPONSIBLE SOY ASSOCIATION (RTRS) — 29
Figure 7: The five main types of corn

Source: freepik
The classification mentioned above corresponds to the different races of corn. The types described cross with each other and create new races with intermediate textures (Juan R. E. Gear, 2006)10. For instance, semi dent corn results from the crossing of hard and dent corn. It is widely accepted by the market for being quite productive and for the special characteristics of its kernels, in-between the two parent races. (INIA, 2000).
Corn industrial quality11
Corn is one of the most used grains worldwide and has many and diverse applications. While it is mostly used for animal feed, it can also be an ingredient of human foods and non-food items. Corn is a raw material for polenta, breakfast cereals, cornflour, alcoholic and non-alcoholic drinks, sweets, sweeteners, and as an ingredient in other uses. It can also be used to produce bioethanol; corn products are intermediate goods for paints and dissolvents, pharmaceutical products, cosmetics, biodegradable polymers, etc. (Izquierdo y Cirilo, 2013).
Corn Processing:
Wet milling
Dry milling
Bioethanol production
Corn industrial processing will determine the final use. Each of the above-mentioned industries require corn of certain characteristics that maximize performance, yield and quality of the final product (Izquierdo y Cirilo, 2013).
Juan R. E. Gear, 2006. El cultivo del maíz en la Argentina (Corn production in Argentina). ILSI
Based on José L. Robutti, 2004 and N. Izquierdo y A. Cirilo, 2013.
(https://www.freepik.es/)
i)
ii)
iii)
10
11
ROUND TABLE ON RESPONSIBLE SOY ASSOCIATION (RTRS) — 30
i) Wet milling primary goal is to get the starch in the endosperm to further process it and use it as an ingredient in many different industries, including high fructose corn syrup, dextrins, maltose syrup, etc. Wet milling starts by macerating or steeping the corn kernel in water to help separate the pericarp and germ from the endosperm. An alkaline solution is added to the wet kernels to soften the protein matrix and condition the grain to separate the starch from the other components. Kernels of low endosperm hardness allow minimizing times and improving maceration efficiency. Kernels should have a high content of extractable starch and there should be a low number of broken kernels (Izquierdo y Cirilo, 2013).
ii) Dry milling primary goal, on the other hand, is to get fractions of endosperm to produce breakfast cereals (flaking grits), and small grain size fractions such as semolina and flours. Corn is conditioned in water to hydrate the pericarp and the germ in the endosperm. After a series of milling steps, the three components are separated. This milling requires kernels with a very hard endosperm to get the proper size fractions required by the different uses (Freidenberg, 2000). Harder corn (flint corn) gives the best performance and flaking grits quality. Broken or fissured kernels condition the grit size (Izquierdo y Cirilo, 2013).
iii) Bioethanol production entails saccharification, where specific enzymes transform starch into simple sugars. Sugars are then fermented by yeasts and distilled to get ethanol. Dry milling requires kernels that are high in starch.
The three processes mentioned above produce byproducts for animal feed. Those byproducts are high in protein, oil and/or fiber, depending the milling procedure. Therefore, no matter the use corn may have, it is necessary to eliminate any fungal and mycotoxins contamination (Izquierdo y Cirilo, 2013).
Each industry demands a specific grain quality depending on their target production. Corn quality is primarily determined by the structure and composition of the kernel that, in turn, depends upon i) genetic factors; ii) growing conditions, and iii) post-harvest management.
i) Genetic Factors
Genetic improvement has led not only to higher yield per hectare and disease resistant plants but also to special types of corn that feature added value for specific uses (FAO, 2011). Research in corn has modified endosperm hardness and oil, protein and starch content percentages, as well as protein quality and starch type.
ii) Growing Conditions
Changes in growing conditions result in different corn components concentrations and chemical composition, which impacts on grain quality.
On the one hand, in high yield and proper physiological condition crops, protein concentration is increased and starch content in reduced (Izquierdo y Cirilo, 2013). The better the plant physiological condition, the more starch, oil and protein is synthesized. Oil and protein content feature the larger relative changes.
On the other hand, oil concentration is stable across a wide range of environmental conditions. Only a very strong heat stress at grain filling can affect such concentration (Izquierdo y Cirilo, 2013). Climatic variations and growing conditions modify the proteins composition. Increased nitrogen
ROUND TABLE ON RESPONSIBLE SOY ASSOCIATION (RTRS) — 31
availability and plants physiological conditions lead to variations in protein composition that favors endosperm hardness, reducing kernel susceptibility to breaking (Izquierdo y Cirilo, 2013). Corn resistance to breakage in post-harvest is a key element of corn potential preservation and subsequent uses; endosperm hardness is directly associated to such resistance.
As to crop growing practices, late sowing dates, or planting in high latitude locations have resulted in different starch composition, which affects digestibility and starch thermal properties, including gelatinization temperature and range.
iii) Post-harvest Management
Grain physical quality can be modified by mechanical harvesting, dehulling and drying. The two first may lead to external damage, for instance breakage of the pericarp or other parts that surround the germ, which facilitates attacks from insects and fungi. Drying, on the other hand, does not produce important physical damage but, if done too fast and at high temperature, may lead to stress cracks, as well as ampules and decoloring that will impact industrial procedures efficiency (FAO, 1993).
References
Dickerson, George. 2003. “Specialty Corns”. College of Agriculture and Home Economics. Las Cruces: New Mexico State University.
FAO, 1993. “El maíz en la nutrición humana”.
FAO, 2001. “El maíz en los trópicos: Mejoramiento y producción”
Héctor Deras Flores, 2020. “Guía técnica: el cultivo de maíz”. Instituto Interamericano de Cooperación para la Agricultura (IICA)
Izquierdo, Natalia G. y Cirilo, Alfredo G. 2013. “Usos del Maíz: Efectos del ambiente y del manejo sobre la composición del grano”. Jornada de Actualización. Calidad del grano de maíz para la industria y la producción en bovinos
Juan R. E. Gear, 2006. “Maíz y Nutrición - El cultivo del maíz en la Argentina.” Serie de Informes Especiales de ILSI Argentina.
María José Cuitiño de Vega y Valeria Cardozo. 2018 .”Maíz: Clasificación y usos potenciales”. INIA La Estanzuela. Colonia-Uruguay.
Robutti, J. L. 2004. Calidad y usos del maíz. Revista de información sobre investigación y desarrollo agropecuario, Idia XXI 6:100-104.
Sandy Endicott, 2017. “Maíz Crecimiento y Desarrollo”. Dupont Pioneer.
Shukla y Cheryan, 2001. “Zein: the industrial protein from corn”. Industrial crops and products. Vol. 13. No 3. pp. 171-192.
ROUND TABLE ON RESPONSIBLE SOY ASSOCIATION (RTRS) — 32
Watson, 1987. “Structure and composition”. En: Corn: Chemistry and Technology. S. A. Watson and P. E. Ramstad, eds. AACC. St. Paul, Minnesota, USA.
Watson. 1987. “Structure and Composition”. In: Watson, S.A. and Ramstad, P.E., Eds., Corn: Chemis try and Technology, American Association of Cereal Chemists.
José Delgado Rodríguez, 2017. La selección del híbrido de maíz. Disponible en https://www.intagri. com/articulos/cereales/la-seleccion-del-hibrido-de-maiz
ROUND TABLE ON RESPONSIBLE SOY ASSOCIATION (RTRS) — 33
Corn Conversion Factors
Corn wet milling
Chapter III:
Corn wet milling Description
Corn wet milling involves (i) extraction of the kernel major components namely fiber, proteins, fat/ oil, and starch, and (ii) starch processing for many different industries.
These steps physically break corn kernel into their component parts using a large volume of water (Lasseran, 1973). Wet milling requires important investments since the technology applied is more sophisticated than that of dry milling (Lavarello, 2003). Wet milling allows a very clean separation of corn kernel components, which opens up the possibility of multiple applications.
As appreciated in the chart below, corn wet milling produces a variety of products that encourage the diversification of corn industrial uses.
Wet milling uses
UsesProduct
Gluten feed
Gluten meal Germ Native starch
Modified starch
Dextrins
Maltodextrins
Glucosed syrups
Maltosed syrups
Dextrose
Fructose 42 Fructose 55
Mixed syrup
Animal feed
Animal feed /Pet food
Oil, animal rations (germ cake)
Industrial uses, food uses, pharmaceutical uses
Industrial uses, food uses, pharmaceutical uses, beauty, textiles and petroleum industries.
Adhesives for paper mills
Food industry
Industrial uses, food uses, pharmaceutical industry
Food uses, breweries
Industrial uses, food uses, pharmaceutical industry, ethanol, bioproducts
Sweeteners for beverages and foods
Sweetener for non-alcohol drinks
Food uses, syrups, confectionery, ice-cream, cookies and crackers
Source: developed based on CAFAGDA 12
Wet milling can process hard and dent corn. This industry does not require any specific corn quality; wet milling is not economically affected by corn type (Álvarez, 2006)13. However, grain homogeneity is a must; only one corn variety should be processed at a time. In Argentina, wet milling processes dent and semi-dent corn, given its availability.
12 Cámara Argentina de Fabricantes de Almidones, Glucosas, Derivados y Afines (CAFAGDA)
13 Aníbal Álvarez, 2006. Aplicaciones del maíz en la tecnología alimentaria y otras industrias (Corn applications in food technology and other industries). In: Maíz y Nutrición Informe sobre los usos y las propiedades nutricionales del maíz para la alimentación humana y animal (Report on corn uses and nutritional properties for human food and animal feed). ILSI Argentina. Series of special reports
Chapter III
ROUND TABLE ON RESPONSIBLE SOY ASSOCIATION (RTRS) — 35
Refining processes
Typical wet milling includes two main processes:
1) First, to obtain by-products
2) Second, starch processing
First, wet milling yields four co-products:
• Germ
• Gluten feed (fiber)
• Gluten meal (high protein gluten)
• Starch
While starch is the main product, gluten feed and gluten meal are interesting by-products because they are extensively used in animal feeds. Germ is also an important byproduct of wet milling; it is mainly used to produce corn oil, which requires a second germ processing. Corn germ is only processed in large volumes. Wet milling plants deliver the dry germ to oil extraction plants that are big and centralized.
Second, starch is processed. Starch slurry goes to one of three basic finishing processes (detailed below) that will define the final products:
• Native starch
• Modified starch
• Sweeteners
Processing steps in corn wet milling facilities
Source:
Developed in-house by Austral University from interviews with industry referents. ROUND TABLE ON RESPONSIBLE SOY ASSOCIATION (RTRS) — 36
First, starch is purified and dried —no chemical alteration— and can be commercialized as native starch.
Second, starch is modified through different reactions to get new functional characteristics, including improved texture, better tolerance to heat treatments, greater resistance to freezing, better adhesion. Modified starches refer to a wide variety of products, including acid starches, oxygenated, cationic, anionic, pregelatinized starches, and dextrins (pirodextrins), etc. Dextrins are mostly used to produce adhesives. Dextrins are obtained from the dry toasting of native starch, generally using an acid catalyst, in a separate facility. The rest of modified starches are produced in a single, multi-use reaction tank (batch).

Third, starch conversion processes produce sweeteners used as intermediate goods by many different industries. Mention can be made to maltodextrin, glucosed syrups, maltosed syrups, dextrose, and high fructose corn syrups. The volumes of starch used to produce sweeteners vary widely among production plants, where starch separation is an integrated process.
Last, while ethanol can be obtained from corn wet milling sugars fermentation, ethanol production is primarily based on dry milling. Therefore, ethanol production will not be detailed in this chapter.
Key elements for corn wet milling
Corn wet milling, as previously stated, is a capital-intensive industry of high technological level; performance. efficiency and output are relatively standardized worldwide. The volume of corn germ, gluten feed, and gluten meal obtained in the first processing steps and the starch products and sweeteners from the second processing steps are affected by a series of elements summarized below.
The three most important elements affecting corn conversion factors are: 1) the industrial process; 2) operations management, and 3) characteristics and quality of the corn received for its processing.
The processing technology used directly impacts on the industrial process. Enzyme engineering, as well as more advanced process and equipment technology have resulted in significant industrial
ROUND TABLE ON RESPONSIBLE SOY ASSOCIATION (RTRS) — 37
improvements with a direct impact on the final quality of products, processes duration, energy and water savings, but also on corn conversion factors 14 &15
The second high-impact factor is the way operations are managed. They refer to decisions made on equipment maintenance, and on investments on processes and machinery modernization. Furthermore, quality management practices should tend to eliminate physical (foreign particles), chemical (contaminants), and biological risks (micotoxins).
Corn kernels variability impacts on milling efficiency and products quality. Growing conditions, their variety, and the different operations from sowing to harvest and final use may considerably affect the quality of corn kernels to be processed (Haros, 1999 y Castellari et al., 2012).
The conversion factors discussed in this chapter are reference values applicable to the currently most used practices in the industry, considering the technologies and processes available in wet milling facilities. Besides, since industry performance and conversion factors result from a survey among companies and a detailed literature review, the impact of management practices and corn kernel variability are concepts implicitly included in the results obtained.
This chapter refers to conversion factors applicable to wet milling in two different ways. First, industrial output and conversion factors in the description of the production process are expressed on dry basis. This indicator considers the dry matter16 of the corn kernel actually milled. Conversion technical performance and coefficients are typically expressed on dry basis. Corn processing uses water; therefore, output, losses or chemical gains should not consider variations in the moisture content of corn products during production processes.
Second, in order to know the tons of commercial corn17 actually required to obtain a ton of the different products and byproducts (including corn commercial moisture content), conversion factors are expressed in commercial basis or as is. The corn tons as is required to obtain a ton of the different products and byproducts (including corn commercial moisture content) can be estimated using this last indicator, considering moisture contents of the wet milling products. It is a concept that will be detailed when analyzing wet milling conversion factors.
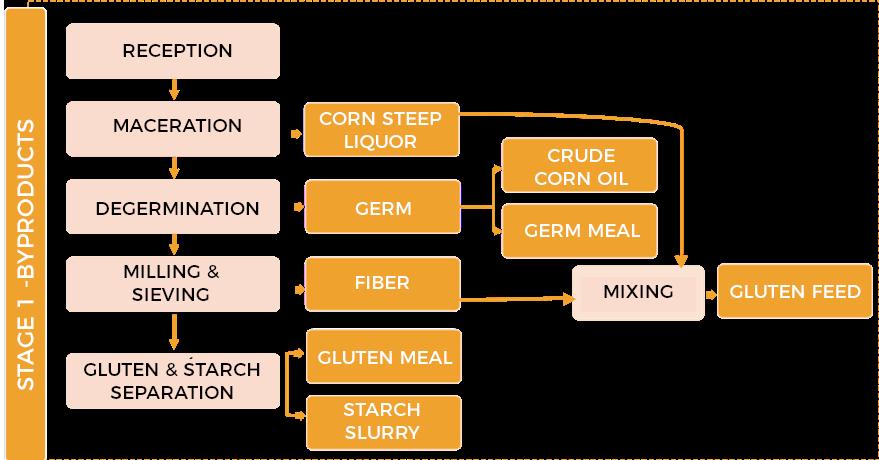
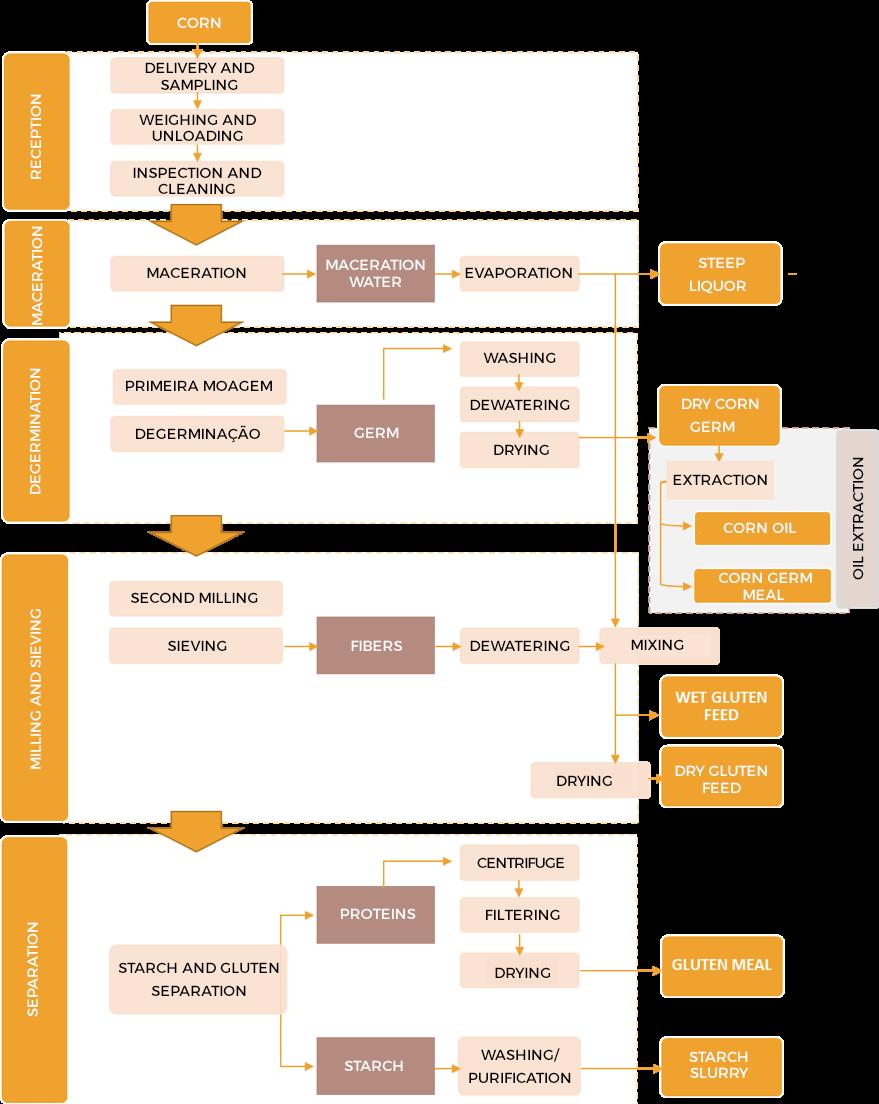
First refining steps: by products extraction
Corn byproducts extraction includes five steps: 1. reception, 2. maceration (when wet milling starts), 3. Germ removal or degermination, 4. Gross milling and sieving, and 5. Corn gluten and starch separation.
1. Reception
Reception is the process of receiving the corn at the processing facility. It includes reception and sampling, weighing and unloading, pre- cleaning, and classification.
14 Ramírez, E.C., Johnston, D.B., McAloon, A.J. et al. (2009). Enzymatic corn wet milling: engineering process and cost model.
15 Vijay Singh (2020), Enzymes Use in Corn Wet Milling Process (Webinar). Novozymes. https://www.novozymes.tv/video/63137168/howbiotechnology-is-shaping-corn-1
16 Corn dry matter is what is left of the kernel after extracting all the moisture.
17 Corn as is at the time of commercialization. It takes into consideration the moisture content of the corn kernel.
ROUND TABLE ON RESPONSIBLE SOY ASSOCIATION (RTRS) — 38
Below, the graph illustrates the different steps involved in reception.
Wet milling - First corn processing. Reception
1.1. Delivery and sampling
Grain reception starts when the person responsible for transporting the grain completes the delivery administrative steps. Required documents are submitted, and the grain quality is controlled.
Sampling is a requirement to monitor the quality of the grain. The number of samples is important since the final results will be applied to the total volume of grain delivered. The grain is sampled with a grain probe, that is, a probe sampler is introduced in the transport to collect a representative sample of the whole lot.
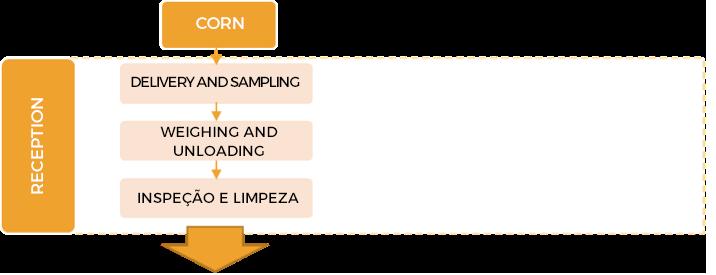
After sampling, the following quality parameters will be evaluated: presence of live insects or spiders; micotoxins, broken and/or damaged grains, green grains, foreign materials, test weight, moisture and chopped grains. This control is crucial since grain quality will impact on the final product quality.
Corn is usually delivered at not more than 14.5% moisture content (commercial moisture content) though this percentage slightly varies depending on the trading standard set by each country. Losses at the end of the process largely depend on the moisture content of grains at reception.
1.2. Weighing and unloading
Weighing is required to determine the exact number of tons received.
The weighing and unloading process depends upon the transport mode that brings the corn to the facility and upon the reception infrastructure that may include from traditional scales to continuous flow weighing systems.
1.3 Pre-cleaning and classification
All foreign materials are removed. Magnetic separators remove metallic elements that may damage the equipment or contaminate the foods (Tovar et. al, 2009).
Corn is classified by size before storage, just to have homogeneous batches. Different kernel sizes are a milling problem, and different corn types behave differently during maceration (Lavarello, 2003).
Losses associated to pre-handling represent 2.4% of the corn received (W.J. van Zeist, 2012).
Source: Developed in-house by Austral University from interviews with industry referents.ROUND TABLE ON RESPONSIBLE SOY ASSOCIATION (RTRS) — 39
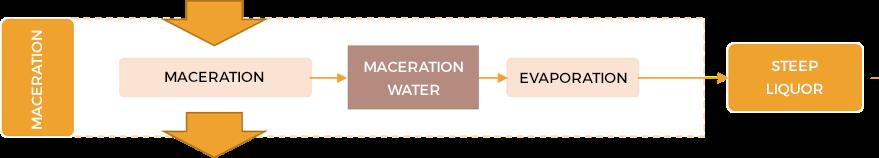
Maceration
Corn conversion factors and output detailed below are on dry basis of actually grinded kernels, that is, not including losses at reception (broken kernels and foreign materials).
Wet milling starts with maceration and steeping to hydrate the kernels, soften and condition the corn for milling.
Clean corn is fed to maceration tanks with an alkaline solution diluted at 48/54°C for 30 to 50 hours. Kernels absorb water and increase significantly in size; maceration starts with a 14/15% and ends with approximately 40 to 45% of moisture content.
The water used to macerate corn kernels comes from the final step of the first stage, from starch washing. It is demineralized water with a high potential of absorbing soluble elements and capturing starch soluble compounds; it is used to wash in a cross flow18
The soluble enriched water from the maceration process partially evaporates to concentrate the nutrients and results in an energy and protein rich ingredient called corn steep liquor.
Corn steep liquor
Corn steep liquor is a byproduct of the cross-flow maceration process.
Almost 6% of the kernel dry weight dissolves during maceration. The dissolved components are the nutritive fraction of the corn steep liquor; they are then dehydrated and used for animal feed (Haros, 1999).
Corn steep liquor is 44/50% proteins on dry basis and is usually commercialized combined with fiber, for instance gluten feed. It can also be sold alone, as source of liquid protein to fatten bovines and milk production (with 50% solids)19
Below, the graph illustrates the different maceration steps.
Wet milling - first corn processing. Maceration
2.
18 Carlos Baudino (2020). Corn wet milling (Webinar). Semana de la Ingeniería , 3°
Edición
(Engineering
Week,
3rd edition). Available at: https:// youtu.be/HcpwAcer08M 19 USDA (2010). Technical Evaluation Report for Corn Steep Liquor, USDA Technical Services Branch. Source: Developed in-house by Austral University from interviews with industry referents. ROUND TABLE ON RESPONSIBLE SOY ASSOCIATION (RTRS) — 40
3. Germ separation (Degermination)
3.1. First milling: Gross grinding - breaking
Once corn kernels are macerated, the germ is easily recovered. The first milling is a coarse grinding that breaks the kernel to separate the germ.
Stainless steel rotating, dented mills are used in this step. Distance between the rotating teeth is variable and calibrated based on the kernels size. The whole germ is separated, practically free from endosperm, to be later used in oil extraction.
The germ separation must be clean, without breaking; damaged germ will contaminate the sugars produced from starch, resulting in unsuitable flavors.
3.2. Germ separation (Degermination)
Degermination frees the germ. Broken corn is freed in a watery stream, and is separated by hydrocylones. They are cyclonic separators that centrifuge thanks to a force created inside the cyclone. The different relative speed of the higher and lower density products allows germ separation. Heavy materials go to the cyclone wall and the germ, that is lighter, stays in the bottom.
After separation, the germ is washed until moisture content is 2 to 4%; it is then extracted to produce corn oil.
Corn germ
Corn germ obtained by degermination represents approximately 7% of the total corn received and processed, expressed on dry basis.
Corn germ oil content ranges from 40 to 50% (W.J. van Zeist, 2012), and is used to produce corn oil. Solids from the oil extraction process are used for animal feed, as a supplement, an ingredient of animal feed (with variable inclusion levels, depending on the species to be fed) or incorporated to gluten feed.
Corn oil and corn germ meal
While corn oil is a by-product of wet milling, generally, corn germ is processed only in large volumes. Few centralized, big facilities buy dry corn germ from smaller wet milling plants to extract corn oil (Galitsky et al., 2003). This research considers corn oil extraction and refining as processing steps not typically integrated to wet milling plants; they are activities the authors associate to a second processing.
Crude corn oil represents about 2.9% of the corn volume processed. If we express it on dry basis, crude corn oil is equivalent to 3.4% of the total corn received and processed.
In addition, corn germ meal is a byproduct of oil extraction and represents 3.6% of the corn processed by the industry, expressed on dry basis.
Germ separation is detailed below. It includes a first grinding of corn (gross grinding) and the separation step.
ROUND TABLE ON RESPONSIBLE SOY ASSOCIATION (RTRS) — 41
Wet milling - first corn processing corn degermination
Source: Developed in-house by Austral University from interviews with industry referents.
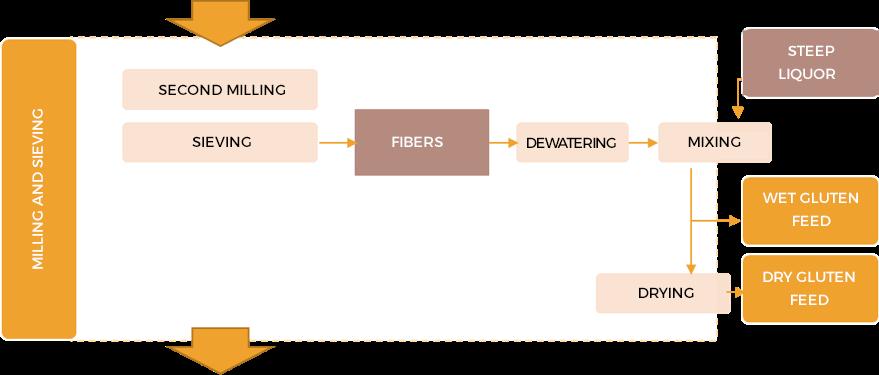
4. Second milling and sieving
4.1. Fine milling: fiber
Once the germ is separated and removed, an impact mill is used to break the fiber and release the starch and gluten. Fiber is not much affected by grinding and can be separated by sieving: this allows getting starch and gluten particles of about 60 microns, and fiber particles over 150/200 microns in size20(Tovar et al., 2013).

4.2. Fiber separation / sieving
Fiber is reduced in size and sieved to separate it from the residual starch and gluten. Concave sieves retain big fiber particles but let small starch and gluten particles pass through. Then, the retained fiber is dehydrated up to a specific moisture content.
The resulting fiber represents about 12% of the corn received and processed, expressed on dry basis.
The fiber obtained by corn wet milling is used for animal feed. It contains a very low percentage of proteins, 9% (dry basis) that cannot compete with pastures. Therefore, the fiber is mixed with concentrated protein liquor from corn maceration, obtaining gluten feed (GF)21
Gluten feed from wet milling results from mixing fiber and concentrated protein liquor; it represents 18% of the corn received and processed, expressed on dry basis.
Gluten feed
Corn gluten feed (GF) is the fibrous part of the kernel. It is generally produced by combining what is left of the corn fiber with steep liquor; it is usually available dry, as gluten feed pellets or as wet gluten feed.
Micron is
that is
of a meter. Its symbol is μ. It is employed to measure
objects.
Carlos Baudino (2020). Molienda Húmeda de Maíz (Corn wet milling) (Webinar). Semana de la Ingeniería , 3° Edición (Engineering Week, 3rd edition). Available at: https://youtu.be/HcpwAcer08M
20
a unit of length
one millionth
microscopic
21
ROUND TABLE ON RESPONSIBLE SOY ASSOCIATION (RTRS) — 42
Nutrient’s composition may vary depending on processing facilities, and the volume and type of corn steep liquor added (Kalscheur y García, 2013). In Argentina, GF is commercialized with a typical protein content ranging from 20 to 25%, on dry basis (CAFAGDA). Gluten feed is a main ingredient in animal feed because it contains a medium level of protein and energy, very much used to complete or concentrate feeds for beef and dairy cattle.
The graph below illustrates the different steps involved in grinding and sieving.
Wet milling - first corn processing grinding and sieving
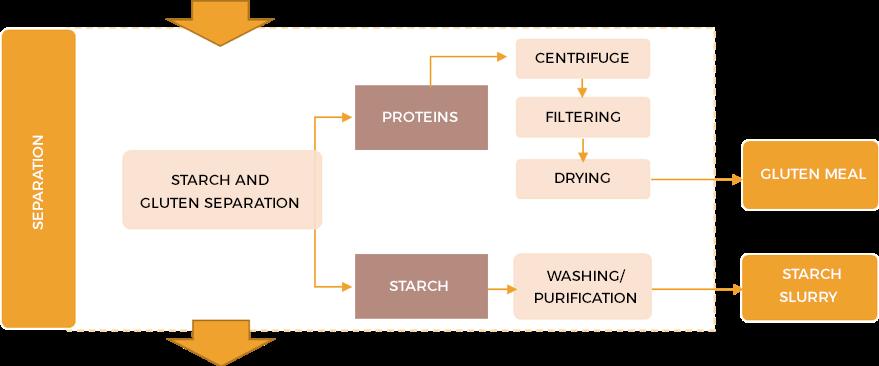
5. Corn gluten and starch separation
Corn gluten and starch separation gives, on the one hand, corn meal gluten for animal feed and, on the other, starch slurry or purified starch, a raw material for the second wet milling processing. Below, the different steps of the corn gluten and starch separation process.
Wet milling - first corn processing gluten andstarch separation
 Source: Developed in-house by Austral University from interviews with industry referents.
Source: Developed in-house by Austral University from interviews with industry referents.
Source: Developed in-house by Austral University from interviews with industry referents.
ROUND TABLE ON RESPONSIBLE SOY ASSOCIATION (RTRS) — 43
5.1. Separation
Gluten and starch remain in the water stream after the fiber is separated; corn germ and fiber have different densities, so they can be separated by centrifuging. The suspension is pumped to a column of rotating discs using centrifuge force; protein and water are less dense so they float and starch lays in the bottom.
Liquid gluten is obtained, then concentrated, centrifuged or filtered to get a cake with 40%/ 50% moisture than can be dried in flash driers22. The product yielded is corn gluten meal; its moisture content is generally 10%.
Gluten meal represents approximately 4% of the total corn received and processed, expressed on dry basis.
Corn gluten meal
Corn gluten meal is high in proteins and used in animal nutrition. Approximately 60% of its weight is protein (dry basis) and most of the carotenoid pigments of the original kernel (Robutti, 2012).
Gluten meal is used for animal feed, especially in poultry farms. Depending on the product qualities or characteristics, GM can be an ingredient for pet foods.
5.2. Starch washing
Once gluten is separated, the starch obtained has some undesirable proteins. In this step, hydro cyclones dilute and wash the starch many times to eliminate any remaining proteins and produce high quality starch, 99.5% purity (CRA, 2002). The starch obtained after washing is called starch slurry, with a solids content of 30 to 40%.
The starch extracted by wet milling generally represents 68.5% of the total corn received and processed, expressed on dry basis.
6. Flow diagram of the first processing in corn wet milling
So far, the authors have described the processes that yield milling byproducts. The following figure illustrates the processes:
A flash dryer can dry a wet solid in a vertical column with a stream of heated air, at high speed. It is primarily used in the chemical, agrifood or pharmaceutical industries.
22
ROUND TABLE ON RESPONSIBLE SOY ASSOCIATION (RTRS) — 44
Source: Developed in-house
Wet milling - first corn processing
Byproducts extraction
Steps, processes, intermediate products and byproducts
by
Austral University from interviews with industry referents.
ROUND TABLE ON RESPONSIBLE SOY ASSOCIATION (RTRS) — 45
Second processing: starch processing
Starch slurry extracted by wet milling goes into what we call second processing, to one of three basic finishing processes that will define the final products obtained.
If starch is extracted without suffering any kind of chemical alteration, it is called native starch. It can be processed to change its functional characteristics, and become what is known as modified starch. Starch second processing can yield sweeteners.
The relative volumes of starch slurry used to produce different products are very variable. Globally, sweeteners have the largest relative share (54%), followed by native starch and modified starch23
Corn refiners also use a part of the glucose solution that is channeled to a fermentation plant to produce ethanol, amino acids and other fermentation products (Shapouri et al., 1995). However, fermentation products are not main industry products; most wet milling plants do not have fermentation equipment, and the process is not analyzed in this research24
7. Starch products: native starch and modified starch
Starch products include native starch and modified starch. Both are starch products because, no matter the modifications resulting from the production process, structurally, these products are starch.
On average, corn starch products obtained by wet milling —native starch and modified starch— represent approximately 68.5% of the total corn used in the process, expressed on dry basis.
Flow diagram: drying and modification
The chart below shows the steps required to produce native starch and modified starch.
23 Fortune Business Insights (2019). Corn Strach Market. Resumen disponible en https://www.fortunebusinessinsights.com/industry-reports/ corn-starch-market-101093 24 En el capítulo 5 del informe se analizan los factores de conversión de la producción de etanol en plantas de molienda seca de maíz. ROUND TABLE ON RESPONSIBLE SOY ASSOCIATION (RTRS) — 46
Wet milling - second processing
Drying and modification. Production of starch products
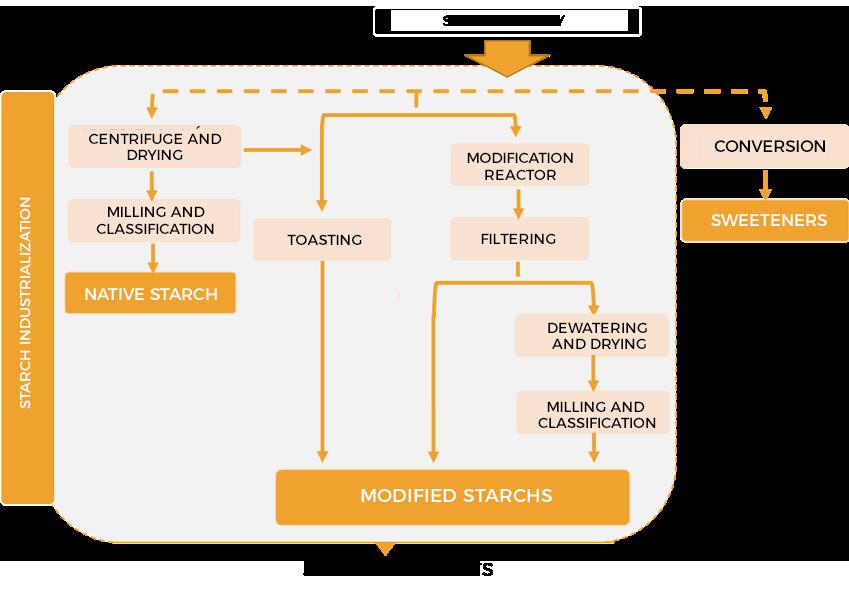
7.1. Native starch
Native starch is the corn starch extracted by wet milling that has suffered no alterations to its chemical structure (CRA, 2013).
To produce native starch, the starch slurry suspension is dewatered with vacuum filters, press filters or centrifuges. The resulting starch cake has a moisture content that ranges from 35% to 42%, it is dried sometimes using flash filters till it is left with a 11% to 15% moisture25
The dried starch is grinded and sieved to remove large particles, then transported by helicoidal feeders to an automatic packaging machine. The product is available in different physical forms: corn starch can be sold as fine or coarse powder, flakes, pearls or agglomerated in larger particles26
Based on its future use, there are two categories: food grade native starch and technical or industrial grade native starch. Both categories are processed the same way, but the food industry requires a higher quality starch than industries using technical starch. Since food starch can be also used for industrial purposes, the usual goal is to obtain food grade starch.
Technical native starches are used to produce corrugated cardboard, in the paper industry, for laundry starch or as raw material for adhesives (CRA, 2013). As ingredient for foods, native starches are a good source of carbohydrates; they can also be texturizing and thickening agents in sauces, dairy products and baked products. They can also be filling stabilizers and drying or molding agents in confectionery. Low moisture native starches are used as anticaking agents in instant dry soups mixes.
Source: Developed in-house by Austral University from interviews with industry referents.25 U.S. Environmental Protection Agency (1994). Emission Factor Documentation for AP-42. Corn Wet Milling. Available at https://www.epa.gov/ sites/production/files/2020-10/documents/b9s09-7.pdf 26 Corn Refiners Association (2013). Corn Starch Booklet. Available at https://corn.org/wp-content/uploads/2013/12/StarchBooklet2013.pdf ROUND TABLE ON RESPONSIBLE SOY ASSOCIATION (RTRS) — 47
7.2.
Modified starch
Many native starch functional properties are sensitive to external factors. For instance, they are insoluble in cold water, are not resistant to temperature changes or mechanical efforts (homogenization) and are pH stable in a limited range (Aviña, 2014). Such technical limiting characteristics condition native starch performance as thickening agent and in the formation of efficient gels.
To enhance performance and adaptation to a wider variety of applications and conditions, native starch can be modified through chemical, physical and/or enzymatic methods. Functional properties are modified, but the modified starch is still, structurally, starch, unlike sweeteners (Lisi, 2012).
Chemical modification methods introduce functional groups based on depolimerization reactions (acid or enzymatic hydrolysis or pyrolysis), oxidation, derivatisation (etherification, esterification, crossing-over, etc.) while physical modification can result from the application of heat and humidity (pre-gelatinization)27
Pirodextrins (commercially known as dextrins)28 are a type of modified starch that is obtained by the partial depolimerization reaction (hydrolysis) of starch. Pirodextrins are produced in a separate facility, not where modified starch is obtained, by dry roasting of native starch, generally using an acid catalyst.
The other modified starches are produced in a single, multi-use reaction tank (batch type reactor29), where starch suffers physical modifications and yields pre-gelatinized starch. Otherwise, the process involves selected chemical agents based on the intended modifications. For example, acid starches require a process with hydrochloric acid: oxidated starches require sodium hypochlorite, and hydroxypropylated starches require propylene oxide. Depending on the intended modification and product, the solution that comes out should be dried and grinded (powder) or delivered in bulk as a suspension.
Modified starches can be used in many different industries including, paper, textiles, the food industry, pharmaceutical, the oil industry, the dairy and meat industries, etc. Products are in constant evolution because the food industry has to meet the emerging needs of the market that foster the development of new products (CAFAGDA30).
8. Starch conversion: sweeteners
Starch slurry that is not intended for the production of starch products, goes to hydrolysis and is converted into sweeteners such as maltodextrin, glucosed syrups, or maltosed syrups. Furthermore, the glucosed syrups obtained from isomerization and chromatographic separation can become high fructose corn syrups.
Corn Refiners Association (2013). Corn Starch Booklet. Available at https://corn.org/wp-content/uploads/2013/12/StarchBooklet2013.pdf
Pirodextrins and maltodextrins result from the dextrinization of starch by dry roasting —heat— but dextrinized syrups result from the partial hydrolysis of starch in a wet process of conversion —using and enzyme—, a process described below: Starch Conversion
The Batch reactor has no inlet or outgoing flow. It has an agitator where chemical reactions occur and that homogenizes the mix, allowing a reaction.
CAFAGDA - Cámara Argentina de Fabricantes de Almidones, Glucosa, Derivados y Afines (Argentine Chamber of Starch, Glucose, Byproducts and Related products Manufacturers)
27
28
29
20
ROUND TABLE ON RESPONSIBLE SOY ASSOCIATION (RTRS) — 48
8.1. Hydrolysis
Starch hydrolysis is the first step to convert starch into sugars. Starch hydrolysis involves the liquefaction and saccharification of starch slurry. Hydrolysis can be acid or enzymatic (Monsalve, Medina y Ruiz, 2006) though most starch hydrolysis processes use the enzymatic method. Depending on the enzymes used, the final product can be glucose or maltosed syrups.
Hydrolysis can be partial or total; the degree of starch conversion is measured by dextrose equivalent (DE); starch DE is practically 0 while glucosed syrup has a DE of 100.
Hydrolysis also yields sweeteners; their properties and characteristics vary depending on the degree of conversion achieved. As DE increases, sweetness, fermentability, solubility and the blackening reaction also increase; at the same time, as the viscosity of the hydrolyzed product decreases, the properties associated to freezing prevention, stickiness and hygroscopicity also decrease.
Products from starch hydrolysis based on their degree of conversion. Functional properties of starch derivates associated to their DE.
Starch hydrolysis leads to a gain in volume (chemical or hydrolytic gain) as a function of the degree of conversion to DE reached. Therefore, the corn conversion factor will vary based on the DE of the sweeteners being considered.
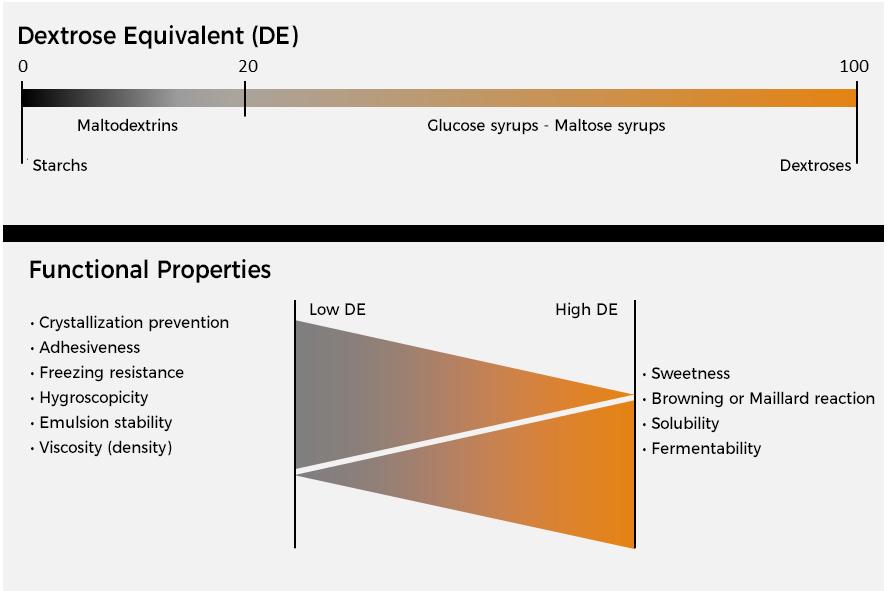 Source: Developed in-house by Austral University based on Salvador Bedolla Bernal (2004).
ROUND TABLE ON RESPONSIBLE SOY ASSOCIATION (RTRS) — 49
i. Liquefaction (viscosity reduction)31
Liquefaction is the partial hydrolysis of starch to dextrins; this process reduces viscosity.
The starch slurry is heated, gelatinized and then subject to liquefaction by partial hydrolysis, adding α-amylase enzymes. This process yields dextrinized syrups or maltodextrins that can complete their hydrolysis through enzymatic transformation; the maltodextrin concentrated solution can be filtered and dried for commercialization.
The starch partial hydrolysis yields maltodextrins; the chemical gain does not exceed, on average, 1.7% of its molecular weight, that is the substrate on dry basis.
Maltodextrins
Maltodextrin composition is usually associated to DE; a DE lower than 20 is called maltodextrin. The typical DE of maltodextrins ranges from 9 to 20. Producers call these 10%, 15%, and 20% maltodextrins, making reference to their DE’s.
Maltodextrins are usually sold as powders with 6% residual moisture, and controlled particle size. The food industry uses maltodextrins as additives, moisturizing and thickening agents to stabilize foods high in fat, disperse dry ingredients, and to favor spray drying of fruit juices flavors and of other products that are difficult to dry. Maltodextrins are also used as a source of carbohydrates in energy drinks because they supply as many calories as sugar.
One ton of starch can yield almost 1.017 tons of maltodextrins (dry basis) with a DE ranging from 15 to 20. So, 1.44 tons of corn should be processed to obtain the starch required to yield 1 ton of maltodextrin.
Maltodextrins obtained by corn wet milling represent approximately 69.7% of the total corn used in the process, expressed on dry basis.
ii. Saccharification: dextrose - glucosed syrups
Starch saccharification and its subsequent liquefaction are necessary steps of the enzymatic processes that yield glucose. Glucoamylase is added in the saccharification step to convert the dextrins yielded by liquefaction into glucose or dextrose. After hydrolysis, the syrup is neutralized and then purified by centrifugation and filtering, and decolored with activated carbon and ionic exchange (Serna et. al., 2011).
Saccharification —depending on the DE reached— yields glucose syrups with a DE higher than 20 and dextrose with a DE not lower than 99.5.
Corn or glucose syrups
This process yields corn or glucose syrups that are aqueous, concentrated and purified starch solutions partially hydrolyzed, and with a solid content of over 70% and DE < 20 and >95 (Hobbs, 2009). They are commercialized in liquid form, though they can be partially dehydrated to obtain the so-called dehydrated glucose syrup or corn syrup solids.
31 MSc. Ch. Eng. Mario Aguilera Merlo, UNSL - Facultad de Ingeniería y Ciencias Agropecuarias, FICA (School of Engineering and Agricultural Sciences).ROUND TABLE ON RESPONSIBLE SOY ASSOCIATION (RTRS) — 50
Corn or glucose syrups are very much used by the confectionery and processed foods manufacturers because they supply sweetness, an adequate balance of sugars in the formulas, prevent crystallization, soften texture, and add viscosity, moisture, etc.
The glucose syrups produced in Argentina have a typical DE of 38; the chemical gain resulting from starch conversion is about 4.39%.
Considering a reference dextrose level of 38, it is estimated that 1.40 tons of corn should be processed to extract the starch that yields one ton of glucose syrup (dry basis). Glucose syrups (DE 38) represent, on average, 71.5%, expressed on dry basis.
Dextrose
When dextrose syrups (glucose) have higher DE’s, they are crystallized to produce tow products commercially known as dextrose monohydrate and anhydrous dextrose. Anhydrous dextrose is a highly purified product with a very low total moisture content (98% solids). It is the best option for water-sensitive systems as chocolate compositions and candies. Dextrose monohydrate and anhydrous dextrose are one and the same product but dextrose monohydrate water crystallization molecule is 90% solids.
Dextrose has many uses in the food industry, including medicinal specialties, soft drinks, juices and dairy products. It is used in fermentation processes, e.g., production of citric acid. It also increases the volume of fermentable sugars in wine production and in sorbitol production by hydrogenation.
Corn conversion factors to dextrose estimate that each ton of hydrolyzed starch produced by wet milling yields about 1.057 ton of dextrose/glucose, expressed on dry basis (McVey et al., 1996). Therefore, 1.38 ton of corn is required to yield 1 ton of glucose (dry basis).
Glucose yielded by corn processing represents approximately 72.4% of the total corn used in the process, expressed on dry basis.
iii. Hydrolysis for maltosed syrups31
Regular maltose syrups and high maltose syrups result from dextrinized syrups, yielded by liquefaction Dextrines are treated with β-amilase enzymes or with a combination of pullulanase andy β-amilase. β-amilase, if used alone, yields regular maltose syrups with 50 to 55% maltose, while pullulanase and β-amilase, if used together, yield high maltose syrups with approximately 80% maltose.
When hydrolysis is complete, the syrup is refined by centrifugation and filtration, decolored with activated carbon and ionic exchange, and evaporated for greater concentration. Maltose syrups are commercialized with approximately 20% moisture content.
Maltose syrups are primarily used by breweries, as a substitute of malt. However, confectionery has adopted these syrups for they provide lower hygroscopicity, shine up appearance, and result in greater solubility and resistance to Maillard reactions (typical yellowing produced by heating).
Corn conversion factors to regular maltose syrups estimate that each kilogram of hydrolyzed starch yields 1.058 kg of maltose syrup (dry basis). So, in wet milling, 1.38 tons of corn will yield the starch required to produce 1 ton of regular maltose syrup (dry basis).
31 UNSL -
Facultad de Ingeniería y Ciencias Agropecuarias, FICA (School of Engineering and Agricultural Sciences).
ROUND TABLE ON RESPONSIBLE SOY ASSOCIATION (RTRS) — 51
Regular maltose syrups represent, on average, 72.5% of the corn used in the process, measured on dry basis.
High maltose syrups have a reference chemical gain of 7.5%. So, 1kg of starch can yield 1.075 kg of high maltose syrup.
It is estimated that 1.36 tons of corn must be processed (dry basis) to produce the starch required to yield one ton of high maltose syrups. Therefore, high maltose syrups represent, on average, 73.6% of the corn processed, expressed on dry basis.
iv. Flow diagram: hydrolysis
Below, detailed hydrolysis steps that correspond to the starch conversion process.
Wet milling - second processing Starch conversion: hydrolysis
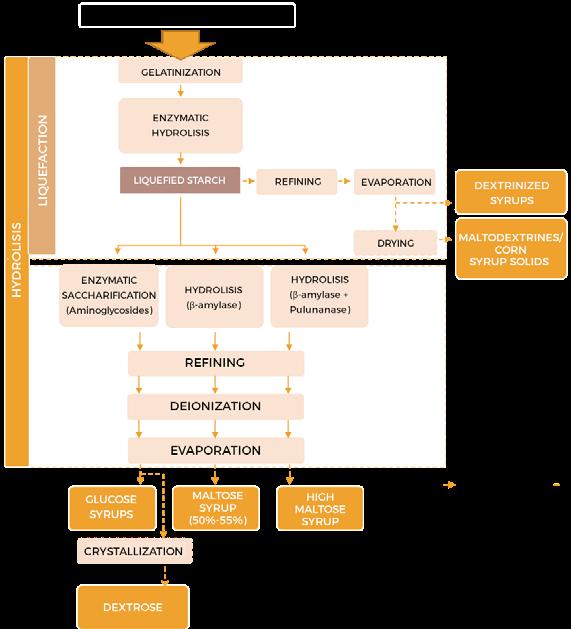 Source: Developed in-house by Austral University from interviews with industry referents and Serna (2011)
ROUND TABLE ON
RESPONSIBLE SOY ASSOCIATION (RTRS)
— 52
9. Starch conversion to fructose
High fructose corn syrup (HFCS) is a sweetening syrup produced by double enzymatic conversion: starch, dextrose, fructose.
The glucose syrups (dextrose) resulting from hydrolysis undergo an isomerization process that converts dextrose to fructose at 42% (HFCS 42).
The enriched syrup has 90% fructose (HFCS 90), goes through chromatographic separation, and is then mixed with HFCS 42 to yield a syrup with 55% fructose (HFCS 55).
i. Flow diagram: starch conversion to HFCS
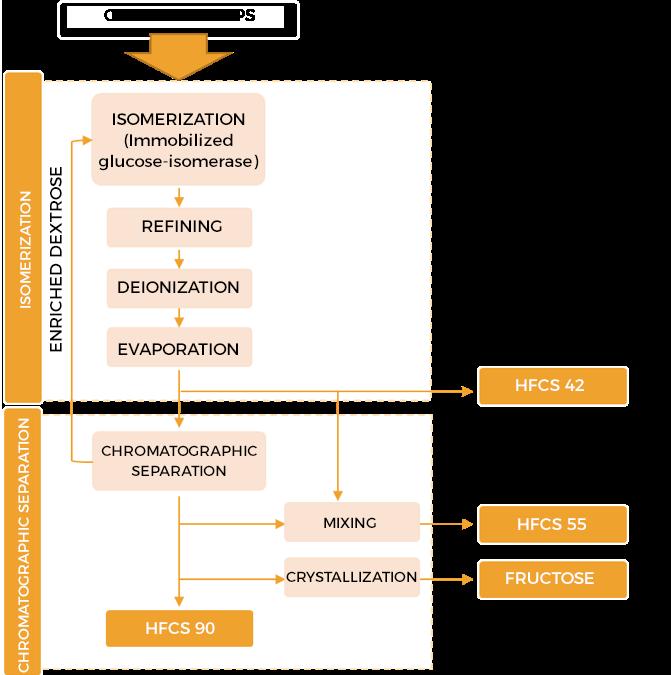
Below, detailed isomerization and chromatographic separation steps that correspond to starch conversion.
Wet milling - second processing
Starch conversion: isomerization and chromatographic separation
Source:
Developed in-house by Austral University from interviews with industry referents and Hobbs (2009) ROUND TABLE ON RESPONSIBLE SOY ASSOCIATION (RTRS) — 53
Isomerization
Glucosed syrup conversion (DE 93%/ 96%) to high fructose corn syrup 42 (HFCS) is done by isomerization. The process uses immobilized glucose isomerase32. Enzymes can transform up to 42% of the glucosed syrup in fructose, therefore, its name.
After the conversion, the product is treated with active carbon, and then evaporated to adjust the solid content. Brix degrees set the solid content of syrups, between 71 to 80 degrees Brix (Hobbs, 2009).
If we express yield on dry basis, HFCS 42 obtained by wet milling represents 72.4% of the corn used in the process (on dry basis).
HFCS 42
Fructose syrup 42 is sweet, colorless, and refined by ionic exchange to comply with the highest food standards that grade color, transparency, taste, ashes and microbiological limits. It is used in carbonated and alcoholic drinks, fruit juices, cookies, and cakes not only as a sweetening agent but because of its moisturizing and texturizing qualities.
iii. Chromatographic separation
The HFCS 42 obtained by isomerization is processed to further concentrate fructose. An evaporator is used to adjust solids to 60%, and the product is then sent to chromatographic separation.
Chromatographic separation separates glucose and fructose. Through a series of automatic valves, it is possible to draw off a stream of enriched dextrose, as well as of enriched fructose (Hobbs, 2009). Separate dextrose and fructose streams typically present an 85% to 90% purity.
While the refined dextrose returns to the system and goes to a second isomerization, chromatographic separation yields an enriched syrup with 90% fructose. This syrup can be mixed with high fructose syrup (42% fructose) to yield different specifications and concentrations products, ranging from 42% to 90% fructose, or may be sent to a separate stream to produce high fructose syrup or crystalline fructose at 90%. The best-known fructose corn syrup is 55% fructose.
HFCS 55
It is a very sweet, colorless syrup; it is twice refined by ionic exchange to reach notable purity, and transparency; it contains practically no microbiological agents or particles in suspension. It is primarily used to sweeten sugary drinks (concentrated and powder juices, soft drinks, flavored beverages) and in apéritifs.
If we express yield on dry basis, HFCS 55 obtained by wet milling represents 72.4% of the corn used in the process (on dry basis).
If fructose purity is high enough (minimum, 90%), it is possible to produce crystallized fructose. To that end, fructose should be crystallized, dried, and grinded to a specific particle size, and then packed. The crystallized product is shiny white in color and very pure.
32 There are non-enzymatic processes but most yield undesirable products, ashes, odors and even taste changes.
ii.
ROUND TABLE ON RESPONSIBLE SOY ASSOCIATION (RTRS) — 54
Crystallized fructose
Crystallized fructose can be used in a number of foods and drinks; when compared to other fructose syrups, crystallized fructose can be used in products that require dry sweeteners, which is an advantage.
Crystallized fructose yielded by wet milling represents 72.4% of the corn used in the process, on dry basis.
10. Flow diagram: second refining in corn wet milling
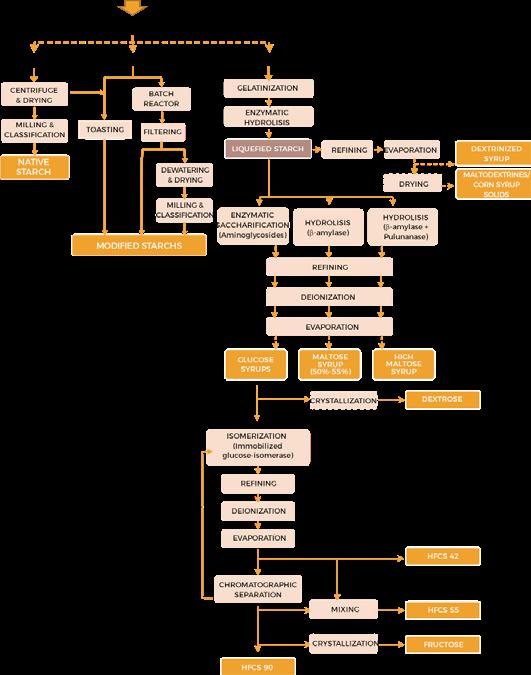
Below, a flow diagram detailing the processes that yield native starch, modified starch, and the different sweeteners from corn wet milling second processing.
Wet milling - second processing Drying, modification and starch conversion
Source: Developed in-house by Austral University from interviews with industry referents, Serna (2011) and Hobbs (2009).
ROUND TABLE ON RESPONSIBLE SOY ASSOCIATION (RTRS) — 55
Corn conversion factors calculation in wet milling
Corn conversion factors are the number of corn tons used to yield one ton of the different corn products and byproducts. Conversion factors of the products resulting from wet milling and starch processing are estimated.
These conversion factors are mainly a result of the composition of corn - its moisture, protein, starch and other elements content - as well as of the physical and chemical refining processes. The corn wet milling industry adequately calls the conversion factors determination studies as “mass balance studies” (Feeney, 2020).
Information concerning how to estimate corn conversion factors in wet milling was gathered from different technical sources, including wet milling companies and industry experts.
Previous studies on mass balance in corn processing, for instance W.J. Van Zeist et al. (2012), Ramirez (2009), Galitsky (2003), y Kim y Dale (2002) refer to the corn conversion factors that result from the first processing.
W.J. van Zeist et. al.33 paper includes detailed information on the processes involved and the evolution of the dry basis content of intermediate products obtained in the first processing of corn. McVey, Baumel y Hurburgh (1996), Gray et. al. (1994) y Wulff y Helgeson (1987) as well as other authors have published technical conversion coefficients for products yielded by corn starch transformation.
Wulff y Helgeson paper is a preliminary feasibility study on a corn wet milling plant in the US. Therefore, McVey, Baumel y Hurburgh develop a model to quantify the economic impact of changes in corn allocation to different industrial processes.
They present conversion factors expressed in two different ways:
- On dry basis: the industry usually expresses the technical conversion coefficients on dry basis. This indicator results from considering the corn kernel dry matter34 that is actually grinded, that is, it does not include any losses at reception (broken kernels and foreign materials) or any variation in the moisture content of the different products obtained as processing moves forward.
- On commercial basis or as is: this indicator refers to commercial corn conversion factors, that is, the moisture content when the farmer sells the corn (usually 14.5%), the actual moisture content in every wet milling byproduct and the losses from corn reception.
Corn wet milling products and byproducts specific characteristics are very varied (degree of conversion, moisture content, etc.) that impact on their conversion values or their corn equivalent (tons). This research estimates the conversion technical coefficients, considering typical characteristics of the wet milling products and setting reference values validated by experts, which ensures the reasonable quality of the results obtained.
33 W.J. van Zeist et. al (2012). LCI data for the calculation tool Feedprint for greenhouse gas emissions of feed production and utilization. Wet Milling Industry. Blonk Consultants
34 Corn dry matter is what is left of the kernel after extracting all the moisture content.
ROUND TABLE ON RESPONSIBLE SOY ASSOCIATION (RTRS) — 56
Wet milling conversion factors. Overview
When calculating the corn conversion factors detailed below, consideration should be made to the fact that wet milling facilities and yields of corn first processing are very similar worldwide. However, further processing of starch slurry to obtain different products vary quite widely. Therefore, a specific methodology is required to calculate the corn conversion factors of products yielded by starch processing. That methodology combines two indicators: i) corn conversion factor to produce starch (how much corn is necessary to produce 1 ton of starch?); ii) the technical reference coefficient to transform starch into each specific product (how much starch is necessary to produce 1 ton of product?).
Methodology to calculate corn conversion factors in products from starch processing
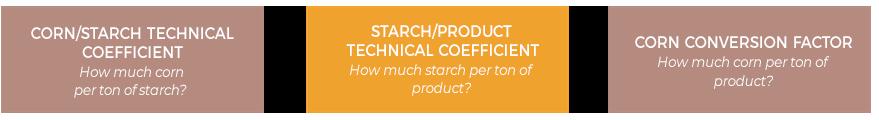 Source: Developed in-house by Austral University
Corn wet milling products and byproducts present a wide variety of specific characteristics (including degree of conversion35 , moisture content) that impact on their conversion factors and their equivalent in corn kernels. This research calculates the conversion technical factors considering the most popular characteristics of industrial processes and the main products from wet milling worldwide; the authors also set reference values validated by experts, which ensures the reasonable quality of the results obtained.
Process losses
Losses occur during production. We refer to two types of losses: i) those that occur at reception, and ii) those that occur during corn refining processes.
i) Losses occurred at corn reception are 2.4% of the corn volume received (on commercial basis, as is) at the wet milling plant (Van Zeist et. al, 2012). Those losses include broken kernels, moisture, foreign materials, as well as plastics, pieces of wood, dirt, etc. that may break or damage equipment and should, therefore, be removed.
ii) On the other hand, this research also considers the losses occurred during corn refining processes, including grain components such as proteins, germ, fiber, and starch. These losses occur during washing, where components are lost in wastewater. Losses range from 2% to 4.5% of the corn received and processed, on dry basis. Based on experts’ opinions, a 2.5% is the internationally estimated loss (on dry basis), or its equivalent on commercial basis of 2.1%, with a 14.5% moisture content.
35 It refers to the conversion degree of starch to dextrose/maltose/fructose.
ROUND TABLE ON RESPONSIBLE SOY ASSOCIATION (RTRS) — 57
This research thus considers that total losses of corn wet milling (losses at corn reception and during processing) may reach 4.5% of the corn received, expressed on commercial basis.
Conversion factors on dry basis
The conversion factors for each of the by-products resulting from corn processing are used to determine yields. Yields are first expressed on dry weight basis of the corn actually grinded, that is, after the waste materials (broken kernels and foreign materials) are removed at reception.
First processing: extraction of byproducts
Corn steep liquor: Almost 6% of the kernel dry weight dissolves and becomes corn steep liquor (Haros, 1999).
Germ: Corn germ from germ separation represents approximately 7% of the total corn received and processed, expressed on dry basis.
Corn oil:Corn oil extracted from the germ is approximately 3.4% of the corn processed, on dry basis. Corn Germ meal: Corn germ meal represents 3.6% of the corn processed by the industry, expressed on dry basis.
Fiber: The fiber yielded by the second grinding and sieving is about 12% of the corn received and processed, on dry basis.
Fiber is generally mixed with concentrated protein liquor from corn maceration to get a higher protein percentage. The product obtained is called gluten feed.
Gluten feed: Gluten feed from mixing fiber and corn steep liquor represents 18% of the corn received and processed, expressed on dry basis. Gluten feed is generally available dry, in pellets or wet (wet gluten feed).
Depending on many different factors, corn steep liquor, germ and fiber may also be final products, but they are usually processed as described above.
Gluten meal: Corn gluten meal is high in proteins and used for animal feed. Gluten meal from corn wet milling represents 4% of the total corn received and processed, expressed on dry basis.
Starch: The starch from the first refining is called starch slurry, with solids content of 30 to 40%. It represents 68.5% of the total corn received and processed, expressed on dry basis.
Second processing: starch processing
Industrial facilities use different relative volumes of starch slurry for their production processes. Starch has many uses and can be used to make different products, including modified starch, glucose, high fructose corn syrup; the industrial facility structure of course depends on the final product. This processing stage does not yield byproducts.
35 Refiere al grado de conversión del almidón a dextrosa/ maltosa/ fructosa.
ROUND TABLE ON RESPONSIBLE SOY ASSOCIATION (RTRS) — 58
Based on the information collected, the table below details the corn refining yields:
Starch products: Native and modified starches are starch products because, no matter the modifications resulting from the production process, structurally, these products are starch. Corn conversion factors calculations estimate that each ton of starch on dry basis from the first refining yields 1 ton of native starch or 1 ton of modified starch, expressed on dry basis.
Corn starch products from wet milling represent approximately 68.5% of the total corn used in the process, expressed on dry basis.
Sweeteners: Sweeteners are obtained by hydrolysis; their properties and characteristics vary, making it more difficult to calculate their conversion factors.
There is a chemical gain in hydrolysis, and the level of conversion to dextrose (dextrose equivalent) impacts on yield. High fructose corn syrups as well as glucosed syrups and dextrinized syrups are products which commercial presentations include different solids.
Below, based on a review of the literature and experts’ opinions, the estimated yields of sweeteners obtained by corn wet milling, expressed on dry basis.
• Maltodextrins (DE 15 to 20): lFor maltodextrins with a DE ranging from 15 to 20, the chemical gain of starch conversion is close to 1.7%. Each ton of dry starch can yield 1.017 tons of maltodextrin, expressed on dry basis. So, maltodextrins represent approximately 69.7% of the total corn used in the process, expressed on dry basis.
• Glucose/Dextrose: Corn conversion factors to glucose (DE 100) estimate that each ton of hydrolyzed starch produced from wet milling yields about 1.057 ton of glucose, expressed on dry basis. Therefore, the glucose/dextrose obtained by corn processing represents approximately 72.4% of the total corn used in the process, expressed on dry basis.
• Glucose syrups (DE 38): Most glucose syrups produced in Argentina are DE close to 38, then, their production gives a chemical gain that is a bit lower when compared to the total conversion to dextrose. Each ton of hydrolyzed starch can yield 1.043 ton of glucose syrup, expressed on dry basis. Glucose syrups produced from wet milling represent, on average, 71.5% of the corn processed, expressed on dry basis.
• High fructose corn syrups (HFCS 42 and 55): The corn conversion factor to produce HFCS was estimated: 1 ton of glucose (dry basis) can yield 1 dry ton of HFCS. So, HFCS represent approximately 72.4% of the total corn used in the process, expressed on dry basis.
• Regular maltose syrups: Every ton of hydrolyzed starch can yield 1.058 tons of regular maltose syrups. So, the maltose syrups volume obtained by corn refining represents about 72.5% of the corn received (dry basis).
• High maltose syrups: One ton of hydrolyzed starch (dry basis) can convert into 1.075 tons (dry) of high maltose syrup. Therefore, high maltose syrup represents 73.6% of the corn received (dry basis).
ROUND TABLE ON RESPONSIBLE SOY ASSOCIATION (RTRS) — 59
Below, the technical coefficients to obtain the products and byproducts of corn wet milling. It is important to mention that, once corn byproducts are obtained, different volumes of starch can be used in further processing steps.
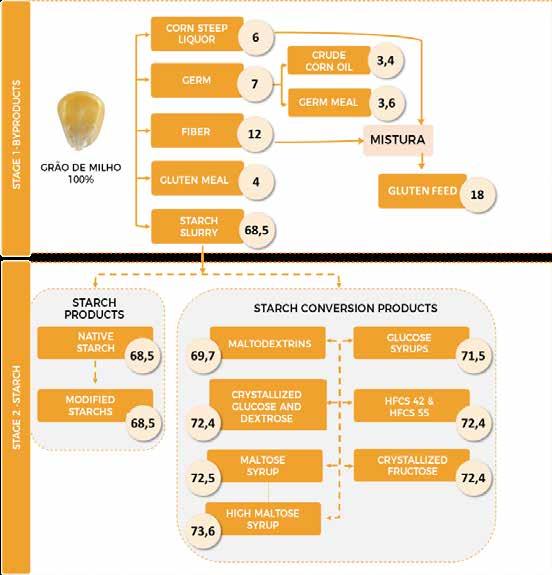
Corn wet milling
Technical coefficients to obtain corn products and byproducts Expressed as a % on dry basis (*)(**)
(*) Losses from processing are estimated at 2.5% (on dry basis). Losses occurred at reception are not considered. (**) The starch conversion process involves chemical gains. Consequently, the industrial yield of starch conversion products is higher than those of starch. ROUND TABLE ON RESPONSIBLE SOY ASSOCIATION (RTRS) — 60
These conversion values may also be expressed as the corn tonnage required to obtain one ton of any of the by-products obtained by corn wet milling, expressed on dry basis.
Corn tonnage required to yield 1 ton of wet milling byproducts. Expressed on dry basis (DB) (*)
Yield (% DB)
Germ Corn oil
Corn germ meal
Gluten feed
Corn steep liquor Fiber
Gluten meal
Starch
Maltodextrins (DE 16 to 19)
Glucose (DE=100)
Glucose syrups (DE= 38) Maltose syrup High maltose syrup
HFCS 42
HFCS 55
Dry milling required tonnage 14,29 29,67 27,56 5,56 16,67 8,33 25,00 1,46 1,44 1,38 1,40 1,38 1,36 1,38 1,38
(*) On dry basis. Losses from processing are estimated at 2.5% (on dry basis). Losses occurred at reception are not considered.
Conversion factors on commercial basis (as is)
The conversion factor expressed as is considers the moisture content when the farmer sells the corn —estimated at 14.5%— and the actual moisture content in every product or byproduct obtained by wet milling. To fully reflect the volume of corn required to yield different products, the conversion factor expressed on commercial basis considers the losses at the point of reception.
Below, a chart showing the mass balance results of corn wet milling on dry basis, and their conversion to as is. Products obtained by corn wet milling can have many different commercial presentations, therefore, their industrial yields have been determined considering their typical solid content, as detailed below.
7,0% 3,4% 3,6% 18,0% 6,0% 12,0% 4,0% 68,5% 70,0% 72,4% 71,5% 72,5% 73,6% 72,4% 72,4%
ROUND TABLE ON RESPONSIBLE SOY ASSOCIATION (RTRS) — 61
Corn wet milling
Technical coefficients to obtain corn products and byproducts expressed on dry basis and on commercial basis.
On dry basis
Input
Corn kernel Output Germ
Crude corn oil
Corn germ cake
Gluten feed
Wet gluten feed
Corn steep liquor
Fiber
Gluten meal
Starch
Maltodextrins (DE 15 to 20)
Glucose syrup (DE 38)
Dextrose anhydrous
Dextrose monohydrate
Maltose syrup
High maltose syrup
HFCS 42
HFCS 55
Losses
Total losses
Losses / Refining
Losses / Grain reception
100% 7,0% 3,4% 3,6% 18,0% 18,0% 6,0% 12,0% 4,0% 68,5% 69,7% 71,5% 72,4% 72,4% 72,5% 73,6% 72,4% 72,4% 2,5%
Solids content As is/ on commercial basis (*) 85,5% 92,0% 100% 85,5% 90,0% 45,0% 50,0% 95,0% 90,0% 92,0% 94,0% 80,0% 98,0% 90,0% 80,6% 80,3% 71,0% 75,0%
100% 6,3% 2,8% 3,5% 16,7% 33,4% 10,0% 10,5% 3,7% 62,1% 61,8% 74,6% 61,6% 67,1% 75,0% 76,5% 85,1% 80,6% 4,5% 2,1% 2,4%
(*) Corn moisture content is estimated at 14.5% and total losses are estimated at 4.5% of the corn volume received in wet milling facilities (commercial basis, as is).
Corn conversion values express the corn tonnage (on commercial basis) required to obtain one ton of any of the by-products obtained by corn wet milling (on commercial basis). The technical coef ficients detailed in the chart above were used to calculate the corn equivalent for every product, dividing 1 into the percentage of the product obtained by processing a certain volume of corn.
ROUND TABLE ON RESPONSIBLE SOY ASSOCIATION (RTRS) — 62
Germ
Crude corn oil
Corn germ cake
Gluten feed
Wet gluten feed Corn steep liquor Fiber
Gluten meal
Starch
Maltodextrins (DE 15 to 20)
Glucose syrup (DE 38)
Dextrose anhydrous
Dextrose monohydrate
Maltose syrup
High maltose syrup
HFCS 42 HFCS 55
Corn tonnage required to yield one ton of any wet milling byproduct. Expressed on commercial basis (*) 6,3% 2,8% 3,5% 16,7% 33,4% 10,0% 10,5% 3,7% 62,1% 61,8% 74,6% 61,7% 67,1% 75,0% 76,5% 85,1% 80,6%
Yield (*) (% as is)
tons of Corn required (as is) 15,7 35,6 28,2 6,0 3,0 10,0 9,5 27,0 1,6 1,6 1,3 1,6 1,5 1,3 1,3 1,2 1,2
(*) Corn moisture content is estimated at 14.5% and total losses are estimated at 4.5% of the corn volume received in wet milling facilities (commercial basis, as is).
References
Ahmed Ullah, Asim Mushtaq , Rizwan Ahmed Qamar , Zaeem Uddin Ali (2019). STATISTICAL STUDY FOR CONVERSION OF GLUCOSE TO HIGH FRUCTOSE CORN SYRUP. Disponible en http://www.sciint.com/pdf/636945057408236930.edited.pdf.
Aníbal Alvarez (2006). Aplicaciones del maíz en la tecnología alimentaria y otras industrias. En: Maíz y Nutrición. Informe sobre los usos y las propiedades nutricionales del maíz para la alimentación humana y animal. ILSI Argentina. Serie de Informe especiales.
Aviña Jesús (2014). Almidones Modificados. Productos y aplicaciones para Lácteos y Cárnicos ( Diapositivas de PowerPoint). Recuperado de https://www.tecnolacteoscarnicos.com/resumen/2014/ p7.pdf.
Bedolla-Bernal S. (2004). Introducción a la tecnología de los alimentos. 2° Edición. Ed. Limusa. Carlos Baudino (2020). Molienda Húmeda de Maíz (Webinar). Semana de la Ingeniería, 3° Edición. Disponible en: https://youtu.be/HcpwAcer08M.
ROUND TABLE ON RESPONSIBLE SOY ASSOCIATION (RTRS) — 63
CASTELLARI CLAUDIA; DE LA TORRE DIEGO (2012). Poscosecha en la cadena de maíz. Argentina. Buenos Aires. Libro. Artículo Completo. Congreso. Primer Congreso de Valor Agregado en Origen. INTA -PRECOP.
Corn Refiners Association (2013). Corn Starch Booklet. Disponible en https://corn.org/wp-content/ uploads/2013/12/StarchBooklet2013.pdf.
Fred Gray (1993). U.S. Corn Sweetener Statistical Compendium: Issues 865-868. U.S. Department of Agriculture, Economic Research Service. Disponible en https://play.google.com/books/ reader?id=N5x4jPCwBgQC&hl=es_419&pg=GBS.PA8.
Galitsky, Christina, Worrell, Ernst, & Ruth, Michael (2003). Energy efficiency improvement and cost saving opportunities for the Corn Wet Milling Industry: An ENERGY STAR Guide for Energy and Plant Managers. United States. https://doi.org/10.2172/816536
Grande Tovar, Carlos David, & Orozco Colonia, Brigitte Sthepani (2013). Producción y procesamiento del maíz en Colombia. Revista Científica Guillermo de Ockham, 11(1),97-110. ISSN: 1794-192X. Disponible en: https://www.redalyc.org/articulo.oa?id=1053/105327548008
Haros, Claudia Mónica. (1999). Molienda húmeda de Maíz : Optimización del proceso y desarrollo de nuevas técnicas tendientes a mejorar la calidad de sus productos. Facultad de Ciencias Exactas y Naturales. Universidad de Buenos Aires. http://digital.bl.fcen.uba.ar/Download/Tesis/Tesis_3217_ Haros.pdf
Hobbs, Larry. (2009). Sweeteners from Starch. 10.1016/B978-0-12-746275-2.00021-5.
José L. Robutti (2012). Calidad y Usos del Maíz (Capítulo 11). En: G. Eyherabide (Ed.), “Bases para el manejo del cultivo de maíz”. Ediciones Instituto Nacional de Tecnología Agropecuaria. Buenos Aires Argentina.
Kalscheur, K y García, Á (2013). Co-productos del etanol para las dietas del ganado. Sitio Argentino de Producción Animal. Disponible en: http://www.produccion-animal.com.ar/tablas_composicion_ alimentos/92-coproductos_etanol.pdf.
Kim S., Dale B.E., 2002, Allocation Procedure in Ethanol Production System from Corn Grain, Michigan State University, USA.
MARÍA SILVANA LISI (2012). CARACTERIZACIÓN DE ALMIDONES DE MAÍZ: NATIVO Y MODIFICADOS. Tesis de la Facultad de Ciencias Químicas de la Universidad Católica de Córdoba para obtener el título de Magister en Tecnología de Alimentos.
McVey, Marty J.; Baumel, C. Phillip; and Hurburgh, Charles R. Jr., (1996). Efficient Distribution of Grain to Meet the Quality Needs of EndUsers. Agricultural and Biosystems Engineering Project Reports. http://lib.dr.iastate.edu/abe_ag_reports/1.
Moitre, Malena; Cochi, Florencia y Muzzio, María Elizabeth (2018). Producción de Maltodextrina a partir de Almidón. Universidad Tecnológica Nacional - Facultad Regional Villa María.
ROUND TABLE ON RESPONSIBLE SOY ASSOCIATION (RTRS) — 64
P. Lavarello (2003). La trama de maíz en Argentina. CEPAL, a solicitud de la Secretaría de Política Económica, Ministerio de Economía de la Nación.
Ramírez, E.C., Johnston, D.B., McAloon, A.J. et al. (2009). Enzymatic corn wet milling: engineering process and cost model. Biotechnol Biofuels. https://doi.org/10.1186/1754-6834-2-2.
Ramirez, Edna & Johnston, David & McAloon, Andrew & Yee, Winnie & Singh, Vijay. (2008). Engineering process and cost model for a conventional corn wet milling facility. Industrial Crops and Products. 27. 10.1016/j.indcrop.2007.08.002.
Scott Wulff y Delmer Helgeson (1987). Preliminary Economic Feasibility Analysis of High Fructose Corn Syrup Processing in the United States with Emphasis on North Dakota. Agricultural Economics Report No. 229. North Dakota State University.
Serna, S.O (2011). Bioconversion de Almidones en Jarabes Dextrinizados, Maltosados,Glucosados y Fructosados. Quinto Simposio Internacional de Innovacion y Desarrollo de Alimentos, Montevideo, Uruguay.
T. J. Applegate, M. Latour, K.E. Ileleji, U. Hoffstetter, I. Rodrigues (2008). Nuevas perspectivas en el uso de co-productos de la industria del bioetanol en la fabricación de piensos. XXIV Curso de Especialización FEDNA.}
Tensiska et. al (2016). Production and Characterisation of Maltodextrin from Corn Starch by Enzymatic Hydrolysis Method.
U.S. Environmental Protection Agency (1994). Emission Factor Documentation for AP-42. Corn Wet Milling. Disponible en https://www.epa.gov/sites/production/files/2020-10/documents/b9s09-7.pdf.
USDA (2010). Technical Evaluation Report for Corn Steep Liquor, USDA Technical Services Branch.
Vijay Singh (2020), Enzymes Use in Corn Wet Milling Process (Webinar). Novozymes. https://www. novozymes.tv/video/63137168/how-biotechnology-is-shaping-corn-1.
W.J. van Zeist et. al (2012). LCI data for the calculation tool Feedprint for greenhouse gas emissions of feed production and utilization. Wet Milling Industry. Blonk Consultants.
ROUND TABLE ON RESPONSIBLE SOY ASSOCIATION (RTRS) — 65
Corn Conversion Factors
dry milling
Chapter IV: Corn
Corn dry milling
Description
Corn dry milling has existed for centuries; milled fractions have been supplied as tasty and convenient alternatives to cereal consumption (Sergio O. Serna-Saldivar, 2016)36. Currently, there are two main processes that the literature usually refers to as corn dry milling that obtain ingredients for the food industry: i) whole grain milling to obtain semolina or meals without removing the fat, and ii) dry milling of degerminated corn.
First, whole grain dry milling to produce meal or semolina is a simple method used when grits are to be consumed shortly after their processing. That process does not attempt to fractionate the kernel but to mill it into consistent particles sizes, without any separation. The resulting products are used for human consumption; their storability is limited due to the presence of crushed germ and the potential rancid odor and flavor from the oil present in the germ cells (Eckhoff, 200437). Most dry milling facilities currently eliminate the germ before crushing the kernel, a process called germ separation (germ removal), just to overcome storability issues. This milling is called dry milling of degerminated corn and involves physical processes to break loose, separate and break the pericarp, the germ and the endosperm Refined endosperm pieces (grits) of different sizes are obtained with a fat content below 1%, which increases durability.
Corn dry milling based on semi humid germ removal is the most popular system worldwide and the type of industrial refining discussed in this chapter. Corn dry milling primarily focuses on producing endosperm grits that are used in manufacturing breakfast cereals, energy bars, semolina or grits for expanded snacks, breweries or polenta.
Hereinafter, this process will be referred to as corn dry milling or corn dry milling with germ removal.
About results representativeness
While germ removal is used worldwide, milling systems are not all the same and depend upon the product’s intended use. The conversion factors detailed below are representative of dry milling processes for the production of endosperm grits, semolinas or grits, the most popular products worldwide.
On the other hand, when dry milling is used to yield flour, as in Africa, the system is designed to produce fine particles. The corn type and the processing required are different from those used when the intended product is grits; dry milling conversion factors, then, are not representative of this process.
216-225, ISBN 9780127654904, https://doi.org/10.1016/B0-12-765490-9/00088-4.
Chapter IV
36 Sergio O. Serna-Saldivar, (2010). Cereal Grains: Properties, Processing, and Nutritional Attributes. 37 S.R. Eckhoff, 2004. MAIZE | Dry Milling, Encyclopedia of Grain Science, Elsevier,Pages
ROUND TABLE ON RESPONSIBLE SOY ASSOCIATION (RTRS) — 67
Dry milling products and their uses
Dry milling of degerminated corn primarily yields: (i) endosperm grits (hominy grits), (ii) semolinas or grits (for polenta, extrusion or brewery grits), or (iii) fine corn meal. Particle size, fat solids and the finishing quality of the grits differentiate the products. Furthermore, corn dry milling yields corn germ and bran that are usually combined in the low-quality milling streams to produce zootechnical flour, a byproduct for animal feed.
Dry milling products are produced under customers’ specifications. One same product may have different specifications based on production equipment, process technologies and the intended final product quality. Specifications determine the products’ fat content, particle size of fractions and the finishing quality and moisture content. Below, a characterization of corn dry milling products and byproducts, based on particle size, fat solids and typical specifications for their different uses.
Corn Dry Milling Products
(i) Endosperm grits
Hominy grits or flaking grits are corn endosperm pieces peeled and degerminated that are generally used to produce breakfast cereals. Other frequent uses are typical dishes as munguzá in Brazil, samp or mealy rice in African countries and mazamorra in Latin America (Silvio Pagnacco, 2014)38
Corn grits particle size ranges from 3300 to 6000 microns (3.3 to 6 mm); particle size distribution of fractions —endosperm grits— can be classified as coarse, mid or fine.

Silvio Pagnacco, 2014. Molienda seca de maíz (Corn dry milling)
at http://molineria.online/molienda-seca-de-maiz/
38
Available
ROUND TABLE ON RESPONSIBLE SOY ASSOCIATION (RTRS) — 68
(ii) Semolinas
Semolinas can be yielded from peeled and degerminated grits. Endosperm fractions that are less than 3300 microns are used for semolinas. This product can be adapted to the requirements of any industry downstream39. Depending on their particle size and fat content, semolinas can be used for extruded snacks, polenta (corn meal) or as a source of energy in brewery fermentation processes (brewery grits).
The typical particle size of brewery semolinas ranges from 500 to 1400 microns. Fat content required range from 0.5 to 0.8%, lower than that required for semolinas for polenta and extrusion. Corn grits are commonly used in the brewing industry as substitutes of high starch content products such as rice.
The particle size of semolinas used for extrusion or extruded snacks ranges from 300 to 840 microns, and fat content ranges from 0.8 to 1.5%, expressed on dry basis. Specific requirements (particle size and fat content) can vary from customer to customer, the extruder to be used and the intended snack. Semolina for extrusion requires a consistent particle size; semolina for polenta is more demanding in terms of particle size specifications.
Semolinas for polenta, unlike other products, are not an intermediate product; they are directly sold to the market, to final and institutional consumers. There are two types of polenta: traditional polenta and instant polenta. Endosperm particles of traditional polenta are 300 to 1200 microns but the particles for instant polenta are 300 to 840 microns. Fat content of semolinas for polenta usually ranges from 0.8 to 2.25% (on dry basis).
(iii) Fine corn meal
Fine corn meals result from milling peeled and degerminated pieces, in processes that yield semolina. Particle size is small, from 200 to 400 microns, and fat content is higher, 1.5 to 3%, on dry basis Fine corn meals are frequently used in pastries, pasta factories, sausages, and in meat emulsions as a starch substitute.
The table below characterizes the main corn dry milling products. These products are classified based on their endosperm particle size.
The following table summarizes the characteristics of corn dry milling products mentioned above.
Corn dry milling products (Tempering - Degermination)
Particle size range
conten
on
39 Juan Manuel Garzón y Rossetti Valentina, 2011. Una Argentina Productiva, Competitiva y Federal. (A Productive, Competitive and Federal Argentina). La cadena del maíz y sus derivados (Corn value chain and its byproducts) IERAL de la Fundación Mediterránea. 3300 500 300 300 300 200 0,4% 0,5% 0,8% 0,8% 0,8% 1,5% 6000 1400 840 1200 840 400 0,6% 0,8% 1,5% 2,25% 2,25% 3,0% Hominy Grit Brewery grits Semolina for extrusion Semolina for traditional polenta Semolina for instant polenta Meal
Product Greater than Greater than less than less than or equal to Fat
(%
dry basis) Source: Developed in-house by Austral University from interviews with industry referents. ROUND TABLE ON RESPONSIBLE SOY ASSOCIATION (RTRS) — 69
As detailed in the table above, larger fractions have a lower fat content (0.4/0.6%); as the degerminated endosperm particle gets smaller, fat content increases up until getting close to 3%, as it is the case of corn fine meal.
These differences are due to the different corn structures. The products from the corneal or vitreous portion of endosperm, such a hominy grits, have the lowest fat content, while products from the floury portion of the endosperm (fine corn flour) have a higher fat content (Sergio O. Serna – Saldivar, 2018).
While endosperm products are primarily used for foods, they can also be used for non-food applications, for instance construction materials (gypsum boards), ceramics, pharmaceutical products, paper and textiles (North American Millers Association40).
(iv) Byproducts
Other dry milling byproducts are germ, corn bran (pericarp) and small particle size meal. These byproducts are usually mixed, in varying proportions, to produce zootechnical flour (also called hominy feed)
Zootechnical flour can be used for balanced food and animal feed. It is similar to finely grinded corn, has a high nutritional value, high digestibility and palatability41. It includes unsaturated oils than give a rancid taste quite easily; its storing life is limited and should be carefully preserved.
Germ is the main byproduct of the process. Its high oil content and nutritional value make it an ideal source of energy in animal diets, though it can also be used for oil extraction (Lucas Borras et al., 2018)42. Besides, it is possible to partially recover the bran and use it as input in other processes (manufacturing of cookies, crackers, and pastries) because it increases the content of fiber in the final product. However, these alternatives are only viable at large scale.
Key elements in corn wet milling
The output of products and byproducts yielded by corn dry milling is impacted by 1) the industrial equipment used; 2) operations management, and 3) the industrial quality of the corn milled.
While milling equipment has not changed dramatically, and original processing principles are still effective, the industrial equipment used has an impact on corn industrial performance and output. For instance, the degerminating equipment determines dry milling efficiency, and the conveyor belts or equipment used for transport impact on the number of broken kernels. The conversion factors discussed in this chapter are reference values, and consider the technologies available in dry milling facilities.
40 The North American Millers Association is a non-profit trade association for the wheat, corn, oat and rye milling industries. It comprises companies operating grain mills in the United States and Canada and the companies providing products and services to the mills.
Elizabeth Lezcano, 2012. Cadena de productos de maíz. (Corn products chain) MinAgri.
Lucas Borrás et al, 2018. Manejo de Maíz Flint (Flint corn management) Cap 5: (Chapter 5:) Maíz en cerveza (Corn in Beer).
41
42
ROUND TABLE ON RESPONSIBLE SOY ASSOCIATION (RTRS) — 70
Operations management has a significant impact: it refers to the decisions made by the senior management team relative to processes, and maintenance. Operations management is similar among cry milling companies throughout the world.
Finally, corn industrial quality is a key factor of dry milling plants efficiency. Industrial quality will depend upon corn genetics, which determines endosperm hardness and also upon geographical factors. Furthermore, it is important not to have broken or fissured kernels, which conditions the grit size (Izquierdo y Cirilo, 2013).
Since dry milling includes mechanical processes, a certain endosperm hardness is required so that separation and further fractioning can be effective. Harder endosperm corns (flint type) are associated to better milling efficiency; larger, more valuable grits can be obtained, as well as proper physical attributes for different uses (Lucas Borras et al., 2020)43
The constant search for higher yields /ha, and better agronomic performance has led to new semi hard (or semi dented) hybrids that combine dent corn genetic material with flint corn characteristics. These corns may have better milling performance than flint corn; they are widely used in the industry because they are easily available and have a better price than flint corn44
The conversion factors discussed in this chapter are worldwide reference values in the dry milling industry with germ removal, considering the more representative corn varieties and the use of different available technologies for grits (hominy grits and semolinas). All the conversion factors have been validated by frequently consulted experts, which ensures the reasonable quality of the results obtained.
The conversion factors are expressed on commercial basis (as is) and consider the moisture content when the farmer sells the corn —estimated at 14.5%— and the actual moisture content in every wet milling byproduct. To fully reflect the volume of corn required to yield different products, the conversion factors expressed on commercial basis (as is) consider the losses at the point of reception.
Corn dry milling
The corn dry milling process with semi humid degermination attempts to peel the kernel, remove the germ, the pericarp remnant and intends to be as efficient as possible in endosperm breakage. The figure below shows a conceptual, simplified scheme of corn dry milling, with its 5 steps: 1) reception, 2) conditioning, 3) degermination, 4) classification, and 5) milling. There could be multiple milling and separation steps that make the process more complex.
43 Lucas Borrás et al, 2020. Maíz Flint: (Flint Corn) Producción sustentable y calidad de grano (Sustainable Production and Corn Quality) Cap 5: (Chapter 5:) La importancia de la dureza en la molienda del maíz Flint (Flint Corn Milling Depends on Hardness)
44Genetically modified semi dented /semi hard corns yield more kilograms per hectare than pure flint corns, and producers are paid a premium by the dry milling plants (Lucas Borrás et al, 2018).
ROUND TABLE ON RESPONSIBLE SOY ASSOCIATION (RTRS) — 71
1. Corn reception
Reception is the first step in corn dry milling. It includes two steps: 1) Reception and storage y 2) Cleaning and calibration
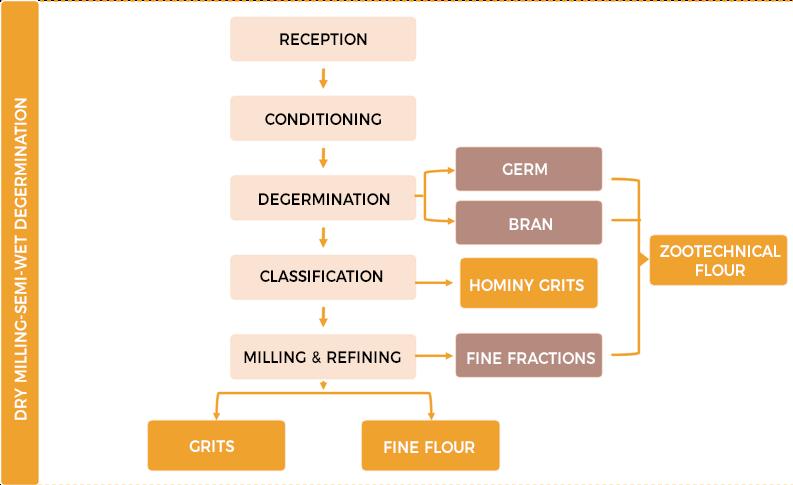
1.1. Reception and storage
Reception and Storage involves receiving and sampling, weighing and unloading, pre- cleaning, classification, and storage.
Pre-cleaning removes impurities to improve corn storing conditions. High-capacity cleaners separate impurities and contaminants based on size, shape, specific weight, color and ferromagnetic properties. Kernels are then classified by corn type, moisture content, and size and stored in bins or cells under adequate moisture and temperature up until their grinding.
The corn received and stored should comply with the commercial moisture content of up to 14.5%. The stored grain is managed with aeration to reduce moisture to percentages close to 13.5%, which is required for milling.
1.2. Cleaning and calibration
Milling starts with a new cleaning to remove impurities, foreign materials and contaminants. Depending on the final product, it is convenient to calibrate the corn. Calibration separates kernels
43 Lucas Borrás et al, 2020. Maíz Flint: Producción sustentable y calidad de grano. Cap 5: La importancia de la dureza en la molienda del maíz Flint.
44 Debido a que los genotipos semi-dentados/ semi-duros (genéticamente modificados) rinden más kilos por hectárea que los maíces tipo flint puros, los productores reciben una prima para producir maíces especiales requeridos por la industria de molienda seca (Lucas Borrás et al, 2018).
Processing steps in corn dry milling facilities with semi-humid degerminationSource: Developed in-house by Austral University from interviews with industry referents.
ROUND TABLE ON RESPONSIBLE SOY ASSOCIATION (RTRS) — 72
by size, so that large kernels are processed separate from small kernels, allowing a better milling efficiency.
Corn reception, storage, cleaning, and calibration produce losses that depend upon moisture content, corn quality, and available pre-treatment technology including, screen mesh, screen efficiency, fine aspiration system, or transport systems including augers or conveyor belts.
Losses generally associated to corn pre-treatment in dry milling plants are 2.5% of the corn weight expressed as is.
2. Conditioning
Conditioning, also known as tempering, mixes corn and water to increase kernel moisture, and allow proper separation of the germ and pericarp (or bran layer) from the endosperm.
Conditioning helps fractioning and separating kernel components. Milling texture, density, and grinding characteristics are slightly different, which is magnified by tempering (J. Giguere, 199345). Tempering loosens and toughens the hull (pericarp or bran), makes germ stickier and more malleable, while mellows the endosperm. As a result, germ and bran do not easily break into small pieces during grinding, but separate into large pieces during degermination.
Conditioning and tempering time will vary depending on the technologies used. The longer the conditioning, the more moisture will penetrate the vitreous endosperm, and the process will require drying of the endosperm final products. New technologies reduce tempering times and avoid the drying of endosperm products.
The conditioned grain moves on to germ removal (degermination).
3. Degermination
Unlike germ removal in wet milling, corn dry milling does not require water, therefore, corn preconditioning is a must. Germ removal or degermination is based on the physical differences of corn kernel components and on the characteristics that germ and pericarp develop after being tempered in water during conditioning.
The degerminator mechanically impacts the kernel to break loose the germ and the resulting separation of the germ, the bran, and the endosperm. The degerminator has a cylindric or conical rotor and a specially designed sieving plate. It is a mechanical process that damages the corn endosperm by hitting and cutting between the rotor and the plate, and the auto-friction of the corn kernels. (P. Matthews, 2005)46
Degermination efficacy determines milling efficacy since it defines the separation degree and the size of the fractions yielded. Two streams come out of the degerminator: one stream relatively rich in large endosperm grits47 (the degerminated kernel) that is the fraction to be used for the primary
R. James Giguere, 1993. US Patent US 5250313ª. Available at https://patents.google.com/patent/US5250313A/en
Peter Matthews, 2005. US Patent S20050226979A1. Available at https://patents.google.com/patent/US20050226979A1/en?q=corn+degermina tion&oq=corn+degermination
This stream takes the grits that do not go through the plate/sieve because of their size.
45
46
47
ROUND TABLE ON RESPONSIBLE SOY ASSOCIATION (RTRS) — 73
products, and another stream, rich in germ, bran (pericarp) and small endosperm grits that are sieved and are the fraction to be used for byproducts.
The two streams are dehydrated to get to approximately 14% moisture, so that the refined endosperm grits, their products and byproducts will have a long shelf life. Some production systems do not require drying of the endosperm grits; it depends upon the time corn is tempered during conditioning.
i) Stream rich in endosperm
To improve products quality, this stream goes through some additional processing, before classification, including fractions separation by aspiration and densimetric tables.
Due to the different densities and aerodynamic properties, the air flow in the aspiration channels allows a first separation of light particles, such as bran or of heavy ones, like the endosperm. Furthermore, the densimetric tables use the density differences between the endosperm and the germ to further separate kernel components.
ii) Byproducts stream
Depending on the byproducts the plant intends to yield, the byproducts stream can also go through aspiration and/or densimetric tables to:
• remove pericarp fractions, in case bran is to be recovered.
• separate the whole germ from the endosperm, in case it is recovered for oil extraction
Endosperm fractions that are in the byproducts stream are less pure since they contain some germ and pericarp; they are used for animal feed. Bran is generally used for zootechnical flour for animal feed; however, some plants have recently started to recover bran and refine it for the food industry. Corn germ can be used for oil extraction or be combined with pericarp and endosperm grits to obtain zootechnical flour.
The conversion factors estimated in this research correspond to the combination of germ, bran, and smaller size endosperm fractions for zootechnical flour.
4. Classification
When the endosperm stream comes out of the degerminator, it goes to classification; there is a gross separation to keep and recirculate the whole kernels or those that still have some germ attached. This stream is called return stream because it goes back to the degerminator for further processing, which increases efficiency48
Peeled and degerminated corn fractions are classified based on their particle size, and separating the large endosperm grits that will turn into hominy grits (larger than 3300 microns). Classification sieves equipped to separate different particle sizes allow compliance with clients’ specifications. Finer grits go to milling and refining to yield semolina and flour.
After degermination, there can still be bran attached to the endosperm grits, and it may be necessary to go through aspiration to reduce bran content. The recovered bran goes to the stream of byproducts.
return fraction should
exceed 8%
48 The
not
to avoid impacting on the production system layout. ROUND TABLE ON RESPONSIBLE SOY ASSOCIATION (RTRS) — 74
In general, the larger the particle size, the more valuable the product. Therefore, it is desirable to extract the larger endosperm fractions (hominy grits or flaking grits). However, the milling company commercial strategy may define that the intended products are semolina for polenta, semolina for extrusion or brewery semolinas. Large fractions can go through sequential transformation in the milling and classification steps to yield smaller size particles.
5. Milling and classification
The peeled and degerminated endosperm grits that were not separated to produce hominy grits are milled and classified. These steps involve refining and grinding, and sieving to yield semolinas or flour with a specific particle size.
Rotary mills are generally used in the grinding step. These mills have two pairs of cylinders that rotate at different speed and in opposite directions. The cylinders have grooves or slots that grind the endosperm and reduce the particle size of semolinas. Each grinding run yields a product with a mix of coarse, mid-size and fine particles. Sieving then separates the particles by size, to obtain the intended product profile. Each grinding run (milling or reduction) corresponds to a sieving run.
Plansifiers classify the milled products and, with an eccentric rotating movement, sieve through special fabrics or meshes, either nylon or metallic.
Sieving yields different particle size fractions; some will become the final product (flour and semolina) that are mixed with other fractions of similar characteristics in further milling runs. The remaining fractions will continue and feed other cylinders.
This process yields semolinas for extrusion, brewery semolinas, semolinas for traditional polenta, and fine flours, according to the company’s commercial strategy. Bran is recovered by aspiration. Hot air drying reduces moisture content from 14% to 12%, to comply with clients’ specifications for semolina.
Instant polenta requires two related production processes. On the one hand, instant polenta is made from a finer particle semolina than traditional polenta, and can also be obtained by precooking.
Instant polenta is pre-cooked by steaming. Pre-cooked starches maximize the absorption capacity of the product, that can then be cooked in one minute.
About product specifications
A key aspect of the intended products profiles implies defining minimum and maximum specifications relative to the proportion of product separated by a series of sieves: standard mesh size sieves first followed by smaller and smaller mesh sizes. The product profile also defines a maximum amount of product retained by the smaller mesh opening size. Below, the detailed particle size description included in a product specification or datasheet, and the particle size specifications of a traditional polenta (the following is just an example, specifications may vary, even though it is the same product).
ROUND TABLE ON RESPONSIBLE SOY ASSOCIATION (RTRS) — 75
Semolina for common polenta
Mesh opening (in microns)
retained
Corn conversion factors calculation in dry milling
The corn conversion factors calculated in dry milling of degerminated corn was based on information gathered from the literature, consultations with commercial dry millers whose products are for foods, and industry referents. All the conversion factors and the industrial efficiencies included in this summary have been validated by frequently consulted experts, and the literature to ensure that the results are valid.
Juan Manuel Garzón y Valentina Rossetti (2011) paper, from the Instituto de Estudios sobre la Realidad Argentina y Latinoamericana, IERAL (Institute for Studies on Argentina and Latin America Reality), describes the productive and commercial profile of the corn dry milling industry in Argentina, and provides a synthesis of industrial performance based on companies’ commercial strategies. Tino Boehm (2019)50 details the dry milling industrial performance of corns of different properties and geographical origins.
Sergio O. Serna Saldivar (2010 and 2018), Silvio Pagnacco (2014)51, among others, describe the steps associated to corn dry milling with semi-humid degermination, as well as the products and byproducts yielded by dry milling.
On the other hand, Lucas Borras et al. (2018 y 2020)52 53 and José L. Robutti (200854), have published studies on the importance of corn hardness in dry milling with semi-humid degermination, and the trends associated to corn genotypes and quality for the dry milling industry.
This research estimates the corn conversion factors in dry milling. The results are average values of corn conversion factors from dry milling with semi humid degermination, the most popular industrial process worldwide.
Available at www. http://www.grupolasantina.com/
Tino Boehm, 2019, Understanding Corn and it`s Processing Options.
Silvio Pagnacco (2014). Molienda Seca de Maíz (Corn dry milling) Available at http://molineria.online/molienda-seca-de-maiz/ Sergio O. Serna-Saldivar et al.,2018. Corn: Chemistry and Technology, Tercera edición. Sergio O. Serna-Saldivar. 2010. Cereal Grains: Properties, Processing, and Nutritional Attributes. s
Lucas Borras et al, 2018. Manejo del maíz Flint (Flint corn management) Available at https://www.dacsa.com/wp-content/ uploads/2019/04/LIBRO-3-Manejo-del-ma%C3%ADz-flint_compressed-comprimido.pdf
53 Lucas Borras et al, 2020. Maíz Flint: (Flint Corn) Sustainable Production and Corn Quality
José Robutti, 2008. Calidad y usos del maíz (Corn quality and uses) Revista Idia XXI. Buenos Aires: INTA pergamino. pp. 100-104
49
50
51
52
54
1190 710 420 Less than 420 0 65 32 3
%
FSource: Grupo La Santina (Food
exporter)49
ROUND TABLE ON RESPONSIBLE SOY ASSOCIATION (RTRS) — 76
Industry outputs and efficiencies, as well as the estimated conversion factors are expressed on commercial basis or as is, considering the moisture content when the farmer sells the corn, and the typical moisture content in every dry milling product and byproduct. To fully reflect the volume of corn required to yield different products, the conversion factors expressed on commercial basis consider the losses at the point of reception.
Process losses
Estimation of the losses in dry milling includes:
1. Waste or losses occurred in pre-handling, that is, at reception, pre-cleaning and storage as well as those in the further cleaning and calibration, before corn conditioning.
2. Losses during processes.
Many variables impact on pre-handling losses, including, grain handling at harvest and postharvest, equipment and machinery used to handle the grain and moisture content at reception. Furthermore, if corn is dried artificially, it will suffer micro fissures that will increase losses. The average loss in pre-handling is 2.5%, due to foreign materials, damaged and broken kernels.
This research considers losses at reception those that occur during pre-cleaning, reception and storage, and the further cleaning and calibration steps. It is worth mentioning that, depending on the industry supply strategy, corn pre- cleaning can be completed in the dry milling plant or at the storing facilities. However, since the corn is always pre-cleaned, this process has been considered when calculating industry representative losses.
Corn milling usually involves losses that, on average, are less than 1%. This research considers that process losses are 0.5% due to milling operations.
This research thus considers that total losses of corn dry milling (losses at corn reception and during processing) may reach 3% of the corn received, expressed on commercial basis.
Conversion factors
Based on the milling companies’ commercial strategies, they may specialize in producing breakfast cereals (hominy grits), polenta (cornmeal), instant polenta, or semolina for extrusion (snack grits) as well as brewery grits. Mills calibration and sieving mesh openings can vary, resulting in different industrial output parameters. The table below details reference industrial outputs according to commercial strategies.
ROUND TABLE ON RESPONSIBLE SOY ASSOCIATION (RTRS) — 77
Dry milling of degerminated corn average yield based on industry commercial strategy On commercial (*) basis
Main product# Range
Hominy grits
Cornmeal (Polenta)
Cornmeal (Instant Polenta)
Snack grits
Brewery grits
- 35%
- 65%
- 50%
- 43%
-
Other products Yield Main Product Zootechnical flour
Semolinas Corn meal
(*) Corn moisture content is estimated at 14.5% and total losses are estimated at 3% of the corn volume received in dry milling facilities (on commercial basis).
Strategy #1 focuses on producing hominy grits; dry milling reference efficiency is 30% grits, 22% semolina for traditional polenta or extrusion, 7% fine cornmeal, and 39% zootechnical flour.
Strategy #2 focuses on maximizing output of semolina for traditional polenta. The reference industrial output for this commercial profile is 58% semolina for traditional polenta, 7% fine cornmeal, and 33% of zootechnical flour.
When the intended production is semolina for instant polenta (strategy #3) the reference output is 45% semolina for instant polenta, 10% semolina for traditional polenta, 7% fine cornmeal, and 35% byproduct.
Strategy #4 focuses on maximizing output of semolina for extrusion. As a result, 39% of semolina for extrusion is yielded, 12% semolina for traditional polenta, 7% fine cornmeal, and 39% of zootechnical flour. Finally, milling companies that produce brewery semolina, have a reference output of 52%.
This research considers the conversion factors that correspond to the main products: hominy grits, cornmeal, instant polenta, snack grits, and brewery grits. On the other hand, fine cornmeal and zootechnical flour are products with a lower relative value; average conversion factors are considered since they are relatively stable, no matter the milling company commercial profile.
Dry milling of degerminated corn
Average yield and tons of corn required to obtain one ton of product or byproduct. Expressed on commercial basis (*)
Product Yield (*) (% M. as is)
Hominy grits
Semolina for traditional polenta
Semolina for instant polenta
Semolinas for extrusion
Brewery grits
Cornmeal
Zootechnical flour
tons maize equivalent per ton maize product
Corn moisture content is estimated at 14.5% and total losses are estimated at 3% of the corn volume received in dry milling facilities (on commercial basis).
25%
55%
40%
35%
45%
57% 22% 10% 12% 7% 7% 7% 7% 7% 30% 58% 45% 39% 52% 39% 33% 35% 39% 39%
1 2 3 4 5
30% 58% 45% 39% 52% 7% 37% 3,3 1,7 2,2 2,6 1,9 15,1 2,7
(*)
ROUND TABLE ON RESPONSIBLE SOY ASSOCIATION (RTRS) — 78
References
Buhler, 2018. State-of-the-art Process Technology for MAIZE.
Charles Wanjau, 2015. Ultimate Technology to Reduce the Aflatoxin Level in Maize. Buhler
Elizabeth Lezcano, 2012. Cadena de productos de maíz. MinAgri. https://www.buhlergroup.com/
José Robutti, 2008. Calidad y usos del maíz. Revista Idia XXI. Buenos Aires: INTA pergamino. pp. 100-104
Juan Manuel Garzón y Rossetti Valentina, 2011. Una Argentina Productiva, Competitiva y Federal. La cadena del maíz y sus derivados. IERAL de la Fundación Mediterránea.
Lucas Borras et al, 2018. Manejo del maíz Flint. Disponible en https://www.dacsa.com/wp-content/ uploads/2019/04/LIBRO-3-Manejo-del-ma%C3%ADz-flint_compressed-comprimido.pdf
Lucas Borrás et al, 2020. Maíz Flint: Producción sustentable y calidad de grano. Cap 5: La importancia de la dureza en la molienda del maíz Flint.
Mercedes E. Goizueta, Andrés Castellano, Melina Covacevich, 2013. INTA: ALTERNATIVAS DE AGREGADO DE VALOR EN LA CADENA DE MAIZ ARGENTINA. Estrategias y actores diferenciales por agroindustria derivada.
North American Millers Asociation
Peter Matthews, 2005. Patente US20050226979A1. Disponible en https://patents.google.com/ patent/US20050226979A1/en?q=corn+degermination&oq=corn+degermination
R. James Giguere, 1993. Patente US 5250313ª. Disponible en https://patents.google.com/patent/ US5250313A/en
S.R. Eckhoff, 2004. MAIZE | Dry Milling, Encyclopedia of Grain Science, Elsevier,Pages 216-225.ISBN 9780127654904, https://doi.org/10.1016/B0-12-765490-9/00088-4.
Sergio O. Serna-Saldivar et al., 2010. Cereal Grains: Properties, Processing, and Nutritional Attributes. Sergio O. Serna-Saldivar et al.,2018. Corn: Chemistry and Technology, Tercera edición.
Silvio Pagnacco (2014). Molienda Seca de Maíz. Disponible en http://molineria.online/molienda-se ca-de-maiz/
Tino Boehm, 2019, Understanding Corn and it`s Processing Options.
(RTRS)
ROUND TABLE ON RESPONSIBLE SOY ASSOCIATION
— 79
Corn Conversion Factors
Chapter V: Corn-based ethanol production
Corn-based ethanol production
Dry milling and wet milling are the two primary methods to produce ethanol from corn. Ethanol is also called alcohol, ethyl alcohol and bioethanol. Ethanol production efficiency by dry or wet milling is different, and different byproducts are obtained.
Wet milling breaks corn kernels into its primary component parts: starch, germ, fiber, and proteins. Only starch is processed to produce ethanol. Wet milling is more versatile55: the starch can be converted into other products, not only ethanol, for instance, sweeteners. Wet milling byproducts, gluten feed, gluten meal, corn oil, are more valuable than the distiller grains with soluble (DGS) yielded by ethanol production from dry milling.
On the other hand, dry milling processes the whole kernel to produce ethanol, and the non-starch parts are recovered as a byproduct at the end of the process, for animal feed. Dry milling yields more ethanol per ton of corn than wet milling56. Dry milling is the most common process used today because of low capital costs required to build and operate these plants (T. Mizik, 2020).
Globally, most of the corn-based ethanol is produced in dry milling plants. The US is the largest producer of corn-based ethanol in the world. More than 90% of corn for ethanol is processed in dry milling plants and only 9% in wet milling facilities (S. Jayasinghe y D. Miller, 2018).
To get more representative conversion factors, the following analysis focuses on traditional dry milling for ethanol production. Dry milling is the most commonly used process today for ethanol production. Below, the primary products and byproducts yielded by corn dry milling for ethanol production, and their uses.
Main products yielded by dry milling for ethanol production
Product Uses
Carbon dioxide (CO2)
Hydrous ethanol
Anhydrous ethanol
Rectified neutral ethyl alcohol
Wet distillers with solubles (WDGS)
Distiller’s dried grains with solubles (DDGS)
Corn distillers oil
Low-oil DDGS
Food industry
Industrial uses or as fuel for flexible fuel vehicles
Fuel and industrial uses
Food industry and pharmaceutical applications
Animal feed
Animal feed
Biodiesel, animal feed
Animal feed
milling is more costly because part of the fermentable starch is lost in byproducts.
Chapter V
55 See the chapter on corn wet milling for more information. 56 Wet
Source: Developed in-house by Austral University ROUND TABLE ON RESPONSIBLE SOY ASSOCIATION (RTRS) — 81
1. Key elements of corn wet milling
The three most important elements affecting corn conversion factors are: 1) the industrial process; 2) the operations management; 3) the characteristics and quality of the raw material (grain) for processing.
The industrial process is strongly impacted by technology and the environment. As mentioned before, corn-based ethanol can be produced by dry or wet milling; yields are different and different byproducts are obtained. Dry milling is the most commonly used process today, and this chapter will refer to it.
There are different lines of research and technological improvements that can help boost the economic results and increase the efficiency of dry milling, so that the process can yield more ethanol, use less energy and produce a more diversified portfolio of byproducts with higher economic value. This chapter will consider a new and widely accepted technology: corn oil extraction at the end of the process. As the ethanol industry continues to evolve, more varied, new and improved byproducts of dry milling will appear (US Grains Council, 2018), as well as higher ethanol yields.
Operations management has a significant impact: it refers to the decisions made by the senior management team relative to processes, and maintenance.
The last variable, the characteristics and quality of the corn processed depend on three factors: genetics, growing conditions and post-harvest management. Corn quality is one of the best indicators of ethanol output, since the volume of starch contained in the kernel determines the volume of ethanol that will be obtained.
Bioethanol production can use different varieties of corn, but dent or semi dent corn are preferred because they contain more starch and yield more per hectare. While tons/ha is the criterion used to select a corn cultivar, it has been proven that grain characteristics can change the volume of ethanol produced per ton of corn. Seed companies are producing corn hybrids specific for the production of ethanol, with high content of fermentable starch. One ton of those hybrids can yield 3 to 5% more ethanol than conventional hybrids57
The conversion factors discussed below are reference values in the dry milling industry worldwide as well as industry averages, considering the use of different available technologies. All the figures included in this summary have been validated by frequently consulted experts to ensure the general reasonability of the results.
The conversion factors expressed on commercial basis (as is) consider the moisture content when the farmer sells the corn —estimated at 14.5%— and the actual moisture content resulting from ethanol production. To fully reflect the volume of corn required to yield different products, the conversion factors expressed on commercial basis (as is) consider the losses at the point of reception.
57 Haefele, Douglas & Owens, Fredric & Bryan, Keith & Sevenich, David. (2004). Selection and Optimization of Corn Hybrids for Fuel Ethanol Production.ROUND TABLE ON RESPONSIBLE SOY ASSOCIATION (RTRS) — 82
Ethanol production process
Below, a flow diagram of the most widely used dry milling process for ethanol production.
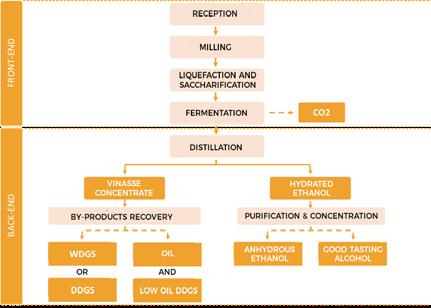
Processing steps in corn dry milling facilities for the production of corn-based ethanol
The conventional process includes seven steps, detailed below: 1. reception, 2. milling, 3. liquefaction and saccharification, 4. fermentation, 5. distillation, 6. purification/concentration of ethanol products, and 7. byproducts recovery. The operations involved can be divided into two general processes:
i) Front-end processes, that is all the operations before distillation. Front-end processes turn the corn, rich in starch, into ethanol as efficiently as possible58
iI) Back-end processes are the operations after distillation and associated to the recovery of ethanol and its byproducts.
Front-end processes
The initial of front-end processes include reception, milling, liquefaction and saccharification, and corn kernel fermentation. They are described below.
1. Reception
Reception is the first step in ethanol production. It includes corn receiving and sampling, weighing and unloading, pre- cleaning, classification, and storage.
58 Fermentation yields a mix of ethanol and water, with non-fermentable corn solids and yeast. That mix is called beer and 14% to 16% of its volume is alcohol, and 84% to 86% is water and solids. Ethanol and byproducts recovery involves feeding that beer to the distillation system.
Source: Developed in-house by Austral University from interviews with industry referents and US Grains Council.ROUND TABLE ON RESPONSIBLE SOY ASSOCIATION (RTRS) — 83
Quality controls are carried out when corn arrives at the plant, before unloading. Corn is sampled and analyzed to determine its moisture content, that should not exceed 14.5%, and to check quality. When corn quality is ok, the grain is stored until it is processed.
Storage: first storage and buffer bins
Corn is unloaded from the truck, pre-cleaned and taken to storing bins or cells. Corn is stored mainly in bins or cells or temporarily in silo bags. Stored grain is kept in perfect conditions; it arrives at the facilities during harvest. Storage facilities have cleaning systems, sievers, and fine aspiration systems that separate foreign materials and eliminate volatile elements such as dust and hulls so as to process clean corn (F. Gómez García, 2015).
Then, corn goes to buffer bins that store the volume of grain required by ethanol production. From buffer bins, grain is fed to the milling system.
Corn pre-handling involves reception, cleaning, classification and storage; there are losses that depend upon harvest practices, storage available technology for corn pre-treatment including, screen mesh, screen efficiency, fine aspiration system, and moisture content of the corn received. Depending on the industry supply strategy, corn pre-cleaning (high-capacity cleaning) can be completed in the plant or at the storing facilities. Since the corn is always pre-cleaned, this research has considered pre-cleaning when calculating industry representative losses. Losses generally associated to corn pre-cleaning in ethanol production plants are 2.4% of the corn (W.J. van Zeist, 2012).
2. Grinding or milling
From the storing bins or cells, corn is fed to the milling area that is usually equipped with recirculation mills59 . Milling grinds the grain up to the particle size required to maximize ethanol production.
The goal is to release the starch contained in the kernel and increase the contact surface with the water and enzymes added in further steps, in liquefaction and saccharification (Mario Bragachini et al, 2014). The grinded particle size determines the ethanol production efficacy (Kelsall Lyons, 1999). The milling equipment can adjust particle size that is generally intended of a diameter between 5 mm and 2 mm, always to optimize output (F. Gómez García, 2015).
3. Liquefaction and saccharification
Liquefaction and saccharification involves four steps to convert starch to glucose: i) pre-mixing, ii) cooking, iii) liquefaction, and iv) saccharification.
i) Pre-mixing
Once the corn has been grinded, the resulting meal should be liquefied and then pumped. The grinded material feeds the pre-mixing tank where it is mixed with water and a small amount of α-amilase enzyme to form a slurry.
58 A partir de la fermentación se obtiene una mezcla de etanol y agua, junto con sólidos no fermentables del maíz y de la levadura. Dicha mezcla se denomina cerveza, y típicamente tiene entre 14% y 16% de su volumen convertido en alcohol, y entre 86% y 84% mosto (agua y sólidos). Para la recuperación del etanol y los subproductos, la cerveza se traslada posteriormente al sistema de destilación.
59 Recirculation mills allow changing the direction of the grain flow; so, when the particle size is still not the required, grain can go through the milling chamber more than once. The recirculation system helps getting a consistent particle size.
ROUND TABLE ON RESPONSIBLE SOY ASSOCIATION (RTRS) — 84
Agitators and mixers mix the slurry. This process features temperatures that usually range from 40 to 60°C; these are the temperatures of the liquid streams reaching this step, mostly from water recovered from the production process.
The mash or slurry obtained can be converted to ethanol.
ii) Liquefaction
The mash is pumped through a combination of cooking tanks and heat tubes at temperatures ranging from 90 to 110°C. The high temperature sterilizes the mash and removes bacteria and other microorganisms; it also facilitates starch molecules conversion to fermentable sugar molecules.
The resulting mix should be cooled down to about 80°C to add α-amylase for a second time. This enzyme will convert starch to dextrins, reducing viscosity. When the α-amylase has reached its maximum conversion potential, the mix is cooled down to 60°C and goes to the next step, saccharification.
iii) Saccharification
A different enzyme is used, called a glucoamylase (also known by the longer name amyloglucosidase) to complete starch conversion to fermentable sugars.
The mash obtained contains dextrose, the raw material that will allow the production of ethanol.
Depending upon the specific technology used in each plant, saccharification can be done in the cooking and liquefaction tank or in a fermentation tank, in a process called saccharification and fermentation.
4. Fermentation
After saccharification, yeast is added and the biochemical fermentation starts. Yeast metabolizes dextrose and produces carbon dioxide (CO2) and ethanol.
The typical yeast used is called Saccharomyces cerevisiae; a cooling system that keeps fermentors at temperatures below 34°C ensure an adequate fermentation.
Fermentation residence time can be 2 or 3 days and yields a mix of ethanol and water, together with non-fermentable corn solids and yeast. That mix is called beer and 14% to 16% of its volume is alcohol while 84% to 86% is water and solids. Ethanol and byproducts recovery involves feeding that beer to the distillation system.
The carbon dioxide produced during fermentation is separated and can be commercialized as a byproduct.
i) CO2 Recovery
The C02 exhausts the fermentation reactor through the venting duct to a first water washing that allows recovering the ethanol.
This recovery is done in a washing column or tower. The gas, the ethanol and a small volume of
ROUND TABLE ON RESPONSIBLE SOY ASSOCIATION (RTRS) — 85
water steam enters the base of the tower or column and exhausts free of ethanol and with a low moisture content to a plant where it will be compressed, purified, dried and stored in liquid form in adequate containers for its distribution.
Carbon dioxide (CO2):
The CO2 obtained in the production of ethanol represents approximately 30% of the total corn milled in the industry, expressed on commercial basis (as is). That means that one ton of the corn received and processed yields 301 kilograms of CO2 (M. Korte, 2015).
CO2 can be used in the food industry to carbonate drinks and to process meats, also as harmless acid to sour dairy products faster, without adding any flavor (G. De Negris y C. Solari, 2018). It is also used in textiles to neutralize alkaline residues and regulate pH in liquid effluents, and even in waste water treatments and production of dry ice.
Front-end processes. Flow diagram

So far, this chapter has described the front-end processes of dry milling for the production of ethanol. The following figure illustrates those processes:
Corn-based Ethanol Production from Dry Milling
Front-end processes
Steps, substeps, intermediate processes and products and corn byproducts
Source:
Developed in-house by Austral
University
from
interviews
with industry referents. ROUND TABLE ON RESPONSIBLE SOY ASSOCIATION (RTRS) — 86
Back-end processes
Final or back-end processes include distillation, purification, and concentration of ethanol prod ucts, as well as the recovery of by-products.
5. Distillation
The last phase of ethanol production is distillation. Downstream from the fermentors, the beer is pumped to the distillation towers where, using heat, the ethyl alcohol is separated from water and solids, taking advantage of the different boiling points: alcohol boils at 78.4°C and water at 100°C. Distillation fractions the components of the mix based on their relative volatility. As beer boils, the ethanol evaporates and exhausts the distillation tower from the top, while solids and water fall to the bottom. The ethanol rich steam goes to a condenser to produce liquid ethanol with an average alcohol concentration of 96% and 4% water. This product is known as hydrous alcohol; it is the most concentrated ethanol that can yield a simple distillation.
The hydrous ethanol can be commercialized as raw material for industrial uses (e.g., diluents) or as fuel for flexible fuel vehicles. It is important to mention that the hydrous ethanol can: i) be sold as such; ii) be used for the production of anhydrous ethanol, or iii) be purified to get rectified ethyl alcohol.
After distillation, the process splits into two: The hydrous ethanol can go to purification, to reach the required degree of purity and concentration. The mix of solids and water, known as heavy vinasse or corn heavy distillate, go through new processes to recover the byproducts.
Hydrous ethanol
The hydrous ethanol generally has 4% water concentration and can be commercialized as raw material for industrial uses (e.g., diluents) or as fuel for flexible fuel vehicles.
One ton of the corn received and processed can yield, on average, 410 liters of hydrous ethanol, expressed on commercial basis (as is).
6. Ethanol products purification and concentration
At purification, ethanol gets the organoleptic characteristics, the purity and concentration required for different applications.
On the one hand, ethanol for fuel requires an minimum degree of alcohol of 99.5%, which would demand anhydration or dehydration to extract the water in the hydrous ethanol. On the other hand, ethanol for the food and pharmaceutical industries needs additional refining to reach the purity required.
i) Dehydration or anhydration
Anhydration extracts the water in the hydrous ethanol to reach a concentration level of 99.5% or higher; this is the degree required to use ethanol as fuel. The alcohol obtained is called anhydrous alcohol.
ROUND TABLE ON RESPONSIBLE SOY ASSOCIATION (RTRS) — 87
The most commonly used ethanol dehydration method uses a molecular sieve that filters mole cules according to their size.
The molecular sieves are tanks with porous materials, very small openings, of consistent size. The sieves mesh is large enough to trap water molecules but alcohol molecules are larger than the openings, are not absorbed and continue downstream. Thanks to anhydration, the ethanol comes out of the filtering unit with an alcohol concentration of 99.5%60
Anhydrous ethanol has a high alcohol concentration; it can be used as carburant and for industrial uses but still contains impurities, volatile compounds, superior alcohols, and methanol that come from fermentation. Therefore, anhydrous ethanol does not have the quality required for food or pharmaceutical uses.
Anhydrous Ethanol
One ton of the corn received and processed can yield, on average, 398 liters of anhydrous ethanol, expressed on commercial basis (as is). The alcohol concentration is 99.5%.
The anhydrous ethanol is mostly used as fuel, blended with gasoline at different percentages. It can also be used for industrial applications. as an anti-freeze agent, in cleaning and disinfection formulations, in the chemical industry as a compound to synthesize dissolvents for glues and paints. Ethanol volumes mentioned above do not include the denaturants that are added to transform ethanol in a product condemned for human consumption. Denaturation does not alter ethanol chemical composition but prevents it from complying with regulations applicable to consumable alcohols in alcoholic drinks.
Denaturing substances and the percentages used vary depending on local regulations. In the US, 2% to 5% gasoline is usually added as a denaturing substance; in Argentina, denatonium benzoate is used at 40 ppm (0.004%)
ii) Rectification
Starch fermentation produces ethanol and CO2 as well as other compounds, e.g., methanol, higher alcohols, organic acids and esters. These compounds are called congeneric elements; they originate in the yeast layer and other microorganisms present in fermentation. Minimum amounts of congeneric elements are found in alcohol (traces); they are impurities that shall be reduced to reach the quality required by the food and pharmaceutical industries (S. Onuki et al, 2016).
Ethanol rectification implies subsequent purification processes where the raw material can be the hydrated alcohol from distillation or the anhydrous alcohol from the dehydration process.
The purification methods generally add water in a hydroselection column where the volatile compounds and the traces present in the ethanol stream are separated. The rectification and affination that follow remove the higher alcohols and methanol, according to intended specific uses. The rectified ethanol from this process has a 96% concentration.
The number of purification and rectification steps result in different ethanol qualities, adapted to different applications and the regulations in force.
60
Dale, Rhys & Tyner, Wallace. (2006). Economic And Technical Analysis Of Ethanol Dry Milling: Model Description. Purdue University, College of Agriculture, Department of Agricultural Economics, Working Papers.
ROUND TABLE ON RESPONSIBLE SOY ASSOCIATION (RTRS) — 88
Out of the total alcohol processed, rectification yields 92% of high quality, extra neutral ethyl alcohol and 8% of industrial ethyl alcohol.
Purification separates the components that, together with a fraction of ethanol lost in the process, are extracted in an alcohol stream of lower purity. That product is known as industrial ethyl alcohol; it recirculates in ethanol streams for fuel or industrial use.
Rectified extra neutral ethyl alcohol
The extra neutral rectified ethanol is high quality, potable ethyl alcohol which organoleptic properties are very valued, as its neutral odor and taste, its transparent color that is bright and crystalline.
Extra neutral alcohol is 96% ethanol; each tone of corn received and processed yields approximately 386 liters, expressed on commercial basis (as is).
This alcohol can be used for pharmaceutical applications and in the food industry, to manufacture alcoholic drinks, antiseptic alcohol, perfumes and other products that require high quality organoleptic characteristics.
7. Byproducts recovery
As explained before, distillation yields two products. On the one hand, ethanol that is 96° alcohol (hydrated alcohol) for purification and ethanol products with the purity and concentration degrees required for different uses (ethanol products purification and concentration processes). On the other hand, a mix of insoluble solids and water that is known as heavy vinasse, that will yield byproducts for animal feed.
Traditionally, ethanol from dry milling corn plants produces two byproducts: wet distillers with solubles (WDGS) and distiller’s dried grains with solubles (DDGS). However, in recent years, a process to obtain corn oil in these plants has become popular and gave rise to two new byproducts: oil from corn distillers and low-oil DDGS.
These byproducts production is inter-related: when one of them is produced, the capacity to produce the other is reduced; byproducts participation in individual plants varies widely. The information below refers to the processes needed for each byproduct, and the conversion technical coefficients that are specific to each byproduct.
Separation
Heavy vinasse components are separated to obtain liquid and distiller grains (DG). While there is a number of available separation technologies, the most widely accepted is a centrifuge decanter. The mix enters the equipment on one side and is pushed by an auger that turns at high speed. The centrifuge force sends the solid material, the DG, to the walls and the liquid, now light vinasse, continues to move forward.
The DG yielded by separation can be commercialized as wet distiller grains (WDG) or as dried distill er grains (DDG), depending on their moisture content. However, distiller grains are generally mixed with condensated solubles from the light vinasse evaporation process to obtain wet distillers with
ROUND TABLE ON RESPONSIBLE SOY ASSOCIATION (RTRS) — 89
solubles (WDGS) or distiller’s dried grains with solubles (DDGS).
Evaporation
Once the light vinasse is separated, the liquid goes to an evaporator to concentrate the solution. This process yields, on the one hand, condensed distillers solubles, and, on the other, recovers the water free of compounds to treat it and reuse it in the production process.
The condensed solubles are a good source of proteins, energy and vitamins but their consistency is that of molasses. Therefore, most distilleries add the condensed solubles to the distiller grain to increase their nutritional value61. Vapors (water) extracted by evaporation are reused when water is added to the grain grinded at pre-mixing.
Mixing
The mixing of solubles with distiller grain yields distiller grains with soluble (DGS). This byproduct is high in protein, fiber and fats; nutrients are two or three times more concentrated when compared to their original form Nicolás Di Lorenzo, 2012). DGS can be commercialized as WDGS with a 65% moisture content or as DDGS, with a 10% moisture content.
Wet distillers with solubles (WDGS)
Wet distiller grains with solubles are known as WDGS, a byproduct of corn dry milling for ethanol.
WDGS are commercialized with a 65% moisture content and is widely used in animal diets. The high moisture content reduces its shelf life and makes logistics more expensive because a large volume of water is transported. WDGS improves animal feed because it gives volume and homoge neity, the feed palatability is better (Nicolás Di Lorenzo, 2012).
Each ton of corn received and processed can yield, on average, 790 kilos of WDGS, expressed on commercial basis (as is).
Drying
Drying reduces the WDGS water content to 10-12%. The resulting product is called dried distiller grains with solubles or DDGS.
Reducing the water content of distiller grains with solubles improves conservation conditions, so that this byproduct can be stored and exported. When moisture content is high, commercialization options are conditioned by perishability and transport costs.
Distiller’s Dried Grains with Solubles (DDGS)
Each ton of corn received and processed can yield, on average, 302 kilos of DDGS, expressed on commercial basis (as is).
DDGS are an excellent feed ingredient for ruminant diets, and are also used for pigs and poultry diets and even for pet foods.
Oil extraction
DDGS oil can be extracted fro the light vinasse oil, during the production of DDGS. Oil extraction follows fermentation and distillation, before drying to produce DDGS.
Some facilities also produce condensed distiller solubles syrup to be commercialized separated from distiller grains.
61
ROUND TABLE ON RESPONSIBLE SOY ASSOCIATION (RTRS) — 90
There are different extraction technologies to get oil from light vinasse. Currently, more than 90% of dry milling plants that produce ethanol in the United States also produce corn oil, extracting oil from condensed distillers solubles, through centrifugation, as the final step of the process. These processes use different layouts of decanters, centrifuges and heat to physically separate oil in the byproduct stream (US Grains Council, 2018)62.
The ethanol industry is about to adopt advanced extraction technologies to increase its corn oil production. Average corn oil outputs have steadily increased in recent years: in 2012, the average production of corn distillers oil in the US was about 8 l/ton while in 2019 it increased to 12 l/ton (Christianson PLLP, 201963 y Trucent, 2019).
Corn oil removal impacts on the nutritional profile of distiller grains with solubles; it reduces the fat and energy content and increases the protein concentration. The product obtained by mixing distiller grains with concentrated solubles after oil extraction is called low-oil DGS.
Corn distillers oil
On average, the most commonly used methods recover approximately 12.2 kg of corn oil per ton of corn processed; the actual efficacy range is 8 to 20 l/ton (Trucent, 2019).
Distillers corn oil is not recommended for human consumption; it is mainly used for biodiesel and animal diets. Extraction systems have been introduced in ethanol plants to increase energy efficiency and the total fuel produced by metric ton of processed corn. That corn oil is raw material for biodiesel, without affecting ethanol production volumes.
Low-oil DDGS
Low-oil DDGS results from mixing the distiller grain with concentrated solubles after extracting the oil; it is then dried to 10% -12% moisture content.
Low-oil DDGS average crude content of fat is 4-8%, compared to the traditional DDGS which content is 8-12% (Deepak Kumar y Vijay Singh, 2019).
Low-oil DDGS output is lower than that of traditional DDGS. Each ton of corn received and processed can yield, on average, 280 kilos of low-oil DDGS, expressed on commercial basis (as is).
Back-end processes. flow diagram
Below, flow diagrams detailing the back-end processes, so widely used in dry milling for the pro duction of ethanol, all over the world.
62 US Grains Council, 2018. DDGS User Handbook. Chapter 3. Producción de etanol y sus coproductos Tecnologías de fraccionamiento inicial y de extracción de aceite final. (Ethanol and co-products production. Initial fractioning and final oil extraction technologies) 63 Susanne Retka Schill (November 20, 2019). Pounds That Pay. Ethanol Producer Magazine (http://www.ethanolproducer.com/) ROUND TABLE ON RESPONSIBLE SOY ASSOCIATION (RTRS) — 91
The first diagram details the steps, processes, intermediate products and corn products from dry milling without oil extraction; the second diagram details the oil extraction process after distillation.
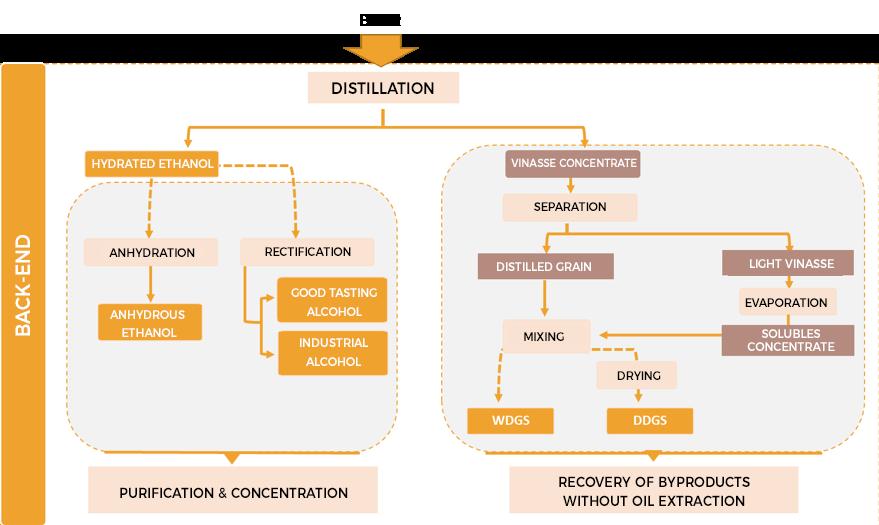
Ethanol production from dry milling - Back-end Processes
Without oil extraction: Steps, intermediate processes and products and corn byproducts
Corn conversion factors calculation in ethanol production
The corn conversion factors calculated in dry milling for the production of ethanol were based on information gathered from different technical sources including the literature, consultations with commercial dry millers that produce foods, and industry referents. The information found was validated by a comparative analysis of the results and consultations with industry experts.
Deepak Kumar y Vijay Singh (2019) research discusses bioethanol production, corn composition and corn to ethanol conversion technologies. This research also presents the most important technical challenges and opportunities presented by new technologies.
De Nigris y Solari (2018), Altuna et al. (2018) and Fernando Gómez García (2015) have published studies on the technical pre-feasibility and process engineering for the installation of bioethanol plants. Fan Mei (2006) has developed mass and energy balance models of a dry milling plant for the production of ethanol.
Source: Developed in-house by Austral University from interviews with industry referents.ROUND TABLE ON RESPONSIBLE SOY ASSOCIATION (RTRS) — 92
Likewise, FAO (2008) has completed a comparative analysis of biofuels performance considering differences between yields per hectare by crop and country, and the differences in conversion efficacy of those crops to biofuels.
This research develops the corn conversion factors in the ethanol industry, expressed on commercial basis or as is considering the moisture content when the farmer sells the corn —estimated at 14.5%— and the typical moisture content in every dry milling product and byproduct yielded by corn ethanol production. To fully reflect the volume of corn required to yield different products, the conversion factors expressed on commercial basis consider the losses at the point of reception.
Losses in the production of corn-based ethanol
Losses at corn reception are 2.4% of the corn volume received at dry milling plants. Those losses include broken kernels, moisture, foreign materials, as well as plastics, pieces of wood, dirt, etc. that may break or damage equipment and should, therefore, be removed64.
This research also considers losses during corn processing, that involve losing kernel components. These losses are, on average, less than 0.5%, mainly dust from milling, with respect to the corn being industrially processed.
Therefore, this research considers that total losses of ethanol produced by corn dry milling (losses at corn reception and during processing) may reach, on average, 2.9% of the corn received, expressed on commercial basis.
Corn conversion factors (as is)
The conversion factors take into consideration the yields of every product and byproduct. Yields are expressed on commercial basis, that is, after the waste materials (broken kernels and foreign materials) are removed at reception.
Carbon dioxide (CO2): the CO2 produced during fermentation can be treated and sold as byproduct. On average, a ton of the corn received and processed yields 301 kg of CO2.
Hydrous ethanol: has a typical water concentration of 4%. The hydrous ethanol can be commercialized as raw material for industrial uses (for instance, diluents) or as fuel for flexible fuel vehicles. It is important to mention that the hydrous ethanol can: i) be sold as such; ii) be used for the production of anhydrous ethanol, or iii) be purified to get rectified ethyl alcohol. One ton of the corn received and processed can yield, on average, 410 liters of hydrous ethanol, expressed on
Reception is described in this chapter (1. Reception), losses associated to corn reception or pre-handling will depend on the supply strategy of the industry. When pre-cleaning (high-capacity cleaning) is done in storing facilities, losses at reception will be significantly less. Since the corn is always pre-cleaned, this research has considered pre-cleaning when calculating industry representative losses.
64
ROUND TABLE ON RESPONSIBLE SOY ASSOCIATION (RTRS) — 93
commercial basis (as is).
Anhydrous ethanol: the dehydrated anhydrous ethanol has a typical alcohol concentration of 99.5% and can be obtained from hydrous ethanol dehydration. One ton of the corn received and processed can yield 398 liters of anhydrous ethanol, expressed on commercial basis (as is). Anhydrous ethanol volumes mentioned above do not include the denaturants that are added to transform ethanol in a product condemned for human consumption.
Rectified extra neutral ethyl alcohol: This alcohol is potable, of high quality and apt for pharmaceutical applications and the food industry. This product is obtained from rectification and can be used as raw material, both the hydrated alcohol from distillation or the anhydrous alcohol from the dehydration process. Extra neutral alcohol is 96% ethanol; each tone of corn received and processed yields approximately 386 liters.
WDGS: the wet distiller grains with solubles are the distiller grains and the concentrated vinasse; they are usually commercialized at 65% moisture content. Each ton of corn received and processed can yield, on average, 790 kilos of DGS, expressed on commercial basis (as is).
DDGS: Dry distiller grains with solubles are obtained from WDGS drying. They are commercialized at 10% moisture content. Each ton of corn received and processed can yield, on average, 302 kilos of DDGS, expressed on commercial basis, as is.
Corn distillers oil: Corn oil from ethanol production is condemned for human consumption; it is mainly used for biodiesel and animal diets. The most commonly used techniques recover, on average, 12.2 kg of corn oil per corn ton received and processed in the ethanol industry.
Low-oil DDGS: Low-oil DDGS has a reduced fat content that results from mixing the distiller grain with the concentrated solubles after extracting the distiller corn oil. It is dried and commercialized with approximately 10% moisture content. Each ton of corn received and processed can yield, on average, 280 kilos of low-oil DDGS, expressed on commercial basis (as is).
Below, a summary of the average yields per product and byproduct resulting from dry milling ethanol production. Results are included in two charts: the first details the outputs of dry milling without oil extraction and the second, the process that includes oil extraction after distillation.
The values are expressed as volume of product/byproduct obtained from each ton of corn received and processed, expressed on commercial basis (as is). To fully reflect the volume of corn required to yield different products, the conversion factor expressed on commercial basis considers the losses at the point of reception.
ROUND TABLE ON RESPONSIBLE SOY ASSOCIATION (RTRS) — 94
Corn-based ethanol production from dry milling
Without oil extraction - with traditional WDGSS and DDGS
Average output of a ton of corn, expressed on commercial basis (as is).
(*) Corn moisture content is estimated at 14.5% and total losses are estimated at 2.9% of the corn volume received in ethanol facilities (as is). Ethanol products yield estimate does not include the denaturing additives. WDGS moisture content is 65% and DDGS, moisture is 10%
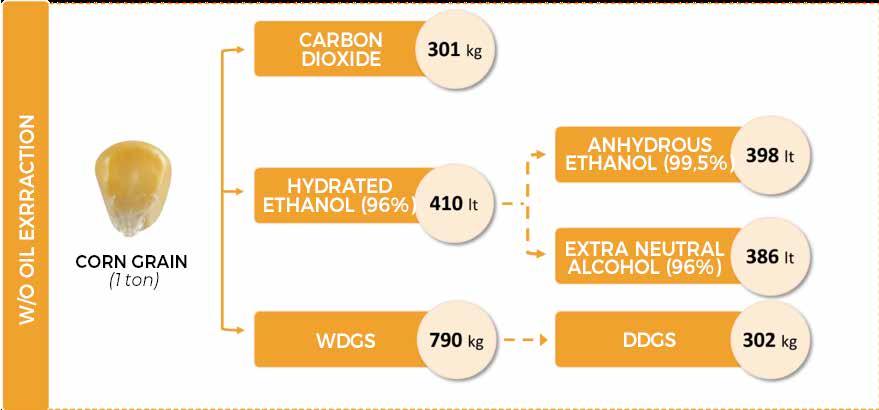
Corn-based ethanol production from dry milling
With Oil Extraction after Distillation and Low-oil DDGS
Average output of a ton of corn, expressed on commercial basis (as is).
(*) Corn moisture content is estimated at 14.5% and total losses are estimated at 2.9% of the corn volume received in ethanol facilities (as is). Ethanol products yield estimate does not include the denaturing additives. Low oil DDGS moisture content is 10%
The corn conversion factors detailed below express the corn tonnage required to obtain one ton of any of the products and by-products obtained from ethanol production (on commercial basis, as is). The technical coefficients detailed in the charts above were used to calculate the corn equiv alent for every product, dividing 1 into the percentage of the product obtained by processing a certain volume of corn.
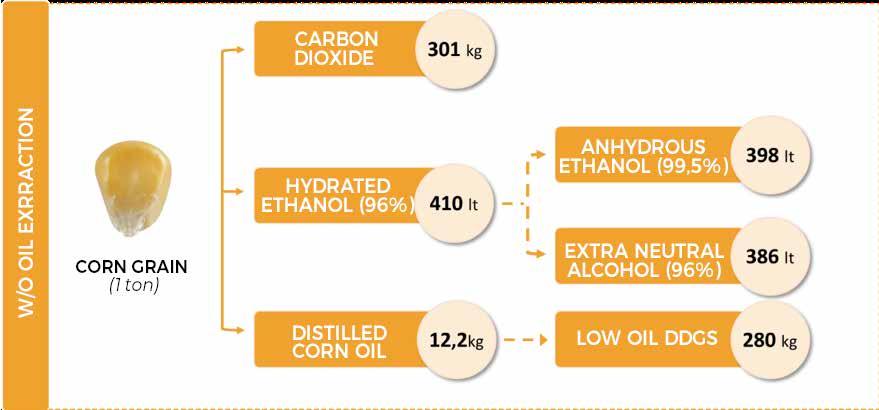
ROUND TABLE ON RESPONSIBLE SOY ASSOCIATION (RTRS) — 95
Corn-based Ethanol Production from Dry Milling
Product
Carbon dioxide (CO2)
Hydrous ethanol (96%)
Anhydrous ethanol (99.5%)
Ethanol (96%) - Extra neutral rectified DDGS
WDGS
Corn distillers oil
Low-oil DDGS
Average yield and tons of corn required to obtain one ton or one m3 (1,000 liters) of product. Expressed on commercial basis (*) 301 kg/t 410 l/t 398 l/t 386 l/t 302 kg/t 790 kg/t 12.2 kg/t 280 kg/t
Average Yield UnitTons of corn required by product unit
m3 (1,000 liters)
m3 (1,000 liters)
m3 (1,000 liters)
Losses (as a % of the grain received and processed)
Total losses
Losses / Refining
Losses / Grain reception
(*) Corn moisture content is estimated at 14.5% and total losses are estimated at 2.9% of the corn volume received in ethanol facilities (as is). Ethanol products yield estimate does not include the denaturing additives. WDGS moisture content is 65% and in the traditional, low-oil DDGS, moisture is 10%
References
Altuna, Juan María; Bianchi di Carcano, Camila; Novaro Hueyo, José Agustín; Nagore, Pablo Santos (2018). Instalación de una planta de bioetanol Tesis de Grado. INSTITUTO TECNOLÓGICO DE BUENOS AIRES – ITBA. ESCUELA DE INGENIERÍA Y GESTIÓN
Dale, Rhys & Tyner, Wallace. (2006). Economic and Technical Analysis Of Ethanol Dry Milling: Model Description. Purdue University, College of Agriculture, Department of Agricultural Economics, Working Papers.
De Nigris, Giselle, Solari, Carolina (2018). Diseño de una planta de producción de bioetanol a base de maíz. Tesis de Grado.Universidad Nacional de Mar del Plata. Facultad de Ingeniería.
FAO (2008). The State of Food and Agriculture: Biofuels : Prospects, Risks and Opportunities. Chapter 2 - Biofuels and agriculture – a technical overview.
Fernando Gómez García (2015). Ingeniería de procesos de planta de fabricación de etanol con una capacidad de 20.000 tm/año. Dpto. Ingeniería de la construcción y proyectos de ingenieríaUniversidad de Sevilla.
Korte, Megan, “In-plant validation of an ethanol yield prediction equation” (2015). Graduate Theses and Dissertations. 14822.
1 ton 1
1
1
1 ton 1 ton 1 ton 1 ton 3,32 2,44 2,51 2,59 3,32 1,27 81,97 3,58 2,9% 0,5% 2,4%
ROUND TABLE ON RESPONSIBLE SOY ASSOCIATION (RTRS) — 96
Kumar, D.; Singh, V. (2019). Chapter 22—Bioethanol Production from Corn. In Corn, 3rd ed.; SernaSaldivar, S.O., Ed.; AACC International Press: Oxford, UK [Google Scholar]10.1016/B978-0-12-8119716.00022-X.
Lee, U., Kwon, H., Wu, M., & Wang, M. (2021). Retrospective analysis of the U.S. corn ethanol industry for 2005 - 2019: implications for greenhouse gas emission reductions. Biofuels, Bioproducts and Biorefining. doi:10.1002/bbb.2225
Mario Bragachini, Alejandro Saavedra, José María Méndez, Marcos Bragachini, Diego Mathier, Lisandro Errasquin y Alfredo Benito Coen (2014). Informe de la visita a la planta de producción de bioetanol de ACABIO, Villa María, Córdoba. INTA EEA Manfredi
Mei, F., Dudukovic, M. P., Evans, M., & Carpenter, C. N. (2006). Mass and Energy balance for a corn-toethanol plant. Methods. Washington University, Saint Louis, Missouri.
https://lib.dr.iastate.edu/etd/14822 Nicolás Di Lorenzo (2012). BURLANDA, UN SUBPRODUCTO INTERESANTE PARA LAS DIETAS DE LOS RUMIANTES. Sitio Argentino de Producción Animal
Onuki, S., Koziel, J. A., Jenks, W. S., Cai, L., Grewell, D., and van Leeuwen, J. H. (2016) Taking ethanol quality beyond fuel grade: A review. J. Inst. Brew., 122: 588– 598. doi: 10.1002/jib.364.
Rosentrater, K.A., K.M. IIelegi, D.B. Johnson. 2011. Manufacturing of fuel ethanol and distillers grainsCurrents and evolving processes. 1st. ed. CRC Press, Florida, USA.
S. Jayasinghe y D. Miller (2018), “U.S. Corn Usage for Ethanol, Dry Mill Ethanol Co-Products Production, and Ethanol Yields Update”, Agricultural Marketing Resource Center, Renewable Energy Report (Febrero/2018)
Susanne Retka Schill (November 20, 2019). Pounds That Pay. Ethanol Producer Magazine (http:// www.ethanolproducer.com/)
TRUCENT (Oct 15, 2019). Consistently Increasing Distillers Corn Oil Extraction in Ethanol Plants. BIOPROCESS.
US Grains Council, 2018. DDGS User Handbook. Capítulo 3. Producción de etanol y sus coproductos Tecnologías de fraccionamiento inicial y de extracción de aceite final.
US Grains Council, 2018. DDGS User Handbook. Disponible online en https://grains.org/buyingselling/ddgs/user-handbook/. Fecha de acceso: Abril/2021
ROUND TABLE ON RESPONSIBLE SOY ASSOCIATION (RTRS) — 97
Public available sources of conversion factor data
Appendix II
Whilst the method for selecting conversion factors is stated in Selecting corn conversion factors, further details are provided below on the process used to obtain a conversion factor for each product. The factors given in this appendix are not weighted according to the economic or demand allocation, as these are not publicly available, but are the unweighted sum of corn products used in the production of that product, whilst the weighted figures are provided in the introduction.
Livestock feed conversion factors
There has not been a large amount of research into feed conversion factors (i.e. % of corn in animal feed) in the academic or public literature. Most sources available provided a feed specification for a specific feed diet in a specific country, with only two sources available collating information on a number of different feed mixes across the world. Most sources only contained a factor for specific types of feed (e.g. broiler feed or swine feed), and therefore each feed type was considered separately during the research.
i. Broiler poultry
Citation FAO (2013) Baker & Chung (1992) Rostagno et al. (2005)
Abioja et al. (2012) Singh (2019)
National Chicken Council (2011)
score
score
average United States
products No information available 0.65 corn, 0.04 corn gluten meal No information available No information available 0.14 whole corn, 0.24 corn germ Corn & corn by-products
The FAO source has been chosen because it is the only source that discloses details of its method and is able to provide a global average for the % corn in feed. It also reveals how much the corn % can change by country, from 24% in Western Europe to 70% in Latin America, which is consistent with the rest of the literature.
Whilst the FAO source does not give details of what corn products are used in chicken feed, consultation with industry actors suggested that the proportion of whole corn and corn gluten feed in the Baker & Chung study is accurate, and so these proportions are applied to the FAO conversion factor.
Overview
Factor 0.53 0.70 0.65 0.460.50 0.38 0.65
Transparency
3 1 1 2 1 1 Method score 3 N/A N/A 1 N/A N/A Applicability
4 1 1 1 1 1 Credibility score 4 3 3 3 1 3 TOTAL SCORE 14 5 5 7 3 4 Country Global
Brazil Nigeria India US Corn
ROUND TABLE ON RESPONSIBLE SOY ASSOCIATION (RTRS) — 99
Laying poultry
FAO (2013) Singh (2019) Clark et al. (2019)
Similarly to broiler poultry, the FAO source has been chosen because it is the only source able to provide a global average. It shows how corn usage depends on the location, ranging from 0% of layer feed in Russia to 65% in North America. As demonstrated by Clark et al. (2019), a number of countries do not use any corn in laying poultry feed.
iii. Dairy cattle
Factor
Citation FAO (2013) Kroll (2018) Jabbar (2014) Arndt et al. (2015)
score
score
average United States Australia Country Average of 13 countries Israel Pakistan United States
Corn products No information available 0.35 whole corn, 0.10 corn bran N/A Corn products 0.12 maize silage, 0.03 whole corn, 0.02 DDGS, 0.02 whole corn in compound feed 0.22 maize grain, 0.04 corn gluten feed
Whilst no information if provided by FAO on the type of corn products used in laying poultry feed, consultation with industry actors suggested that laying poultry feed usually uses whole corn (corn kernels) rather than any other corn products. It is therefore assumed that 0.44 tonnes whole corn is used in 1 tonne of laying poultry feed.
Maize gluten Corn silage
The FAO (2014) factor has been chosen, as this is based on feed rations from 13 different countries. However, as each of the factors in the document is specific to a named country and feeding system, additional calculations were carried out. For each country, average % corn in feed was calculated based on the proportion of total milk production each feeding system made up. An unweighted mean was then taken of the factors for all 13 countries to produce a global figure.
The FAO document provides detailed information on the type of corn used, which includes corn silage, corn grain, DDGS, distillers grains and corn gluten feed. In addition, compound feed is in cluded, but information is not provided on the % corn in the compound feed. An estimate that the percentage corn in compound feed is 16.9% is used based on Schroder (1999), and this is assumed to be whole corn. It is also assumed that when by-products from the brewing industry are men tioned, this is referring to DDGS unless otherwise stated.
ii.
Factor (t per t) 0.44 0.340.45 0
(t per t) 0.19 0.26 0.20 0.28 Citation
Transparency score 3 1 1 Transparency
4 1 1 1 Method score 3 N/A N/A Method
4 N/A N/A N/A Applicability score 4 1 1 Applicability score 3 1 1 1 Credibility score 4 1 3 Credibility score 4 1 1 3 TOTAL SCORE 14 3 5 TOTAL SCORE 15 3 3 5 Country Global
ROUND TABLE ON RESPONSIBLE SOY ASSOCIATION (RTRS) — 100
Beef cattle
AVERAGE Blezinger (2003) Roman et al. (2011)
United
States
0.08 corn gluten feed, 0.32 whole corn 0.21 whole corn, 0.15 corn gluten feed 0.44 whole corn
Reliable data on beef cattle proved difficult to obtain from public sources. An average value of 0.40 has therefore been taken from the two sources available.
v. Swine
(t per t)
FAO (2014)
whole corn, 0.06 DDGS
The FAO source was chosen as it provides a global average (excluding Sub-Saharan Africa) and was therefore deemed as most appropriate for a globally applicable factor.
The main corn product listed as a feed ingredient is corn (stover not included). ‘By-products from distilleries, breweries and biofuels’ are also named. Further research suggests that these may be corn-based (i.e. DDGS) and so this has been included.
vi. Salmon
(t per t)
Barents Watch (2016)
score
score
corn gluten
Information from Barents Watch shows that 75.06% of salmon feed is made up of vegetable sourc es, whilst corn gluten feed makes up 5% of vegetable sources used. This information is used to find the factor. Whilst the factor is specific to Norwegian salmon production, Norway produces a large percentage of the world’s farmed salmon.
Livestock product conversion factors
The factors provided in this section are for the retail weight of products, rather than carcass weight, but factors for carcass weight are also available in the introduction and within the calculator.
iv.
Factor (t per t) 0.40 0.36 0.44 Citation
Transparency score 1 1 Method score N/A N/A Applicability score 1 1 Credibility score 1 2 TOTAL SCORE 3 4 Country Brazil &
States United
Brazil Corn products
Factor
0.43 Factor
0.037 Citation
Citation
Transparency score 3 Transparency
3 Method score 3 Method
3 Applicability score 4 Applicability score 2 Credibility score 4 Credibility score 2 TOTAL SCORE 14 TOTAL SCORE 10 Country Global Average Country Norway Corn products 0.37
Corn products 0.038
feed
ROUND TABLE ON RESPONSIBLE SOY ASSOCIATION (RTRS) — 101
On the whole, no conversion factor was available showing the conversion from livestock product to corn and so research focused on finding a suitable FCR which could be combined with the livestock feed conversion factors above (Livestock feed conversion factors) to produce a livestock product conversion factor. The scoring below is based on sources of FCR below, which has been combined with the % corn in feed to give the conversion factors.
Where a product requires more than one corn product in its production, the same proportions are used as for the relevant livestock feed product.
i. Chicken
Citation
FAO (2013)
DEFRA (2010) Best (2011) Best (2011)
The FAO figure for FCR is chosen because it has both a transparent method and high geographical applicability. A higher FCR figure is available for chicken produced in a backyard production sys tem, but the factor for the commercial production system has been used. The factor is based on carcass weight, and a factor from Kroes & Kuepper (2015) is used to convert this to a factor based on retail weight.
ii. Egg
Citation FAO (2014)
DEFRA (2010) Ishler (2014)
score
of 13
The FAO figure for FCR is chosen because it has both a transparent method and high geographical applicability. A higher FCR figure is available for eggs produced in a backyard production system, but the factor for the commercial production system has been used.
iii. Milk and other dairy products
Citation
(2014)
(2010) Ishler (2014)
of 13
Factor (t per t) 1.69 1.43 1.35 1.52 Factor (t per t) 1.01 1.34 0.88 Factor (t per t) 0.20 0.13 0.12
FAO
DEFRA
Transparency score 3 4 1 1 Transparency
4 4 2 Transparency score 4 4 2 Method score 4 4 N/A N/A Method score 4 4 2 Method score 4 4 2 Applicability score 4 1 1 1 Applicability score 3 1 1 Applicability score 3 1 1 Credibility score 4 3 1 1 Credibility score 4 3 1 Credibility score 4 3 1 TOTAL SCORE 15 12 3 3 TOTAL SCORE 15 12 6 TOTAL SCORE 15 12 6 Country Global UK United States Brazil Country Average
countries UK United States Country Average
countries UK United States
ROUND TABLE ON RESPONSIBLE SOY ASSOCIATION (RTRS) — 102
The FAO (2014) FCR has been chosen for milk, as this is based on data from farmers across 13 dif ferent countries, rather than just one. Each FCR given is specific to a named country and feeding system, so additional calculations were required to develop one global FCR. For each country, an average FCR was calculated based on the proportion of total milk production each feeding system made up. An unweighted mean was then taken of the FCRs for all 13 countries to produce a global FCR.
In order to convert the corn conversion factor to milk into corn conversion factors for other dairy products, an allocation method from Dairy UK, DairyCo and the Carbon Trust (2010) was used. This allocation is based on the dry mass percentage of each dairy product, which correlates with economic value. Under this method, which is widely accepted by the dairy industry, dairy products with a high dry mass percentage have a higher corn footprint per tonne compared to those with a low dry mass percentage.
Whilst the table above shows the corn conversion factor for milk, the Introduction gives the conver sion factors for all other corn products.
Beef and beef gelatine
(2010)
(2013)
The DEFRA (2010) figure for FCR is used because greater transparency of the method used exists compared to the other source which exists. Although the FCR is higher than the range given by Shike (2013), this may be because Shike (2013) does not consider the rearing costs in calculations of FCR. Furthermore, the DEFRA (2010) source does not rely on additional assumptions to convert an FCR based on dry matter to an FCR based on total feed. DEFRA (2010) provides a number of factors, but the factor chosen is based on the assumption that 4-5 calves are born per cow per year, and an average age of slaughter of 580 days.
In order to convert the factor from being based on live weight to carcass weight, a conversion from University of Tennessee (2014) is used. In addition, a factor from Kroes & Kuepper (2015) is used to convert this to a factor based on retail weight.
To find an additional factor for beef gelatine, as shown in the introduction, an economic allocation method is used together with information from Gac et al. (2014).
(2013)
iv.
Factor (t per t) 10.30 4.44-8.16 Citation DEFRA
Shike
Transparency score 4 1 Method score 4 N/A Applicability score 1 1 Credibility score 3 1 TOTAL SCORE 12 3 Country UK United States
v. Pork Factor (t per t) 2.38 1.91 2.66 Citation FAO
Queensland Government (2016) DEFRA (2010) Transparency score 3 2 4 Method score 4 2 4 Applicability score 4 1 1 Credibility score 4 2 3 TOTAL SCORE 15 6 12 Country Global Australia UK ROUND TABLE ON RESPONSIBLE SOY ASSOCIATION (RTRS) — 103
The FAO figure for FCR is chosen because it has both a transparent method and high geographical applicability. The Oklahoma Department for Agriculture conversion is used to find a conversion from live weight to carcass weight, and the Kroes and Kuepper conversion is used to convert this to retail weight.
vi. Salmon Factor
Two figures were found, both with an FCR of 1.2. Whilst neither source provides a detailed method, both are from reputable sources. Although not explicitly stated, it is assumed that the factor given is for carcass weight, and a factor from Kroes & Kuepper (2015) is used to convert this to a factor based on retail weight.
Manufactured product conversion factors
Most conversion factors for manufactured products have been created based on ingredient speci fications which are publicly available online. For each product, specifications from a range of coun tries are used. In some cases, specifications are not available online, or further calculations or as sumptions are required to develop a corn conversion factor. These are outlined below for each individual corn based product.
i. Popcorn
(t per t)
ii. Corn cereal
(t per
This factor is based on specifications for plain corn cereals, without added chocolate, nuts or fruits. Different terms are used for the corn product used, including milled corn, whole grain corn meal and rolled corn grits. This is assumed to be most similar to whole corn.
iii. Whisky
(t
This factor is relevant only to bourbon whisky, whilst other whisky varieties have a significantly lower (or zero) corn content. Corn whisky is less common but has a higher corn content.
(t per t) 0.05 0.05 Factor
0.69 Factor
t) 0.91 Factor
per t) 0.90 Citation FAO (2017) Consensus (2005) Corn Products Whole corn Corn Products Whole corn Corn Products Whole corn Transparency score 1 1 Method score N/A N/A Applicability score 3 2 Credibility score 4 3 TOTAL SCORE 8 6 Country Global Europe ROUND TABLE ON RESPONSIBLE SOY ASSOCIATION (RTRS) — 104
Corn is used as part of the mash used in the whisky production process, and the volumes used are not typically shown on an ingredients list. However, information on the mash content used by dif ferent distilleries is available at Whisky.com (2020). This has been used, together with an estimate for the volume of mash needed to produce a tonne of whisky, in order to calculate the whisky conversion factor.
iv. Soft drinks (containing high-fructose corn syrup only)
Factor (t per t)
Corn Products
High fructose corn syrup (HFCS 55)
This conversion factor is relevant only to soft drinks produced in the US. Research has shown that high fructose corn syrup is used in the production of soft drinks in the US, whilst other countries typically use sugar as a sweetener. No other corn products are typically used. The volume of high fructose corn syrup used is fairly consistent across different soft drink products.
v. Cooking oil (corn)
Factor (t per t)
Corn Products
Corn oil
Whilst a variety of cooking oils were assessed, corn oil was the only oil type containing corn.
vi. Potato chips
Factor (t per t)
Corn Products
Crude corn oil
None of the specifications available gave details of the volume of corn oil used in production or contained within the product. However, fat content per 100g was available in all specifications, so this was used along with the assumption that approximately 100% of the fat contained in the product is obtained from cooking oil. This gives an estimate of 37.5g oil per 100g crisps. It is not clear what proportion of oil used is corn oil, but a typical specification for crisps includes canola oil, corn oil and sunflower oil. An assumption that corn oil will make up a third of total oil content is therefore used to calculate the final conversion factor.
vii. Ketchup
Factor (t per t)
Corn Products
High fructose corn syrup (HFCS 55)
High fructose corn syrup and corn syrup were identified in the specification of most ketchup va rieties worldwide. Information on the volume of these products contained in ketchup was not available, but the volume of added sugar per 100g ketchup is available. It is assumed equivalent to the volume of corn syrup within the product due to the absence of other added sugars. This infor mation is therefore used to find the corn conversion factor for ketchup.
0.11
0.20
1.00
0.13
ROUND TABLE ON RESPONSIBLE SOY ASSOCIATION (RTRS) — 105
Chocolate
Corn Products
Although some exceptions do exist, the majority of chocolate specifications surveyed did not include corn products as an ingredient. This conversion factor is therefore based on the milk powder content of chocolate products.
ix. Glue
Products
germ
Corn products were not found as a common ingredient in most glue specifications, and information on the volume of each ingredient included in glue is uncommon. However, one source has been found stating that corn-germ based glue includes 2.6% corn germ. In the absence of other information, this has been used. This factor is only applicable to corn-germ based glue.
viii.
Factor (t per t) 0.30 Factor (t per t) 0.03
See Livestock Products - Milk Corn
Corn
ROUND TABLE ON RESPONSIBLE SOY ASSOCIATION (RTRS) — 106
Appendix III Data source quality review – FAO (2013)
FAO (2013)
Source name:
Author(s):
Uses supply chain data? 3
Greenhouse gas emissions from pig and chicken supply chains - A global life cycle assessment
Funder(s): Published: Year published: Geographical coverage:
OVERVIEW
MacLeod, M., Gerber, P., Mottet, A., Tempio, G., Falcucci, A., Opio, C., Vellinga, T., Henderson, B. and Steinfeld, H. Food and Agriculture Organization of the United Nations (FAO) FAO website
2013
Uses global data
Uses peer review?
Indicator Score (1-4)
Transparency of method
Reliability of method
applicability
Credibility score
What was the purpose and scope of the data source?
This research is intended to calculate GHG emissions of pork, chicken and egg supply chains, as well as identifying where the emissions hotspots exist. It includes an analysis of emissions for these three separate products by region as well as production system. Whilst much of the research goes beyond the scope of what is of interest in developing the corn calculator, feed production is a particular focus, constituting over 60% of total emissions in the supply chain for each protein type.
METHOD
How were these factors reached?
The Global Livestock Environmental Assessment Model (GLEAM) is used, together with data from literature, national inventory reports, expert knowledge and SPAM and FAOSTAT databases. The ‘Feed Module’ is used to calculate the feed composition for each species, system and location. The ‘System Module’ is used to calculate the Feed Conversion Ratio (FCR) of each livestock type and uses information on the energy requirements for animals combined with information on the energy content of feed. These are available by region and production system, but a global average is used. FCRS represent an average over the whole flock/ herd, including parent animals.
RESULTS kg of corn used per unit of product
Product Unit kg corn/unit Feed (pork) kg 0.37 Feed (meat poultry) kg 0.53 Feed (laying poultry) kg 0.44
Product FCR (live weight) FCR (carcass weight) Pork 2.7 Not available Chicken 2.3
Egg 2.3 2.3
3
4 Geographical
4
4
4.2
ROUND TABLE ON RESPONSIBLE SOY ASSOCIATION (RTRS) — 108
APPLICATION TO RTRS
Are the results useful, valid and reliable?
• FCR and % corn in feed is available for pork, laying poultry and meat poultry at a globally representative level.
• The FCR for poultry is available for both live weight and carcass weight, so no additional conversion is needed for carcass weight, although a conversion is required for retail weight. The FCR for pork is available only for live weight, so additional conversions are needed for carcass weight and retail weight.
• Although FCR is available for backyard systems as well as industrial systems, the industrial FCR is considered most appropriate for use in the corn calculator.
• Corn products identified in feed include corn ‘grain (stover not used)’ and ‘By-product from breweries, distilleries, bio fuels etc’. The report does not state what proportion of these by-products are corn-based, so it is assumed that these are 100% corn-based. It is also unclear what type of corn products are included in the feed as corn ‘grain (stover not included). Further research suggests that this is a mixture of corn gluten feed, corn bran and whole corn.
• Factors and FCRs are based on a global average, making them appropriate for usage in a global calculator. Regional data is also available, and is consistent with other sources found.
ROUND TABLE ON RESPONSIBLE SOY ASSOCIATION (RTRS) — 109
UTOQUAI 29/31 | 8008 ZURICH, SWITZERLAND info@responsiblesoy.org responsiblesoy.org