

A water loving nation free from drowning

Acknowledgements
This report was written and compiled by Royal Life Saving Society WA.
Royal Life Saving WA would like to acknowledge and thank the following organisations for their contribution to the WA Drowning Report:
• Royal Life Saving Society - Australia
• Department of Health WA
• The National Coronial Information System


Royal Life Saving acknowledges the traditional custodians of the lands in which we live and work. We pay our respects to the Elders past and present. We extend our respect to all Aboriginal and Torres Strait Islander Peoples and recognize their continuing association with the land, waters and sky of this country.
Multicultural communities were over-represented in drowning data
Drowning incidents were most likely to occur at coastal and inland waterways while diving, swimming, or using watercraft.


Drowning has a profound impact on communities, extending far beyond the immediate tragedy of loss. For individuals who survive non-fatal drowning incidents, the long-term consequences can include severe physical and neurological impairments, significantly altering their quality of life. Furthermore, the ripple effect of these incidents can impact local communities, highlighting the necessity for increased awareness and preventive measures.
This report highlights key unintentional drowning trends in Western Australia (WA) from July 2022 to June 2023 and identifies key priority areas for action. Translating this research into policy and practice supports Royal Life Saving WA’s efforts to gain a deeper understanding of drowning and its impacts, develop evidence-based and innovative solutions for drowning prevention, and empower the community to adopt safer aquatic behaviours.
223 drowning incidents (fatal and non-fatal) occured in WA in 2022/23
This is a 16.0% decrease on 2021/2 and a 5.5% average increase over the past decade
Fatal Drowning
There were 29 fatal drowning incidents recorded in WA waterways between July 2022 and June 2023, at a rate of 1.0 per 100,000 population. This was a 20.5% decrease from 2021/22 with trends showing a 5.8% decrease in fatal drowning rates over the past ten years.
At the time of reporting, 51.4% of fatal drowning cases were still open pending investigation by the coroner.
Nationally, WA accounted for 11.0% of drowning deaths in 2022/23 and recorded the third highest drowning rate behind Queensland and New South Wales.
Non-Fatal Drowning
There were 194 non-fatal drowning incidents recorded in WA during 2022/23, a 15.3% decrease from 2021/22.
Of these, 105 people were admitted to hospital following a non-fatal drowning incident at a rate of 3.7 per 100,000 population. This was an 9.9% decrease from 2021/22, with trends showing a 5.8% decrease in hospitalisation rates over the past decade. Of those admitted to hospital, 14.3% sustained a brain injury as a result of the incident.
In addition, 89 people presented at an emergency department following a non-fatal drowning incident at a rate of 4.0 per 100,000 population. This was a 23.1% decrease from 2021/22, with trends showing a 12.5% increase in the rate of emergency department presentations over the past ten years.
For every fatal drowning death recorded in 2022/23, there were seven non-fatal drowning incidents

Males continue to account for the majority of drowning incidents (fatal and non-fatal) with males 2.7 times more likely to be involved in a drowning incident (11.5 per 100,000) than females (4.4 per 100,000) in 2022/23. In continuing trends, drowning rates decreased for both males (15.4%) and females (21.4%) from 2021/22.
72.7% of those who drowned in Western Australia were male
The risk of drowning varies significantly with age, affecting different age groups in unique ways and highlighting the need for targeted age-specific interventions to reduce drowning risk. Toddlers recorded the highest rate of drowning in 2022/23 (44.4 per 100,000) followed by older adults 65+ years (7.9 per 100,000) and adults aged 25-64 years (5.3 per 100,000). In a continuing trend, drowning severity increased with age with older adults over 65 years of age recording the highest rate of fatal drowning (2.0 per 100,000).
Overall drowning rates for toddlers, children and young people decreased from 2021/22, with the biggest decrease seen amongst children (60.3%) and toddlers (28.5%). Conversely, overall drowning rates increased for adults and older adults, with adult rates more than double that seen in 2021/22.
There were no fatal drowning deaths recorded for children aged 5-14 years in 2022/23, a positive outcome after recording the highest number of drowning deaths in a decade in 2021/22. In addition, drowning in toddlers aged 0-4 years has seen a significant shift over the past decade with fatal drowning rates halving over this time.
Drowning by Age Group, 2022/23
Aboriginal Australians continue to be over-represented in drowning data with 9.5% of incidents (fatal and non-fatal) involving Aboriginal Australians, a 3.9% increase from 2021/22. Aboriginal Australians were 2.5 times more likely to be involved in a drowning incident (19.2 per 100,000) than non-Aboriginal Australians (7.7 per 100,000).
Overall, 24.8% of drowning incidents (fatal and non-fatal) involved a person born overseas , a 7.2% increase from 2021/22. This was higher for fatal drowning where half of the deaths recorded in 2022/23 involved a person born overseas. Of these, 70.0% were from a nonEnglish speaking background. Almost half (40.0%) were long term residents having lived in Australia for 10 or more years and 30.0% were in Australia on international students or working holiday visas. Country of birth information wasn’t available for 31.0% of drowning deaths.
Overall, 34.2% of drowning deaths recorded in 2022/23 were visitors to WA, with 21.1% traveling within WA and 7.9% interstate visitors.
Of the fatal drowning deaths recorded in 2022/23, 44.8% of people involved were from low socio-economic areas , double the amount observed in 2021/22.


Like previous years, almost half (49.3%) of drowning incidents occurred during the summer months, likely due to increased participation in water activities, driven by higher temperatures and extended daylight hours. In addition, holiday season brings many people to unfamiliar water locations, often leading to decreased vigilance and social gatherings with alcohol consumption can also contribute to the heightened risk of drowning in summer.
There was a shift in 2022/23 with drowning deaths most likely to occur on the weekend (51.7%) rather than during the week as seen in previous years. Only 6.9% of fatal drowning incidents occurred on a public holiday/ long weekend.
Drowning was most likely to occur in the morning (37.9%) or afternoon (27.6%) with 8-9am and 11am12pm the highest risk times for drowning.
High-risk times for drowning
Drowning by season, 2022/23
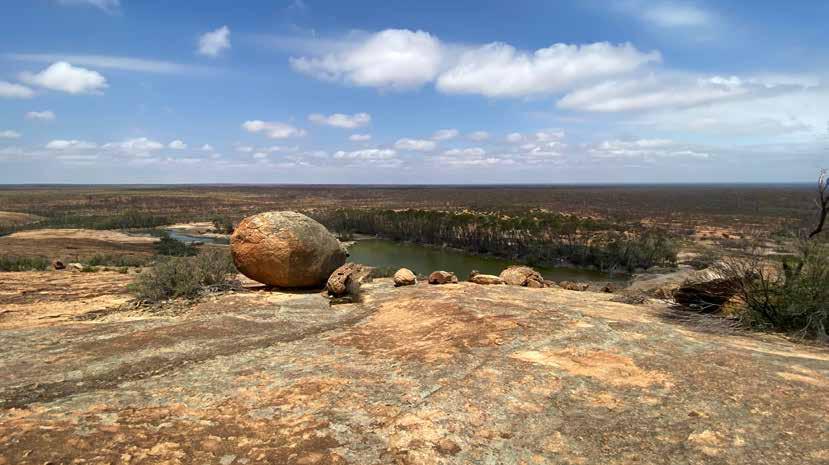
More than a third of drowning deaths (34.5%) occurred in remote or very remote locations within WA.
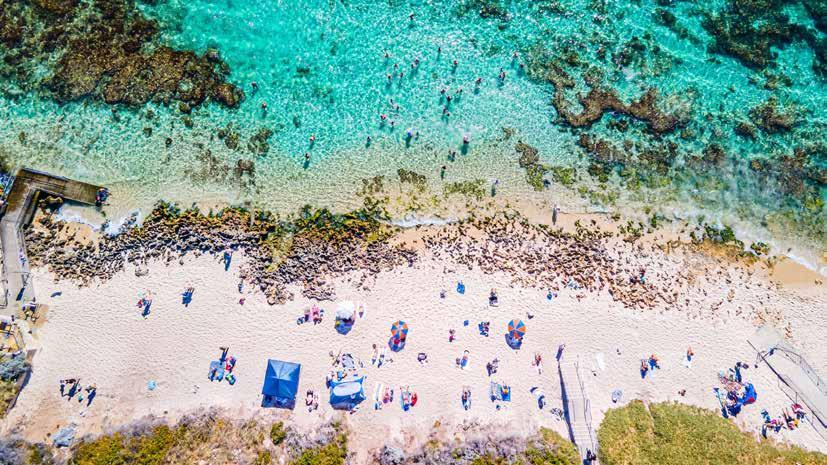
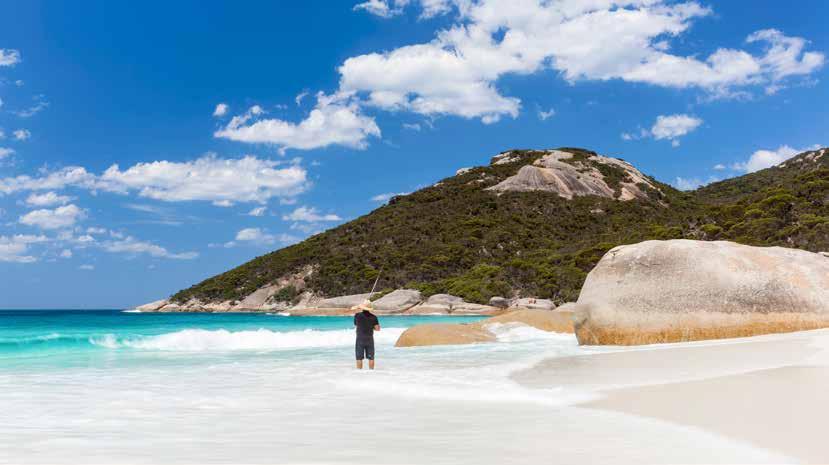
Fatal drowning incidents were most likely to occur at coastal (69.0%) and inland (24.1%) waterways with beaches (41.4%), ocean/harbour (27.6%) and river/creek (13.8%) the most common locations for drowning. For non-fatal drowning, large areas of water (32.4%), home swimming pools (15.3%) and beaches (10.5%) were the most common locations for drowning.
Fatal drowning by aquatic location, 2022/23
Metro vs. regional aquatic location
In a continuing trend, drowning risk was greater in regional and remote areas of WA likely due to less access to water safety education, resulting in lower awareness of safe practices. Additionally, isolation can lead to riskier behaviours, increasing exposure to water hazards without adequate safety measures and limited access to emergency services.
While a higher proportion for drowning (fatal and nonfatal) occurred in the Perth metropolitan area (70.1%), rates of drowning were higher in regional WA where people were 1.7 times more likely to drown (7.1 per 100,000) than in the Perth metropolitan area (4.2 per 100,000). This was greater for fatal drowning incidents where people were 5.7 times more likely to die from drowning in regional WA (3.0 per 100,000) than the Perth metropolitan area (0.5 per 100,000).
Drowning trends over the past ten years show that the Kimberley, Midwest, and Pilbara regions recorded the highest overall drowning rates (fatal and non-fatal), while the Wheatbelt, East Metropolitan and North Metropolitan regions recorded the lowest rates.
Drowning by health region, 2013/14 to 2022/23
Proportion of drowning deaths by remoteness
Unlike previous years, diving was the most common activity being undertaken at the time of fatal drowning incidents (19.4%) including snorkelling, scuba diving and free diving. Swimming, recreating around water and watercraft were other common activities being undertaken (16.1%).
Most people involved in fatal drowning incidents were participating in an aquatic activity at the time and entered the water intentionally (62.1%). Of those who weren’t prepared to enter the water, 44.4% slipped or fell, one third (33.3%) crashed and 22.2% were swept in by a wave.
For non-fatal drowning, 30.5% were participating in a water sport and 20.0% were participating in a leisure activity at the time of the incident.
Fatal drowning by activity, 2022/23
A rescue was attempted in 69.0% of fatal drowning incidents recorded in 2022/23. Members of the public were most likely to undertake the rescue (55.5%) followed by friends (25.0%) and/or family members (20.0%).
An aquatic rescue wasn’t be performed in 31.0% of fatal drowning incidents. Common reasons for a rescue not being performed include individuals participating alone, dangerous conditions posing risks to rescuers, lack of swimming skills, or limited availability of rescue/ safety equipment. These challenges can prevent the safe and effective execution of a rescue.
A rescue was attempted in 69.0% of fatal drowning incidents

Risk Factors
Of those incidents where an aquatic rescue was performed, cardiopulmonary resuscitation (CPR) was performed in three out of four incidents (75.0%).
CPR was most likely to be performed by emergency services such as police, ambulance officers and lifeguards (73.3%) and/or members of the public (60.0%). In instances where CPR wasn’t performed, most common reasons included that the rescuers were unable to retrieve the person or that the person was clearly deceased upon removal from the water.
34.5% Remoteness of location
24.1% Environmental factors such as poor weather and/or water conditions
20.7% Participating at an unfamiliar location
13.8% Consumption of alcohol (BAC >0.05)
13.8% Poor swimming ability
10.3% Lack of safety equipment including lifejacket wear
6.9% Inexperience in activity being undertaken
6.9% Flood-related
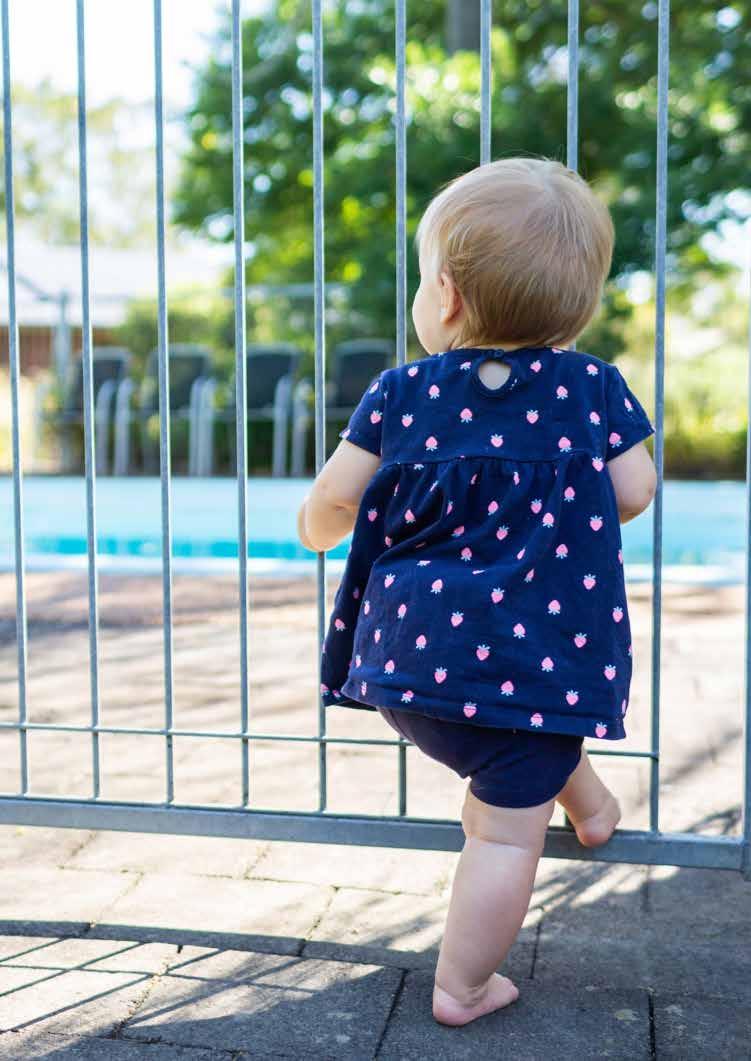
TODDLER (0-4 YEARS) DROWNING
July 2013 to June 2023

There were 1,042 drowning incidents recorded amongst toddlers aged 0-4 years
There were 21 drowning deaths and 400 hospital admissions at a rate of 60.4 drownings per 100,000 and has the #1 drowning rate of any age group in WA
Fatal Drowning
There were 21 fatal drowning incidents involving toddlers aged 0-4 years, at a rate of 1.2 per 100,000 the third highest of any age group in WA. Fatal drowning trends show that average fatal drowning rates for toddlers have halved (49.9%) over the past ten years.
Non-Fatal Drowning
There were 1,021 non-fatal drowning incidents involving toddlers over the past ten years. Of these, 400 toddlers were admitted to hospital at a rate of 23.2 per 100,000. Both the average number and rate of toddlers being admitted to hospital following a non-fatal drowning incident have decreased by 5.8% and 5.3% respectively over the past ten years. In addition, 621 toddlers presented at an emergency department in the Perth Metropolitan area at a rate of 45.4 per 100,000. Both the average number and rate of toddlers presenting at an emergency department following a non-fatal drowning incident have increased by 5.6% and 5.2% respectively over the past ten years.
Toddler drowning by year, 2013/14 to 2022/23
Boys were 1.3 times more likely to be involved in a drowning incident (27.9 per 100,000) than girls (21.2 per 100,000).
58.4% of all drowning deaths were males
Average length of stay in hospital was 2.7 days . 5.3% of toddlers admitted to hospital experienced brain injury as a result of the non-fatal drowning incident.
97.9% were born in Australia 2.1% were born overseas
Of toddlers were aged 0-2 years 71%
Overall, 7.7% of toddlers who drowned (fatal and non-fatal) were Aboriginal , with Aboriginal toddlers 1.5 times more likely to drown (86.4 per 100,000) than nonAboriginal toddlers (58.9 per 100,000).
Toddler drowning was 1.3 times more likely to occur in regional WA (29.5 per 100,000) than the Perth Metropolitan area (23.1 per 100,000).
Drowning by location, 2013/14 to 2022/23 (Rate per 100,000 population)
Aquatic rescue and CPR was performed in 95.2% of fatal drowning incidents involving toddlers, with family members the most common first responders. 47.4% Gate/Door propped open
Risk Factors for Drowning
Lack of supervision was a contributing factor in all fatal toddler drowning incidents.
In one third of cases (33.3%), supervision was absent for less than five minutes, while parents were doing household chores (41.4%), caring for other children (10.3%), socialising with other adults (10.3%) or sleeping (6.9%).
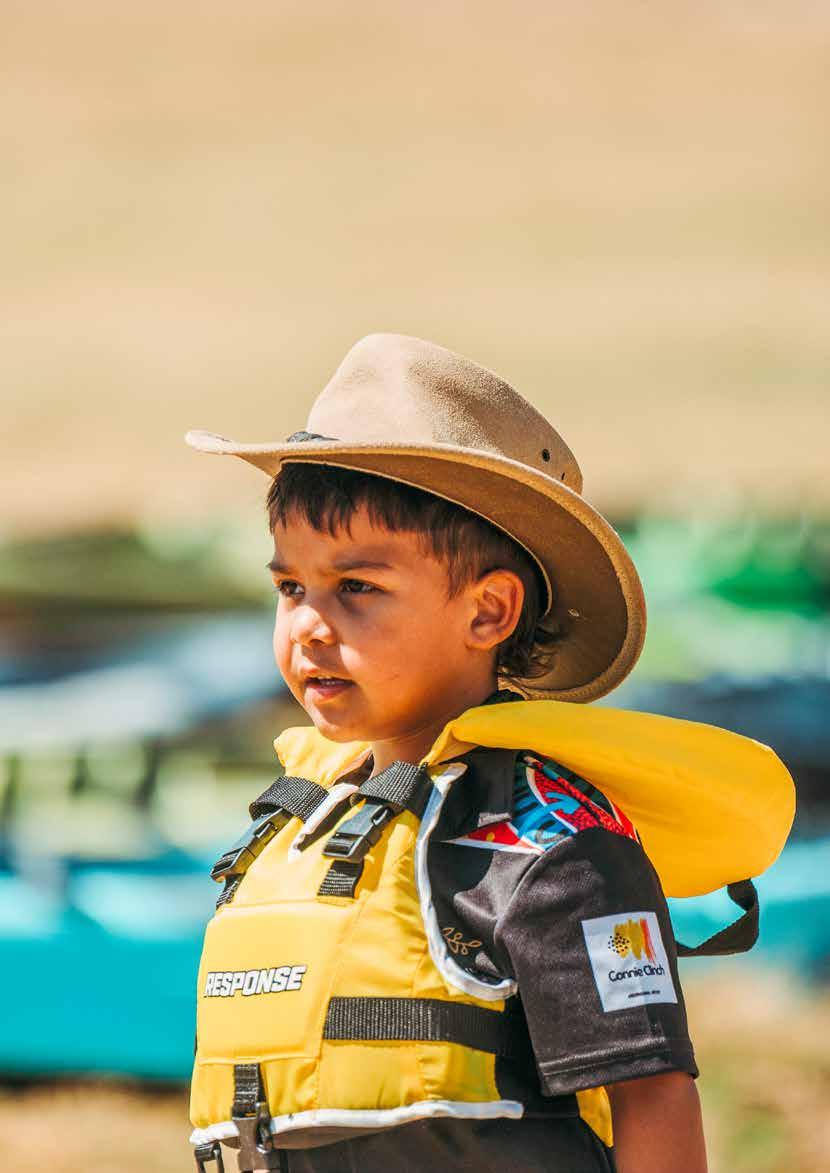
CHILD (5-14 YEARS) DROWNING
July 2013 to June 2023

There were 312 drowning incidents recorded amongst children aged 5-14 years
Fatal Drowning
There were eight fatal drowning incidents involving children aged 5-14 years, at a rate of 0.2 per 100,000 the lowest of any age group in WA. Fatal drowning trends show that while fatal drowning rates have remained low in WA with an average of one death per year, there has been a 55.7% increase in the average rate of fatal drowning amongst children over the past ten years.
Non-Fatal Drowning
There were 304 non-fatal drowning incidents involving children over the past ten years. Of these, 127 children were admitted to hospital at a rate of 3.8 per 100,000. Both the average number and rate of toddlers being admitted to hospital following a nonfatal drowning incident have decreased by 15.9% and 22.3% respectively over the past ten years. In addition, 177 children presented at an emergency department in the Perth Metropolitan area at a rate of 7.6 per 100,000. Both the average number and rate of children presenting at an emergency department following a non-fatal drowning incident have increased by 26.9% and 16.0% respectively over the past ten years.
Boys were 2.2 times more likely to be involved in a drowning incident (5.4 per 100,000) than girls (2.4 per 100,000).
69.9% of all drowning deaths were males
Average length of stay in hospital was 2.1 days 11.8% of children admitted to hospital experienced brain injury as a result of the non-fatal drowning incident.
High-risk times for drowning
Child drowning by year, 2013/14 to 2022/23
were born in Australia 11.5% were born overseas 37.5% were visitors traveling within WA were aged 5-9 years 88%
Child drowning was 1.2 times more likely to occur in regional WA (4.5 per 100,000) than the Perth Metropolitan area (3.8 per 100,000).
Drowning by location, 2013/14 to 2022/23 (Rate per 100,000 population)
Overall, 9.4% of children who drowned (fatal and non-fatal) were Aboriginal , with Aboriginal toddlers 1.7 times more likely to drown (15.1 per 100,000) than non-Aboriginal toddlers (8.8 per 100,000).
Aquatic rescue and CPR was performed in 100% of fatal drowning incidents involving children, with family members (75.0%) the most common first responders.
Lack of supervision was a contributing factor in all fatal child drowning incidents.
S upervision was absent for less than five minutes in 37.5% of cases, while parents were doing household chores (33.3%), socialising and/or talking on the phone (33.3%)
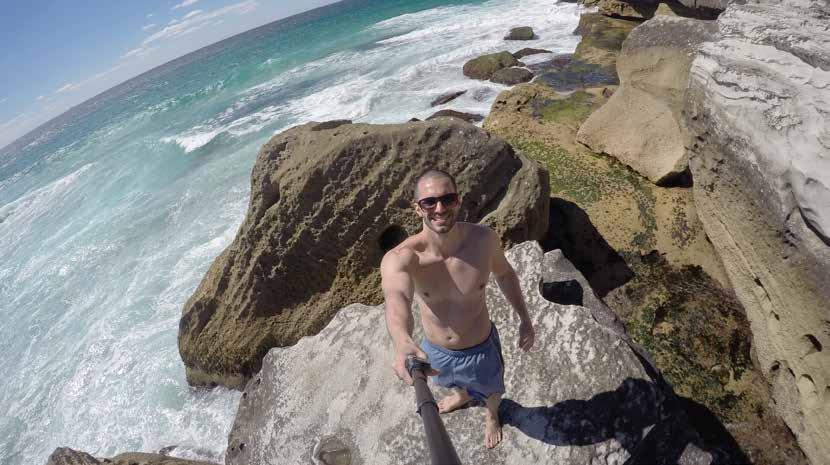
YOUTH DROWNING 15-24 YEARS
July 2013 to June 2023

There were 216 drowning incidents recorded amongst young people 15-24 years
There were
32 drowning deaths and 105 hospital admissions at a rate of 6.5 drownings per 100,000 and has the #3 drowning rate of any age group in WA
Fatal Drowning
There were 32 fatal drowning incidents involving young people aged 15-24 years, at a rate of 1.0 per 100,000 the fourth highest of any age group in WA. Fatal drowning trends show that average fatal drowning rates amongst young people have increased by 35.2% over the past ten years.
Non-Fatal Drowning
There were 184 non-fatal drowning incidents involving young people over the past ten years. Of these, 105 young people were admitted to hospital at a rate of 3.2 per 100,000. Both the average number and rate of young people being admitted to hospital following a non-fatal drowning incident have decreased by 25.0% and 21.2% respectively over the past ten years.
In addition, 79 young people presented at an emergency department in the Perth Metropolitan area at a rate of 2.9 per 100,000.
Average length of stay in hospital was 3.0 days . 19.0% of young people admitted to hospital experienced brain injury as a result of the non-fatal drowning incident.
Drowning risk increased with age
Overall, 6.0% of young people who drowned were Aboriginal, with drowning rates slightly lower for Aboriginal young people (6.0/100,000) than non-Aboriginal young people (6.6/100,000).
Young people were most likely to be participating in an aquatic activity at the time of the incident, with swimming, fishing and boating the most common activities being undertaken.
Top Locations
41.9% Ocean/Harbour
Beach 22.6% Lake/Dam
Aquatic rescue was attempted in 71.9% of fatal drowning incidents, with friends (47.8%) and bystanders/ members of the public (39.1%) the most common first responders. CPR was performed in almost half of these rescues (47.8%).
59.4% Environmental factors 16.1 River/Creek
While a greater proportion of youth drowning incidents occurred in the Perth Metropolitan area (67.2%), drowning was 2.2 times more likely to occur in regional WA (7.6/100,000) than the Perth Metropolitan area (3.4/100,000).
Risk Factors for Drowning
28.1% Low socio-economic status 21.9% Lack of safety equipment including lifejacket use 21.9% Recreational drug use
37.5% Participating at unfamiliar locations
28.1% Poor swimming ability
Remoteness of location
Injury
Medical condition
Participating alone 12.5% Inexperience in activity 9.4% Consumption of alcohol (BAC >0.05)

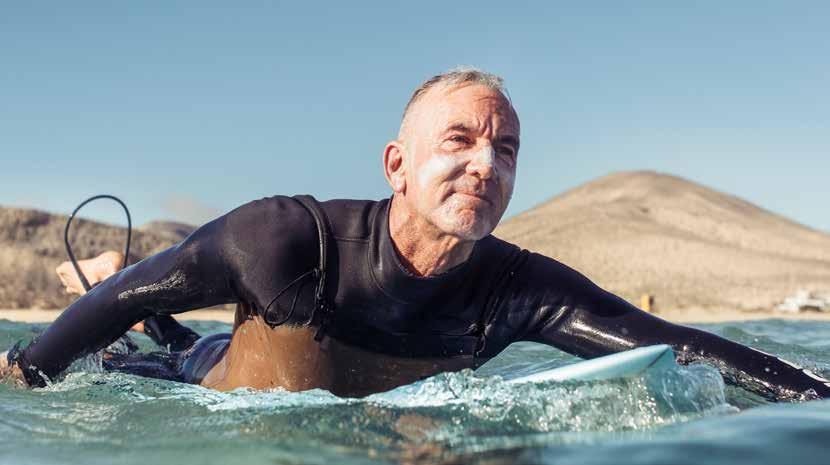
ADULT (45-64 YEARS) DROWNING
July 2013 to June 2023
There were 342 drowning incidents recorded amongst adults 45-64 years
There were 82 drowning deaths and 194 hospital admissions at a rate of 5.3 drownings per
Fatal Drowning
There were 82 fatal drowning incidents involving adults 45-64 years, at a rate of 1.3 per 100,000 the second highest of any age group in WA. Fatal drowning trends show that average fatal drowning rates amongst adults have decreased by 12.8% over the past ten years.
Non-Fatal Drowning
There were 260 non-fatal drowning incidents involving adults over the past ten years. Of these, 194 adults aged 45-64 years were admitted to hospital at a rate of 3.0 per 100,000. This means that on average, for every adult that died from drowning over the past ten years, there were two admitted to hospital following a nonfatal drowning incident.
In addition, 66 adults aged 45-64 years presented at an emergency department in the Perth Metropolitan area at a rate of 4.6 per 100,000.
Males were 2.5 times more likely to be involved in a
Drowning risk increased with age
45-54 years 55-64 years 47.6% 52.4%
Adults were most likely to be participating in an aquatic activity at the time of the incident, with fishing, diving, and boating the most common activities being undertaken.
Overall, 3.5% of adults who drowned were Aboriginal, with Aboriginal adults 1.5 times more likely to be involved in a drowning incident (7.7/100,000) than non-Aboriginal adults (5.2/100,000).
Multicultural communities were over-represented in adult drowning data with 40.7% born overseas
39.0% Ocean/Harbour
Beach
River/Creek
Lake/Dam
Aquatic rescue was attempted in 63.4% of fatal drowning incidents, with bystanders/members of the public (51.9%) and family members (32.7%) the most common first responders. CPR was performed in half of these rescues (51.2%).
While a greater proportion of adult drowning incidents occurred in the Perth Metropolitan area (63.0%), drowning was twice as likely to occur in regional WA (7.0/100,000) than the Perth Metropolitan area (3.5/100,000).
Risk Factors for Drowning
31.7% Remoteness of location
42.7% Medical condition
25.6% Low socio-economic status
20.7% Consumption of alcohol (BAC >0.05)
19.5% Lack of safety equipment including lifejacket use
42.7% Participating alone
35.4% Environmental factors
17.1% Participating at unfamiliar locations
14.6% Recreational drug use
13.4% Poor swimming ability
8.5% Injury

OLDER ADULT (65+ YEARS) DROWNING
July 2013 to June 2023


There were 239 drowning incidents recorded amongst older adults over 65 years
There were 87 drowning deaths and 119 hospital admissions at a rate of 6.3
Males were 4.2 times more likely to be involved in a drowning incident (9.1 per 100,000) than females (2.1 per
Average length of stay in hospital was 4.5 days
15.1% of older adults admitted to hospital experienced brain injury as a result of the non-fatal drowning incident.
Drowning risk decreased with age
67.8% Weekdays
Older adults were most likely to be participating in an aquatic activity at the time of the incident, with swimming, boating and watercraft the most common activities being undertaken.
Fatal Drowning
There were 87 fatal drowning incidents involving older adults 65 years and over, at a rate of 2.3 per 100,000, the highest of any age group in WA. Fatal drowning trends show that average fatal drowning rates amongst older adults have increased by 33.1% over the past ten years.
Non-Fatal Drowning
There were 152 non-fatal drowning incidents involving older adults over the past ten years. Of these, 119 older adults aged 65 years and over were admitted to hospital at a rate of 3.1 per 100,000. While the average number of hospital admissions amongst older adults have increased by 12.5% over the past ten years, rates of hospitalisation have decreased by 8.5%.
In addition, 33 older adults aged 65 years and over presented at an emergency department in the Perth Metropolitan area at a rate of 1.1 per 100,000.
Overall, there were no drowning incidents amongst older adults involving Aboriginal Australians.
Multicultural communities were over-represented in older adult drowning data with 48.5% born overseas.
14.9% of people drowned while travelling within WA
by location, 2013/14 to 2022/23
31.0% Ocean/Harbour
Beach
Home Pool
River/Creek
Aquatic rescue was attempted in 64.4% of fatal drowning incidents, with bystanders/members of the public (37.5%) and family members (32.1%) the most common first responders. CPR was performed in more than half of these rescues (56.3%).
While a greater proportion of drowning incidents amongst older adults occurred in the Perth Metropolitan area (75.7%), drowning was 1.2 times more likely to occur in regional WA (6.1/100,000) than the Perth Metropolitan area (5.2/100,000).
Risk Factors for Drowning
21.8% Low socio-economic status
Medical condition
19.5% Remoteness of location
13.8% Consumption of alcohol (BAC >0.05)
13.8% Lack of safety equipment including lifejacket use
62.1% Participating alone
27.6% Environmental factors
13.8% Poor swimming ability
8.1% Participating at unfamiliar locations
6.9% Injury
DROWNING IN PEOPLE BORN OVERSEAS
July 2013 to June 2023

There were 362 drowning incidents recorded involving people born overseas
There were 133 drowning deaths and 229 hospital admissions at a rate of 4.0 drownings per 100,000 representing 25% of total drownings recorded in WA
Fatal Drowning
There were 133 fatal drowning incidents involving people born overseas, at a rate of 1.5 per 100,000 and representing 40.7% of all drowning deaths recorded in WA over the past decade. Fatal drowning trends show that average fatal drowning rates amongst people born overseas have increased by 8.0% over the past ten years, while drowning rates amongst those born in Australia have decreased by 25.7%.
Overall, people born overseas were 1.3 times more likely to be involved in a fatal drowning incident (1.5/100,000) than those born in Australia (1.1/100,000).
Non-Fatal Drowning
There were 229 people born overseas admitted to hospital following a non-fatal drowning incident over the past ten years, at rate of 2.5/100,000 and representing 20.7% of all non-fatal drowning related hospital admissions over the past ten years.
Non-fatal drowning trends show that the average proportion of non-fatal drowning incidents involving people born overseas has decreased by 3.5% over the past ten years.
Overall, people born in Australia were 1.6 times more likely to drown (6.3/100,000) than those born overseas (4.0/100,000).
Males were three times more likely to drown than females.
75.1% of those who drowned were male
Average length of stay in hospital was 3.2 days 9.2% of people born overseas admitted to hospital experienced brain injury as a result of the non-fatal drowning incident.
People born overseas drowning by year, 2013/14 to 2022/23
Proportion of drowning, 2013/14 to 2022/23
Almost half (47.8%) of drowning incidents involving people born overseas were from a non-English speaking background.
9.8% were new arrivals having lived in Australia for less than five years.
People involved in a fatal drowning incident were most likely to be long term residents having lived in Australia for more than 10 years (51.9%).
5.3% were overseas tourists holidaying in Australia.
Drowning by location, 2013/14 to 2022/23 (% of total drowning deaths) The proportion of people born overseas involved in drowning (fatal and non-fatal) increased with age (proportion of overall drowning).
Drowning incidents involving people born overseas were 1.4 times more likely to occur in regional WA (1.7/100,000) than the Perth Metropolitan area (1.3/100,000). This was higher for fatal drowning where drowning rates were almost three times higher in regional WA (1.0/100,000) than the Perth Metropolitan area (0.4/100,000).
Aquatic rescue was attempted in 69.9% of fatal drowning incidents, with bystanders/members of the public (43.0%) and professional staff such as lifeguards (29.3%) the most common first responders. CPR was performed in more than two thirds of these rescues (69.9%).
July 2013 to June 2023
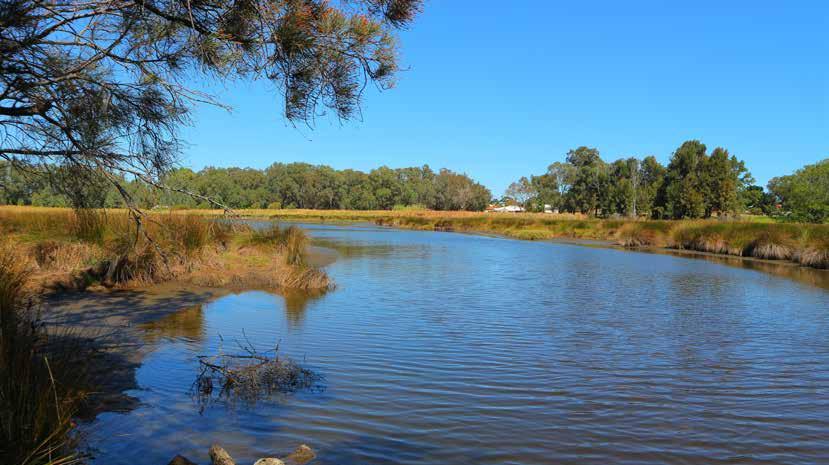
There were 225 drowning incidents recorded at inland waterway locations.
There were
81 drowning deaths and 144 hospital admissions at a rate of 0.84 drownings per 100,000 representing 16% of total drownings recorded in WA
Fatal Drowning
There were 81 fatal drowning incidents occurring at inland waterways at a rate of 0.3 per 100,000 and representing 23.7% of all drowning deaths recorded in WA over the past decade.
Fatal drowning trends show that both the average number (13.2%) and proportion (20.9%) of fatal drowning incidents occurring at inland waterway locations have increased over the past ten years.
Non-Fatal Drowning
There were 144 people admitted to hospital following a non-fatal drowning incident at an inland waterway location over the past ten years, at rate of 0.5/100,000 and representing 13.0% of all non-fatal drowning related hospital admissions over the past ten years.
Proportion of fatal drowning at inland waterways, 2013/14 to 2022/23
Males were 3.5 times more likely to drown than females.
77.8% of all drowning deaths were males
Drowning by location, 2013/14 to 2022/23 (% of total drowning deaths)
Top 3 Waterways
Swan River Ord River Fitzroy River
Overall, 14.8% of people who drowned at inland waterways were Aboriginal, with Aboriginal Australians 4.8 times more likely to be involved in a drowning incident (1.5/100,000) than non-Aboriginal Australians (0.3/100,000).
Aquatic rescue was attempted in 56.8% of fatal drowning incidents, with friends (39.1%) and bystanders/members of the public (34.8%) the most common. CPR was performed in more than half of these rescues (52.2%).
Multicultural communities were over-represented in drowning deaths at inland waterway locations with almost half (48.8%) born overseas.
of people
while
Adults aged 25-44 years and older adults 65+ years were most at risk of drowning at inland waterway locations. (Rate per 100,000)
Toddlers (0-4 years) 1.2
Children (5-14 years) 3.7
Young People (15-24 years) 14.8
Adults (25-64 years) 43.2
Top Activities 23.8% Swimming 13.1% Non-Aquatic Transport 20.2% Recreating
58.7% River/Creek 29.6% Low socio-economic status 40.7% Participating alone
49.4% Environmental factors 4.4% Other 36.9% Lake/Dam
Adults (45-64 years) 17.3
Older Adults (65+ years) 19.8
Overall, 50.6% of drowning occurred at inland waterways in the Perth Metropolitan area, however, drowning was 3.8 times more likely to occur at an inland waterway in regional WA (0.7/100,000) than the Perth Metropolitan area (0.2/100,000).
Risk Factors for Drowning
28.4% Consumption of alcohol (BAC >0.05)
28.4% Poor swimming ability 27.2% Medical condition
27.2% Remoteness of location
18.5% Recreational drug use
Participating at unfamiliar locations
Injury 12.4% Inexperience in activity
Flood-related
Lack of safety equipment including lifejacket use


There were 281 drowning incidents recorded in the Perth Metropolitan - East region
Overall, 4.6% of people who drowned were Aboriginal , with Aboriginal Australians (8.7/100,000) were 2.3 times more likely to drown than non-Aboriginal Australians (3.8/100,000).
Tourists and/or visitors to the area were involved in 6.7% of fatal drowning incidents, which is significantly lower than the state average (31.8%).
Drowning risk was greatest amongst toddlers, children, and older adults. (Rate per 100,000)
There were 308 drowning incidents recorded in the Perth Metropolitan - North region
Overall, 2.0% of people who drowned were Aboriginal , with Aboriginal Australians (7.3/100,000) were 1.8 times more likely to drown than non-Aboriginal Australians (4.1/100,000).
Tourists and/or visitors to the area were involved in 6.1% of fatal drowning incidents, which is significantly lower than the state average (31.8%).
Rescue Attempted (79.6%) CPR performed (71.4%)
Drowning risk was greatest amongst toddlers, older adults, and young people.
(Rate per 100,000)
Males (54.5/100,000) were 2.1 times likely to drown than females (25.6/100,000)
Participating at unfamiliar locations
Inexperience with activity 6.1% Lack of safety equipment including lifejacket use
2.0% Consumption of alcohol (BAC >0.05) 2.0% Injury
There were 402 drowning incidents recorded in the Perth Metropolitan - South region
Overall, 5.0% of people who drowned were Aboriginal , with Aboriginal Australians (17.1/100,000) 2.9 times more likely to drown than non-Aboriginal Australians (5.9/100,000).
Tourists and/or visitors to the area were involved in 15.0% of fatal drowning incidents, which is significantly lower than the state average (31.8%).
Rescue Attempted (67.5%) CPR performed (53.8%)
Av. length of hospital stay (non-fatal) 2.7 days
Males (84.0/100,000) were 2.8 times more likely to drown than females (30.6/100,000)
July 2013 to June 2023
There were 38 drowning incidents recorded in the Goldfields region
There
Males (98.4/100,000) were 3.3 times more likely to drown than females (30.1/100,000)
Overall, 10.5% of people who drowned were Aboriginal , with drowning rates similar for both Aboriginal Australians (6.4/100,000) and non-Aboriginal Australians (7.1/100,000).
Tourists and/or visitors to the area were involved in 56.3% of fatal drowning incidents, which is higher than the state average (31.8%).
Rescue Attempted (81.3%) CPR performed (31.3%)
Av. length of hospital stay (non-fatal) 3.3 days
93.8% Remoteness of location 68.8% Environmental factors such as poor weather/water conditions 31.3% Participating at unfamiliar locations
Participating alone 31.3% Consumption of alcohol (BAC >0.05)
Of these, all were from a non-English speaking background
Drowning risk was greatest amongst toddlers, older adults, and young people.
(Rate per 100,000)
Poor swimming ability
Medical condition 18.8% Low socio-economic status 12.5% Lack of safety equipment including lifejacket use 12.5% Inexperience with activity
12.5% Flood-related
There were 45 drowning incidents recorded in the Great Southern region
There
Males (95.7/100,000) were 2.2 times more likely to drown than females (43.2/100,000)
There were no drowning incidents involving Aboriginal Australians recorded in the Great Southern region.
Drowning risk was greatest amongst toddlers, adults and young people (Rate per 100,000)
Tourists and/or visitors to the area were involved in 52.4% of fatal drowning incidents, which is higher than the state average (31.8%).
Rescue Attempted (61.9%) CPR performed (28.6%)
Av. length of hospital stay (non-fatal) 5.1 days
Participating at unfamiliar locations
Participating alone
Consumption of alcohol (BAC >0.05)
Poor swimming ability
Low socio-economic status
Inexperience with activity
Remoteness of location
There were 51 drowning incidents recorded in the Kimberley region
There
Males (190.2.0/100,000) were 2.7 times more likely to drown than females (70.7/100,000)
Overall, 45.1% of people who drowned were Aboriginal , with Aboriginal Australians 1.2 times more likely to be involved in a drowning incident (14.6/100,000) than non-Aboriginal Australians (12.0/100,000).
Tourists and/or visitors to the area were involved in 40.0% of fatal drowning incidents, which is higher than the state average (31.8%).
Av. length of hospital stay (non-fatal) 1.0 days Rescue Attempted (50.0%) CPR performed (25.0%)
Drowning risk was greatest amongst toddlers, adults, and children (Rate per 100,000)
100.0% Remoteness of location
Low socio-economic status
Environmental factors such as poor weather/water conditions
Consumption of alcohol (BAC >0.05)
Participating alone
Medical condition
Flood-related
Injury
Poor swimming ability
Lack of safety equipment including lifejacket use 5.0% Lack of supervision
5.0% Participating at unfamiliar locations
There were 86 drowning incidents recorded in the Midwest region
There
Males (189.4/100,000) were 3.2 times more likely to drown than females (60.2/100,000)
were born in Australia
Overall, 11.6% of people who drowned were Aboriginal , with drowning rates similar for both Aboriginal Australians (12.1/100,000) and non-Aboriginal Australians (13.0/100,000).
Tourists and/or visitors to the area were involved in 52.5% of fatal drowning incidents, which is higher than the state average (31.8%).
Rescue Attempted (57.5%) CPR performed (52.5%)
Av. length of hospital stay (non-fatal) 1.5 days
Remoteness of location
Environmental factors such as poor weather/water conditions
Medical condition
Low socio-economic status
Participating at unfamiliar locations
Participating alone
were from a
Drowning risk was greatest amongst toddlers, older adults, and young people (Rate per 100,000)
Lack of safety equipment including lifejacket use
Injury
Inexperience with activity
Poor swimming ability
Consumption of alcohol (BAC >0.05) 2.5% Lack of supervision
2.5% Faulty or absent barrier
There were 54 drowning incidents recorded in the Pilbara region
There
Males (106.2/100,000) were 1.4 times more likely to drown than females (74.1/100,000)
Overall, 20.4% of people who drowned were Aboriginal , with Aboriginal Australians 1.7 times more likely to be involved in a drowning incident (13.1/100,000) than nonAboriginal Australians (7.6/100,000).
Tourists and/or visitors to the area were involved in 70.6% of fatal drowning incidents, which is more than double the state average (31.8%).
Rescue Attempted (41.2%) CPR performed (35.3%)
Av. length of hospital stay (non-fatal)
Drowning risk was greatest amongst toddlers, young people, and children (Rate per 100,000)
Remoteness of location
Environmental factors such as poor weather/water conditions
Participating at unfamiliar locations
Low socio-economic status
Lack of safety equipment including lifejacket use 23.5% Participating alone
Participating alone
Consumption of alcohol (BAC >0.05)
Poor swimming ability
Inexperience with activity
Faulty or absent barrier
There were 137 drowning incidents recorded in the South West region
There
Males (105.9/100,000) were 3.1 times more likely to drown than females (34.7/100,000)
Overall, 3.7% of people who drowned were Aboriginal , with Aboriginal Australians 1.7 times more likely to be involved in a drowning incident (12.3/100,000) than nonAboriginal Australians (7.4/100,000).
Tourists and/or visitors to the area were involved in 53.5% of fatal drowning incidents, which is higher than the state average (31.8%).
Drowning risk was greatest amongst toddlers, adults, and young people (Rate per 100,000)
There were 39 drowning incidents recorded in the Wheatbelt region
Males (66.7/100,000) were 2.1 times more likely to drown than females (31.6/100,000)
Overall, 5.1% of people who drowned were Aboriginal , with Aboriginal Australians 1.2 times more likely to be involved in a drowning incident (5.9/100,000) than nonAboriginal Australians (5.0/100,000).
Tourists and/or visitors to the area were involved in 66.7% of fatal drowning incidents, which is more than double the state average (31.8%).
Drowning risk was greatest amongst toddlers, young people, and older adults (Rate per 100,000)