Drowning in Rivers, Creeks, Lakes and Dams


A 10-year analysis: 2011/12 to 2020/21

Royal Life Saving is focused on reducing drowning and promoting healthy, active and skilled communities through innovative, reliable, evidence-based advocacy; strong and effective partnerships; quality programs, products and services; underpinned by a cohesive and sustainable national organisation.
Royal Life Saving is a public benevolent institution (PBI) dedicated to reducing drowning and turning everyday people into everyday community lifesavers. We achieve this through: advocacy, education, training, health promotion, aquatic risk management, community development, research, sport, leadership and participation and international networks.
© 2023 Royal Life Saving Society – Australia
This publication is copyright. Except as expressly provided in the Copyright Act 1968 and the Copyright Amendment Act 2006, no part of this publication may be reproduced, stored in any retrieval system or transmitted by any means (including electronic, mechanical, microcopying, photocopying, recording or otherwise) without prior permission from Royal Life Saving Society – Australia. For enquiries concerning reproduction, contact RLSSA on: Phone 02 8217 3111 or email: info@rlssa.org.au.
Every attempt has been made to trace and acknowledge copyright, but in some cases, this may not have been possible. Royal Life Saving apologises for any accidental infringements and would welcome any information to redress the situation.
Printed copies of this document are available upon request. Please contact:
PO Box 558 Broadway
NSW 2007 Australia
Phone: 02 8217 3111
Email: info@rlssa.org.au
The drowning prevention research of the Royal Life Saving Society – Australia is proudly supported by the Australian Government:


Suggested Citation:
Pidgeon, S. (2023) Drowning in Rivers, Creeks, Lakes and Dams: A 10-year analysis 2011/12 to 2020/21. Royal Life Saving – Australia. Sydney, Australia.
ABOUT ROYAL LIFE SAVING RoyalLifeSaving.com.au OUR
VISION
A water-loving nation free from drowning.


Executive Summary 6 Background 6 Aims 9 Results 10 State Profiles 34 Key Insights 44 Recommendations 48 Conclusion 50 Methods 50 References 52 CONTENTS ACKNOWLEDGEMENT OF COUNTRY Royal Life Saving Society – Australia acknowledges the Traditional Owners of our national office in Ultimo, Sydney are the Gadigal people of the Eora nation. We pay our respects to Australia’s First Nations cultural and spiritual connections to water, and acknowledge the land where we work, live, and play always was and always will be Aboriginal land.
PEOPLE DROWNED IN RIVERS, CREEKS, LAKES AND DAMS
35 - 44 years
12% 45 - 54 years
25 – 34 years 40% drowned within 0 - 20km of where they lived
4
2011/12 TO 2020/21 924 Distance travelled
34% of all
92 people every year 80% of all drowning deaths were males Top age groups Where
73%
river/creek
27%
lake/dam 5%
national
RIVERS, CREEK, LAKES AND DAMS SNAPSHOT
drowning deaths in Australia
18%
14%
parks/state conservation areas
5 When Top inland locations for drowning Activity 39% Summer 22% Swimming & recreating 44% Afternoon 19% Fall into water 32% During school holidays 7% During public holidays 17% Boating & watercraft 8% Flood-related Western Australia South Australia Queensland Victoria Tasmania New South Wales Northern Territory Australian Capital Territory Goulburn River Murrumbidgee River Brisbane River Ross River Clarence River Hawkesbury River Lake Macquarie St Georges Basin Lake Eildon Lake Macquarie Parramatta River Nepean River Swan River Murray River Yarra River
This report presents an update on the two previous reports that Royal Life Saving has published on drowning deaths in rivers and creeks [1], lakes and dams [2]. Rivers, creeks, lakes and dams are a focus area of the Australian Water Safety Strategy 2030 [3], with the goal to reduce drowning deaths by half in these locations by 2030.
This analysis reported more than a third of drowning deaths occur in rivers, creeks, lakes and dams (hereafter referred to as ‘inland’ waterways), and overall, 25% of total drowning deaths occured in rivers/creeks, continuing to be the leading location for drowning in Australia.
The fatal drowning rate across all inland locations has remained steady at 0.4 per 100,000 population, accounting for 94 deaths each year. Key populations that are drowning at inland waterways include males aged between 25 and 44 years, and people born overseas.
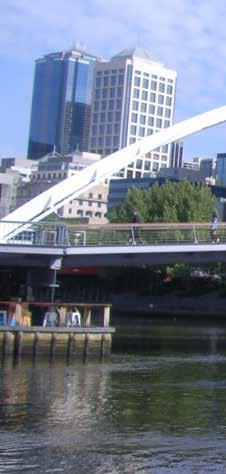
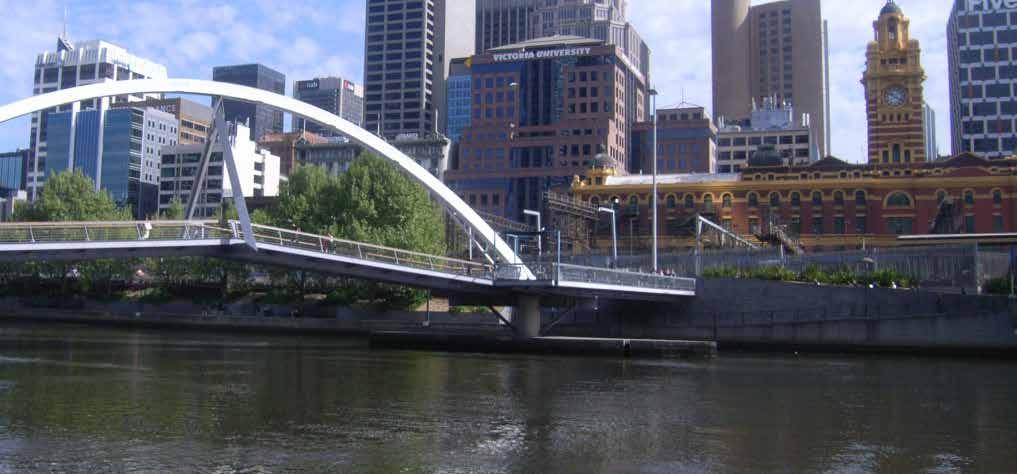
The top 10 river drowning blackspots across Australia have not changed drastically over this ten-year period. The Murray River remains the leading river blackspot for drowning across New South Wales (NSW), Victoria (VIC) and South Australia (SA), with the Yarra River in Melbourne (VIC), Hawkesbury River in Sydney (NSW), the Murrumbidgee River in ACT and the Swan River in Perth, Western Australia (WA) accounting for the top five deadliest rivers in Australia. The top three lakes/dams for drowning include Lake Eildon in VIC, Lake Macquarie and St Georges Basin in NSW.
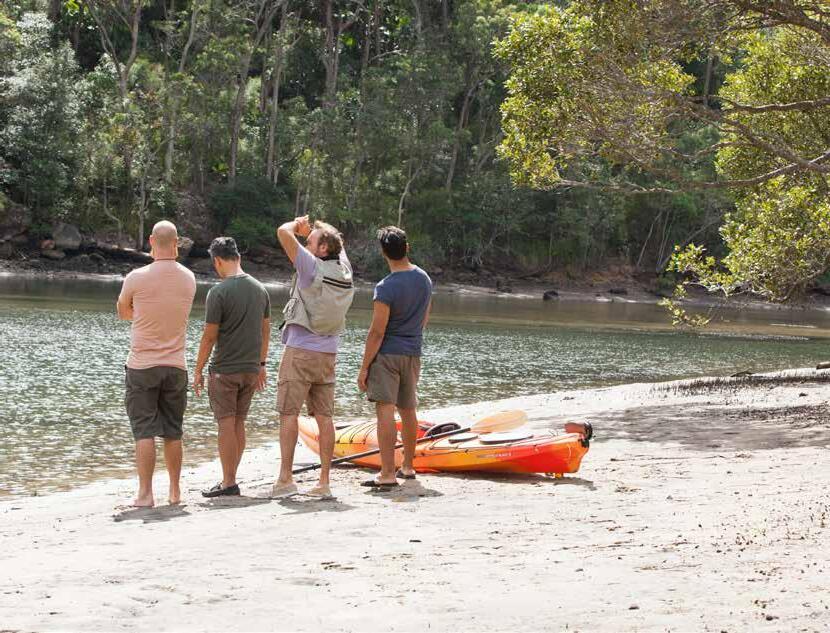
Visitation data has provided new insights into frequency and exposure of people attending inland waterway locations around the country. This information allows better targeting of prevention strategies to the people who actually go to those locations, including both locals and domestic visitors. On average, people spend about two hours at an inland waterway. While the highest number of people who drowned at inland waterways live within 20km, 21% were visitors who had travelled 100km or more, indicating there is a need to increase awareness and promotion of safety in, on and around inland water among both travellers and locals alike. Sadly, 9% of people drowned at their place of residence, most frequently among young children and people aged 65+ years due to an unintentional fall into water.
School holidays, especially in the summer, were a prime time for drowning among both children and adults (32% overall, 54% during the summer) and a further 7% occurred on public holidays (including long weekends). This indicates an increased risk when people are off school and work, and may be away on holiday with family and friends.
Fifty-eight per cent of drowning at inland waterways occurred in locations classified as inner and outer regional area, with a further 12% in remote and very remote locations. Royal Life Saving research has found that drowning rates in regional and remote locations are higher than in major city locations [3, 4]. This study reported that 5% of inland waterway drowning was recorded to have occurred in National Parks / State Conversation areas and a further 5% drowned at a waterfall or swimming hole. These locations are often in more isolated and remote locations that may be difficult to raise the alarm and take longer for emergency services to get to due to mobile reception and accessibility.
This study has provided a current analysis of inland waterways, including rivers, creeks, lakes and dams which have been reported on separately in the past. While much has been done in the past 10 years to increase knowledge, awareness and prevention efforts around rivers specifically, the overall rates of drowning at inland waterways have not changed. This report has identified new themes including visitor profiles, specific locations (e.g., national parks and waterfalls) and summer drowning trends.
It is hoped that the findings from this report will enhance existing drowning prevention initiatives and identify any new areas or risk factors to better target drowning prevention strategies and partnerships focusing on reducing inland waterways by half by 2030.
6
EXECUTIVE SUMMARY
Royal Life Saving’s first report exploring drowning deaths in rivers was published in 2014, presenting a 10-year analysis (2002/03 – 2011/12) of drowning deaths that occurred in rivers and creeks [1, 5]. This provided the first comprehensive analysis of river drowning identifying the burden of drowning relative to other aquatic locations, who drowns in rivers, where river drownings occur, and other key risk factors such as alcohol and flooding.
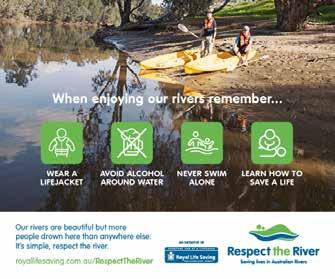
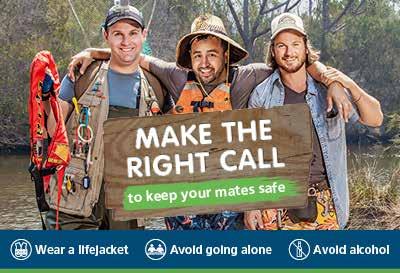
This report was the catalyst for a body of research exploring fatal drowning and drowning risk in river locations led by Dr Amy Peden as part of a PhD partnership between Royal Life Saving and James Cook University [6]. This research informed the development of a national river drowning prevention campaign ‘Respect the River’ and underpinned subsequent inland waterway safety campaigns, in particular targeting males and risk-taking behaviour (such as Make The Right Call).
Informed by this research, inland waterways, specifically rivers, were included as a priority area for reducing drowning in the Australian Water Safety Strategy 2016-2020 [7], a 34% decrease was reported in 2019 against the baseline [8]. Despite this reduction, rivers and inland waterways remain a target location for drowning prevention. The Australian Water Safety Strategy 2030 identifies priority areas for reducing drowning, with rivers and lakes included as one of the 15 focus areas to target as part of drowning prevention efforts by 2030 [3].
While rivers and creeks had been examined, a gap was identified in knowledge of drowning in lakes and dams, as the other key inland waterway locations where people drown. A report published by Royal Life Saving in 2020 focused on lakes and dams (2008/09 to 2017/18), reported the highest rates of drowning in lakes and dams occurred among young children (0 – 4 years) and people living in remote and very remote locations [2].
A subsequent journal article was published comparing the differences in drowning profile between river and lakes [9]. Key differences were found including: children were more likely to drown in a lake or dam, compared to adults; drowning deaths in lakes and dams occurred most frequently in the morning, compared to a higher number of deaths in the evening at rivers; and a higher proportion of alcohol-related deaths were reported in rivers compared to lakes
Yarra River, Melbourne CBD, Victoria 7
BACKGROUND
Australian Water Safety Strategy 2016-2020: focus area on reducing drowning in rivers
Body of research commenced on River drowning - Dr Amy
Recommendations for river drowning prevention strategiesPhD study
Make the Right Call campaign
Breathalysing and visitation study at four river locationsPhD study
34% decrease in drowning deaths in rivers reported
Lakes and dams drowning report and published paper
Australian Water Safety Strategy 2030: priority area rivers & lakes
Timeline of research, policy and advocacy focusing on inland waterways 2014-2022
What we have learnt
Rivers as a single location (as opposed to other locations) are the leading contributor to Australia’s unintentional fatal drowning burden. Being male, consuming alcohol, flooding and living outside of major cities were identified as contributing factors for drowning in rivers.
Rivers and lakes have different age and activity risk profiles for drowning.
Risk of drowning is significantly elevated for both lakes and rivers in very remote areas, when compared to major cities.
Both males and females are attending inland waterways and consuming alcohol, however research suggests that females are more risk averse and may not enter the water as frequently as males [10].
8
First RLSSA Report on drowning in rivers
Launch of Respect the River nationwide campaign
Peden PhD
2014 2015 2016 2016 2017 2018 2018 2019 2020 2022 2021 2021 2021
Inland waterway guidelines V1 released by RLSSA
Australian Policy and Case Law for Public Safety in Inland Waterways report
Geography
The top 10 longest rivers in Australia make up over 12,000km of waterways [11]
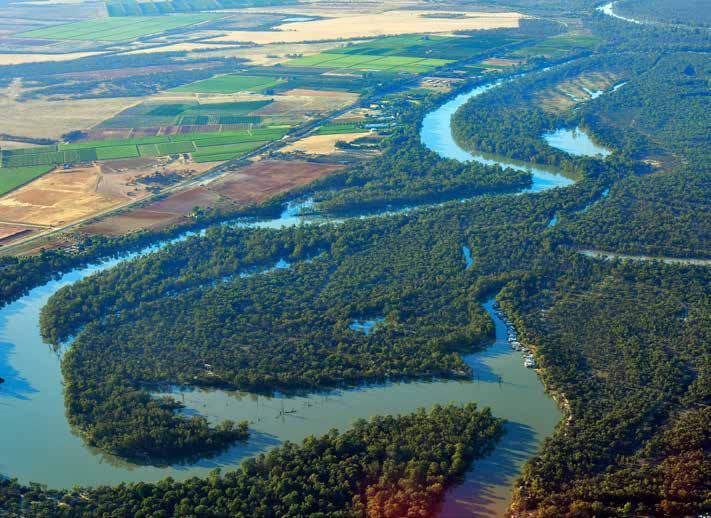
The Murray-Darling River Basin (Murray River and the Darling River) is the longest continuous river system in Australia covering more than one million square kilometres, or about 14 per cent of Australia, flowing down most of the east-coast of Australia [12].
AIMS
The aims of this study were to:
Provide an update on fatal drowning occurring in both rivers and lakes across Australia
Identify new trends for drowning at inland waterway locations Provide recommendations for drowning prevention across research, policy and advocacy aligning to the Australian Water Safety Strategy 2030
9
Murray River
RESULTS
2726 people fatally drowned in Australia between 2011/12 –2020/21
34% or 924 people drowned at an inland waterway
On average, 92 people drown at an inland waterway every year.
The highest number was recorded in 2013/14 (n=105) and the lowest number in 2019/20 (n=79), however this was followed by the second highest recorded in 2020/21 (n=104). Drowning rates for rivers and lakes have remained steady over the past decade, at a crude rate of 0.4 deaths per 100,000 population.
10
Unintentional drowning deaths and crude drowning rates at inland waterway locations
Number of drowning deaths by location 2011/12
to 2020/2
155 559 248 413 676 226 351 98
Bathtub / Spa Bath Beach Lake / Dam Ocean / Harbour Rivers Rocks Swimming Pool Other
99 93 105 92 83 100 80 89 79 104 0.4 0.4 0.4 0.4 0.3 0.4 0.3 0.4 0.3 0.4 2011/ 2012 2012/ 2013 2013/ 2014 2014/ 2015 2015/ 2016 2016/ 2017 2017/ 2018 2018/ 2019 2019/ 2020 2020/ 2021 N Crude drowning
rate per 100,000 population.
11
Breakdown of inland drowning deaths by waterway type
Lake / Dam 27% River / Creek 73% 24 25 24 25 21 29 20 22 31 27 75 68 81 67 62 71 60 67 48 77 2011/2012 2012/2013 2013/2014 2014/2015 2015/2016 2016/2017 2017/2018 2018/2019 2019/2020 2020/2021 La ke /D a m Ri ver s
Number of drowning deaths by waterway type and financial year 2011/12 to 2020/21
WHO IS DROWNING
Drowning deaths at inland waterways by age group 2011/12 to 2020/21
81% of all drowning deaths in inland waterways were males 12%
90%
80%
70%
60%
50%
40%
30%
20%
18% 14% 12% 11% 11% 10% 0-4 Years 5-9 Years 10-17 Years 18-24 Years 25-34 Years 35-44 Years 45-54 Years 55-64 Years 65-74 Years 75+ Years 0%
100% 0-4 Years 5-9 Years 10-14 Years 15-17 Years 18-24 Years 25-34 Years 35-44 Years 45-54 Years 55-64 Years 65-74 Years Male Female
10%
12
Drowning deaths at inland waterways by age group and sex 5% 4% 4%
13 Drowning deaths at inland waterways by country of birth Country of birth Born overseas 27% Unknown 11% Born in Australia 62% 8% were known to be Aboriginal or Torres Strait Islander 27% were born overseas 11% country of birth was unknown
Child drowning at inland waterways
110 children aged 0 - 17 years drowned at inland waterways. On average, 11 children drown at an inland waterway every year.
More females than males drowned among children aged 0 - 14 years when compared to all other age groups.
Drowning among children under five most commonly occurred due to an unintentional fall, compared to older children who were swimming and recreating.

Children 0 – 4 years
drowned in a dam
drowned within the home environment
drowned within 5km from home
were due to a fall into water
14
IN FOCUS
Child drowning at inland waterways by age group and type of waterway
50% 35% 31%
86%
61% 55% 33% 39% 45% 67% 0 - 4 Years 5 - 9 Years 10 - 17 Years Lake
/ Dam River / Creek
Child drowning at inland waterways by age group and activity being undertaken prior to drowning
Children aged 0 - 9 years were more likely to drown in a lake or dam than older children aged 10 - 17 years who were more likely to drown in a river or creek.

15
0% 10% 20% 30% 40% 50% 60% 70% 80% 90% 100% 0 - 4
5 - 9
10
years
years
- 17 years
Boating & watercraft Fall Fishing Jumped In Non-aquatic Transport Swimming and Recreating
WHEN AND WHERE DO PEOPLE DROWN?
Drowning in rivers and lakes most commonly occurred
39% in Summer 15% January / 14% December
21% on a Sunday 44% in the afternoon
There were no differences in season, month, day or time of drowning when analysed by location.
Drowning deaths at inland waterways by season
Holidays
7% of drowning deaths were recorded to have occurred on public holidays, which also included public holiday long weekends.
32% of drowning deaths were recorded to have occurred during the school holiday period (both adults and children)
34% of drowning deaths among children aged 5 – 17 years occurred during a school holiday period for their state of residence.
Drowning deaths at inland waterways by month
16 15% 10% 9% 6% 6% 5% 6% 6% 7% 7% 8% 14% Jan Feb March April May June July Aug Sep Oct Nov Dec
Summer 39% Autumn 21% Winter 17% Spring 23%
17 Drowning deaths at inland waterways by time of the day Drowning deaths at inland waterways by day of the week 11% 13% 11% 12% 17% 16% 21% Monday Tuesday Wednesday Thursday Friday Saturday Sunday Early Morning (12:01am to 6am) 9% Morning (6:01am to 12pm) 20% Afternoon (12:01pm to 6pm) 44% Evening (6:01pm to 12am) 24% Unknown 3%
Summer drowning at inland waterways
55% occurred during the school holidays
10% occurred on public holidays
49% occurred in the afternoon
32% occurred when swimming and recreating, more than any other time of the year
33% of people were 50km or further away from home when they drowned, people are more likely to travel further in the summer time
There was no difference in time of drowning or alcohol involvement during the summer when compared with other times of the year
Drowning at inland waterways most commonly occurred during summer, consistent with general drowning trends.
81% were male
21% 25 – 34 years
32% were of people born overseas
18
IN FOCUS
Drowning deaths at inland waterways during the summer by age group
5% 5% 3% 14% 21% 13% 13% 9% 11% 6% 0-4 Years 5-9 Years 10-17 Years 18-24 Years 25-34 Years 35-44 Years 45-54 Years 55-64 Years 65-74 Years 75+ years
Drowning deaths at inland waterways during the summer by distance travelled from home (km)
Drowning deaths at inland waterways during the summer by time travelled from home (minutes)
19
7% 48% 11% 12% 22% 9% 52% 13% 5% 20% At home 0 - 20km 21 - 50km 51 - 100km 100km+ Summer - yes Summer - no Summer - yes Summer - no 7% 38% 17% 8% 29% 9% 44% 13% 11% 23% At home 1 - 15 mins 16 - 30mins 31-60 mins More than 1 hour
WHERE ARE PEOPLE DROWNING?
Remoteness of drowning location
The largest proportion of drowning deaths at inland waterways occurred at locations classified as inner regional (32%) followed by major cities (30%) but the highest drowning rates were recorded in very remote and remote locations.
30% 32% 26% 7% 5%
0.16 0.67 1.21 3.21 1.51
Major cities Inner regional Outer regional Remote Very remote
Drowning deaths at inland waterways by waterway and remoteness classification
occurred in National Parks / State Conservation Areas 32% 24% 28%
occurred at waterfalls or swimming holes 42% 27% 26% 5% 4% 8% 4% River / Creek Lake / Dam Major Cities Inner Regional Outer Regional Remote Very Remote
Specific Locations
20
Drowning rates by 100,000 population by remoteness classification
9% 5% 5% drowned at their residential location (at home)
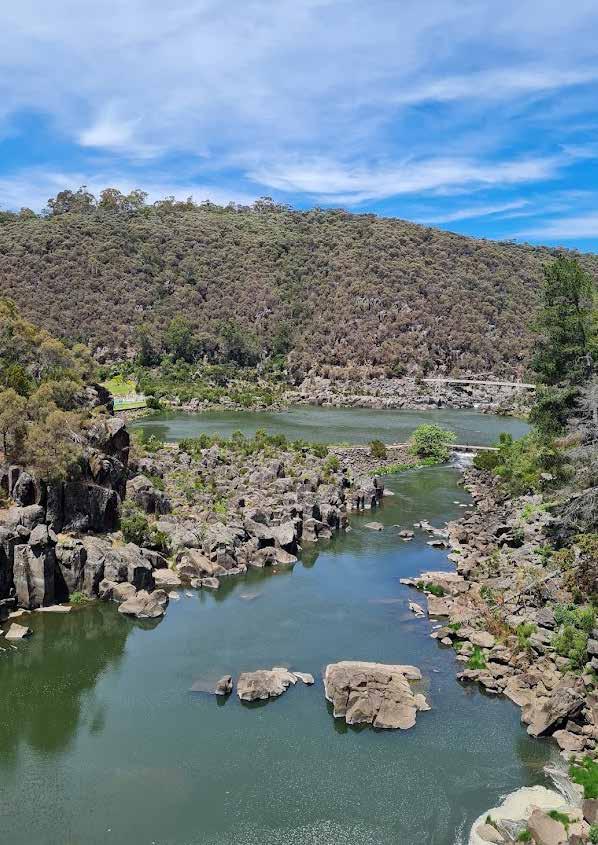 Cataract Dam, Launceston, Tasmania
Visitor Status
31%
How far are people from home to their location of drowning

29%
Drowning deaths at inland waterways by distance travelled from home (all year around)
occurred 50 km or further from where they lived 9%
travelled 1 hour or more to get to the location 31% 9% 11% 7% 6% 8%
15% 6% At home 0 - 5km 6 - 10km 11 - 20km 21 - 30km 31 - 50km 51 - 100km 100km+Intrastate 100km+Interstate 18%
Drowning deaths by type of inland waterways and distance travelled from home (all year around)
28% 5%
18% 6% 5%
12% 6% 5% 4%
32% 11% 10% 7% 6% 9% 13% 6% At home 0 - 5km 6 - 10km 11 - 20km 21 - 30km 31 - 50km 51 - 100km 100km+ Intrastate 100km+ Interstate Lake / Dam River / Creek
22
IN
FOCUS
25% occurred within 0 – 5 km of where they lived
What do we know about the people going to inland waterways?
Who is attending?
Most people who go to inland waterways are aged between 25 and 54 years
28% are born overseas
Where do they travel from?
The highest number of visitors to inland waterways were people who travelled 100km or more from where they lived.
Locals were most likely to visit inland waterways on a weekday compared to other visitors There was no difference when broken down by season
When
Summer is the peak time (January recorded the highest number of people visiting)
2 hours on average spent at an inland waterway
Most common time is in the afternoon (12pm - 6pm)
People spend longer at an inland waterway location during the summer
Attendance to inland waterways increased over 2021/22 after the lifting of COVID-19 travel restrictions in 2020 and 2021.
What do they do?
Swimming / Jogging / Cycling / Fishing

23
IN FOCUS Local (0-10km from home) 23% Commuters (11-40km) 18% Day Trippers (41-100km) 25% Travellers (100km+) 34%
01 November 2019 to 31 December 2022 [13]
Visitation data sourced from Roy Morgan People Movement Dashboards between
Snapshot of Visitation trends in and around selected Inland Waterways 01-October-2019 and 31-December-2022
Activity being undertaken at inland waterways prior to drowning
No differences were found when analysed by activity and location, however differences in drowning location and activity were found by age group.
24
BEING
ACTIVITY
UNDERTAKEN
Age Group Location Leading activity prior to drowning 0 - 4 years Lake / Dam Fall 5 -9 years Lake / Dam Swimming & Recreating 10 - 17 years River / Creek Swimming & Recreating 18 - 24 years River / Creek Swimming & Recreating 25 - 34
River / Creek Swimming & Recreating 35 - 44
River / Creek Swimming & Recreating 45
54
River / Creek Swimming & Recreating 55 - 64
River / Creek Fall 65
River / Creek Non-aquatic Transport 75+
River / Creek Fall
years
years
-
years
years
- 74 years
years
12% 19% 3% 3% 14% 4% 22% 17% 6%
Other Swimming
Unknown
Boating Fall Fishing Jumped In Non-aquatic Transport
and Recreating Watercraft
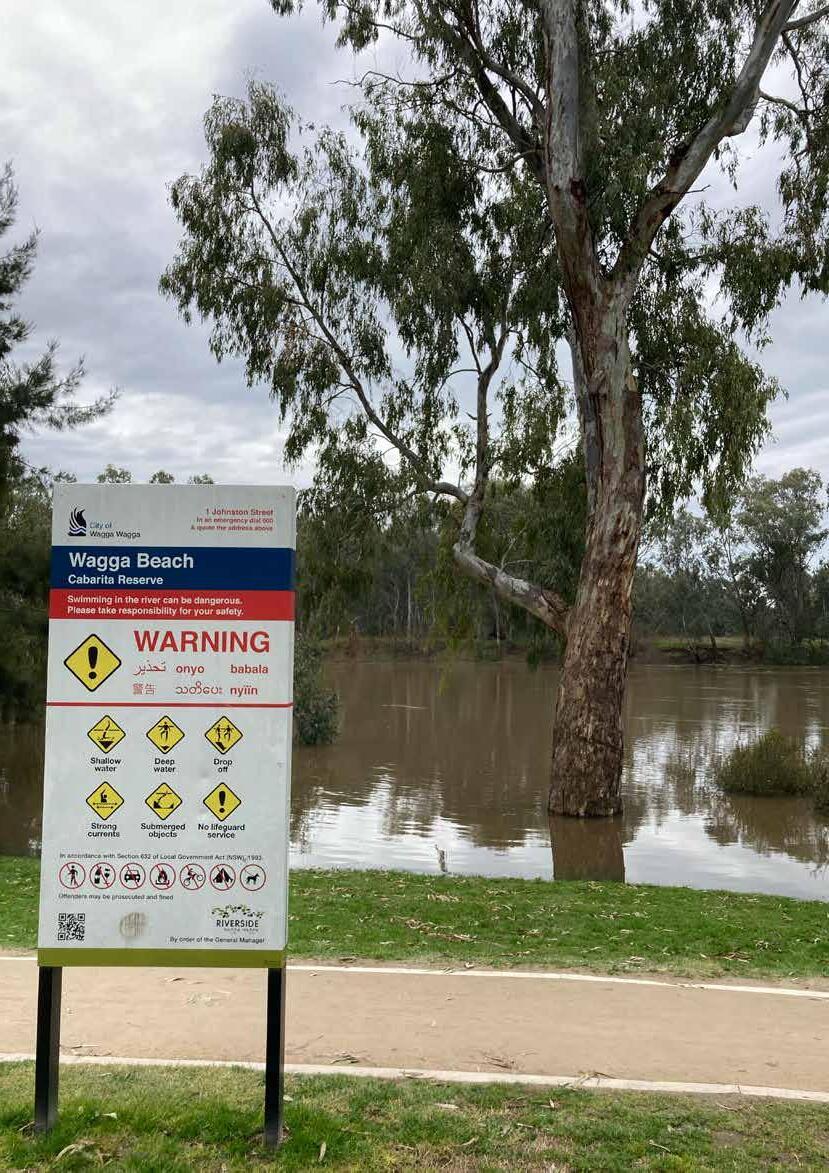 Wagga Beach, Murrumbidgee River
26% recorded a BAC ≥ 0.05% alcohol
People aged 45 – 54 years and 55 – 64 years recorded the highest proportion of deaths with a BAC ≥ 0.05% alcohol (30% each)
27% 15%
Alcohol Drugs
37% recorded drugs
medication illegal substances
Pre-existing medical condition


40% recorded a pre-existing medical condition
The majority of people who recorded a pre-existing medical condition were aged 65 years and over.
The most common medical conditions recorded were cardiac-related.
26 RISK FACTORS
Multiple Fatality Event
7% drowned in a multiple fatality incident
Flood-related
8% were flood-related
non-aquatic transport
64% 37%
occurred when using nonaquatic transport (e.g., car driving through floodwater)
boating
17% 21% 21%
swimming and recreating
occurred as a result of being swept away by flood-water
Swimming ability
Lifejackets
61 people who drowned while boating and watercraft, of which
18% swimming ability was recorded, of which people were thought to be


31% 34%
non-swimmer competent swimmer
16% 28% 8%
were recorded as wearing a lifejacket, with the majority being inflatable types that did not inflate
poor swimmer strong swimmer
27
TOP RIVER AND LAKE/DAM BLACKPOTS FOR DROWNING


River Rank Name of River State Total 1 Murray River NSW, VIC, SA 49 2 Yarra River VIC 27 3= Hawkesbury River NSW 21 3= Murrumbidgee River NSW, ACT 21 4 Swan River WA 19 5 Brisbane River QLD 17 6 Parramatta River NSW 12 7= Nepean River NSW 10 7= Ross River QLD 10 8= Clarence River NSW 8 8= Georges River NSW 8 8 = Goulburn River NSW 8 Name of Lake / Dam N State Lake Eildon 7 VIC Lake Macquarie 5 NSW St Georges Basin 5 NSW 28
Western Australia Northern Territory Swan
Murray River
Yarra River
Murrumbidgee River
Ross River
Goulburn River
Brisbane River
Clarence River
Lake Macquarie
Hawkesbury River
Lake Macquarie
Parramatta River
Nepean River
St Georges Basin
Lake Eildon
South Australia Queensland Victoria Tasmania New South Wales
Capital Territory
Australian
29
Murray River Drowning Deaths Over 10 Years (2011/12 To 2021/22)
The highest number of drowning deaths in the Murray River occurred in 2013/14, followed by a decreasing number in the following five years
The highest numbers of drowning deaths in five years were recorded in 2019/20 and 2020/21
The impact of COVID-19 and travel restrictions may have contributed to this increase
The ‘Respect the River’ national campaign was launched on the bank of the Murray River in Albury in October 2015 to increase public awareness of river safety.
Drowning deaths that have occurred in the Murray River 2011/12 to 2020/21

30
IN FOCUS
MURRAY RIVER: NUMBER ONE RIVER DROWNING BLACKSPOT IN AUSTRALIA
people have drowned in the Murray River over the past decade 5 4
49 9 6 2
4 2 3
7 7 2011/2012 2012/2013 2013/2014 2014/2015 2015/2016 2016/2017 2017/2018 2018/2019 2019/2020 2020/2021
Who is drowning in the Murray River?
92% of those who drowned were male
Age groups
31
Country of birth Born overseas 33% Born in Australia 63% Unknown 4% 2% 18% 20% 20% 10% 14% 10% 4% 5-9 Years 18-24 Years 25-34 Years 35-44 Years 45-54 Years 55-64 Years 65-74 Years 75+ Years
When
occurred when using boats or watercraft
Of which, 50% involved a fall from a houseboat
43% occurred during the school holidays
43% on a public holiday or public holiday long weekend
Risk Factors
59% involved alcohol
Of which, half recorded a BAC of ≥ 0.05%
29% recorded drugs present
Of which 50% recorded illicit drugs
32
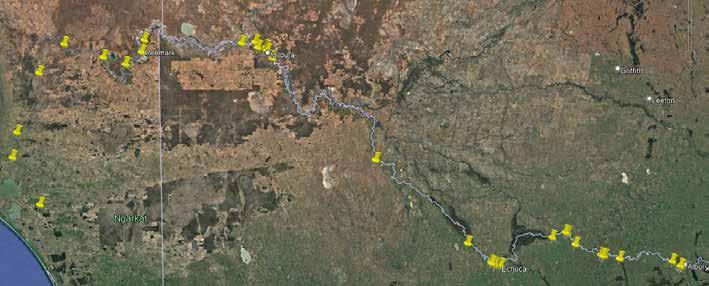
Drowning deaths along the Murray River 2011/12 to 2021/22
Activity
51% in the summer 39%
when swimming and recreating
51% in the afternoon (12:01pm to 6pm) 24%
20%
on a Saturday, followed by a Friday (18%)
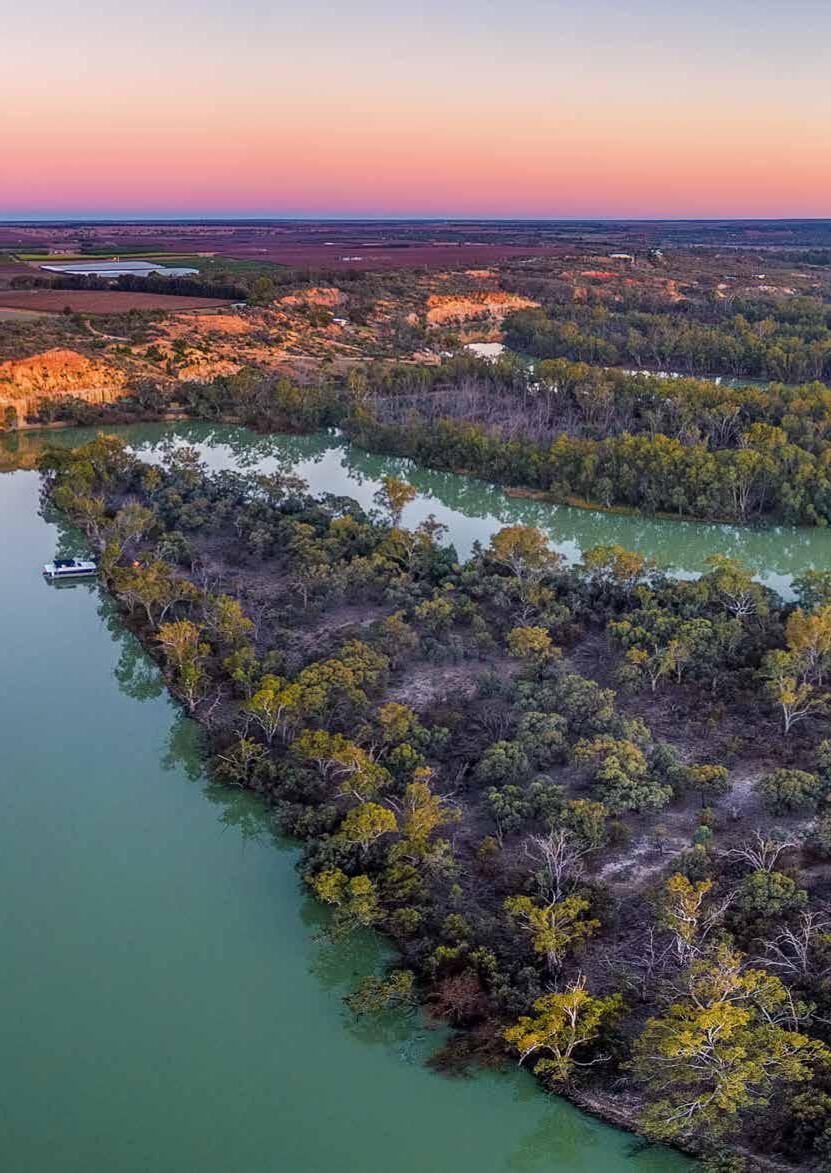 Murray River


34 STATE PROFILES WA 8% NT 4% ACT 2% SA 4% TAS 3% QLD 27% NSW 36% VIC 17%
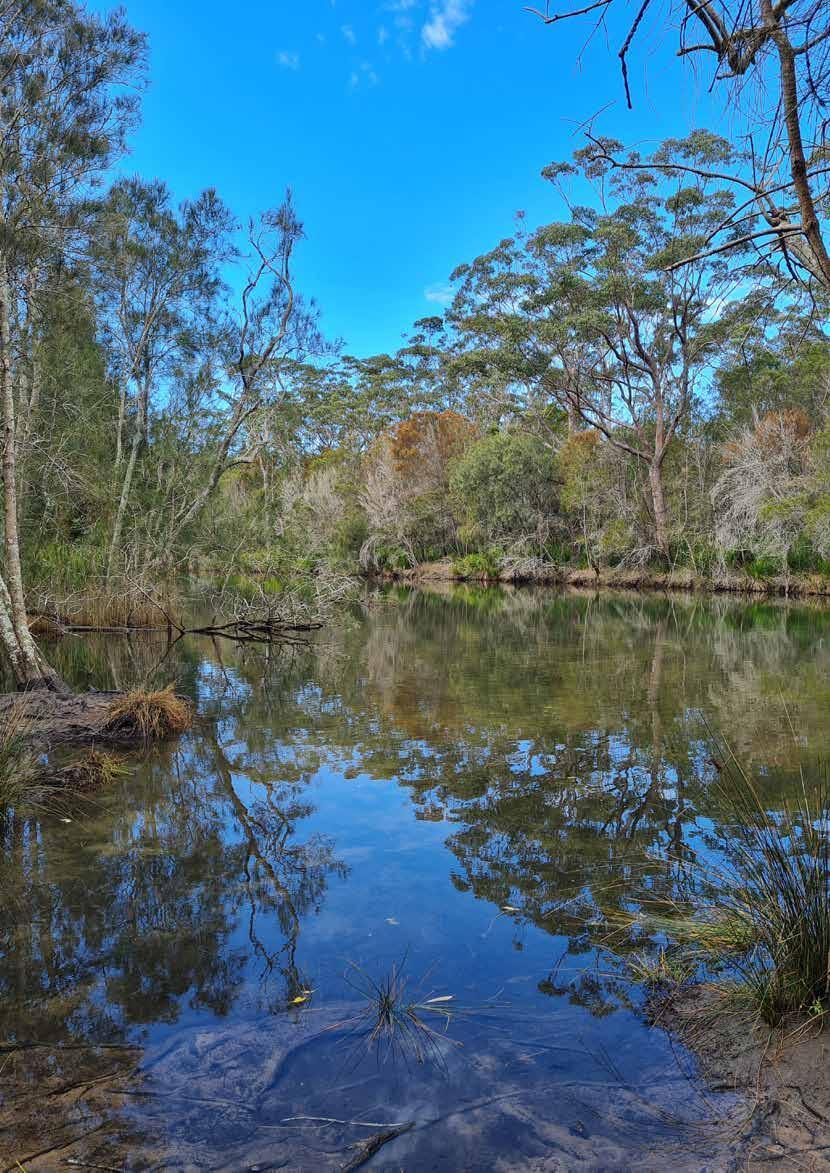 Deep Creek Reserve, Narrabeen, New South Wales
AUSTRALIAN CAPITAL TERRITORY
15 drowning deaths
63% of total drowning deaths in ACT
0.41 drowning deaths per 100,000
93% were male
of inland drowning deaths in ACT occurred in the Murrumbidgee River drowned 0 – 20km from where they lived
36
Inland waterway drowning
deaths in the ACT
0% 10% 20% 30% 40% 50% 60% 70% 80% 90% 100% 10-14 Years 18-24 Years 25-34 Years 35-44 Years 45-54 Years 55-64 Years 65-74 Years 75+ Years 7% 20% 13% 13% 27% 7% 7% 7% When Activity Location
locations 67% in the summer 54% Swimming & recreating
River
Key
73%
87% in the afternoon (12:01pm to 6pm) 22% Flood-related
Lake/Dam 33% on a Sunday 17% on a public holiday 58% during school holidays 53% occurred on the weekend 53% 67%
27%
333 drowning deaths
36% of total drowning deaths in NSW
0.47 drowning deaths per 100,000
82% were male
77%
4% were children aged 0-14 years
23% Lake/Dam
10% were children aged 0-14 years
Key locations
had travelled 100km or further to where they drowned
drowned 0 – 20km from where they lived
37
NEW SOUTH WALES 0-4 Years 18-24 Years 15-17 Years 5-9 Years 10-14 Years 25-34 Years 35-44 Years 45-54 Years 55-64 Years 65-74 Years 75+ Years 13% 2% 1% 2% 3% 17% 17% 13% 12% 10% 10%
Inland waterway drowning deaths in NSW
Location
When Activity
38% in the summer 21% Swimming & recreating
River
43% in the afternoon (12:01pm to 6pm) 17%
Fall into water
18% on a Sunday 5% on a public holiday 30% during school holidays 33% occurred on the weekend 25% 51%
38 drowning deaths
48% of total drowning deaths in NT
1.72 drowning deaths per 100,000
76% were male
82%
10%
38
drowning
NORTHERN TERRITORY 55% in the dry season (November – April) 40% Swimming & recreating
Inland waterway
deaths
in the NT
River
were children aged 0-14
years
100km or further to the
20km
50% in the afternoon (12:01pm to 6pm) 30% Flood-related 24% occurred in a national park 29% on a Friday 8% on a public holiday 34% during school holidays 34% occurred on the weekend 36% 32% 0-4 Years 18-24 Years 15-17 Years 5-9 Years 10-14 Years 25-34 Years 35-44 Years 45-54 Years 55-64 Years 65-74 Years 75+ Years 11% 5% 3% 3% 3% 29% 11% 11% 5% 5% 16% When Activity Location Key locations
had travelled
location where they drowned drowned 0 –
from where they lived
251 drowning deaths
39% of total drowning deaths
39
QLD
100,000
male Inland waterway drowning deaths in QLD
39% in the summer 24% Swimming & recreating
River
100km or further
where they
0 – 20km from where they
50% in the afternoon (12:01pm to 6pm) 24% Fall into water
Lake/Dam 12% on a Sunday 8% on a public holiday 29% during school holidays 39% occurred on the weekend 18% 44% 0-4 Years 18-24 Years 25-34 Years 35-44 Years 45-54 Years 55-64 Years 75+ Years 10% 3% 8%6% 18% 12% 12% 12% 9% 9% 15-17 Years 10-14 Years 1% 65-74 Years 5-9 Years
Location
in
0.57 drowning deaths per
80% were
QUEENSLAND
77%
had travelled
to
drowned drowned
lived
23%
When Activity
Key locations
40
in SA
deaths per 100,000
were male Inland waterway drowning deaths in SA
31% in the winter 22% Fall into water 67% River drowned within 5km from where they lived Murray River - Murray Bridge & River Torrens - Adelaide 58% in the afternoon (12:01pm to 6pm) 17% Swimming & recreating 33% Lake/Dam 25% on a Friday 6% on a public holiday 31% during school holidays 42% occurred on the weekend 48% #1 0-4 Years 18-24 Years 25-34 Years 35-44 Years 45-54 Years 55-64 Years 75+ Years 8% 11% 6% 25% 8% 11% 14% 17% 65-74 Years
Activity Location
36 drowning deaths 26% of total drowning deaths
0.23 drowning
92%
SOUTH AUSTRALIA
When
Key locations
26 drowning deaths
28% of total drowning deaths in TAS
0.55 drowning deaths per 100,000
Key locations
41
Inland waterway drowning deaths in TAS TASMANIA 42% in the winter 35% Boating & watercraft 77% River drowned with 5km from where they lived Derwent River & Tamar River 50% in the afternoon (12:01pm to 6pm) 23% Fall into water 23% Lake/Dam 23% on a Monday followed by 19% on a Friday 4% on a public holiday 19% during school holidays 65% #1 15-17 Years 18-24 Years 25-34 Years 35-44 Years 45-54 Years 55-64 Years 75+ Years 8% 19% 4% 12% 15% 19% 15% 8% 65-74 Years
Activity Location
85% were male
When
35% of total drowning deaths
in
42
VIC
100,000
male Inland waterway drowning deaths in VIC VICTORIA 21% Fall into water 60% River drowned within 0-20km from where they lived Yarra River, Melbourne 34% in the afternoon (12:01pm to 6pm) 18% Swimming & recreating 40% Lake/Dam 21% on a Sunday 8% on a public holiday 33% during school holidays 37% occurred on the weekend 59% #1 36% in the summer 0-4 Years 18-24 Years 15-17 Years 5-9 Years 10-14 Years 25-34 Years 35-44 Years 45-54 Years 55-64 Years 65-74 Years 75+ Years 11% 6% 3% 2% 1% 17% 12% 12% 8% 14% 14%
157 drowning deaths Location
0.28 drowning deaths per
80% were
When Activity
Key locations
74 drowning deaths
21% of total drowning deaths in WA
0.32 drowning deaths per 100,000
When Activity
43
Inland waterway drowning deaths in WA
24% Swimming & recreating
River
Blackwall Reach & Maylands 47% in the afternoon (12:01pm to 6pm) 21% Fall into water
Lake/Dam 28% on a Sunday followed by 19% on a Wednesday 5% on a public holiday 43% during school holidays 51% #1 54% in the summer 0-4 Years 18-24 Years 15-17 Years 5-9 Years 25-34 Years 35-44 Years 45-54 Years 55-64 Years 65-74 Years 75+ Years 9% 3% 5% 3% 23% 18% 14% 8% 8% 9%
78% were male
WESTERN AUSTRALIA
68%
drowned with 0 - 20km from where they lived Swan River Perth,
32%
Location
Key locations
This report provides an overview of current drowning trends at rivers, creeks, lakes and dams across Australia.
Inland waterways remain a leading location for drowning. Many people are unaware that inland waterways are a leading location for drowning deaths in Australia. Extensive research and improved data collection over the past decade has helped increase our understanding of the burden of drowning at inland waterways, risk factors and expsoure. This has helped to inform targeted prevention strategies, focused on men (high risk population), alcohol (key risk factor) and key locations based on the highest drowning numbers at certain waterways. More recently, studies on visitation trends [13, 14] have filled gaps on exposure information, for example who is visiting inland waterways, for how long and what they do when at inland waterways.
Overall
Inland waterways account for more than one third of total drowning deaths in Australia, with rivers the single leading location for drowning compared to other locations. The rate of drowning is 0.4 / 100,000 population, this equates to about 92 people each year drowning in an inland waterway. While rates have not increased, the rates have not substantially decreased either. Prevention efforts should continue in an effort to reduce these rates to achieve the Australian Water Safety Strategy goal of reducing drowning by half by 2030.
The impact of COVID-19 should be acknowledged. The 12 months between 01 June 2020 and 30 July 2021 showed an increase in drowning deaths (consistent with overall national drowning deaths for 2020/21) [15], particularly in rivers. This may be an impact of travel restrictions, meaning that more people were staying close to home and going to more isolated and remote locations away from crowds; swimming pools were closed, leading people to swim and recreate in other environments without supervision.
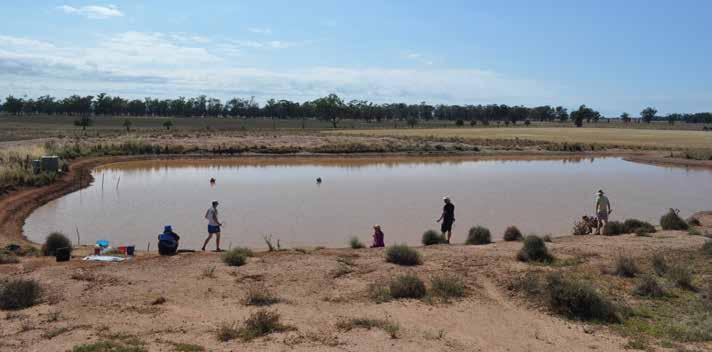
In contrast, the year prior, 2019/20, recorded the lowest number of drowning deaths in rivers (n=48) with the highest number of drowning in lakes and dams recorded (n=31), likely to be due to the high number of children drowning in dams. This reinforces the need for prevention efforts focusing on water safety on farms and rural properties to continue.
KEY INSIGHTS
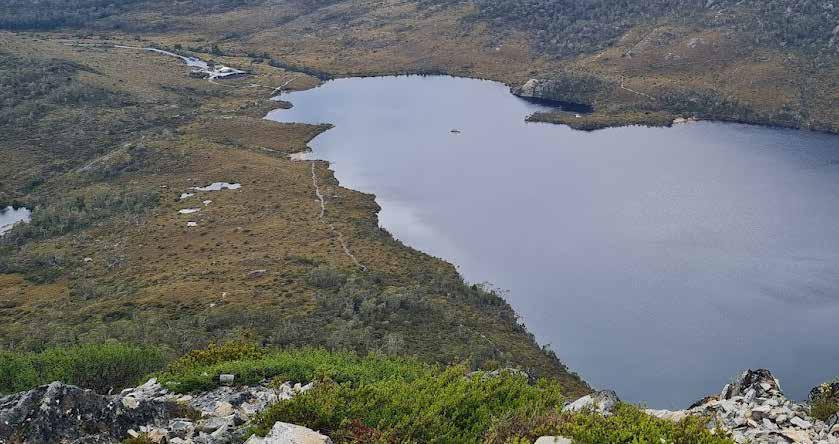
Dove Lake, Cradle Mountain, Tasmania
Demographics
Men continue to account for more than 80% of drowning deaths, consistent with general drowning trends, with those aged 25 to 44 years the most likely to drown at an inland waterway. However, key trends differed when analysed by age, sex and location.
Children and older people shared similar trends for drowning, although the contributing factors are likely to be different. Overall, children aged 0 - 4 years and people aged 75+ years were more likely to drown as a result of an unintentional fall into water, whereas most other age groups drowned when swimming or recreating.
Children aged 0 – 9 years were more likely to drown in a lake or dam than in a river, with a higher proportion of girls drowning compared to other locations and age groups. All other ages groups most commonly drowned in a river/creek.
Contributing factors for children drowning including lack of adequate supervision and unsupervised access to water, whereas older people were more likely to have a medical condition present, medication and/or alcohol, and be alone, reinforcing the need for tailored strategies targeting different demographics.
More than a quarter (27%) of people who drowned in an inland locations were adults who were born overseas and 8% identified as Aboriginal and Torres Strait Islander background. In the summer, people born overseas accounted for one-third of total deaths in the summer months.
A greater awareness of water safety and practical tips for swimming and recreating in and around rivers and lakes in Australia, with a specific focus before and during the
Where and when people drowned
Collectively, more than half of all drowning deaths at inland ways occurred at regional locations and a further 12% drowned at remote or very remote locations. Previous research has found that the rate of drowning increases in regional and remote locations [2, 4]. With more isolated locations which may have limited mobile phone reception, take longer to alert emergency services and may have limited accessibility.
Five per cent of drowning occurred within a National Park or State Conservation area, which are often in more isolated and remote locations, that can pose problems for raising the alarm (e.g., lack of mobile reception) and access for rescue personnel. A further 5% drowned in and around waterfalls and swimming holes, many are popular tourist destinations across Australia (of which some are situated in National Parks). Partnerships with water safety agencies, National Parks and Wildlife (or other land management agencies) and tourism boards may be needed to combat the issue of drowning at popular locations, in and around national parks such as waterfalls and swimming holes, particularly as both domestic and international visitors start to travel again post COVID-19.
One-fifth (21%) drowned 100km or further from where they lived or had travelled more than an hour to get to an inland waterway, indicating that people may be visiting areas that are unfamiliar or unknown to them. This applies particularly in summer when the most common visitors were those who had travelled 100km or more. This highlights an opportunity for water safety agencies, holiday accommodation providers and visitor centres to work together to raise awareness of inland waterway safety during peak times.
This analysis reported that people most commonly drowned within 20km of where they lived (51%), suggesting that some people may be relying on their experience, skills and familiarity of the environment to keep them safe around water.
The Murray River remains the leading river location for drowning, spanning the NSW and Victorian border, through to South Australia. An even higher proportion of males drowned in the Murray River (92%), with half occurring in the summer months and in the afternoon, and over 40% during the school holidays. This supports the need for targeted drowning prevention strategies at key locations along the Murray River and at key times. Alcohol and drugs (both medication and illegal substances) were found to be contributing factors for among people who drowned on the Murray River.
This report identified key drowning blackspots within each State and Territory that include both rivers and lakes that can help to better target drowning prevention and water safety strategies at the local level.
45
Summer drowning trends
Summer is the peak time for drowning at inland waterways, consistent with general drowning trends. Young people aged 25 – 34 years accounted for the highest proportion of drowning deaths in the summer, predominately males.
More than fifty percent of drowning in the summer months occurred in the school holidays and 10% on public holidays. Previous research has reported that drowning risk increases on public holidays when there are more people off work and school, and likely to have increased access and exposure to water bodies [16]. Surprisingly, alcohol presence did not differ in summer when compared to other times of the year. Water safety campaigns and programs should be delivered before and during the summer and other school holidays periods with public holidays, e.g., autumn school holidays when Easter and ANZAC school often fall.
Visitation to inland waterways
This report included information about the types of people attending key inland waterways around Australia, how far they are travelling, how long they are staying and what types of activities they are doing. Unsurprisingly, locals are most commonly attending these locations, however this does change in the summer months with more people travelling from over 100km away to attend these locations.
The average time spent at an inland location is two hours, most frequently in the afternoon, reflecting the most common time for drowning to occur. A number of drowning deaths occurred due to an unintentional fall into water. While people may not intend to go in the water at these locations, people always need to be vigilant around water, especially as young children can wander off unnoticed, or alcohol consumption may lead to risk-taking behaviour around water.
Risk factors
Some risk factors for drowning at inland waterways have stayed consistent, including alcohol consumption and not wearing a lifejacket, however new risk factors were identified including locations and activities. While some of these things accounted for a small proportion during this period, it is important to ensure that these issues do not become more common into the future.
Drowning deaths due to flooding and climate change are likely to become more common into the future. With eight percent of drowning deaths during the study period being flood-related, often due to driving through floodwater or being swept away, more can be done to work with local emergency services to promote flood safety messages in and around inland waterways. For older people, a pre-existing medical condition and medications were found to be key risk factors for drowning, particularly for those with cardiac conditions.
26% of drowning deaths at inland waterways recorded a BAC ≥ 0.05% alcohol, the highest proportion was recorded among people aged between 45 and 64 years. This indicates that older men may be undertaking more risky behaviour around water.
Multiple fatality events occurred when boating, swimming and driving non-aquatic transport, and included people of all ages from young children through to older adults. The majority of people who drowned when boating and using watercraft at inland waterways were not wearing a life jacket. National Parks, waterfalls and swimming holes were identified as locations for drowning risk, especially in regional and remote locations.
46
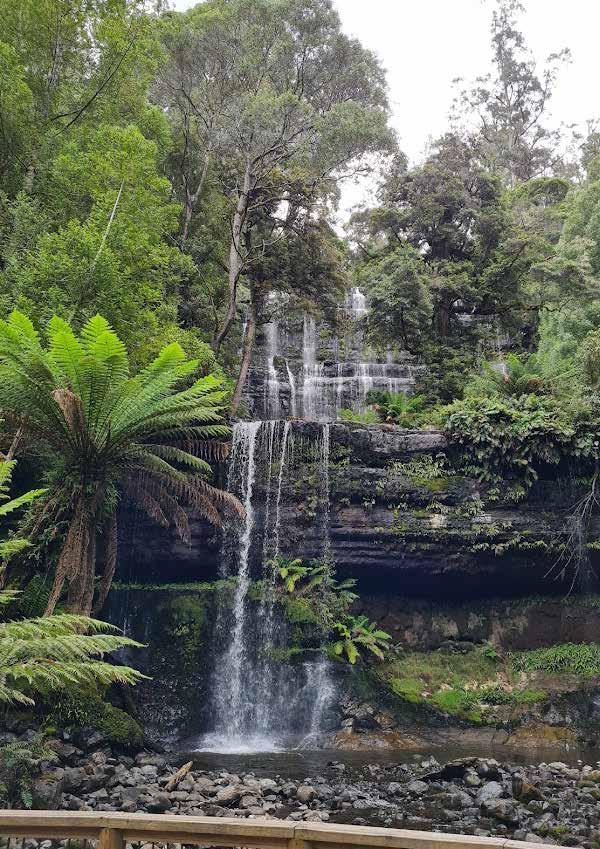 Mount Field National Park, Tasmania
RECOMMENDATIONS
Research
Evaluate the effectiveness of relevant campaigns, programs and services focused on drowning prevention at inland waterways
Conduct observational studies at inland waterways to increase exposure information and gain a better understanding of the number of people who attend popular locations
Pilot and evaluate the use of technology for drowning prevention at inland waterways, including but not limited to social media, locational QR codes, apps, push notifications, geofencing / geo-mapping
Pilot and evaluate the use of public-access rescue equipment at inland waterways
Evaluate the feasibility, effectiveness and sustainability of lifeguard based responses at high use or high risk inland waterways locations
Policy
Land and waterway owners and operators should work with water safety agencies, government at all levels and their agencies, as well as community stakeholders, to develop and implement strategies to reduce drowning and water-related injury, e.g. local water safety plans.
Adopt and implement inland water safety guidelines into current and future local government, land and waterway owners and operators (e.g. water and park authorities), water boards community safety plans, including emergency management plans
Implement and enforce of alcohol-free zones to prevent drowning around inland waterways
Enforce safe boating regulations at inland waterways e.g. consistent lifejacket wear, limiting alcohol consumption of skippers
Collaborate with local aquatic facilities (council and privately run) to offer reduced rates for pool entry during summer and public holidays
Advocacy
Work with local stakeholders and emergency services to promote flooding preparedness and safety messages
Advocate for increased funding for classroom and practical inland water safety education programs
Encourage the tourism sector and organisations who operate in, on or around inland waterways and organisations to promote and raise awareness of water safety messaging
Identify community champions for drowning prevention and water safety around inland waterways
Advocate for solutions for improved telecommunication in regional and remote locations with limited mobile phone coverage
Advocate for safe swimming locations at inland waterways that are supported by rescue equipment, lifesaving patrols, and/or professional supervision
48
Practice
Active promotion of ‘child-safe’ play areas in rural and remote locations that have access to inland waterways
Continue to promote and enhance existing river and inland waterway drowning prevention initiatives and awareness campaigns, specifically targeting young men and multicultural communities
Increase availability of swimming and inland water safety education programs for all ages year-round
Increase awareness of the dangers of mixing alcohol around water, and enforcement of alcohol restrictions to prevent drowning, especially among young males
Increase awareness of the role of medical conditions and medications in drowning, especially among older people
Continue to promote active supervision messages for parents and carers of young children, focusing on all locations, including inland waterways
Deliver public awareness and community engagement activities focusing on or at inland waterway locations during weekends and key holiday times
Campaign messaging focusing on inland waterways to be launched prior to school holidays with micro reminders around all public holidays
Ensure rescuers, lifesavers and professional lifeguards have appropriate competency for inland waterways, including swift water and/or flood rescue where applicable
Partnerships
Partner with water safety agencies, state and local government, National Parks and other land and water management agencies to: manage popular inland waterway locations including waterfronts, shorelines, waterfalls and swimming holes where fatal and nonfatal incidents have occurred to enhance safety at these locations, including but not limited to engineering solutions
Continue working with partners such as FarmSafe and KidSafe to promote water safety on farms and rural properties, focusing on both young children and adults who may work alone
Explore partnerships with tourism boards and media (traditional and social media) agencies to raise awareness of water safety and promote drowning prevention messages at key inland waterway locations
49
METHODS CONCLUSION
This report provides a snapshot of drowning deaths that have occurred in inland waterway locations over a 10-year period. While the number of drowning deaths across all inland waterways have decreased over time, the rates of drowning per 100,000 population have remained steady indicating that more needs to be done to reduce drowning across all inland waterway environments by 2030. This study provided new insights into: who is drowning at inland waterways; how, where and when they are drowning; and key risk factors. Differences in people drowning at rivers/creeks and lakes/dams, and visitor trends were identified, providing new information for drowning prevention.
There is an opportunity to enhance existing strategies and develop new and innovative strategies focusing on key populations, activities and risk factors tailored to rivers and lakes/dams.
While this study focused on fatal drowning deaths, we must acknowledge that nonfatal drowning has a significant impact on families and communities, and any future drowning prevention strategies should take a multi-pronged approach with a range of partners in order to effectively address drowning in all forms at inland waterway locations.
Drowning data for this analysis is sourced from the Royal Life Saving National Fatal Drowning Database. Data in the Royal Life Saving National Fatal Drowning Database have been collated from the National Coronial Information System (NCIS), State and Territory Coronial offices and yearround media monitoring. Information contained within the NCIS is made available by the Victorian Department of Justice and Community Safety.
Drowning deaths as a result of suicide or homicide, deaths from natural causes, shark and crocodile attacks, or hypothermia have been excluded from this report. All information presented in this report relates to drowning deaths or deaths where drowning was a contributory cause of death.
This report contains information correct as of 01 October 2022. As of this date, 85% of cases were closed (i.e. no longer under coronial investigation). Note that figures may change depending on ongoing coronial investigations and findings.
The time period for this report is the 10-years between 2011/12 and 2020/21, due to the most current drowning data being 90% open at the time of writing (2021/22 financial year) and 18% of inland waterway drowning deaths in 2021/22 financial year were due to a significant flooding event in Northern NSW and South-Eastern Queensland in late February and early March 2022 which may have skewed the data if it was included.
Definitions
Location and activity being undertaken prior to drowning are coded as per the Royal Life Saving National Fatal Drowning Database (Table 1). For this report, inland waterways refer to: river, creek, lake, or dam, and includes inland billabongs, canals, culverts, estuary, inlets, lagoons, reservoir, swimming holes, reservoir, waterfalls, weirs (Table 1).
For drowning deaths that occurred in the Murray River, all drowning deaths are recorded as being in NSW, regardless of which side of the river the person entered (NSW or Victoria) due to the waters of the Murray River belonging to NSW [17].
Variables analysed in this study included: financial year, age groups, sex, country of birth, state/ territory of drowning, location of drowning, residential location, distance from residential location and drowning location, remoteness classification of drowning location, season, time of day, holiday periods, activity being undertaken prior to drowning, and presence of alcohol, drugs and a pre-existing medical condition(s).
50
Table 1: Definitions of drowning location and activity being undertaken immediately prior to drowning, based on the Royal Life Saving Drowning Database and Coding Definitions Manual [18]
Variable Definition
Location
Based on where the drowning incident occurred
Lake/Dam (lakes) Lake, dam, lagoon, swimming holes, gorges, billabong, reservoir River/Creek A natural waterway fed by other bodies of water. Can vary in water flow, length, width and depth. Includes: river, creek, stream, canal, channel, culvert, estuary, flood plain, inlet, stream, weir, waterfall.
Activity
Activity being undertaken immediately prior to drowning, where known.
Boating Is defined as using motor or wind powered vessels of all sizes, and includes yachts. Personal watercraft (8), also known as jet skis, are included in this category as these are motor powered.
Diving
The sport or activity of exploring or swimming under water. This category includes activities related to diving where the person was already in and or submerged by water prior to drowning e.g. spear fishing
Fall Unintentional entry into the water from land.
Note intention may be unknown – particularly in cases of children where intention may have been to be in the water. For example: fall while walking near water, fall whilst playing near water, fall whilst cleaning the pool
Rock Fishing Fishing from rocks, rocky outcrops, cliffs. Includes where people were conducting this activity and fell or were swept into the water subsequently.
Swimming and recreating
Already in the water either partially or fully submerged while performing recreational or swimming activities. Includes people who were in the water prior to drowning and includes activities such as swimming, wading, playing and floating.
Other Includes activities where small counts were presented <5 cases and includes diving (free diving, scuba and snorkelling), swept away e.g. in floodwater and attempting a rescue.
Unknown Activity was unknown and has been removed for data analysis purposes
Seasons
Seasons are as follows: summer (December to February); autumn (March to May); winter (June to August); spring (September to November). Time of drowning was coded into morning (6:01 am to 12 pm), afternoon (12:01 pm to 6 pm), evening, (6:01 pm to 12 am) and early morning (12:01 am to 6 am). Information relating to alcohol and drugs involvement were sourced from toxicology and autopsy reports in the NCIS. A blood alcohol concentration (BAC) greater than or equal to 5 grams of alcohol per 100 millilitres of blood (BAC ≥ 0.05%), was considered contributory to the drowning (the upper legal limit in in Australia for operating a motor vehicle). Drugs were classified as legal (medication) and illegal (illicit). Information regarding swimming ability was sourced from coroners and police reports.
Where recorded, swimming ability was classified as: competent swimmer, poor swimmer, and non-swimmer. These definitions may not be reflective of actual skills of the person.
Remoteness classification
Remoteness classification of drowning location was determined by the Australian Standard Geographical Classification – Remoteness Area (ASGC-RA) system and categorised into: Major cities, Inner regional, Outer regional, Remote and Very remote locations, determined according to population and distance to services [19].
Geographical information for the Murray River was sourced from Geoscience Australia [11] Crude drowning rates per 100,000 population were calculated using the latest 2021 census population data from the Australian Bureau of Statistics between 1 July 2012 and 30 June 2021 released 2022 [20] .
51
REFERENCES
1. Peden, AE. and Queiroga, A.C. Drowning Deaths in Australian Rivers, Creeks and Streams: A 10 Year Analysis. 2014, Royal Life Saving Society - Australia.
2. Taylor DH., Pidgeon S., and Peden, AE., A ten year national review of lake, dam and lagoon drowning deaths: 2008/2009 to 2017/2018. 2020, Royal Life Saving Society - Australia: Sydney, Australia.
3. Australian Water Safety Council. Australian Water Safety Strategy 2030. 2021, Australian Water Safety Council: Sydney.
4. Royal Life Saving Society. Royal Life Saving National Drowning Report 2019. 2019, Royal Life Saving Society - Australia: Sydney.
5. Peden A.E., Franklin R.C., and Leggat, P.A. The Hidden Tragedy of Rivers: A decade of unintentional fatal drowning in Australia. PLOS ONE, 2016.
6. Peden, A.E., Building the evidence base for river drowning prevention. 2019, PhD Thesis, James Cook University.
7. Australian Water Safety Council, Australian Water Safety Strategy 2016-2020. 2016, Australian Water Safety Council: Sydney.
8. Peden, AE., Scarr, J.P and Mahony, A.J. Analysis of fatal unintentional drowning in Australia 2008–2020: implications for the Australian Water Safety Strategy. Australian and New Zealand Journal of Public Health, 2021. 45(3): p. 248-254.
9. A. Peden, S. Willcox-Pidgeon, J. Scarr and R. Franklin, Comparing rivers to lakes: Implications for drowning prevention. The Australian Journal of Rural Health, 2020.
10. Peden AE, Franklin, RC, and Leggat, PA, Breathalysing and surveying river users in Australia to understand alcohol consumption and attitudes toward drowning risk. BMC Public Health, 2018. 18.
11. Geosciences Australia. Longest Rivers. 2008 [cited 2022 30 Oct 2022]; Available from: https://www.ga.gov. au/scientific-topics/national-location-information/ landforms/longest-rivers
12. Geosciences Australia. Largest Waterbodies. 2008 [cited 2022 30 October 2022]; Available from: https:// www.ga.gov.au/scientific-topics/national-locationinformation/landforms/largest-waterbodies
13. Roy Morgan. People Movement Dasboard for Royal Life Saving Australia. 2023, Roy Morgan.
14. Peden, AE., Franklin, RC., and Leggat., PA, Exploring visitation at rivers to understand drowning risk. Injury Prevention, 2018.
15. Royal Life Saving Society - Australia. National Drowning Report 2021. 2021, Royal Life Saving Society - Australia: Sydney, Australia.
16. Barnsley, P. and Peden, AE., A retrospective, crosssectional cohort study examining the risk of unintentional fatal drowning during public holidays in Australia. Safety, 2018. 4(4): p. 42.
17. Bureau of Meteorology. Murray–Darling Basin: Geographic information. National Water Account 2017 2017 [cited 2023 12 January 2023]; Available from: http://www.bom.gov.au/water/nwa/2017/mdb/ regiondescription/geographicinformation.shtml
18. Royal Life Saving Society – Australia. Royal Life Saving Society - Australia Drowning Database Definitions and Coding Manual 2014. 2014, Royal Life Saving SocietyAustralia.
19. Department of Health and Aged Care. Austrlaian Statistical Geogprahy Standard - Remoteness Area. 2023, Department of Health and Aged Care: Canberra
20. Australian Bureau of Statistics. Census of Population and Housing: Population data summary, 2021. 2021, Australian Bureau of Statistics: Canberra.
52


FOR MORE INFORMATION Call 02 8217 3111 Email info@rlssa.org.au CONNECT WITH US RoyalLifeSaving RoyalLifeSaving RoyalLifeSaving RoyalLifeSavingAust RoyalLifeSaving.com.au
