What the figures tell you Broilers are kept in large numbers. Therefore, problems that start small are often noticed (too) late. Often the birds’ behaviour will not indicate possible problems such as whether they are eating too little. But minor changes may be a precursor to e.g. severe gut problems. By recording and evaluating objective house data daily you can intervene much earlier and avoid problems or expensive treatments.
Set your own standards Compare your data with the standards recommended by the breeding organisation. But it’s actually more important that you also set your own standards and to, for example, compare figures and data with previous flocks. Compare your practices with those of nearby farms who keep the birds in a similar manner.
co pr py ot rig ec h te t d
Where and how? Make it easier to spot changes by always recording the data at the same time every day. Generally a marked change in feed or water consumption is the first sign that there is a health, feed, ventilation
or temperature problem. Make sure that it is easy to record data at the location where you make the observations i.e. hang a card on the door, keep a water list at the water meter, etc. Or alternatively, use a centralised (digital) form that is filled out during inspection rounds.
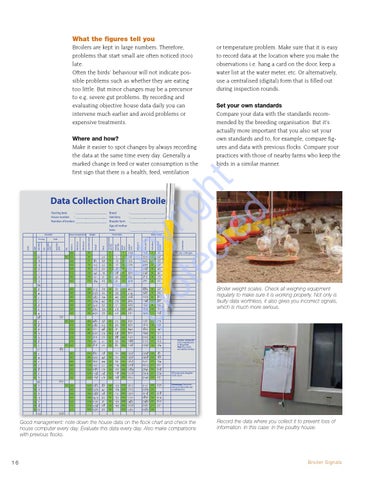
Data Collection Chart Broilers : : : :
Comments
Water/feed
Actual per broiler
Indication
Wheat %
Litre per day
Water intake
Actual cum.
Norm cum.
Standard value per day
Feed intake
Feed
Weight
Actual
Maximum
Minimum
Advice
RH
Number pres.
Mortality cum.
Sel.
Mortality
Age
Date
House temperature Total
Standard value
Mortality Per day
Breed Hatchery Breeder farm Age of mother hens
Actual per day
Starting date : House number : Number of broilers:
CO max. 2.500 ppm 0 0 40 36.0 107 0 8 509 49 60 35.0 356 24 27 50 15 5 15 68 20 61 34.0 422 28 32 80 27 17 12 32 162 19 78 102 33.0 3 13 499 37 37 22 20 10 53 129 95 122 32.0 568 42 43 4 9 20 22 8 74 111 120 140 31.0 647 50 45 5 11 14 25 28 99 370 145 161 30.5 713 56 59 6 10 21 28 30 127 395 175 184 30.5 791 60 60 7 12 23 30 31 157 409 94 205 213 30.5 884 68 67 8 7 29 34 35 191 462 238 239 30.0 977 76 74 9 4 26 38 39 229 514 273 282 29.5 1069 86 80 10 5 34 43 43 272 568 315 324 29.0 1148 86 87 11 5 42 48 59 320 779 357 356 29.0 1241 94 94 12 7 32 52 51 372 673 400 395 28.5 1333 103 101 13 6 39 58 59 430 782 455 432 28.0 1426 113 108 14 4 39 64 52 494 691 132 38 495 486 65 28.0 1571 120 119 15 5 37 68 55 562 730 547 586 27.5 1716 130 130 16 8 63 74 70 636 920 601 601 27.5 1866 141 141 17 7 48 80 71 716 942 658 660 27.0 1943 151 151 18 9 59 86 68 802 900 717 710 27.0 2006 160 152 19 9 50 92 88 894 1160 Monitor Salmonella 778 761 27.0 2152 172 163 20 7 51 98 90 992 1188 and Campylobacter in this period 745 817 2297 182 174 67 26.5 21 6 56 104 85 1096 1128 N.B.! The results 183 are valid for 20 days. 51 913 875 26.5 2398 193 181 22 5 58 110 101 1206 1327 984 922 26.5 2468 203 187 23 4 47 116 101 1322 1337 1057 966 26.0 2561 210 194 24 5 44 120 96 1441 1267 1130 1021 2653 217 201 26.0 25 5 55 124 114 1566 1508 1203 1080 2746 224 208 25.5 26 8 59 128 120 1694 1584 Fill in and send slaughter1276 1138 2954 231 224 25.5 27 6 58 132 118 1826 1557 ready report 1350 1197 3049 238 231 24.5 28 9 59 136 128 1962 1605 225 42 If necessary: 2nd moni1427 1282 3155 245 239 70 24.0 29 15 87 140 133 2102 1752 toring of Salmonella and Campylobacter. 1504 1329 3274 252 23.5 30 10 45 144 124 2246 1502 1582 1387 2018 257 258 23.0 31 9 58 147 115 2393 1300 1660 1459 2896 264 254 22.5 32 13 72 151 135 2544 1535 1739 1530 2987 270 262 22.0 33 15 71 154 130 2698 1486 1819 1598 2075 277 261 21.5 34 18 68 158 143 2856 1627 3018 1575 1900 1670 2689 284 21.5 35 22 72 162 327 102 1981 1733 2754 291 260 75 21.0 36 30 63 166 130 3184 1499 309 and check the 2777 298chart 20.5 1374the flock 130 3354on 92 170 data 1825 house 23 Good 3738management: note down2062 the 3528 174 2144 2412 305 268 20.5 1424 158 77 1902 14 house 39computer every 20.0 day. Evaluate Also312 make 274 comparisons 3706 1384 day.2466 2226 1950 this 154 every 48 178data 14 2308 2034 84 182 163 3888 1466 2520 319 280 40 12 with previous flocks. 20.0 185 165 4073 1485 2390 2583 324 287 19.5 41 10 329 4261 188 2475 19.5 42 8 438 111 0
2
1 2
16
43
19.0
2560
191
4452
334
44
19.0
2646
193
4645
338
45
18.5
2733
195
4840
341
* Geadviseerde temperatuurschema geldt voor de winter. In de zomer maximaal afbouwen tot 22°C.
Broiler weight scales. Check all weighing equipment regularly to make sure it is working properly. Not only is faulty data worthless, it also gives you incorrect signals, which is much more serious.
Record the data where you collect it to prevent loss of information. In this case: in the poultry house.
B roile r Si gnal s