
We strive to protect and enhance our region as it is a unique place underpinned by rich heritage and an enviable river lifestyle. We are proud to share and nurture this natural beauty, welcome visitors and drive growth and investment to sustain our vibrant community long into the future. We lead healthy, active and fulfilling lives, with a commitment to support and respect each other and our environment. Together, we're building a brighter future.

Renmark Paringa Council acknowledges the First Peoples of the Murray and Mallee region as the traditional custodians of the Renmark Paringa area, and acknowledges their cultural and spiritual connection to land, water and community. We pay our respects to Elders past and present.

At Renmark Paringa Council, we do more than manage roads, rates and rubbish, we deliver the services, infrastructure and facilities that support your community, your lifestyle and your region.
Councils across Australia are being asked to do more , with less funding and we are no exception. The February 2025 interim report into local government sustainability confirmed what we’re already experiencing: increasing expectations, broader responsibilities, and tighter budgets.

Community feedback on this Draft Annual Business Plan will help shape the direction of Council’s services, facilities and programs over the next 12 months.
At Renmark Paringa Council, we are committed to balancing financial sustainability with delivering services that reflect the needs and aspirations of our community. This Draft Annual Business Plan outlines our investment in strategic priorities, essential infrastructure and services, while maintaining a responsible and sustainable financial position.
This Annual Business Plan sets out how we’ll continue to deliver for you in 2025/26. It outlines where your rates and other income will go, the Functions, Services and Initiatives we’re investing in, and the decisions we’ve made to balance community priorities with financial sustainability.
Prepared in accordance with the Local Government Act 1999, this Plan gives you a clear view of how we’re working to support a Renmark Paringa you love living in today and into the future.
Your voice is important. This draft plan has been shaped by the views and priorities you shared through the latest Community
Satisfaction Survey and during the development of the Renmark Paringa Community Plan. It reflects what matters most to you and sets a clear direction for the year ahead.
We now invite you to review the Draft Plan and tell us what you think. Your feedback will help us refine and finalise the plan to ensure it meets the needs of our community.
Have your say at engagement. renmarkparinga.sa.gov.au or in writing to PO Box 730, Renmark, SA, 5341.
By getting involved, you can stay informed, contribute your ideas, and help shape the future of our region.
By 16th July 2025
The Renmark Paringa Council area is located 250 km north-east of Adelaide, along the Murray River in South Australia’s Riverland. It includes the townships of Renmark, Paringa and
Lyrup and is home to over 10,000 people. The region is known for its rich agricultural heritage, thriving tourism sector, and strong sense of community.
With a diverse population, river-based recreation, and quality local facilities, Renmark Paringa is a thriving regional centre that balances lifestyle, industry and opportunity.

Elected Members of the Renmark Paringa Council play a vital role in shaping the future of our district. They are responsible for making decisions and setting policies that impact our community, local businesses, and environment.
Their key responsibilities include:
l Actively participating in Council discussions, decision-making processes, and civic events.
l Reviewing and evaluating Council policies and strategic objectives to ensure they remain relevant and effective.


l Monitoring how Council resources are allocated and spent, and assessing the performance and efficiency of services delivered to the community.
l Representing the interests of residents and ratepayers, providing leadership and guidance, and fostering strong communication between the community and Council.


The 2025/26 Annual Business Plan and Budget outlines how we will allocate our budget and what services, programs and projects will be delivered in the coming financial year to contribute to achieving the community’s long-term objectives.
In 2025/26 we have significant expenditure on the renewal of key assets including the Alan Coulter Recreation Centre and the Renmark Paringa Library.

We will continue to maintain essential infrastructure such as roads, footpaths, storm water drainage and open space areas.
Council will also provide regulatory services such as planning and development, food hygiene and safety, dog and cat management and mosquito control.
We also provide services which not only seek to enhance the
quality of life for residents but also provide a memorable experience for those who visit our region.
Those services include libraries, events, tourism and visitor services, economic development, sport and recreational facilities, parks and playgrounds, family focused activities and community development initiatives.

Council will continue to support the Jane Eliza Development through the implementation of the Land Facilitation Agreement, recognising the critical need for improved houseboat facilities, increased housing availability, and expanded lifestyle and recreational opportunities for our growing community.
A comprehensive Advocacy Plan will be developed to identify key gaps and community needs across the Renmark Paringa area. This plan will guide lobbying efforts for increased state and federal support—focusing on priority issues such as the Truro Bypass, improved mental health services, and the ongoing housing crisis.
In partnership with the Department for Environment and Water, Council will progress plans to create additional, more accessible houseboat moorings at Lock 5 Road. As demand for mooring space grows, this project will help ensure houseboat tourism remains a strong and sustainable part of our river lifestyle.
Council will begin the design and approval process for renewing the much-loved playground at Jarrett Memorial Gardens. Community consultation will be central to this project, following the success of recent playground upgrades. Located near the Renmark Paringa Library and town centre, this playground is an important space for local families.
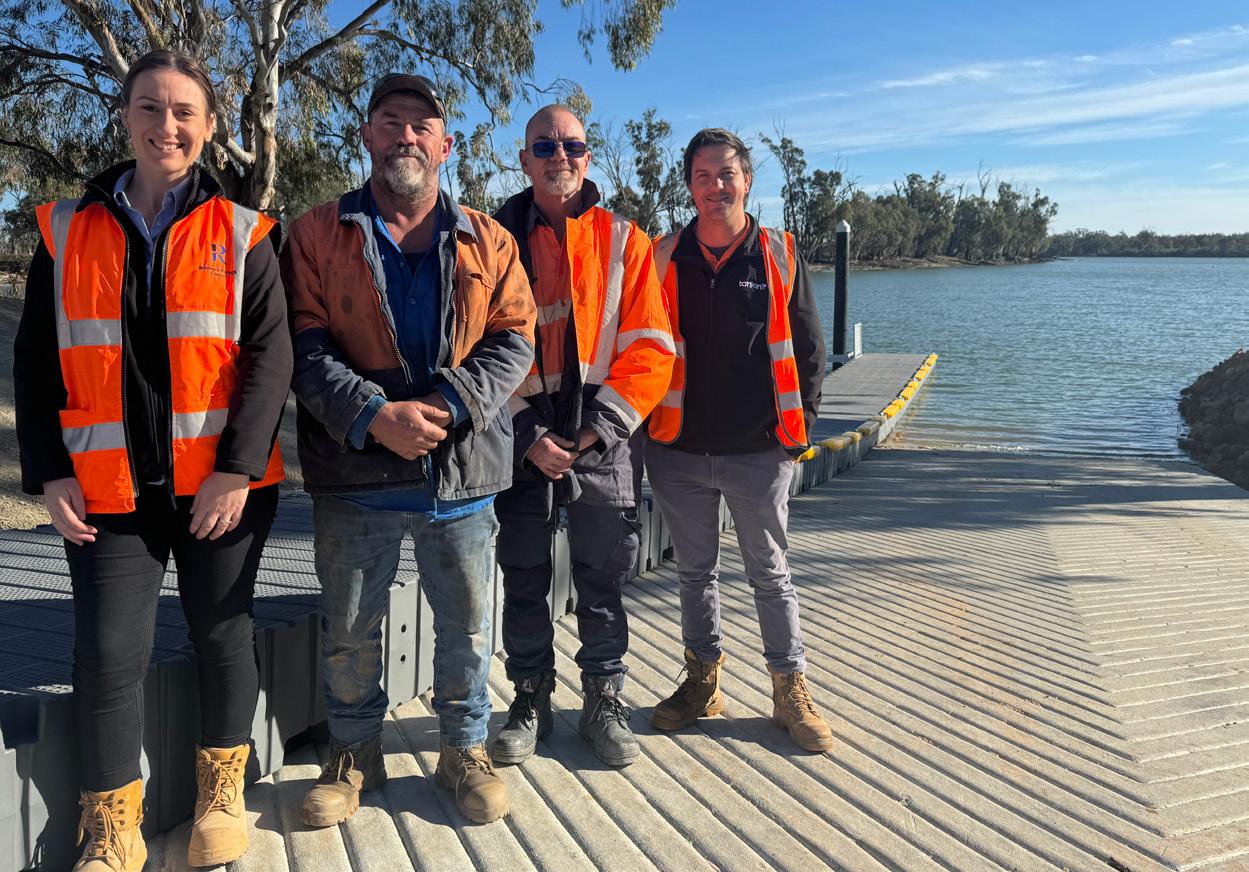
Plans are underway to upgrade the Bert Dix Park Boat Ramp, transforming it into a fit-for-purpose facility with improved accessibility, a floating pontoon, and better maneuvering capabilities. This upgrade will enhance river access and encourage greater use of our iconic Murray River.
Council will continue to support the roles of the Active and Connected Communities Officer and the Preventative Health Officer—joint initiatives with the other Riverland councils. These positions aim to boost regional health outcomes and increase participation in sport and recreation.
Working in collaboration with the Murraylands and Riverland councils, the Waste Education Officer will continue delivering community education around responsible waste management. Through public awareness campaigns and waste audits, this role supports our efforts to reduce landfill, improve recycling practices, and promote environmental sustainability.
Council will explore the feasibility of short-term priority projects identified in the Renmark Paringa Growth Strategy. These investigations will help lay the groundwork for future infrastructure, investment, and population growth, ensuring our planning aligns with community needs and long-term sustainability.


Renmark Paringa Council provides a range of functions and services to meet the needs of our community and to fulfil our legislative requirements under the Local Government Act 1999. These include:
q Regulatory activities, including development planning and control, and fire safety.
q Management of infrastructure and other assets, including roads, footpaths, parks, street lighting and storm water drainage.
q Street cleaning and rubbish collection.
q Environmental health services, including public health inspections, and pest control.
In addition, we provide further services that are not required by


legislation, but provide additional liveability to our community.
Services including libraries, events and tourism, economic development, sport and recreational facilities, parks and playgrounds, public toilets and family focused activities.
Our Strategic Management Framework demonstrates how our plans deliver on your vision.
Our Annual Business Plan forms a key part of Renmark Paringa Council’s Strategic Management Framework.
This framework ensures that all of Council’s activities are guided by the long-term vision outlined in our Community Plan. The Community Plan sets the strategic direction for our community over a 10-year horizon, defining the key goals and objectives we are committed to achieving in partnership with you.
Supporting this strategic direction are our Infrastrucutre and Asset Management Plan and Long Term Financial Plan, which outline how we will responsibly allocate resources to deliver on our priorities.
Ongoing performance monitoring through a community satisfaction survey every three years and transparent reporting are built into our approach, ensuring we stay on track, measure progress, and remain accountable to you.
Long Term Financial Plan Infrastructure & Asset Management Plan
What are the activities and outcomes to be achieved this year? How will we allocate the resources?
Our community vision for Renmark Paringa is to leverage our unique attribues and address our challenges, supported by these four aspirations.
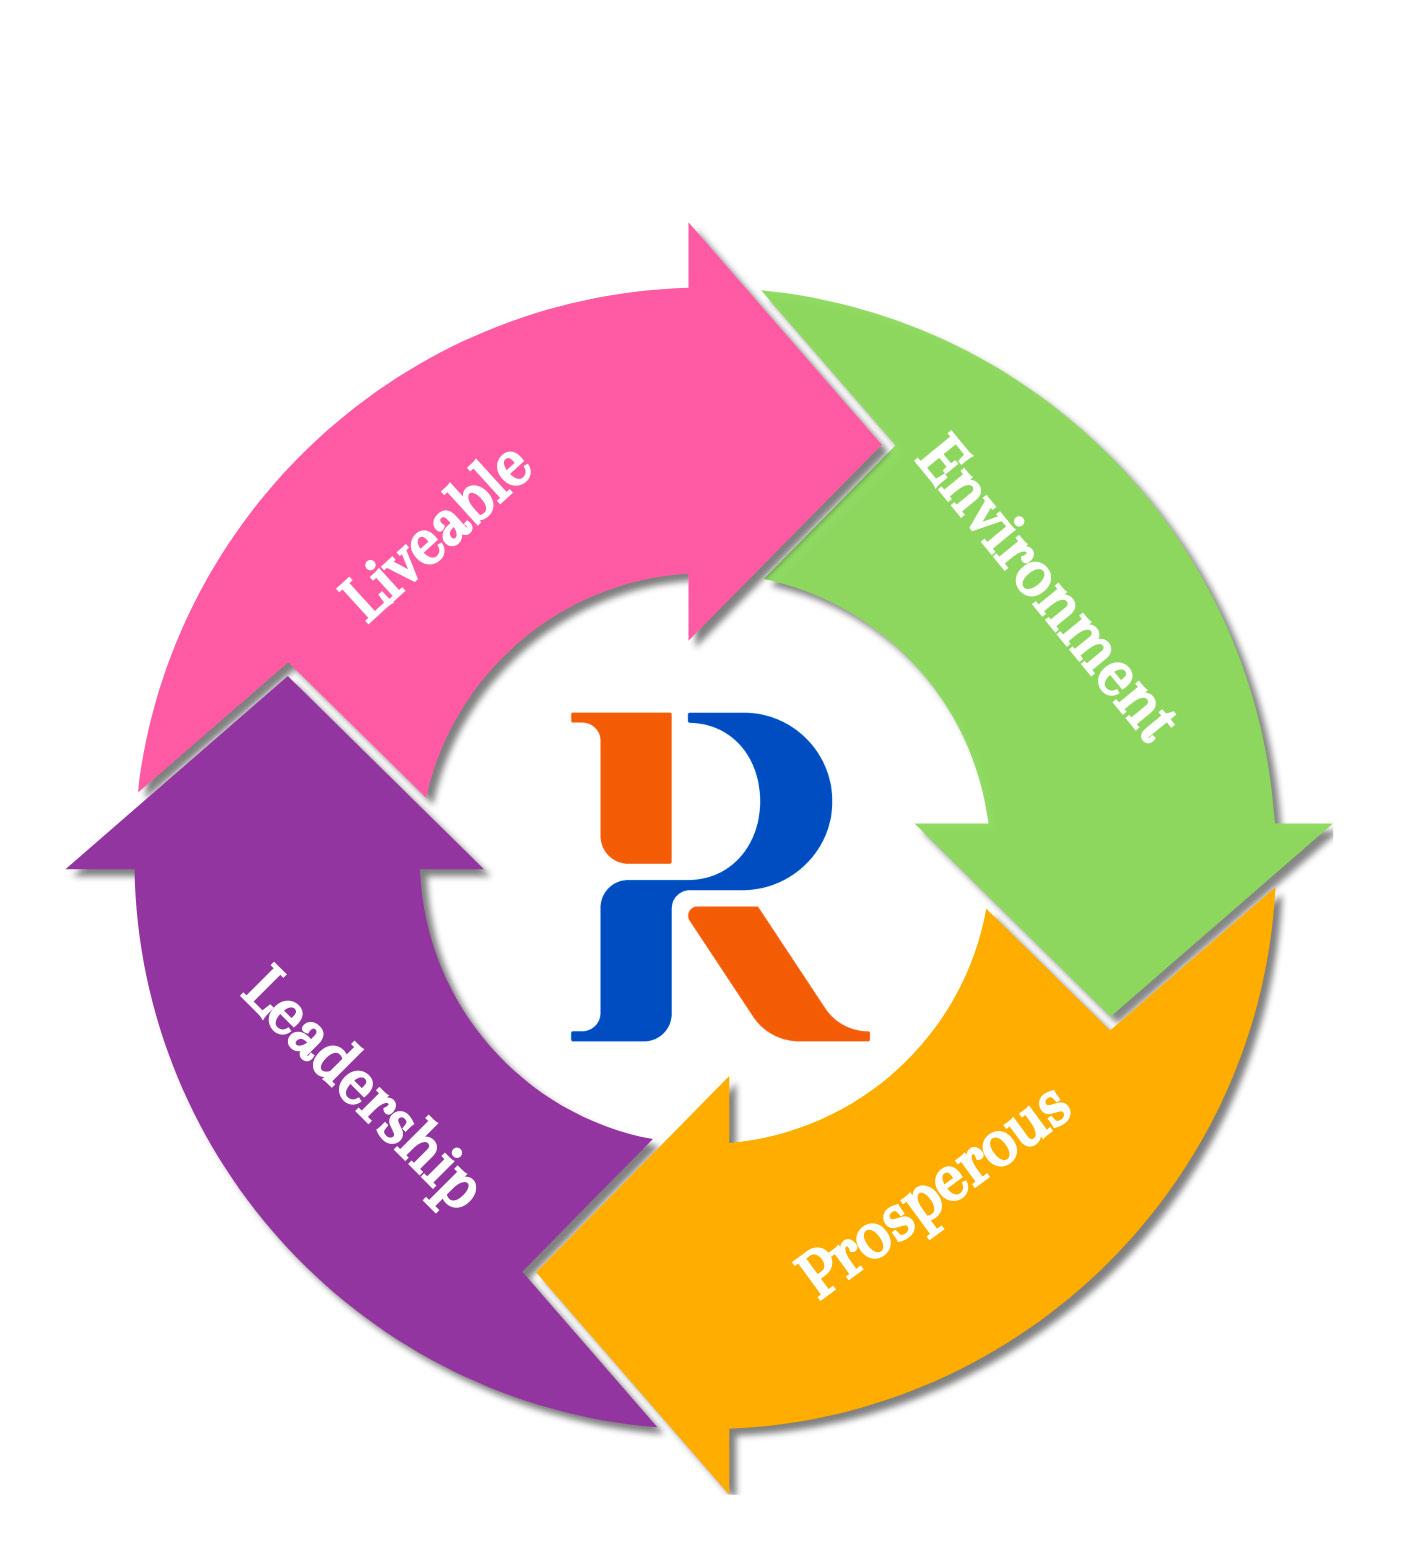
A safe and welcoming place to live a healthy and active lifestyle.
A place that attracts, retains and supports talented people, underpinned by diverse regional industry, tourism and access to housing.
A place that is resilient to the effects of extreme weather, protects its river, is green and limits its impact on the natural environment.
A Council that is a trusted partner that delivers what it promises in an efficient and effective way.
The Renmark Paringa Community Plan 2024–2034 captures the shared vision and aspirations of our community for the decade ahead. It guides everything we do.
This long-term plan shapes Council’s strategies, priorities and investment decisions ensuring we focus on what matters most to you.
Supporting the Community Plan are key strategic documents like the Long Term Financial Plan (LTFP) and the Infrastructure and Asset
Management Plan (IAMP).
These help us allocate resources sustainably and make decisions that reflect your needs and expectations.
The Annual Business Plan and Budget 2025/26 outlines the specific services, projects and initiatives we’ll deliver over the coming year.
It’s how we continue working towards the future you’ve told us you want to see.
Our Community Plan was reviewed in late 2024 and is our overarching strategic plan which charts our desired future state for the coming years. It presents our community vision and also our aligned strategic outcomes.
Our Community Plan forms part of the ‘strategic management plans’ under Section 122 of the Local Government Act 1999.
2024-2034 Community Plan

The purpose of our Infrastructure and Asset Management Plan (IAMP) is to assist our organisation in managing our infrastructure and other assets to an agreed standard of service.
The purpose of the Long Term Financial Plan is to express, in financial terms, the activities we intend to undertake over the next 10 years.
It guides the future planning of our financial operations in regard to key components such as rate increases, depreciation, service levels to our community and, infrastructure asset replacement and renewal.
Council adopted a new Growth Strategy in 2025, which will serve as another key strategic document.
Our Growth Strategy will be instrumental in guiding our decision making and investment regarding future rezoning proposals, infrastructure investment decisions, as well as decisions around the use of community land and assets.
It will also provide a clear message to the community and private sector about priorities for the region.
Furthermore, it will assist the State Planning Commission and the South Australian Government who are commencing the preparation of Regional Plans across
South Australia. Our Growth Strategy will provide a clear plan for growth that can be adapted over time.
Our goal is to support a community that is:
l Resilient and enjoys positive health outcomes
l Active and participates in sport and recreational activities
l Connected, inclusive and supports lifelong learning

Areas of Focus Community Health
Volunteering
Connected and Inclusive
Recreation
Community Safety
Lifelong Learning
History, Culture and Arts
Our goal is to support a community that is and has:
l Resilient, diverse and sustainable industries
l Access to technology, housing and a lively town centre
l A vibrant tourism experience and offering

Growth
Industry
Digital Connectivity
Housing Infrastructure
Town Centre
Tourism and Events
Renmark Paringa Council has established four key strategic pillars which cover all of Council’s major services and responsibilities. The Strategic Pillars drive the detailed approaches/plans that Renmark Paringa Council have in place to achieve Council’s broader strategic objectives.
Our goal is to support a community that has:
l Community assets and industries resilient to the effects of extreme weather and threats to biosecurity
l Sustainable management of natural resources including water, waste and energy)
l A green, healthy and thriving natural environment
Our goal is to support a community that:
l Is accountable, reliable and transparent
l Effectively communicates and engages its community to inform decision-making
l Delivers efficient, effective and sustainable operations
Regional Biosecurity
Murray River
Natural Resources
Resource Recovery
Greening
Effective Goverance
Communications
Community Engagement
Advocacy
Partnerships
Business Systems

Each year, Council undertakes a detailed planning and budgeting process to ensure we deliver the best value for our residents, businesses and broader community We are guided by what matters to you.
Your voice comes through clearly, in community satisfaction surveys, deputations to Council, written correspondence, and direct conversations with our Elected Members. These insights shape the decisions we make and the priorities we set.
At the same time, like many households and businesses, Council is not immune to rising costs.
The impacts of high inflation, increasing interest rates and escalating prices for construction, materials, utilities and service delivery have significantly shaped our thinking. The continued recovery from the 2022 River Murray flood has added further pressure on our infrastructure, our services and our financial position.
In developing the Annual Business Plan and Budget 2025/26, we’ve worked through these challenges thoughtfully and strategically. Our approach has been to test a wide range of assumptions, explore cost drivers and review the long-term implications of our financial settings.
The plan is informed by advice from the Essential Services Commission of South Australia (ESCOSA), which provides oversight of council financial sustainability and encourages responsible financial planning that is fair, efficient and future-focused.
Ultimately, we’ve sought to ensure this plan reflects the community’s aspirations, the realities we face today, and our responsibility to future generations. It’s a careful balance of listening to our community, preserving core services, maintaining vital infrastructure and ensuring Council remains financially resilient.

The Annual Business Plan and Budget 2025/26 outlines:
q Our functions, services and key initiatives for the year
q How we will track progress
q The financial requirements of Council, including operating and capital expenditure
q Our approach to responsibly funding the services and infrastructure our community values
This year’s planning process began with the development of a clear set of guiding principles to ensure that every decision was made in alignment with Council’s commitment to long-term financial sustainability and community wellbeing.
These principles provided a shared framework for decision-making across the organisation:
Take care of all resources (money and others) to make sure we have what we need for the future and that everyone benefits.
Focus on looking after what we already have and make smart investments in new projects that improve life for the community.
Make decisions about where to put money based on facts and data, ensuring it helps everyone in the community and boosts economic development.
Work together with others, leverage external funding to deliver against the Community Plan, and find ways to collaborate regionally for more efficient use of resources.
Consider the environment in everything we do, focusing on being resource-efficient, building for a changing climate, and supporting a circular economy.
Use data and ongoing reviews to stay flexible, making sure investments meet changing needs and bring the best results.
To operationalise these principles, Council applied a series of budget levers designed to reduce costs, improve efficiency, and shift resources towards the highest priorities. These included:
Reduced planned capital expenditure by $5.7 million in the first year, redistributing this expenditure to future years.
Successfully applied for the LGA Financial Sustainability Pilot Program and other grants to support financial sustainability.
Council has initiated surveys with community and sporting groups leasing Council-owned buildings to identify current use, future needs, and opportunities for optimisation. Separately, a number of land parcels and buildings have already been identified by administration as surplus to Council’s requirements.
Initiated a comprehensive review, with analysis and benchmarking informing the Annual Business Plan.
Achieved a 6% reduction in budgeted materials and contracts expenditure (from the 2024/25 adopted budget), identifying further potential cost reductions. This also includes a temporary freeze on Council's Grants and Sponsorship program.
Council will continue to explore energy reduction options and initiatives to reduce costs.
Ongoing review to identify opportunities for service consolidation, streamlining, and automation.
A review of all discretional rate rebates will occur.
Explored options to reallocate existing borrowings to long-term facilities to ensure financial sustainability.
Identified additional areas for potential operating budget reductions linked to current service standards.
Interim review of the ICT strategy, leading to the establishment of a fixed-term position to bolster project support capabilities.
Conducted a detailed analysis of all Council-hosted and supported events, proposing a reduced program of events and sponsorships.
Throughout this process, Council managers, teams and elected members have been closely involved in analysing operational budgets, testing various assumptions, and modelling financial scenarios to identify risks, opportunities and potential savings.
Considered as a final lever after exploring all other options to reduce expenditure or increase income.
In 2025/26, we will invest approximately $29.3 million to deliver a wide range of services, programs, and projects that support the health, wellbeing and prosperity of our community. This investment includes:
q $21.4 million for the day-to-day services and programs we deliver – everything from waste collection, libraries and parks to community development and regulatory services.
q $5.7 million for the renewal of essential infrastructure, delivery of new and upgraded assets, and key initiatives that improve community outcomes and organisational efficiency.
This budget supports the delivery of our Community Plan 2024–2034, which sets out the vision and aspirations of our district for the next decade.
We have grouped all Council activity under a set of defined functions—such as Culture, Transport, Community and Regulatory Services.
Each function brings together relevant services (such as libraries, waste management, tourism, and asset renewal) and shows how they contribute to achieving our community’s shared goals.
Read more about these functions and their budgets in the following section.
We are committed to transparency, accountability, and continuous improvement. To ensure we are delivering on our commitments, we will track progress against both financial and nonfinancial objectives throughout the year.
In 2025/26, we will introduce quarterly performance reporting across all Council functions and services. This new approach will provide a more consistent and timely picture of how we’re tracking, not just in terms of budget, but also in the delivery of services and key initiatives. These reports will include:
q Financial performance: tracking actual expenditure against budget.
q Service delivery commentary: highlighting what’s been achieved, any delays or risks, and key impacts.
q Contribution to the Community Plan: showing how our work contributes to the focus areas and goals identified by our community.
This new reporting approach will help elected members, staff, and the community better understand where resources are going, what’s being delivered, and where we need to adjust.
Each year, we also provide a full summary of our performance in the Annual Report in accordance with Schedule 4 of the Local Government Act 1999, which includes information about the delivery against the Annual Business plan and financial statements.


Total Council Budget Committed
Operating: $2,276,457
Capital: $444,593
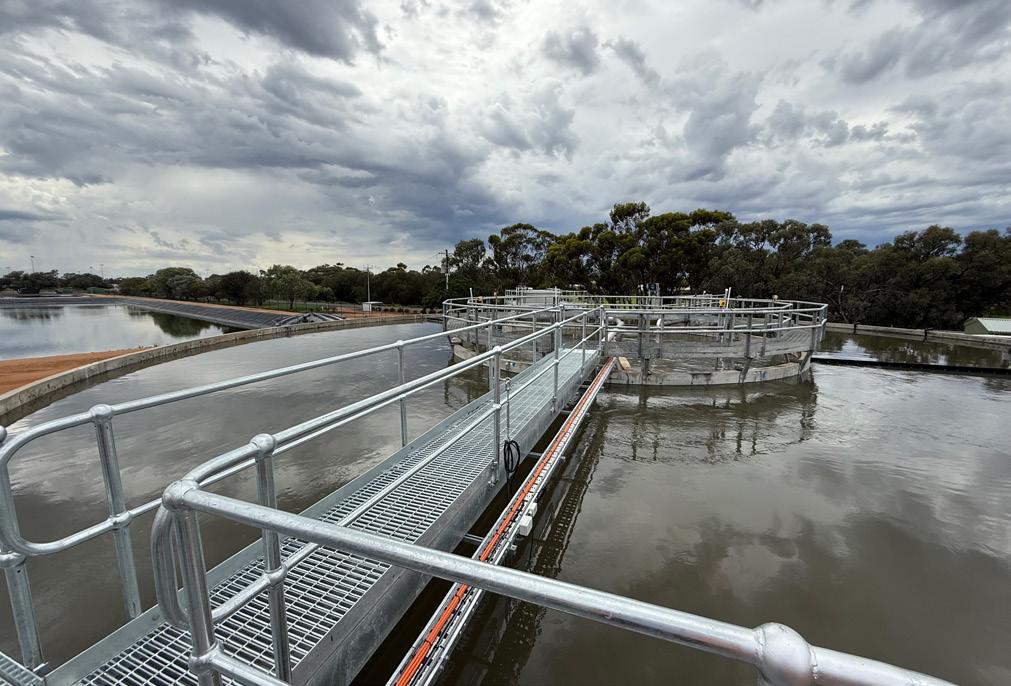
Our service goal: To provide reliable wastewater collection, treatment and reuse services that protect public health, minimise environmental impact, and support liveability through safe, efficient infrastructure.
Effluent Collection (CWMS)
Wastewater Treatment & Reuse
Asset Inspections
Maintenance (Planned & Reactive)
Desludging Program
Planning & Capital Upgrades
Transfer household effluent through the CWMS network to the wastewater treatment plant for processing. Ensure services operate with minimal interruption.
Treat effluent to a high standard for safe reuse in irrigation of parks and gardens. Monitor water quality and adjust processes as required.
Conduct routine inspections of lagoons, dams and CWMS infrastructure as per legislative and operational schedules to ensure integrity and performance.
Undertake planned maintenance and respond to faults or system alarms with timely reactive maintenance, including after-hours response.
Deliver annual desludging of CWMS infrastructure to maintain performance and capacity.
Plan for system improvements and undertake capital works to meet regulatory standards, support growth and improve levels of service.
• CWMS Renewal - Undertake renewal of common effluent drains in accordance with the IAMP.
• Patey Drive Pump Station - Continue planning for the replacement of the Patey Drive Pump Station.
Total Council Budget Committed
Operating: $1,539,709
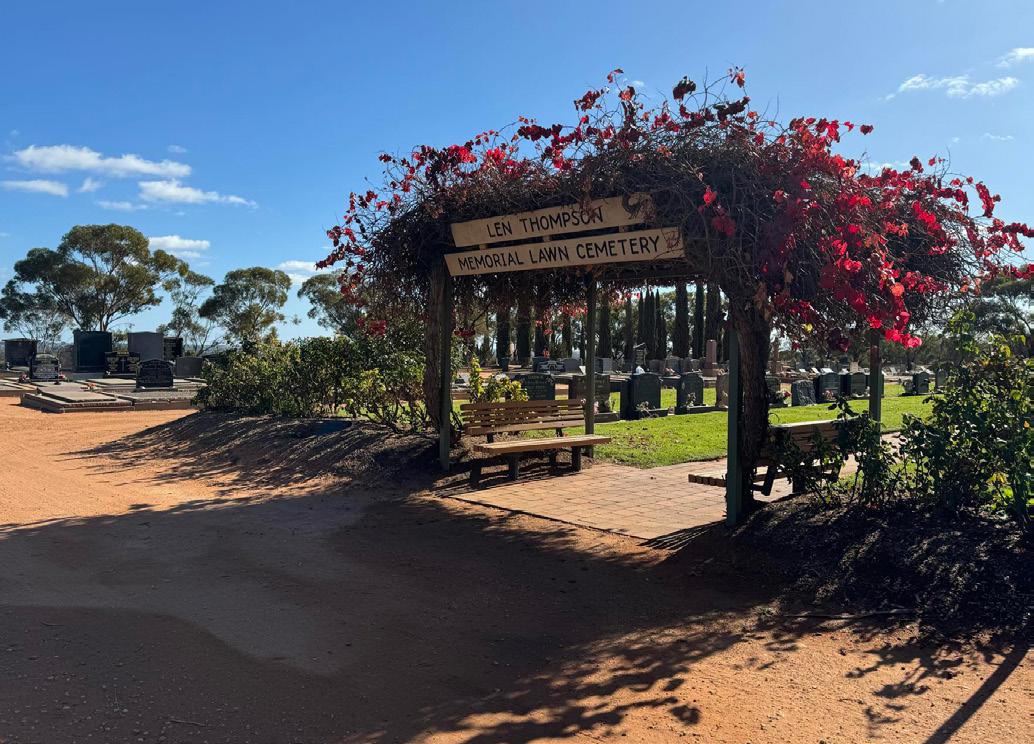
Our service goal: To provide a respectful, responsive and dignified cemetery service that supports families, honours local heritage, and meets community needs through well-maintained sites, clear information, and compassionate care.
Customer Support & Liaison
Interments & Memorials
Interment Rights
Site Safety & Maintenance
Provide timely, compassionate support to families and the public.
Coordinate the safe and respectful delivery of all grave and ashes interments.
Manage the sale, transfer and renewal of interment rights.
Conduct regular inspections of gravesites and cemetery grounds. Identify and respond to safety issues, hazards, and maintenance needs.
Heritage & Historical Significance
Community Projects & Site Enhancements
Preserve and share the region’s history through support of local heritage organisations and collaboration with projects such as the SA Headstone Project.
Deliver improvements such as new ashes interment areas in response to evolving community needs, ensuring thoughtful and respectful development of cemetery spaces.
Our service goal: To foster a connected, informed and resilient community through inclusive programs, strong partnerships and strategic engagement.
Communications and Engagement
Content and Design Services
Grants and Sponsorships
Volunteer Recognition
Inclusive & Healthy Communities
Manage Council’s communications and engagement across platforms including the website, social media, newsletters and advertising. Coordinate media, marketing, small events and communication planning.
Design and develop corporate publications and promotional materials.
Community Partnerships & Capacity Building
Community Projects & Advocacy
Deliver Council’s Grants and Sponsorship.
Coordinate Council’s Volunteer Recognition Program to celebrate and acknowledge the contributions of local volunteers.
Support the delivery of Council’s Disability Access and Inclusion Plan and Public Health and Wellbeing Plan.
Work directly with community and sporting groups, to support local initiatives, training and leadership.
Support grassroots initiatives and represent Council in external forums to advocate for community needs and strengthen connections.
• Website Update - Update the Renmark Paringa Council website to be more user-friendly and accessible for our ratepayers and community members.
• Disability Access and Inclusion Review - Participate in the State Government Disability Access and Inclusion Review to ensure our community infrastructure and services are inclusive and accessible for the entire community.
Total Council Budget Committed
Operating: $1,012,374
Capital: $92,000
Our service goal: To consistently deliver high-quality face-to-face and online customer service, and to maintain safe, welcoming library spaces that connect our community with diverse physical and digital collections, programs, and services supporting lifelong learning, digital inclusion, literacy, creativity, and community wellbeing.
Access to physical and digital collections, including local history materials
Free access to internet, computers, Wi-Fi, printing, scanning and a wide range of digital resources
Engaging programs for adults that support creativity, digital skills, and lifelong learning
Inclusive programs for children, students, and families fostering literacy, education, and social connection
Responsive customer service and welcoming spaces for study, creativity, leisure, and connection
Maintain relevant, diverse, and accessible collections, with access to the state-wide library network
Provide up-to-date digital resources and support to build skills and confidence
Partner with community groups and deliver targeted programs that meet local needs
Deliver educational and enriching activities year round, including programs involving collaboration with schools and families
Support all visitors with knowledgeable staff, inclusive spaces, and practical assistance
• School Holiday Library Program - Continue to deliver the much-loved School Holiday Program.
• Library Remediation - Undertake building remediation work at the Renmark Paringa Library in accordance with the IAMP.
Our service goal: To support a thriving, connected community and a strong local economy by enabling well-managed events that celebrate our region, attract visitors, and provide safe, enjoyable experiences for all.
Event Planning & Delivery
Event Permits & Approval
Coordination of Council Services
Traffic & Road Closure Management
Manage the development, coordination and delivery of Council-run events.
Act as a single point of contact for processing all event permits for activities on Council land.
Aquatic Licence Support
Event Development & Support
Event Sponsorship Program
Event Marketing & Communications
Event Risk & Contractor Management
Coordinate internal resources (e.g. waste, traffic, facilities) to support the operational requirements of events.
Manage the application, approval and implementation process for road closures and traffic management plans.
Assess and support applications for aquatic events, including impact analysis, recommendations, and the provision of letters of support when required.
Attract, mentor and support community and commercial event organisers to plan and deliver high-quality events.
Manage and promote Council’s Event Sponsorship Program.
Coordinate event-related communications including promotion, signage, online content in collaboration with the communications team.
Develop and review risk management plans, coordinate necessary permits, and oversee contractor involvement to ensure safe and compliant event delivery.
• Events Program - This year will see a program of events, encompassing the Renmark Riverfront Markets, Australia Day celebrations and the community-led Renmark Christmas Pageant.
Our service goal: To provide well-maintained, accessible, and inclusive community facilities that support the wellbeing, connection, and participation of all residents
Facilities Management
Facilities Maintenance
Provide and maintain accessible public buildings including the town institute, public toilets, and other Council-owned spaces for community use.
Support equitable access to facilities through booking systems, signage, and inclusive design.
Plan and budget for capital upgrades and renewal of aging infrastructure based on asset management data.
Respond to community feedback and usage trends to inform future facility investment and service levels.
Ensure facilities are clean, functional, and safe through routine inspections and scheduled maintenance
• Air-conditioning upgrade - Replace air-conditioning components at the Renmark Paringa Community and Civic Centre, in accordance with the IAMP.
Total Council Budget Committed Operating: $960,302
Capital: $50,000
Our service goal: To deliver an effective economic development approach that fosters a thriving, resilient and sustainable local economy. We work in partnership with business, industry and the community to attract investment, encourage innovation, support local enterprise, and unlock opportunities that align with Council’s vision for growth and prosperity.
Business Support & Advocacy
Investment Attraction & Enablement
Event Impact Analysis
Business Grants & Funding Support
Act as a central contact point for developers, landowners and business operators seeking to invest or grow in the district.
Promote and facilitate economic growth by identifying development opportunities, supporting investors and businesses through the approvals process, and aligning with regional economic priorities.
Analyse Spendmapp and other economic data to measure the commercial and economic impact of local events, helping to inform future planning and investment.
Provide advice and direction to businesses regarding relevant grant and funding opportunities, supporting economic resilience and innovation.
Land Development
Prepare documentation and coordinate processes relating to the sale and development of Council-owned land, supporting strategic land use and economic outcomes.
• Jane Eliza Development - Support the Jane Eliza Development to help deliver tourism benefits, assist in the housing crisis and address houseboat mooring requirements.
• Freeze Dry Facility - Continue to support PIRSA's feasability study for a freeze dry facility.
• Land and Asset Rationalisation Assessment - Investigate opportunities to maximise the return on underutilised assets.
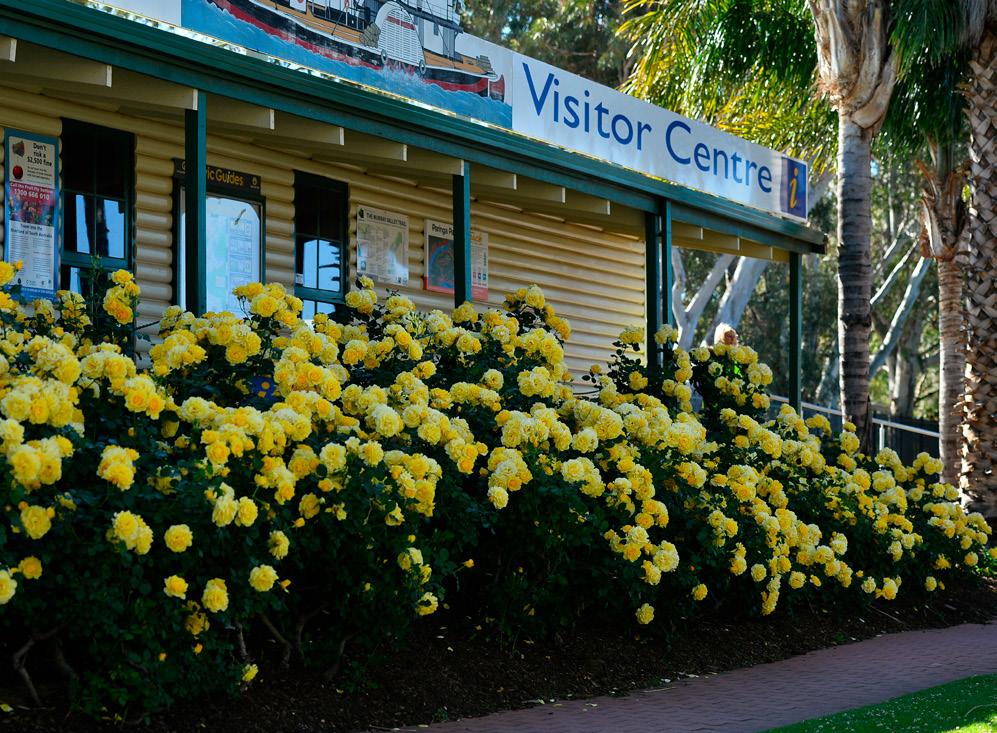
Our service goal: To deliver outstanding visitor experiences that showcase the best of Renmark and the Riverland region, support a thriving tourism industry, and contribute to a vibrant local economy through quality services, partnerships and destination marketing.
Visitor Information & Servicing
Tourism Industry Engagement & Development
Regional Tourism Partnerships
Heritage & Storytelling
Retail & Online Bookings
RV Park Management
Provide tailored in-person, phone and online support for visitors. Develop and maintain tools to enhance the visitor experience.
Tourism Branding & Communications
Build strong relationships with local tourism operators.
Actively participate in regional initiatives, including the delivery of the Riverland 2030 Tourism Plan.
Support local heritage organisations, promote the region’s historical stories, and collaborate on initiatives like History Festival and partnerships with attractions such as the PS Industry .
Operate a retail offering that reflects the region, including local produce and souvenirs. Provide a central booking point for accommodation, tours and experiences, both online and in person.
Operate a retail offering that reflects the region, including local produce and souvenirs. Provide a central booking point for accommodation, tours and experiences, both online and in person.
Manage consistent tourism messaging and branding across digital and print platforms, promoting the region through campaigns, collateral and merchandise.
Total Council Budget Committed Operating: $4,253,697
Our service goal: To provide a facility where Council and the community can make a positive contribution to the environment by reducing the amount of waste sent to landfill through the correct separation of waste into different waste streams.
Accessible and Reliable Waste Disposal Services
Separation of Waste into Approved Waste Streams
Ongoing Waste Movement and Management
Environmental Awareness and Community Participation
Operate the facility in a convenient and timely manner. Provide clear instructions and support to assist the community in using the facility effectively.
Provide clearly marked drop-off points for various waste streams including green waste, recyclables, general waste, e-waste and other materials. Promote and encourage responsible waste disposal practices to support landfill diversion and improve resource recovery.
Regularly manage stockpiles to maintain an efficient and functional site. Ensure materials are prepared for transfer to recycling facilities or appropriate disposal sites.
Encourage community engagement and environmental responsibility through the facility’s role in reducing landfill, conserving resources, and supporting Council’s broader sustainability goals.
• User Pays Investigation - Investigate opportunities to achieve a 'user pays' model for waste transfer station services.
Our service goal:To plan, procure and deliver capital renewal and upgrade projects that align with Council’s Infrastructure Asset Management Plan, ensuring infrastructure meets the needs of the community now and into the future.
What We Deliver
Capital Renewal & Upgrade – All Asset Classes
Infrastructure Procurement
Flood Prevention & Levee Maintenance
How We Deliver It
Scope, plan and deliver capital works across all asset categories including roads and transport, stormwater, CWMS, buildings, public domain infrastructure, irrigation, and plant and equipment.
Manage procurement activities to support the delivery of capital projects, ensuring processes align with Council’s procurement policy and value-for-money principles.
Deliver flood mitigation projects and pursue levee bank management improvement to support emergency preparedness and future flood resilience. Support planning and response in coordination with relevant stakeholders
Key initiatives
• Levee Bank Advocacy - Participate in the River Murray Levee Bank Advisory Committee to advocate for improved management and maintenance outcomes for flood levees within Renmark, Paringa and Lyrup.
Our service goal:To maintain clean, safe and visually appealing streets through regular sweeping that supports public amenity, environmental health and stormwater system performance.
Street Sweeping
Conduct scheduled and responsive street sweeping to remove debris, improve road safety, enhance appearance, and prevent blockages in stormwater systems.
Our service goal: To coordinate the planning, management and renewal of Council’s infrastructure and assets to ensure they are safe, sustainable and aligned with community needs, financial capacity and long-term strategic objectives.
Asset Management Planning
Capitalisation & Asset Register Maintenance
Technical Asset Advice
Development-Related Infrastructure Advice
Infrastructure Permits
Heavy Vehicle Access Assessments
GIS Management
Asset Management System Oversight
Develop and maintain Council’s Infrastructure and Asset Management Plan (IAMP) and related policies to guide asset renewal and development in line with the Long Term Financial Plan and Community Plan.
Update the asset register following completion of capital projects to ensure accurate financial and asset reporting.
Provide asset condition and lifecycle input into maintenance and capital works programs, including renewal and upgrade planning.
Assess infrastructure provisions in development applications and land divisions to ensure future asset sustainability and integration.
Assess and approve infrastructure-related permit applications for works on Council land.
Assess and process National Heavy Vehicle Regulator (NHVR) permit applications via the national portal.
Develop, maintain and implement Geographic Information System (GIS) services to support asset and infrastructure planning and spatial analysis.
Maintain the integrity and functionality of Council’s Asset Management System to support informed decision-making and long-term planning.
• Asset Management Improvement - Deliver the Asset Management Improvement Plan, with oversight from the Asset Committee.
• Condition Assessments - Conduct condition assessments for the stormwater, building and transport asset classes, in accordance with the IAMP and accounting standards.
• Stormwater Management - Update Stormwater Management Plans for Renmark and Calperum Industrial Estate.
Our service goal: To provide reliable and safe public lighting that enhances community safety and amenity, through effective management and maintenance aligned with regulatory agreements. What
Public Lighting Maintenance
Manage public lighting in accordance with the SA Power Networks agreement and approved tariffs. Conduct in-house inspections and coordinate repairs through licensed external contractors.
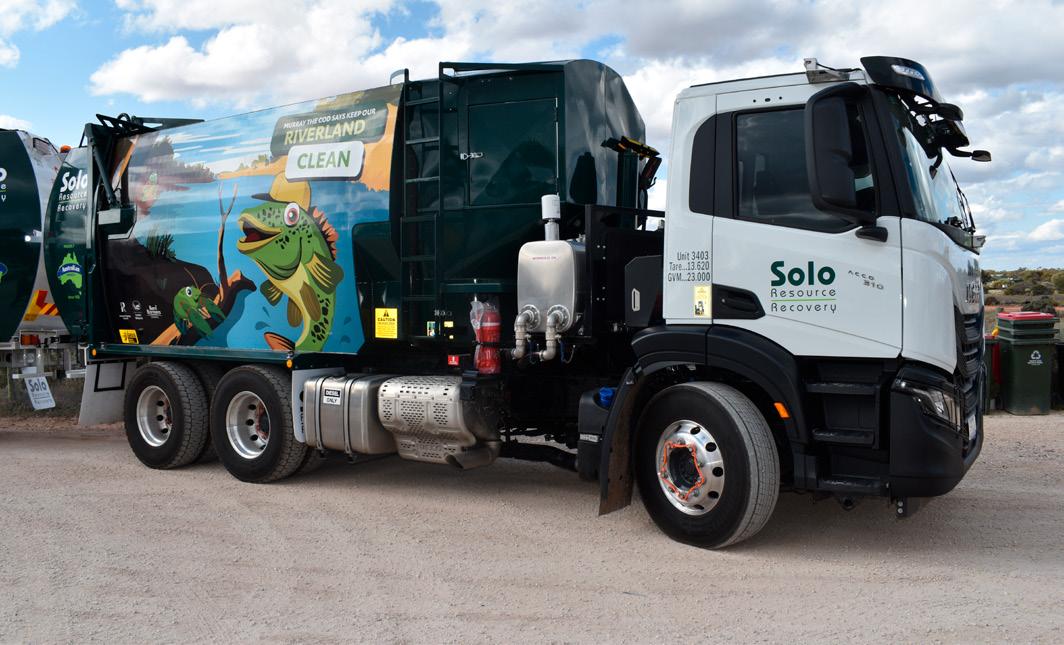
Our service goal: To deliver reliable and environmentally responsible kerbside waste collection and strategic waste management services that support a cleaner, more sustainable community, promote the circular economy, and seek efficiencies through strong partnerships with regional authorities. What We Deliver How We Deliver It
Kerbside Waste Services
Ensure reliable waste, recycling, and organics collection for households and businesses, supported by clear communication, low-emission vehicles, accessible customer service, and community education to boost recycling quality and public participation.
Strategic Waste Management
The strategy emphasises long-term waste reduction, resource recovery, and landfill diversion by promoting a circular economy through reuse, recycling, and composting. It leverages regional collaboration, data-driven decisions, and community engagement to ensure effective, evidence-based outcomes.
• MRLGA Regional Waste Strategy - Advance key priorities from the MRLGA Regional Waste Strategy in collaboration with regional partners, focusing on community education to improve bin use, enhance resource recovery, support a circular economy, and manage rising costs.
Total Council Budget Committed
Operating: $3,902,544
Capital: $4,025,000
Our service goal: To provide well-maintained parks that offer welcoming, usable spaces for relaxation, play and connection, enhancing the everyday experience of residents and visitors.
Park Grounds Maintenance
Undertake regular mowing, weed control and general upkeep of lawns and garden areas.
Tree Care and Management
Irrigation Monitoring and Maintenance
Hazard Management and Remedial Works
Event Readiness and Site Support
Inspect, trim and, where necessary, remove trees to maintain safety and tree health. Includes both scheduled works and reactive responses.
Conduct operational and condition-based inspections of irrigation systems to ensure efficient water use and healthy turf and plantings.
Carry out routine inspections to identify and address safety risks, ensuring park areas are safe and accessible.
Prepare and maintain park areas to support community events, including pre-event inspections and any necessary remedial action.
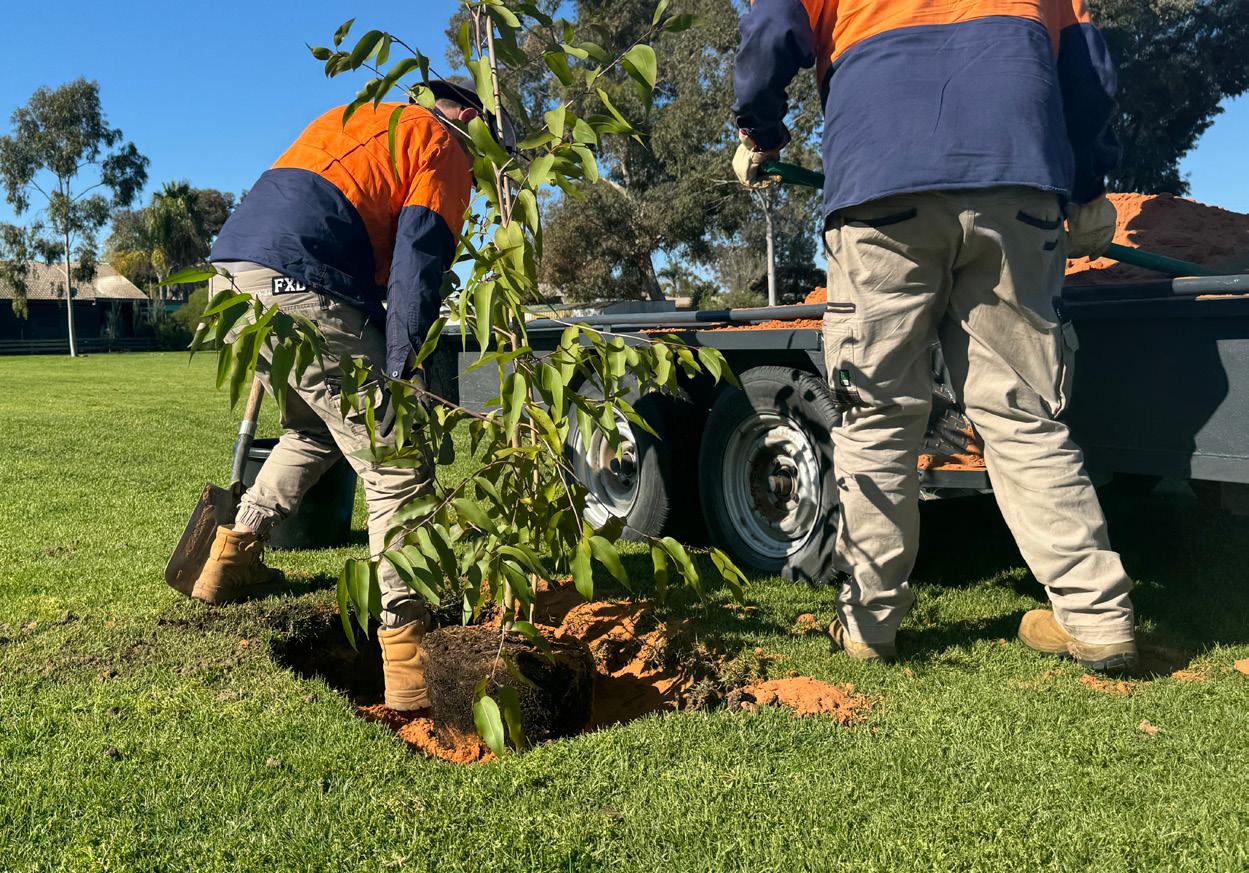
• Tree Planting - Undertake annual tree planting program in accordance with the Greening Renmark Paringa Plan.
• Swim Beach Options - Investigate options for riverbank stabilisation at the New Landing Way swimming beach.
Our service goal: To provide inviting, accessible and functional open spaces that encourage community gathering, active lifestyles and recreational enjoyment across all ages and interests
Accessible Recreational Spaces
Ensure public access to open space areas, including playgrounds, cycling tracks, recreation spaces and skate parks, is available 24/7 for community use.
Playground & Skate Park Inspections
Playground & Skate Park Maintenance
Cycling Track Monitoring & Maintenance
Alan Coulter Recreation Centre
Renmark Swimming Centre
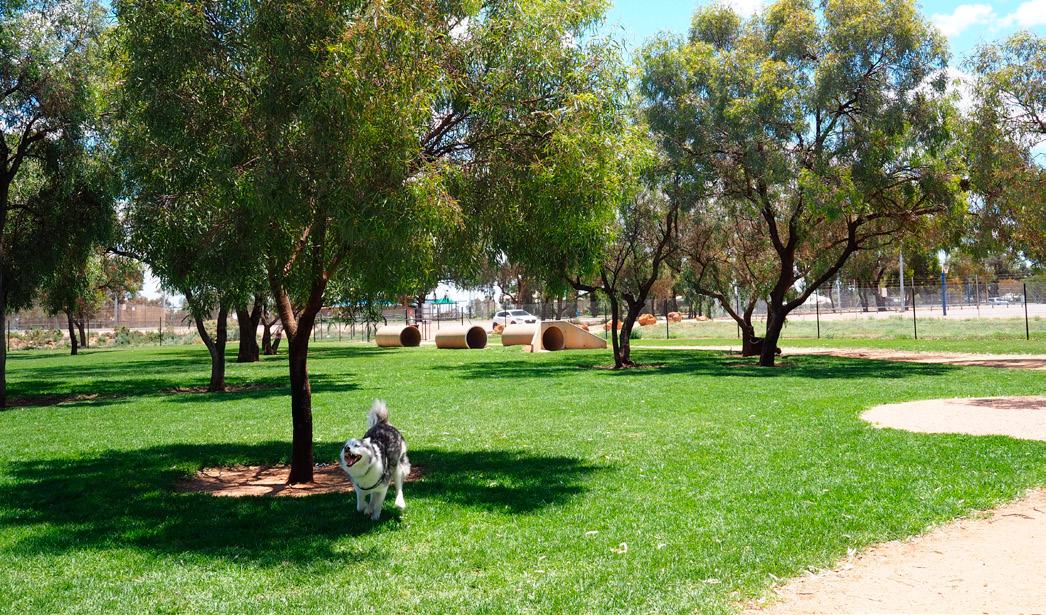
Dog Park
Conduct regular inspections by trained staff to ensure compliance with relevant safety and quality standards.
Deliver both planned maintenance and unplanned, reactive maintenance to keep facilities safe and operational.
Monitor condition and undertake necessary maintenance such as asphalt repair and vegetation control.
Provide and maintain a multi-use indoor facility including sports courts, gym, indoor pool, and supporting recreation amenities to promote community health and well-being.
Operate and maintain a competition-standard 50m pool, intermediate pool, and toddler pool set within landscaped grounds for seasonal community use and aquatic programs.
Maintain a dedicated area with separate zones for small dogs, park furniture, and dog recreation facilities set among trees and turf to support safe and enjoyable off-leash play.
• Cycleway Renewal - Undertake the first stage of surface renewal on the Renmark to Paringa cycleway.
• Indoor Pool Upgrades - Deliver an upgrade to the indoor pool filtration and heating plant, at the Alan Coulter Recreation Centre to provide a modern, compliant and energy efficient facility.
• Alan Coulter Remediation - Further investigate improved community facilities within the Alan Coulter Recreation Centre, within the planning for the replacement of the mezzanine floor and roofing remediation.
• Soccer Clubroom Funding Advocacy - Advocate for an appropriate funding model for the development of soccer clubroom facilities at the Steve Poutakidis Sports Ground.
• Netball Court Upgrades - Deliver grant funded upgrades to the Renmark Netball Courts lighting and court surfacing to modern standards.
• Playground Replacement - Undertake planning for the replacement of the playground at the Jarrett Memorial Gardens.
Our service goal: To ensure jetties, wharves, lookouts and boat ramps are safe, functional and wellmaintained through regular inspections and timely response to community feedback.
Boat Ramps
Lookouts
Jetties and Wharves
Conduct quarterly inspections by trained staff in line with safety standards. Address issues identified through inspections, customer requests or phone calls.
Inspect lookouts quarterly to identify and address any safety hazards or maintenance needs, responding to feedback and customer reports.
Perform quarterly inspections of jetties and wharves in accordance with relevant standards. Address risks and issues through corrective actions and community feedback channels.
• Boat Ramp Upgrade - Undertake upgrade of the Bert Dix Park Boat Ramp in alignment with modern standards.
Total Council Budget Committed
Operating: $1,118,549
Our service goal: To protect public health and environmental safety through proactive inspections, investigation, education and enforcement in line with legislative responsibilities.
Wastewater System & Plumbing Assessments
Food Safety & Public Health
High-Risk Manufactured Water Systems
Legislative Compliance Audit
Vector Control (Mosquitoes)
Public Pools & Spas
Communicable Disease Control
Unsanitary Living Conditions
Personal Services (Skin Penetration & Beauty)
Assess on-site wastewater disposal systems and undertake plumbing inspections in accordance with legislation and development approvals.
Inspect food businesses as part of the Risk-Based Inspection Program. Manage food recalls, investigate complaints and assess new food business applications.
Register and inspect cooling towers and warm water systems to manage Legionella risk and ensure compliance.
Undertake biennial audits to ensure compliance with environmental health legislation and public health standards.
Conduct mosquito surveillance and control activities. Provide education and investigate potential breeding sites when required.
Inspect public swimming pools and spas and investigate healthrelated complaints to ensure water quality and patron safety.
Investigate notifiable diseases and respond in accordance with SA Health protocols.
Investigate complaints related to hoarding, squalor and other unsanitary conditions, providing education and enforcement as necessary.
Inspect beauty salons, tattoo studios and hairdressing premises. Investigate complaints and provide guidance to ensure compliance with hygiene standards.
Our service goal: To manage Council’s building, planning and regulatory functions in a way that is responsive, consistent and relevant to the current and future needs of the community ensuring development, safety and amenity are supported through clear processes and effective compliance.
Development Assessment
Assess and issue planning, building and development approvals in accordance with statutory timeframes and relevant legislation.
Building Assessment & Inspections
Strategic Growth Planning
Animal Management
Public Nuisance & Compliance
Pest Plant & Animal Control
Dry Zone Enforcement
Crime Prevention Support
Emergency Services Coordination
Assess buildings against the Planning, Development and Infrastructure Act and National Construction Code. Conduct inspections to ensure compliance with statutory requirements.
Lead the development and implementation of Council’s Growth Strategy to guide land use, infrastructure planning and population growth.
Administer dog and cat registrations annually, respond to reports of strays, and manage nuisance animal complaints in line with the Dog and Cat Management Act.
Investigate and enforce breaches under the Local Nuisance and Litter Control Act, the Local Government Act and Council By-Laws, including noise, litter and illegal dumping.
Monitor and manage declared pest species in accordance with legislative obligations and community expectations.
Support SAPOL and ensure compliance with designated alcohol-free zones under local and state legislation.
Enforce Council By-Laws, report concerns to SAPOL, and support initiatives that promote a safe public environment.
Participate in Zone Emergency Management Committee (ZEMC) meetings and liaise with emergency service agencies to ensure preparedness and response coordination.
• Animal Management Plan - Undertake review of the Animal Management Plan, incorporating improvements requested during the latest Community Satisfaction Survey.
Total Council Budget Committed
Operating: $4,989,629
Capital: $2,658,738
Our service goal: To manage and maintain a safe, compliant and accessible aerodrome that supports regional connectivity and meets aviation regulatory standards.
Airport Operations
Airport Maintenance
Oversee day-to-day operations of the unmanned aerodrome, ensuring compliance with CASA regulations and the Manual of Standards Part 139. Provide phone-based support and coordinate stakeholder communications as required.
Undertake regular maintenance of runway surfaces, lighting, fencing and grounds to ensure operational safety, visibility and site integrity.
• CFS Reloading Infrastructure - Establish a dedicated aerial water and fuel reloading base for the South Australian Country Fire Service.
Our service goal: To provide and maintain safe, accessible and functional road surfaces across the district by delivering effective maintenance of sealed and unsealed roads, signage, and roadside environments.
Unsealed Road Maintenance
Sealed Road Maintenance
Road Signage Maintenance
Stormwater Diversion
Roadside Slashing
Weed Spraying
Undertake planned and reactive maintenance activities, including patrol grading and minor resheeting, to maintain safe and accessible unsealed roads and laneways.
Deliver a program of patching, pothole repairs and minor resealing to maintain safe surfaces on sealed roads and laneways.
Inspect, maintain and replace regulatory, directional and warning signs across the road network, including line marking where required.
Capture and divert stormwater through the drainage network to appropriate disposal points to prevent localised flooding and protect infrastructure.
Conduct routine slashing along sealed and unsealed roads to improve visibility and ensure road safety.
Implement seasonal spraying programs along road corridors to manage vegetation and maintain road safety.
• Road Paving - Undertake road pavement replacement on Industry Road, Twentieth Street and Patey Drive, Renmark.
• Collaboration Opportunities - Pursue opportunities to increase capacity and deliver improved services through agreements with other authorities (e.g DIT).
• Resealing - Conduct road resealing in accordance with the IAMP.
• Resheeting - Conduct road resheeting in accordance with the IAMP.
Our service goal: To provide safe, accessible and well-maintained parking spaces that support access to local services, businesses and community facilities.
On-Street Parking Maintenance
Off-Street Parking Maintenance
Carry out ad-hoc maintenance including surface patching, line marking, sign replacement, kerbing repairs and lighting upkeep to ensure parking spaces are safe and accessible.
Maintain off-street car parks with works such as surface repairs, line marking, signage, lighting, kerbing and vegetation management to ensure functionality and user safety.
Our service goal: To provide safe and accessible footpaths and walkways that support active transport, reduce hazards, and contribute to a connected and walkable community.
Footpath Maintenance
Kerb and Water Table Maintenance
Inspect and repair minor and major trip hazards to ensure safe pedestrian access across the Council area, in accordance with the IAMP.
Repair or replace damaged kerbing as needed to support drainage function and maintain streetscape safety and appearance, in accordance with the IAMP.
Total Council Budget Committed
Operating: $1,433,014
Capital: $585,120
Our service goal: To provide a secure, stable and responsive ICT environment that supports daily operations, enables modernisation and delivers continuous improvement across Council systems.
WHS Systems & Compliance
Risk Management
Incident & Injury Management
WHS Training & Inductions
Maintain and review Council’s Work Health Safety Management System (WHSMS) in line with legislation and best practice. Develop and implement WHS policies, procedures, audits and corrective actions.
Identify, assess and monitor risks across events, operations, contractors, and public assets. Maintain Council’s strategic, operational and civil liability risk registers.
Coordinate reporting, investigation and response to workplace incidents and near misses. Manage return-to-work processes, health monitoring and injury support.
Deliver and coordinate training and induction programs for staff, contractors and volunteers. Maintain training needs analysis and ensure mandatory training is up to date.
Emergency & Contractor Management
Chemical & Asset Safety
Consultation & Reporting
Maintain emergency preparedness plans and coordinate site safety requirements including first aid and evacuation. Manage contractor compliance and documentation.
Maintain chemical registers, signage and SDS across sites. Conduct safety inspections across Council assets including cemeteries, playgrounds, work areas and public spaces.
Engage with staff and stakeholders to continuously improve safety and risk processes. Monitor, review and report on WHS and risk performance across the organisation.
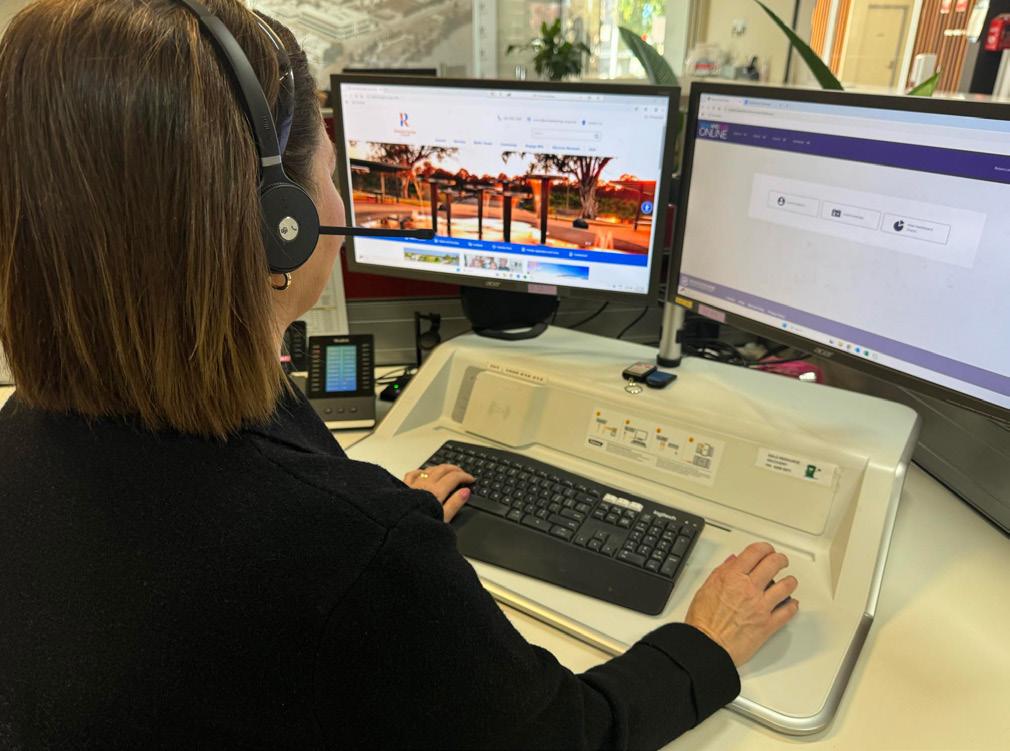
Our service goal: To deliver accessible, responsive and respectful customer service across all channels, making it easy for our community to interact with Council, access services, and get the information they need.
General Enquiries & First Point of Contact
Payments & Transactions
Customer Requests & Follow-up
Facility Bookings & Room Hire
Provide in-person, phone and email support to assist the community with enquiries about Council services, including rates, animals, cemeteries, bookings and more. Refer enquiries to the right staff when specialist advice is required.
Accept payments for rates, invoices and other services at the counter or by phone, with secure handling and accurate daily reconciliation.
Log and assign customer requests to the appropriate officer using Council’s internal system, ensuring timely responses and follow-up.
Coordinate bookings for Council facilities and meeting rooms, ensuring smooth arrangements and appropriate setup.
Our service goal: To deliver accessible, responsive and respectful customer service across all channels, making it easy for our community to interact with Council, access services, and get the information they need.
Maintain a fit-for-purpose fleet including heavy plant, light vehicles, and machinery to support service delivery.
Fleet Management
Fleet Maintenance
Monitor usage, fuel efficiency, and lifecycle costs to inform replacement schedules and optimise value.
Procure vehicles in line with Council policy, sustainability targets, and operational needs. Support staff training and induction to promote safe and responsible fleet use.
Conduct scheduled servicing, repairs, and inspections to ensure vehicles remain safe, roadworthy, and compliant.
• Plant Replacement - Undertake plant replacement in accordance with the IAMP.
Our service goal: To provide transparent, accountable, and forward-thinking leadership that ensures sustainable service delivery and aligns with the long-term needs of the community.
Integrated Strategic and Business Planning
Transparent Governance and Reporting
Continuous Improvement and Innovation
Community and Stakeholder Engagement
Workforce Planning and Development
Risk and Compliance Management
Advocacy Planning and Action
Develop and maintain a suite of strategic documents (e.g., Strategic Plan, Long Term Financial Plan, Asset Management Plan) to guide Council’s long-term direction.
Ensure decision-making is open, accountable and informed through regular reporting and community engagement.
Apply data, feedback, and internal reviews to identify efficiency opportunities and embed a culture of innovation.
Actively engage with residents, businesses and other stakeholders to ensure strategic priorities reflect community needs.
Invest in staff capabilities, succession planning, and a positive workplace culture to support effective service delivery.
Implement frameworks to identify, assess, and manage risks, and ensure compliance with legislation and regulations.
Identify and endorse key priorities aligned with community needs through strategic planning and consultation. Build strong relationships with government representatives, regional alliances, and peak bodies to influence decision-making.
• Growth Stategy - Explore opportunities to investigate the feasibility of short-term priorities from the Growth Strategy.
• Advocacy Plan - Finalise and activate the Advocacy Plan to ensure our engagement with other authorities leverages the best outcomes for our community.
• Strategic and Operational Risk Management - Review and update risk management, policy and framework. Commence the development of an Operational Risk Register.
Our service goal: To support informed and transparent decision-making and promote civic pride by facilitating Council meetings, delivering citizenship ceremonies, and supporting councillor induction and development.
Council & Committee Meetings
Citizenship Ceremonies
Councillor Induction & Professional Development
Coordinate open and accessible Council and committee meetings that enable transparent and accountable decision-making in the community’s interest.
Plan and deliver official citizenship ceremonies that welcome new Australians and celebrate community inclusion.
Provide induction programs for new councillors and facilitate ongoing professional development to support effective governance and leadership.
Our service goal: To support a capable, healthy and high-performing workforce by delivering compliant, fair and forward-looking people management practices, aligned with Council’s strategic and operational needs.
Recruitment & Onboarding
Staff Development & Performance
Workplace Culture & Wellbeing
Employee Relations & Support
Compliance & Policy Management
Attract and welcome skilled people into the organisation through clear processes and positive first impressions.
Support continuous learning and growth through training, development planning and performance reviews.
Promote a positive workplace culture through employee support, wellbeing initiatives and recognition programs.
Provide fair, consistent HR advice and maintain constructive relationships with staff and unions.
Ensure people practices align with legislation and Council policies to support a safe, respectful and compliant workplace.
Our service goal: To provide a secure, stable and responsive ICT environment that supports daily operations, enables modernisation and delivers continuous improvement across Council systems.
User Support Services
ICT Infrastructure Management
ICT Projects & Innovation
ICT Planning & Administration
Strategic ICT Review
Provide responsive helpdesk support for software, hardware, systems administration, and incident response. Maintain documentation and ensure timely resolution of ICT issues.
Maintain the core ICT environment including servers, backups, cybersecurity, patching, network infrastructure and resource monitoring to ensure system stability and security.
Identify, test and implement new systems, technologies and business improvements that support Council’s operational and strategic goals.
Manage ICT budgeting, asset tracking, service reviews, procurement, contract management and vendor negotiations to ensure efficient delivery of services and infrastructure.
Lead and contribute to regular reviews of the joint ICT strategy to ensure alignment with organisational needs and emerging technologies.
Our service goal: To ensure accurate, secure and compliant information management practices that support Council decision-making, accountability and access to information.
Records Management
Maintain Council’s electronic and physical records in line with legislation and best practice, ensuring secure, accurate and accessible information storage and retrieval.
Mail & Correspondence Handling
Information Compliance & Governance
Policies, Procedures & Reviews
Training & Support
Receive, register and distribute incoming correspondence (electronic and physical) according to policy and classification standards.
Ensure compliance with the State Records Act and other legislative requirements, including Freedom of Information (FOI) management, data integrity, audits and reporting.
Develop and maintain policies and procedures related to records and information management, incorporating consultation and continuous improvement.
Provide onboarding and ongoing training to staff and elected members on the use of Council’s information systems and record keeping requirements.
Our service goal: To provide sound financial management and governance that ensures Council remains financially sustainable and able to deliver services to the community. This includes financial planning, reporting, budgeting, rates, payroll and revenue management.
Financial Planning & Reporting
Rates & Revenue Management
Accounts Payable & Receivable
Prepare Council’s budget, Long Term Financial Plan and financial statements. Manage external audit processes, grant acquittals and compliance reporting including tax obligations.
Administer rates modelling, declarations and collections. Provide timely and accurate responses to property and rating enquiries including rate searches.
Treasury & Cashflow Management
Payroll
Leasing & Houseboat Management
Insurance Management and Claims Response
Process supplier payments and issue invoices for services. Manage income collection and follow-up to ensure timely payments.
Monitor Council’s cash flow and borrowing needs to ensure liquidity and alignment with financial policies and objectives.
Process payroll in accordance with EBAs and award conditions. Manage staff entitlements, on-cost allocations and ensure timely and accurate payment.
Manage leases and licences for Council-owned assets and act as the central contact for all houseboat-related transactions and fees.
Management of Council's diverse portfolio of insurances for assets, motor vehicles, public liability, professional indemnity, workers' compensation and income protection. As well as adhoc claims management.
• Internal Audit Function - Procure the services of an internal auditor.
• Fees and Charges Policy - Develop a formal Fees and Charges Policy to outline service recovery initiatives.

The 2025/26 Annual Business Plan and Budget has been developed in accordance with sound financial management principles, ensuring the ongoing sustainability of our community while maintaining the services and infrastructure our residents rely upon.
This year’s planning process is underpinned by several key assumptions, including a Consumer Price Index (CPI) of 2.2% based on the March Quarter Adelaide CPI. Wages have been adjusted in line with this CPI, with an additional 0.5% increase in superannuation contributions as legislated. While external cost pressures such as insurance premiums (forecast to rise by approximately 5%) and waste management are increasing, Council remains committed to delivering existing services and maintaining current staffing levels.
A core component of the budget is the continued investment in the renewal of
Council’s existing asset base, aligned with the Infrastructure Asset Management Plan.
The move towards full cost recovery for waste services reflects Council’s commitment to financial responsibility, while ensuring environmental and operational sustainability. Additionally, the Financial Assistance Grant is assumed to continue with current levels of indexation and prepayment arrangements.
Council will continue advocating its position that regional councils are disadvantaged when it comes to Financial Assistance Grants and call for a review of how the grants are distributed.
This Business Plan and Budget reflects a balanced approach to managing inflationary impacts, sustaining service delivery, and maintaining our infrastructure, while ensuring the financial health of the Council into the future.
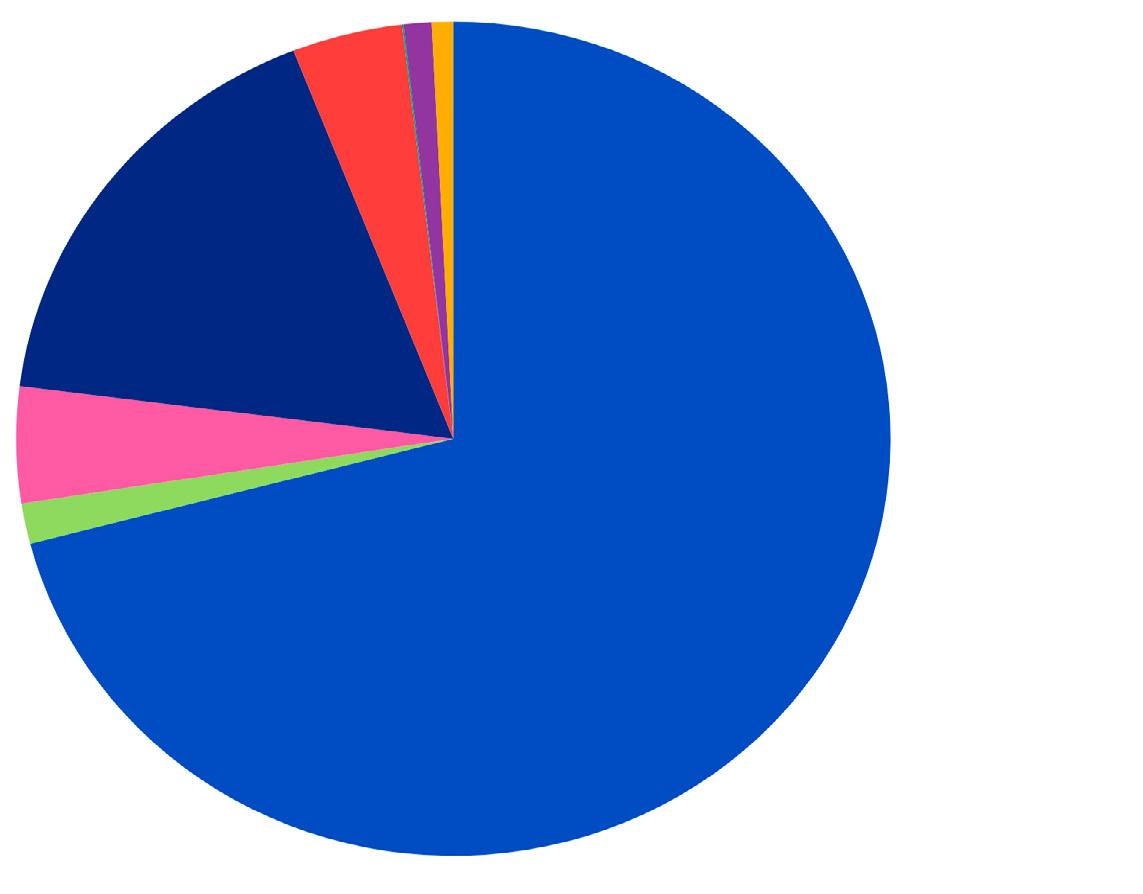
l Rates (70.96%)
l Statutory Charges (1.56%)
l User Charges (4.50%)
l Grants, Subsidies and Contributions - operating (17.03%)
l Grants, Subsidies and Contributions - capital (4.09%)
l Investment Income (0.05%)
l Reimbursements (1.03%)
l Other Income (0.79%)
l Employee Costs (31.75%)
l Finance Costs (0.40%)
l Depreciation, Amortisation and Impairment (27.39%)
l Materials, Contracts and Other Expenses (40.46%)

Council is projecting an adjusted operating deficit after capital items of $884,000 for 2025/26. Council’s projected operating deficit unadjusted is $6,000. Council is striving to return to an operating surplus within the next 3-4 financial years.
Over 70% of Council’s income is derived from rates. To reduce the impact on ratepayers Council has cut 6% of its total materials and contracts budgets from adopted budgets in 2024/25 and committed to further reviews of potential reductions in the 2025/26 financial year.
Rates are a tax on properties levied in accordance with the Local Government Act 1999. Council’s budget indicates $10.568 million (before discretionary adjustments) will be required to meet the cost of delivering services and projects to the community in 2025/26.
Further information about the rating increase can be found in the FAQ section on the Engage RPC Annual Business Plan project page.
The proposed residential rate is an average increase of $147 per annum. The fixed charge remains $424 per annum. This is made up of a fixed and differential portion as detailed below. Renmark Paringa Council is a comparatively low rating council, and was the second lowest rating council in the Riverland and Murraylands for the 2024/25 financial year.
Renmark Paringa Council uses a Capital Value Method for valuing properties which encompasses the value of the land and all improvements upon it.
*Rates current as per the Office of the Valuer General data received at 9 June 2025.
All land within the Renmark Paringa Council area is deemed rateable unless it is specifically exempted by s147 of the Local Government Act 1999. The Local Government Act allows councils to raise revenue through the use of a differential rating system. Differential rating uses Land Use Codes to apply different rates to varying land and property uses.
Council uses a differential rating system to raise revenue based on its Land Use to ensure a fair and equitable distribution of rates within Renmark Paringa Council.
The differential rate is charged in addition to the fixed rate. In 2025/26 Council proposes 77% of its general rating income will be derived from the differential rate portion.
A fixed charge is levied against the whole of an allotment (including land under a separate lease or licence) and only one fixed charge is levied against two or more pieces of adjoining land (whether intercepted by a road or not) if they are owned by the same owner and occupied by the same occupier. Also, if two or more pieces of rateable land within the area constitute a single farm enterprise, only one fixed charge may be imposed against the whole of the land.
The reasons for imposing a fixed charge are:
1. We consider it appropriate that all rateable properties make a contribution to the cost of administering our services.
2. We consider it appropriate that all rateable properties make a contribution to the cost of creating and maintaining the physical infrastructure that supports each property.
We are limited to the amount that can be raised by the fixed charge, in that it cannot raise above 50% of its general rate revenue from the fixed charge component. In 2025/26 we have forecast to raise 23% of our general rate revenue by way of the fixed charge.
The Regional Landscape Levy is a State Government tax used to fund the operations of South Australia’s regional landscape boards, which are responsible for the management and protection of our natural landscapes and resources.
Councils are required to collect this levy on behalf of the State Government. We do not retain any of the funds raised, nor do we control how the money is allocated. In our region, the levy helps support the work of the Murraylands and Riverland Landscape Board.
All property owners contribute to this levy, which is calculated based on the capital value of each rateable property. For the 2025/26 financial year, the Murraylands and Riverland Landscape Board has set Council’s total contribution at $388,483. This amount will be recovered through a rate in the dollar applied to property capital values.
A healthy landscape benefits everyone, which is why this levy applies across all properties in our district.
If you are a holder of a pensioner concession card, DVA gold card, low income health care card or commonwealth senior health card you may be eligible to receive the Cost of Living Concession through the State Government. The Cost of Living Concession replaced the council rate concession and is intended to help those on low or fixed incomes with their cost of living expenses, such as council rates.
The Local Government Act requires Councils to rebate the rates payable for certain land uses. This includes land used for health and community services, religious purposes, cemeteries and educational institutions. The rebates vary from 75% to 100%.
We have the authority to provide discretionary rebates in certain circumstances. All discretionary rebates are only considered on application and must be received by 30 April for consideration in the following financial year.
If you own two or more pieces of land in which the Land Use is Primary Production, you may be eligible for the Single Farm Enterprise Rebate. Single Farm Enterprise means land which is used entirely or mainly for the business of primary production as a single enterprise and is occupied by the same person or persons. The land that constitutes the Single Farm Enterprise need not be adjoining parcels of land.
Section 182 of the Local Government Act permits us, on the application of the ratepayer, to partially or wholly remit rates or to postpone rates, on the basis of hardship. Where the
ratepayer is suffering hardship in paying rates they are invited to contact the Council’s Rates Officer on 8580 3000 to discuss the matter. Council treats such inquiries condentially.
Applications may be made to Council for a postponement of the payment of any amount of rates in excess of $500.00, for the current or a future financial year by:
q A ratepayer who holds a current State Seniors Card issued by the State Government, (prescribed ratepayer) or spouse of a prescribed ratepayer, and
q Where the rates are payable on the principal place of residence, and
q Where the land is owned by the prescribed ratepayer, or the prescribed ratepayer and his or her spouse, and no other person has an interest, as owner, in the land.
Any rates which are postponed will become due and payable:
q When the title to the land is transferred to another person; or
q There is a failure to comply with a condition of postponement.
q Interest will accrue on the amount postponed at the prescribed rate per month until the full amount is paid.
*Postponement is available as a right and can only be refused when the applicant/s has less than 50% equity in the property.
Council may impose an annual service charge on land (both rateable and non rateable) within the area to which it provides or makes available a prescribed service. Renmark Paringa Council proposes two service charges for the 2025/26 year.
CWMS service charges are levied against all properties currently connected to, or with the ability to connect to, the CWMS Scheme. In 2024/25, Council undertook an external review of its CWMS accounting methodology and pricing structure.
As a result, the 2025/26 CWMS charge reflects a completely revised pricing method. There is no direct comparison with previous years due to the adoption of a new full cost recovery and userpays approach. This ensures that the total cost of providing the CWMS service is recovered fairly from those who benefit from it.
Renmark Paringa Council has adopted the Essential Services Commission of South Australia’s (ESCOSA) 2018 advice on CWMS price setting and aligned its
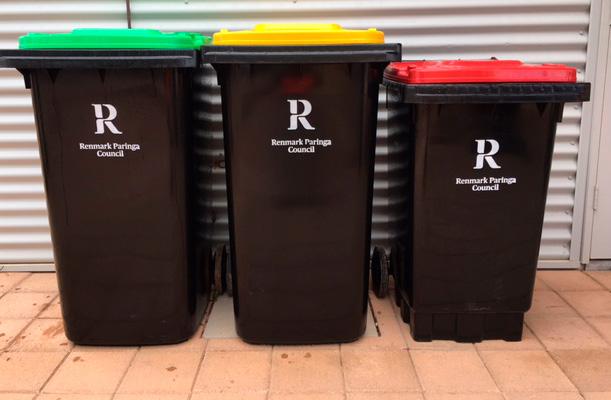
The Waste Management Charge is calculated based on the total cost for the provision of a kerbside collection service and disposal of waste related to kerbside collection. This service is provided to town residential and rural residential, with service charges based on the provision of a threebin system for Town Residential properties and a two-bin system for Rural Residential properties.
In 2025/26 the proposed Waste Management Service Charges are:
q $380 for Town Residential
q $285 for Rural Residential
pricing with the National Water Initiative Pricing Principles. All proposed charges are underpinned by Council’s new 20-year CWMS pricing model, developed in 2024/25.
The proposed CWMS service charge for 2025/26 is $793 per property unit, representing a comparable rate to that of similar-sized councils. Council proposes to raise $2.913 million through this charge to fully fund the operation, maintenance, renewal and long-term sustainability of the CWMS network.
Further details, including a fact sheet outlining the proposed changes, can be found in the FAQ section on the Annual Business Plan Engage RPC project page.
The Waste Management Service Charge is levied against all properties eligible to receive the Waste Collection Service.
Council proposes to raise $1.554 million from its Waste Management Charge in 2025/26 to fully recover the cost of providing a kerbside collection service and associated costs related to the disposal of collected waste.


As part of recent local government reforms, an independent advisory scheme has been introduced to give you greater confidence that councils can continue delivering the services you value, without placing an unnecessary burden on ratepayers.
The Essential Services Commission of South Australia (ESCOSA) oversees this scheme and provides independent advice to councils about their financial sustainability. While the advice is not binding, councils are required to publish the advice and, if they choose to respond, include that response in their Annual Business Plan. This process ensures greater transparency and adds value by giving ratepayers and stakeholders an informed view of council plans.
Renmark Paringa Council has been part of the most
recent tranche of councils reviewed under the scheme. Council administration has worked closely with ESCOSA throughout the process, responding to queries and providing the necessary data for ESCOSA to prepare its report.
While the report identifies some challenges to achieving long-term financial sustainability, it does not fully account for the significant financial impact of the 2022 River Murray flood event. Prior to this, Council was in a sound financial position.
As we move forward, our focus is on responsible budget repair. This includes diversifying revenue sources, reducing operating expenditure where possible, and maintaining essential services for our community.
Use a credible independent source for, or as the basis of, its inflation assumption, identify and explain any variations from that source and apply its inflation assumption consistently across its strategic documents.
To ensure a robust and independently verified inflation assumption, current year income and expenditure adjustments, as well as the Integrated Asset Management Plan (IAMP), will be based on the real annualised March quarter Adelaide Consumer Price Index (CPI) data released by the Australian Bureau of Statistics (ABS) in late April 2025. The ABS serves as a credible and independent source for inflation measurement.
Where specific assumptions, such as insurance cost increases, necessitate variations from the ABS-derived CPI rate, these variations will be clearly identified and substantiated within the body of the annual business plan, ensuring transparency and accountability.
Review its inflation forecasts in its budget and forward projections each year and clearly identify these and other assumptions underlying revenue and cost estimates in its Annual Business Plan and Long Term Financial Plan.
Consider alternative revenue generation sources, including grant funding and user charges that reflect the service provision costs.
For the current updates to the Infrastructure Asset Management Plan (IAMP) and Long Term Financial Plan (LTFP), a consistent annual inflation rate of 2.5% has been applied over the 10-year planning horizon. This rate is aligned with the Reserve Bank of Australia's (RBA) inflation target, specifically the midpoint of their 2% to 3% range, reflecting a prudent and widely recognised economic benchmark. To ensure transparency and accountability, all variations from this 2.5% inflation assumption, as well as other significant assumptions underpinning revenue and cost projections, will be clearly documented and explained within the body of the respective strategic documents, in accordance with best practice financial planning.
Council is committed to diversifying revenue streams and aligning user charges with the true costs of service delivery. To this end, independent reviews are currently underway: LGiQ is conducting a comprehensive review of the Council's Fees and Charges structure, supported by the Financial Sustainability Pilot Program, while BRM Advisory is reviewing the Community Wastewater Management Scheme (CWMS) accounting methodology and pricing. In parallel, the current budgeting process incorporates a detailed analysis of the full costs associated with service provision, enabling a thorough assessment of the adequacy of existing charges. Recognising the strategic importance of grant funding, Council staff are actively pursuing grant opportunities as a priority. Council's preference is to secure grants that directly contribute to offsetting operating expenses and funding essential capital asset renewals, thereby enhancing long-term financial sustainability.
To ensure realistic and achievable expense estimates, a rigorous review of the next financial year's budget has been conducted, resulting in a 6% reduction in budgeted materials and contracts expenditure.
Review its forecast expense estimates, including for depreciation, to ensure they are realistic and achievable.
Regarding depreciation, a substantial increase has been observed over the preceding two financial years, with projections indicating a continued upward trend. This is directly attributable to the comple-tion of major capital works projects during the 2024/25 financial year and the implementation of detailed revaluations for critical infrastructure assets, including Irrigation, Stormwater, and Community Wastewater Management Scheme (CWMS) assets.
Report any actual and projected cost savings in its Annual Budget Plan (and Long Term Financial Plan, as appropriate), to provide evidence of constraining cost growth and achieving efficiency across its operations and service delivery.
Review the extent of cash reserves in the context of its Net Financial Liabilities Ratio outcomes, its financial sustainability outlook and its ratepayers’ capacity to pay higher rates.
Council is currently participating in a Financial Sustainability Pilot Project that includes an independent review, conducted by LGiQ, to identify resource allocation against service delivery. The report is expected to identify opportunities for operational efficiency and appropriate allocation of resources.
Noted by Council and will be included in the body of the 2025/26 Annual Business Plan.
As noted in the ESCOSA report, Council currently maintains no cash reserves. Projected operating deficits pose a risk to financial sustainability, potentially exceeding the Net Financial Liabilities Ratio limits set by the Local Government Finance Authority (LGFA).
To address this, Council is actively exploring cost and service reductions, with proposals presented to elected members during the 2025/26 budgeting process. Reviews of Community Wastewater Man-agement Scheme (CWMS) pricing and Fees and Charges are anticipated to generate increased revenue. Furthermore, Council is pursuing grant opportunities to augment income, acknowledging the inherent uncertainty of grant availability.
Rating increases will be considered only after exhausting all other options. Given the Council's low SEIFA score relative to state averages, any proposed rating adjustments will be subject to thorough community consultation, with careful consideration of ratepayer affordability.
Monitor borrowing liabilities, to ensure that levels are sustainable with reference to the operating income and any grants for capital projects that it receives.
To enhance oversight of financial liabilities, the Manager of Financial Services (MFS) will implement informational reporting, providing detailed monitoring of cash and borrowing levels, unexpended grants, contract liabilities, rates payment ratios, and other key income metrics.
Revised Long Term Financial Plan (LTFP) models will ensure adherence to the Local Government Finance Authority's (LGFA) Net Financial Liabilities ratio target of 0-100%, ensuring sustainable borrowing levels in relation to operating income and capital grant receipts.
Ensure financial forecasting practices include presenting data consistently, in either real or nominal terms, with appropriate explana-tions to provide clarity for ratepayers and other stakeholders.
Review the Infrastructure and Asset Management Plan renewal expenditure forecast in the Long-Term Financial Plan, including inflation, to better understand the impact on the Asset Renewal Funding Ratio.
To ensure consistency and clarity in financial forecasting, all future year data within the Infrastructure Asset Management Plan (IAMP) and Long Term Financial Plan (LTFP) will be presented in nominal terms, aligning with the current year's update.
Council is revising its asset accounting policy to mandate annual desktop revaluations for asset classes not subject to comprehensive revaluations. These annual revaluation adjustments, based on future year CPI estimates, have been incorporated into the LTFP and IAMP, ensuring accurate asset valuation projections.
Council is conducting a comprehensive review of its asset management practices, encompassing thorough revaluations of all asset classes and the development of detailed asset condition assessment frameworks. The data derived from this review will inform future Infrastructure Asset Management Plan (IAMP) and Long-Term Financial Plan (LTFP) projections. Pending the completion of detailed condition rating assessments, provisional accounts have been incorporated into outer year forecasts to ensure the Council's asset renewal funding ratio aligns with its budgetary objectives.
Review the estimates of asset lives and valuations, to inform its forecast rate of asset consumption and depreciation expenses.
Council acknowledges the recommendation to review asset life estimates and valuations. Council is however through the asset management review moving towards the use of condition rating assess-ments alongside depreciation data to better forecast asset consumption into the future. Depreciation is reviewed on all current and future valuations to ensure it adheres to best practice methodology and Council's asset accounting policy.
Consider providing more funding to the renewal of its assets after completing its major projects, rather than prioritising initiatives that involve new or upgraded infrastructure.
Forecast and include the impact of new assets into the LongTerm Financial Plan (including to depreciation expense) to provide transparency for existing and future ratepayers.
Council's strategic approach, as outlined in its budget and strategic documents, prioritises asset renewal funding. This is achieved through the budget lever of Infrastructure Asset Management Plan (IAMP) optimisation and proactive grant acquisition, ensuring that renewals are prioritised over the funding of new or upgraded infrastructure.
Consider limiting any further average rate increases above inflation, to help reduce any emerging affordability risk in the community.
The Long-Term Financial Plan (LTFP) and Infrastructure Asset Management Plan (IAMP) have been revised to incorporate the financial implications of new and upgraded assets.
Council acknowledges that historical Long-Term Financial Plan (LTFP) projections indicated average rate increases exceeding inflation. However, as highlighted in the ESCOSA report, Council's current financial position is unsustainable, necessitating targeted shortterm rating adjustments above CPI to achieve an operating surplus and ensure long-term sustainability. Council recognises the potential affordability impact and will prioritise alternative revenue generation and cost reduction measures before considering general rate increases.


Local Government Advice
Renmark Paringa Council
February 2025
Enquiries concerning this advice should be addressed to:
Essential Services Commission
GPO Box 2605
ADELAIDE SA 5001
Telephone: (08) 8463 4444
Freecall: 1800 633 592 (SA and mobiles only)
E-mail: advice@escosa.sa.gov.au
Web: www.escosa.sa.gov.au
The Essential Services Commission finds the Renmark Paringa Council’s projected financial performance potentially unsustainable considering the council’s planned average rate increases of 5.3 percent per annum per property over this period, planned constraint in expense growth with no indication of how that will be achieved, and asset management plans based on inadequate data.


⚠ If the Council’s forecast constraint in expense growth is not achieved, then financial sustainability will be adversely impacted.
⚠ Council asset management plans do not include adequate asset condition data, leading to inaccurate asset renewal expenditure and depreciation expense forecasts.
⚠ The financial forecasting capability of the Council appears underdeveloped, based on key strategic documents
▶ Population in 2023 was 10,107 residents
▶ Renmark Paringa Council covers 916 square kilometres
▶ 5,658 rateable properties in 2022-23
▶ $23.3 million of income in 2022-23
▶ Value of infrastructure assets held in 2022-23 equals $138.1 million
The Essential Services Commission of South Australia finds the Renmark Paringa Council’s current financial performance to be potentially unsustainable. Risks for the Council include:
• forecast constraint in expenses that may not be achievable, based on previous outcomes, with a risk of worsening operating results
• forecasts based on non-transparent inflation assumptions which differ from and are not consistently presented in either real or nominal terms
• asset management practices that require improvement, and
• continuing to increase rates above RBA forecasts of inflation (in line with the Council’s own inflation forecast assumptions).
The Council incurred six deficits in the 10-year historical period from 2013-14 to 2022-23 (average annual operating result of negative $0.1 million) and an average operating surplus ratio of negative 0.9 percent. It has forecast continuing operating deficits until 2030-31, with operating surpluses thereafter. Achievement of the forecast operating results will be dependent on delivering expense constraint; however, the available public documentation does not indicate how that will be achieved
Over the historical period, the main contributor to the Council’s expenses was ‘materials, contracts and other’ expenses at 47.1 percent per annum on average. Looking forward, ‘materials, contracts and other’ expenses are forecast to be steady, at an average 46.2 percent of total expenses. Employee expenses are forecast to grow to an average of 33.3 percent of total expenses (from 28.7 percent in the historical period) despite a forecast of no new employees (ie, the increase will be driven by an increase in the cost of current employees). ‘Depreciation’ expenses are forecast to decline from an average of 23.2 percent (of total expenses) in the historical period to 19.3 percent in the forecast period. This is stated to be the case despite the Council also proposing a significant level of new capital expenditure. In that scenario, the forecast reduction in depreciation does not appear plausible, based on current information Further, the Council has confirmed that the Long-Term Financial Plan does not factor in the impact of additional depreciation for new assets and that some asset classes have not been revalued in recent years 1 This highlights risks within the Council’s asset management model, and with its financial forecasting.
The Council appears to operate primarily on a cash basis, which may appear sustainable in the short term but may increase operational risk, and reactive rather than planned asset management, which has long-term implications for its community: in particular, that assets may fail or a reduction in service levels may occur.
At the same time, the Commission notes that the Council area experienced major flooding during the period under review, and it acknowledges that the Council dealt effectively with the consequences by pivoting capital expenditure to mitigation strategies.
The Commission has concerns regarding the reliability of the Council’s Long-Term Financial Plan and Asset Management Plans and the extent to which the Council can and does use these for long-term strategic planning. Its strategic management documents state that it understands the condition of its assets, however, the Asset Management Plans are written at a high level and include minimal information about condition assessments and service standards, with several asset classes lacking detail. If capital expenditure forecasts are adjusted for inflation, the results indicate that the Council is at risk of not spending sufficiently on asset renewal. Overall, the material available to the Commission indicates that the Council demonstrates some understanding of asset management models but is currently not translating this into its financial management strategies.
1 Discussion with Council staff on 30 January 2025.
Finally, the Commission observes that the Council’s operating sustainability is predicated on raising rates. As such, affordability risk for ratepayers may be an emerging issue that the Council will need to consider
The Commission recommends that the Renmark Paringa Council:
1. Use a credible independent source for, or as the basis of, its inflation assumption, identify and explain any variations from that source and apply its inflation assumption consistently across its strategic documents.
2. Review its inflation forecasts in its budget and forward projections each year and clearly identify these and other assumptions underlying revenue and cost estimates in its Annual Business Plan and Long-Term Financial Plan.
3. Consider alternative revenue generation sources, including grant funding and user charges that reflect the service provision costs.
4. Review its forecast expense estimates, including for depreciation, to ensure they are realistic and achievable
5. Report any actual and projected cost savings in its Annual Budget Plan (and Long-Term Financial Plan, as appropriate), to provide evidence of constraining cost growth and achieving efficiency across its operations and service delivery.
6. Review the extent of cash reserves in the context of its Net Financial Liabilities Ratio outcomes, its financial sustainability outlook and its ratepayers’ capacity to pay higher rates.
7. Monitor borrowing liabilities, to ensure that levels are sustainable with reference to the operating income and any grants for capital projects that it receives.
8. Ensure financial forecasting practices include presenting data consistently, in either real or nominal terms, with appropriate explanations to provide clarity for ratepayers and other stakeholders.
9. Review the Infrastructure and Asset Management Plan renewal expenditure forecast in the Long-Term Financial Plan, including inflation, to better understand the impact on the Asset Renewal Funding Ratio.
10. Review the estimates of asset lives and valuations, to inform its forecast rate of asset consumption and depreciation expenses.
11. Consider providing more funding to the renewal of its assets after completing its major projects, rather than prioritising initiatives that involve new or upgraded infrastructure.
12. Forecast and include the impact of new assets into the Long-Term Financial Plan (including to depreciation expense) to provide transparency for existing and future ratepayers.
13. Consider limiting any further average rate increases above inflation, to help reduce any emerging affordability risk in the community.
The State Parliament has tasked the Essential Services Commission (the Commission), South Australia’s independent economic regulator and advisory body, to provide advice on material changes proposed by local councils in relation to elements of their Strategic Management Plans (SMPs), and on the proposed revenue sources, including rates, which underpin those plans. 2
A primary purpose of the Local Government Advice Scheme (Advice or the Scheme) is to support councils to make financially sustainable strategic decisions in their Annual Business Plans (ABPs) and budgets, in the context of their Long-Term Financial Plans (LTFP)s and Infrastructure and Asset Management Plans (IAMP)s, 3 IAMPs are commonly referred to as Asset Management Plans (AMPs). The LTFP and the IAMP are both required as part of a council’s SMP. 4 Financial sustainability encompasses intergenerational equity, 5 program (service level) and rates stability in this context. 6 The other main purpose is for the Commission to consider ratepayer contributions in the context of all revenue sources, as outlined in the LTFP. 7 In addition, the Commission has discretion to provide advice on any other aspect of a council's LTFP or IAMP it considers appropriate, having regard to the circumstances of that council. 8
The first cycle of the scheme extends over four years from 2022-23 to 2025-26, and the Commission has selected 17 councils for advice in the third year (2024-25) of the Scheme, including the Renmark Paringa Council.
This report provides the Local Government Advice for the council in 2024-25.
The Council is obliged under the Local Government Act 1999 (LG Act) to publish this advice and its response, if applicable, in its 2025-26 ABP (including any draft ABP) and in subsequent plans until the next cycle of the Scheme. 9 The Council is not compelled under the LG Act to follow the advice.
The Commission thanks the Council for meeting with Commission staff and for providing information to assist the Commission in preparing this Advice.
In providing its Advice for the Council, the Commission has followed the approach it previously explained in the Framework and Approach – Final Report (F&A). 10
The Commission has considered the Council’s SMP documents (set out in the box below), with a particular focus on its performance and outlook against three financial indicators: the Operating Surplus Ratio (OSR), the Net Financial Liabilities Ratio (NFLR)and the Asset Renewal Funding Ratio (ARFR). 11
2 Amendments to the LG Act (s122(1c) to (1k) and (9)) specify the responsibilities for the Commission and local councils for the Local Government Scheme Advice. The Commission must provide advice to each council in accordance with the matters outlined in s122(1e), (1f) and (1g).
3 Commonly referred to as asset management plans.
4 The objectives of the advice with reference to a council’s LTFP and IAMPs are presented under LG Act, s122(1g). LG Act s122(1) specifies the requirements of a council’s SMP, including the LTFP and IAMPs.
5 ‘Intergenerational equity’ relates to fairly sharing services and the revenue generated to fund the services between current and future ratepayers.
6 Commission, Framework and Approach – Final Report, August 2022, pp. 2-3, available at www.escosa.sa.gov.au/advice/advice-to-local-government
7 LG Act s122(1f)(a) and (1g)(a)(ii).
8 LG Act s122(1f)(b) and (1g)(b).
9 LG Act s122(1h).
10 Commission, Framework and Approach – Final Report, August 2022, available at www.escosa.sa.gov.au/advice/advice-to-local-government
11 The three financial indicators are specified in the Local Government (Financial Management) Regulations 2011. Since 2011, each council has been required to refer to these three indicators in its plans, annual budget, mid-year budget review and annual financial statements. The councils can adopt their own target range for each
Analysis of these three indicators captures financial and service sustainability, in addition to cost control and affordability risk. 12
Table 1: Strategic Management Documents
Annual Business Plan and Budget 2024-25 (adopted 6 August 2024)
Infrastructure and Asset Management Plan 2025-2034 (adopted 27 August 2024)
Long-term Financial Plan 2025-2034 (adopted 6 August 2024)
Renmark Paringa Council Long-term Strategic Directions (adopted April 2021)
2024-2034 Community Plan (adopted November 2024)
Renmark Paringa Economic Development Strategy
The Commission notes that the Council was originally scheduled for advice under the Scheme in 2023-24; however, the Commission rescheduled the advice to 2024-25, recognising the operational impacts experienced by the Council as a result of the River Murray floods. 13
The Council had some difficulty in providing information to the Commission in a timely and accurate manner due to staffing issues. The Council did not complete its template data on the current template version 14 and the Commission updated the template to correct the data presentation of the material amendments. The underlying data provided by the Council was not changed.
The Commission also notes that interactions with the Council have highlighted some difficulties in responding to questions regarding aspects of the Council’s LTFP forecasts for cash expenses and depreciation charges.
Given that the Commission must, in providing its advice, have regard to the objective of councils maintaining and implementing their IAMPs and LTFPs, 15 it has considered the Council’s performance in that context. Findings regarding the content of the Council’s AMPs, and the alignment between its LTFP and AMPs, 16 are discussed in section 5.
The Commission has also reviewed the Council’s template data which contains its 2024-25 LTFP forecasts for 2024-25 to 2033-34, its 2023-24 LTFP forecasts, historical financial data, the number of rateable properties and Council staff (Full Time Equivalent or FTE) numbers from 2013-14 onwards. 17
The charts and tables in the Advice are primarily sourced from these datasets. In addition, the Commission has reviewed the Council’s audit committee reports, and other public information, as appropriate.
The Commission has reported estimates in nominal terms, but it has compared estimated inflation impacts to these trends as a guide to identify ‘real’ rather than ‘inflationary’ effects. In the charts, the Consumer Price Index (CPI) line shows the cumulative growth in the CPI (Adelaide) series from 2013-14, and then projections of this series from 2024-25 based on the Reserve Bank of Australia (RBA)
ratio, but the Commission has adopted the previously suggested Local Government Association (LGA) target ranges as a basis for its analysis, which were established and agreed during the development of the LGA Financial Sustainability Papers (2006-2011).
12 The F&A listed 29 analytical questions that the Commission has answered in assessing the Council’s performance against these indicators to determine affordability, cost control and other sustainability risks.
13 Correspondence between Renmark Paringa Council CEO and ESCOSA, 13 April 2023.
14 Correspondence between ESCOSA and the Renmark Paringa Council, 17 September 2024.
15 LG Act s122(1g)(a)(i).
16 As required under s122(1b) of the LG Act.
17 The Council’s estimates for the 2022-23 financial year, relied on at the time of preparing this advice, were unaudited.
(Australia-wide) inflation forecasts to the December quarter 2026, and the midpoint of the RBA target range (2.5 percent) thereafter.
Finally, in formulating this Advice, the Commission has had regard to all discussions and engagement with the Council, including the face-to-face onsite meeting at the Council offices and the individual circumstances of the Council, consisting of:
its location as a regional Council
its income level ($23.3 million in 2022-23), and
the size of its rates base (around 5,658 ratepayers 18).
Throughout this Advice, the Commission has identified several key points and assigned the following risk category to those points:


18 Based on the estimated number of property assessments in 2022-23.
The Renmark Paringa Council is classified as a ‘Rural Agricultural Large and Very Large’ council and is one of 19 of that category in South Australia. 19 The Renmark Paringa Council district is located adjacent to the Victorian border, in the Riverland, and comprises 916 square kilometres. 20 The council seat is at Renmark. The district has an estimated resident population of 10,107 (at 30 June 2023), 21 and approximately 5,658 rateable properties (at 30 June 2023). 22
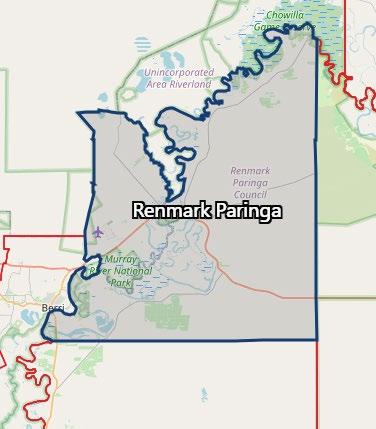
The Council region also has the following attributes:
population density of 11 persons per square kilometre 23
480 kilometres of roads of which 35.8 percent are unsealed 24
the major regional activity is agriculture which occupies 619 square kilometres (67.6 percent) of the district land 25
the area is also known for its various fruit production and is heavily dependent on the River Murray as a water source, and
a median population age of 43.4 years. 26
19 Commission, Fact Sheet - Local Government Advice Scheme – Schedule of Councils, May 2023, available at https://www.escosa.sa.gov.au/ArticleDocuments/21947/20240731-Advice-ScheduleOfCouncilsFactSheet.pdf.aspx?Embed=Y
20 Refer to Australian Bureau of Statistics, Data by region, available at https://dbr.abs.gov.au/region.html?lyr=lga&rgn=46670
21 Refer to Australian Bureau of Statistics, Data by region, available at https://dbr.abs.gov.au/region.html?lyr=lga&rgn=46670
22 Sourced from the financial reporting template for 2024-25 provided to the Commission
23 Refer to Australian Bureau of Statistics, Data by region, available at https://dbr.abs.gov.au/region.html?lyr=lga&rgn=46670
24 Refer to the Department of Infrastructure and Transport - Local Government Grants Commission, 2022-23 Database Reports, available at: https://www.dit.sa.gov.au/local-government/grantscommission/publications#database
25 Refer to Australian Bureau of Statistics, Data by region, available at https://dbr.abs.gov.au/region.html?lyr=lga&rgn=46670
26 Refer to Australian Bureau of Statistics, Data by region, available at https://dbr.abs.gov.au/region.html?lyr=lga&rgn=46670
The Council has made various amendments to its 2024-25 budget and forward projections, partly for inflation and partly for other revenue and spending initiatives. The material amendments to certain of its main financial forecasts are listed in the table below (in nominal terms). 27 To ensure a comparable analysis of estimates between the 2023-24 and 2024-25 LTFPs, the Commission has reviewed the nine overlapping years’ statistics: 2024-25 to 2032-33 and identified material amendments accordingly.
The projected decline in forecast operating performance is because of a 6.0 percent decline in operating income and a 5.7 percent increase in operating expenses.
The Council forecasts an increase in rate revenue above the RBA forecast CPI, however the basis for indexation calculations is not specified.
The Council has aligned its strategic ABP and LTFP documents.
From the 2023-24 LTFP to the 2024-25 LTFP, the Council has forecast a $17.0 million reduction in cumulative operating performance, moving from a forecast surplus of $11.7 million to a deficit of $5.3 million
For the 2024-25 LTFP, the Council has stated that the decline in the operating performance (compared to the 2023-24 LTFP) is a result of a 2.9 percent decrease ($6.0 million cumulative) in income and a 5.7 percent increase ($11.0 million cumulative) in operating expenses. The changes include:
27 Table 2 shows only selected financial items to demonstrate the material amendments made by the Council in its 2024-25 estimates. It excludes various financial items, and individual items do not sum to totals.
28 The capital expenditure estimates are based on the 2024-25 LTFP estimates provided by the Council to the Commission.
29 The capital expenditure estimates are based on the 2024-25 LTFP estimates provided by the Council to the Commission.
decreased rates, reimbursements and user charges combined with increased statutory charges
decreased grant income
insurance settlements related to 2021 floods
increased ‘employee expenses’ and ‘materials, contract and other’ costs, and
an increase of $2.1 million in finance costs related to flood damage repairs (pending insurance settlements).
The Council’s historical and projected operating performance is discussed further in section 5.1.
The Council’s approach to indexation lacks transparency, with conflicting descriptions provided in its 2024-25 LTFP and the financial template information provided to the Commission. The Council’s inflation assumptions are also higher than RBA forecast inflation, which averages 2.6 percent from 2024-25 to 2033-34, with no explanation as to why. 30
The Council notes, in its financial template information, that increases in income are due to the change in its indexation assumptions from between 3.6 to 6.0 percent (in the 2023-24 LTFP) to 4.6 to 7.9 percent (in the 2024-25 LTFP). The increases in expenditure are due to the changes in indexation assumptions between the two LTFPs from between 6.0 to 7.0 percent to 4.6 to 8.3 percent. 31
In contrast, the Council’s LTFP states an inflation assumption of 4.3 percent for the March 2024 quarter 2024, reducing to 2.5 percent by 2031-32. The basis for this is unclear. Further, the rate at which CPI tapers to 2.5 percent varies across the income and expenses categories to which the assumption is applicable and is only apparent from direct calculation. 32 Further, it is these CPI assumptions that apply to the 2024-25 financial template information provided to the Commission, despite the description to the contrary within the template itself. 33
The Commission notes that the Council’s stated assumptions for indexation in its 2024-25 LTFP are based on the Council’s review of inflation. The Commission considers there is benefit in the Council providing more transparency regarding its chosen assumptions, the reasons it has chosen them and whether or how they compare to independent institutional forecasts, such as RBA forecasts, in its LTFP (and other relevant documents).
The Council’s 2024-25 LTFP indicates increases in capital expenditure for asset renewals and for new and upgraded assets compared to the 2023-24 LTFP. Over the comparable nine-year projections between the LTFPs, the Council has included a total of $27.5 million in capital renewal and replacement works and $22.8 million in new and upgraded capital works. This is an overall increase of $11.2 million compared to the 2023-24 LTFP
The Council is undertaking a significant new capital program in 2024-25 which includes:
replacement of the Twenty First Street Bridge as a direct result of the 2022-23 flood damage, and
30 See RBA data forecast time series, available at: https://www.rba.gov.au/publications/smp/2024/aug/
31 Notes included with 2024-25 LTFP estimates on Financial Reporting Template provided by the Council to the Commission.
32 Renmark Paringa Council Long-Term Financial Plan 2025-2034, p. 16.
33 Renmark Paringa Council 2024-25 financial reporting template notes describe increases in indexation as changing from between 3.6 and 6.0 percent (in 2023-24 LTFP) to between 4.6 and 8.3 percent (in 2024-25 LTFP).
replacement and upgrade of the Renmark Wharf that was delayed due to the flood, as well as scope increase because of damage. 34
The Council has received grants, insurance payments and is also borrowing 35 to fund these intergenerational projects. Its capital expenditure outlook is discussed further in section 5.3.
The Council adopted its ABP and budget and its LTFP together on 6 August 2024, followed by the IAMP 2025-2034 on 27 August 2024. The Commission notes the good practice of the Council in aligning these documents.
The ABP notes that the Council has a framework for reporting risk to Elected Members; 36 however, the LTFP does not identify any risks to its estimates after adoption, for example, due to economic and environmental factors. The Commission consider this unusual, given the scale of the capital expenditure upgrades being undertaken in the near term of the LTFP.
The Council’s ABP notes that rates revenue will increase by 6.0 percent per annum over the next 10 years, to manage increasing costs. 37 The plan discusses the cost pressures the Council is facing but does not provide any details of how the 6.0 percent figure was calculated.
The Commission recommends that the Council:
1. Use a credible independent source for, or as the basis of, its inflation assumptions, identify and explain any variations from that source and apply its inflation assumption consistently across its strategic documents.
2. Review its inflation forecasts in its budget and forward projections each year and clearly identify these and other assumptions underlying revenue and cost component estimates in its ABP and LTFP.
34 Renmark Paringa Council Annual Business Plan and Budget 2024/25, p. 12.
35 Renmark Paringa Council Annual Business Plan and Budget 2024/25, p. 13.
36 Renmark Paringa Council Annual Business Plan 2024/25, p. 20.
37 Renmark Paringa Council Annual Business Plan 2024/25, p. 13.
5.1 Operating performance
5.1.1 Key points
Key points;
Six of 10 operating results between 2013-14 and 2022-23 were deficits, resulting in a cumulative operating loss of $1.4 million over the period.
Council forecasts recurrent deficits between 2024-25 and 2029-30 with an average operating result for the period 2024-25 to 2033-34 of negative $0.3 million per annum.
Council’s cash expenses growth forecasts (employee and materials, contracts and other expenses) are above average forecast CPI for the period.
Councils’ depreciation expenses growth forecast is 0.3 percent and confirmed by the Council as unlikely to be accurate.
The Council forecasts operating surpluses from 2030-31 to 2033-34 but these are dependent on cost constraint and unlikely to be achieved when depreciation expenses are revised.
5.1.2 Operating Surplus Ratio
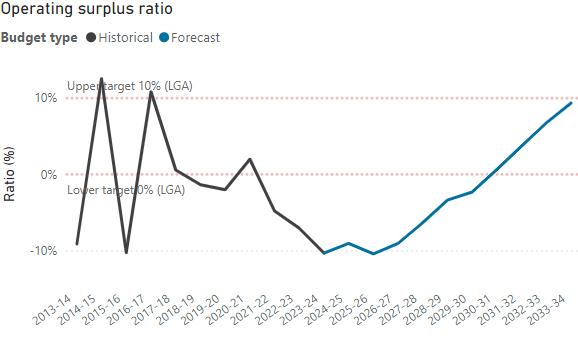
The Council’s historical operating result has been volatile (see Figure 1), and it has predominantly run operating deficits from 2013-14 to 2022-23, with an average operating result of negative $0.1 million, and a cumulative operating loss of $1.4m to 2022-23. Despite this, the Council has maintained high cash asset levels, which are discussed further in section 5.2.
Following an estimated deficit of $1.8 million in 2023-24 (unaudited) 38, the Council further forecasts that it will incur operating deficits from 2024-25 to 2029-30, followed by forecast surpluses from 2030-31 to 2033-34. Ongoing deficits however, present a risk to sustainability, as they indicate the Council’s expenses will continue to be higher than its income. This risk is likely to be heightened if the Council’s expense forecasts prove to be over-optimistic (discussed further in section 5.1.4.).
Annual average growth in total income over the 2013-14 to 2022-23 period was 9.3 percent, but this was skewed by a grant of $6.2 million 39 for flood disaster recovery in 2022-23 (see Figure 2). Excluding that grant, results in total income annual average growth of 5.6 percent over the period. It also results in grant average annual income growth being 8.4 percent, with average annual grants income being $3.9 million, rather than grant income exhibiting annual average growth of 19.2 percent, with average annual grants being $4.6 million.
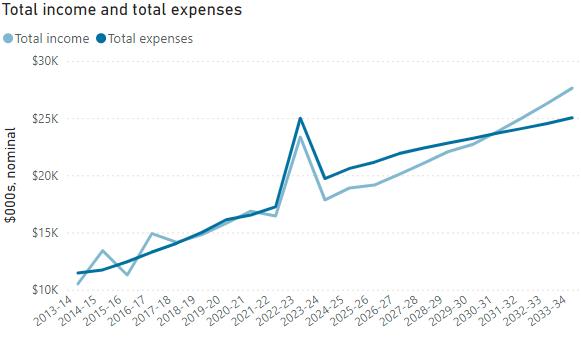
Meanwhile, rates revenue increased on average by 5.5 percent per annum from 2013-14 to 2022-23, 40 with rateable property growth averaging 0.7 percent and CPI growth averaging 2.6 percent. 41 Looking forward, the Council is projecting average annual rates revenue growth of 5.6 percent to 2033-34 (inclusive of 0.4 percent growth in rateable properties), which is above forecast long-term inflation 42 but noted as essential by the Council to assist in funding the future operating costs of major capital infrastructure 43 (including longer term renewal of existing assets and depreciation). The Council also states that its rates have been low historically. 44
38 Renmark Paringa Council 2023/24 Annual report, p. 79 (adopted 26 November 2024) includes audited financial statements, with operating deficit of $2.1 million.
39 Renmark Paringa Council 2022/23 Annual Report, p. 93, Financial Statements 2023, Note 2, p. 14.
40 Based on the compound average annual growth rate formula (which is the adopted approach to calculating average annual growth rates throughout the Commission’s advice).
41 Refer to ABS data historical time series, available at: https://www.abs.gov.au/statistics/economy/price-indexesand-inflation/consumer-price-index-australia/jun-quarter-2024
42 The forecast average annual growth in the CPI from 2024-25 to 2033-34 is estimated to be 2.6 percent based on the RBA forecasts for the CPI (Australia-wide) to December 2026 (and the Commission’s calculations of average annual percentage growth) and the midpoint of the RBA’s target range (2.5 percent) from 2026-27.
43 Renmark Paringa Council Long-Term Financial Plan, p. 11.
44 Renmark Paringa Council Long-Term Financial Plan, p. 11.
Overall, the average growth in annual rates revenue is higher than expected expense growth but may assist to move the Council towards financial sustainability (rates are further discussed in section 6). Other income growth, including statutory and user charges, is forecast to increase by 3.1 percent per annum, which is above RBA forecast inflation, and grants are forecast to increase by 0.7 percent per annum.
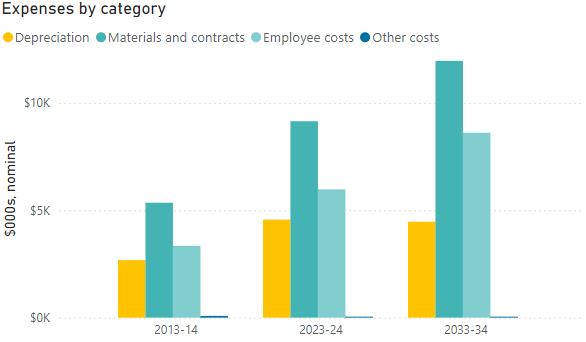
The Council’s annual growth in operating expenses was an average of 9.0 percent (from 2013-14 to 2022-23) and was primarily due to increased expenditure on ‘materials, contracts and other’ expenses (47.1 percent per annum on average of total operating expenses). Significant expenditure was incurred in 2022-23 due to flood mitigation and recovery activities. At $7.3 million, expenditure on ‘materials, contracts and other’ expenses associated with the flood response 45 is approximately $1.0 million more than the increased grant income for that period (shown by the spike in Figure 2 in 2022-23). When the extraordinary expenditure of 2022-23 is excluded, average growth in total expenses per annum is 5.0 percent and growth per annum in ‘materials contracts and other expenses’ reduces from 12.0 percent to 4.6 percent per annum.
Over the period of the LTFP, Council has forecast lower average total expense growth per annum of 2.2 percent, which is less than the RBA-based forecast inflation growth 46 and represents a significant change from the Council’s past performance. Of note, the forecast is less than half of the average annual growth of 5.0 percent from 2013-14 to 2021-22 (excluding the extraordinary expenditure in 2022-23).
It is not clear how the Council will achieve this cost constraint given anticipated RBA forecast inflation and the increases in expenses proposed in its ABP. 47 The Commission notes that the Council forecasts its cash expenses growth to be 2.7 percent over the period of the LTFP, relative to 4.0 percent for the historical period 2013-14 to 2022-23, once the flood-related extraordinary expenses are removed. How this improved performance will be achieved is not explained. For example, the Commission notes that the available documents do not present options commonly seen within the local government sector,
45 Renmark Paringa Council 2022/23 Annual Report, p. 94, Financial Statements 2023, Note 2, p. 15.
46 The forecast average annual growth in the CPI from 2024-25 to 2033-34 is estimated to be 2.6 percent based on the RBA forecasts for the CPI (Australia-wide) to the December quarter 2026 (and the Commission’s calculations of average annual percentage growth) and the midpoint of the RBA’s target range (2.5 percent) thereafter
47 Council notes increases in wages and superannuation expenses, increased depreciation and additional finance costs for borrowing to fund cash flow related to capital projects. Annual Business Plan and Budget 2024-2025, pp. 12-13.
such as plans to reduce staffing, or the development of a strategy and implementation plan to constrain growth in ‘materials, contracts and other’ expenses.
The Commission also notes that the forecast non-cash depreciation expense is expected to grow by 0.3 percent per annum over the period of the LTFP. This appears unusually low, given the new assets which were constructed in 2022-23 and 2023-24, combined with the likely increases in asset value between 2024-25 and 2033-34. This suggests that depreciation across the period of the LTFP is understated (further discussed in section 5.3).
The Council itself has confirmed the forecast is unrealistic, as depreciation for new assets has not been included in its LTFP, and several asset classes have not been revalued recently. 48 Forecasts provided in the template were prepared based on a flat depreciation rate that was adjusted for fair value and asset impairments. The Council has acknowledged that significant revision is required to support its depreciation forecast as a reasonable and credible assessment of the rate of asset consumption.
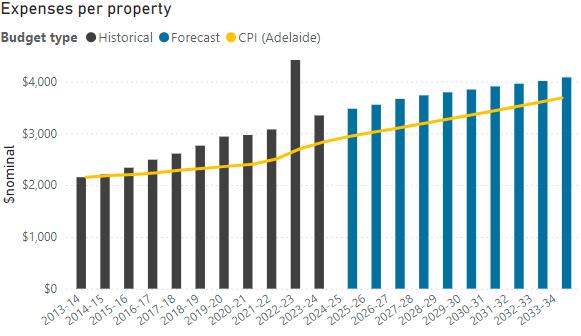
Finally, operating expenses per property, (a metric which also accounts for growth in the number of rateable properties) excluding 2022-23, averaged $2,616 per annum with growth of 4.6 percent per annum between 2013-14 and 2021-22. Looking forward, operating expenses are forecast to grow at an average of 1.8 percent per property – a rate that is dependent on the cost constraints discussed above.
Noting the Council’s reliance on cost constraints for improvement in financial sustainability, there is a risk for the community and ratepayers if those cannot be achieved. Given the above observations, the Commission advises the Council to consider the achievability of its expenses forecast, and whether its LTFP provides a suitable foundation for strategic management planning or should be updated, prior to creating any further liabilities through its capital expenditure program. This will mitigate the risk of the Council making decisions based upon insufficient or non-robust information, with the community likely bearing the consequences of that risk through higher rate payments than forecast.
To ensure the Council is positioned to achieve the required income and real terms reduction in its cost base that it has forecast and improve its operating performance, the Commission recommends that the Council:
48 Discussion with Renmark Paringa Council Manager of Financial Services and Director Corporate and Community Services, 30 January 2025.
3. Consider alternative revenue generation sources including grant funding and user charges that reflect the service provision costs.
4. Review its forecast expense estimates including for depreciation, to ensure they are realistic and achievable.
5. Report any actual and projected cost savings in its ABP (and LTFP, as appropriate), to provide evidence of constraining cost growth and achieving efficiency across its operations and service delivery.
5.2.1 Key points
Key points;

Between 2013-14 and 2022-23, the NFLR averaged negative 30.2 percent (below the range recommended by the LGA).
Between 2024-25 and 2033-34, the NFLR is forecast to average 50.1 percent.
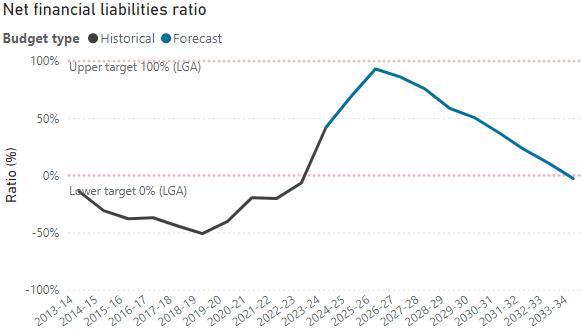
Despite the Council’s frequent operating deficits from 2013-14, its net cash flows after operating and investing (that is, capital-related) activities averaged $0.2 million annually between 2013-14 and 2022-23 The Council’s NFLR trended between negative 51.0 and negative 6.7 percent between 2013-14 and 2022-23, reflecting the Council’s high levels of cash assets (see Figure 8) and the Council’s general practice of maintaining low levels of debt. 49 The Council is currently using debt to fund major asset upgrades however proposes to repay that within the term of the LTFP forecast (see Figure 7). The average NFLR between 2013-14 and 2022-23 was negative 30.2 percent, which is below the suggested LGA target range for the indicator of between zero and 100 percent
49 Meeting with ESCOSA, 1 May 2024.
The forecast NFLR peaks at 93.0 percent in 2025-26, with an average ratio over the 10 years from 2024-25 to 2033-34 of 50.1 percent, which remains within the LGA target range. This is partially due to flood-related expenditure that was not funded by grants (as discussed above).
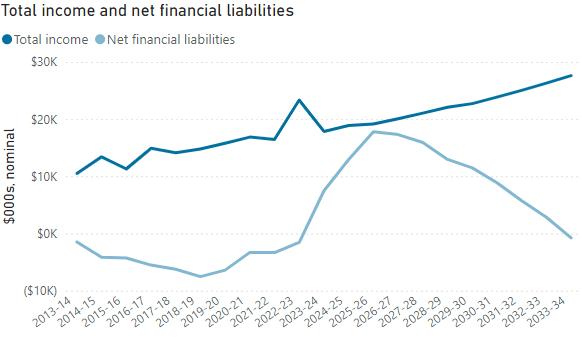
Council’s net financial liabilities (NFL) were below zero between 2013-14 and 2022-23. As Council borrows to fund major infrastructure in 2023-24 and 2024-25, NFL will increase to $17.8 million in 2025-26, reducing sharply thereafter as Council repays most of the debt (using insurance income and post-project grant funding) (see Figure 6).
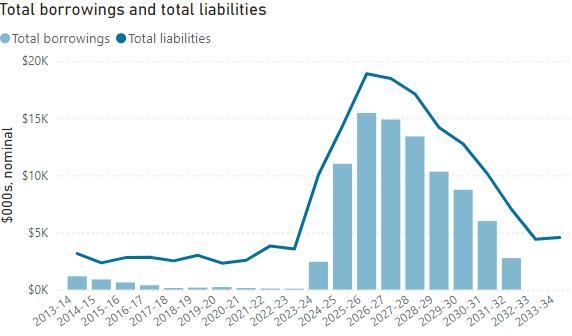
The Council had minimal new loan borrowings (totalling $0.2 million) between 2013-14 and 2022-23 and progressively paid down pre-existing borrowings (see Figure 7). The Council also noted short-term cash flow demands where grant funding will be received after completion of capital works. 50 The borrowings, required to bridge finances while waiting for insurance payouts and post-project grant funding, 51 are forecast to be repaid rapidly, with no new borrowings foreseen from 2025-26
50 Draft Annual Business Plan and Budget 2024-2025, p. 12.
51 Meeting with ESCOSA, 1 May 2024.
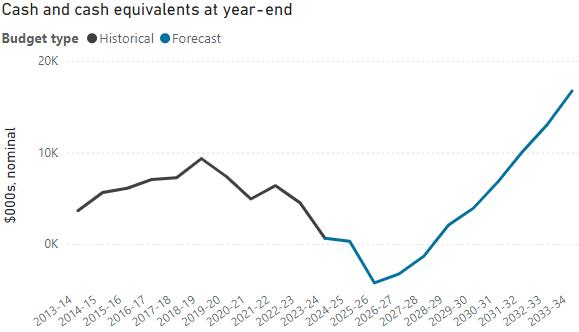
Cash held by the Council at the end of each year, including financing activities, averaged $6.2 million per annum between 2013-14 and 2022-23. The Council advises that it intends to use its cash reserves to assist with funding its capital projects 52 and forecasts that its historical cash reserves will be depleted in the short term, but as shown in Figure 8, will be rebuilt in future years. Cash held at year end is forecast to average $4.4 million between 2024-25 and 2033-34, noting the decline and rebuilding of cash reserves during the period The Commission notes that funding major projects from cash reserves may create intergenerational equity issues in which current and past ratepayers fund the assets that will benefit future ratepayers.
The Council appears to favour operating on a cash budget basis, with reserves that it calls on, when necessary, which might appear to be a sustainable practice but does not necessarily imply that Council is operating cost-effectively in the long-term, and it may be increasing operational risk which has implications for its community (refer to further discussion in asset section 5.3). The level of cash accumulation suggests that Council could consider alternatives. That could include additional spending on asset renewal (subject to updated AMPs and appropriate asset renewal spending) or reductions in rates (in the longer term after new capital asset projects are completed) as cash balances are forecast to increase to levels well above historical balances and ratepayers are experiencing higher costs of living and are financially disadvantaged (in the bottom quartile of the SEIFA index). 53
5.2.2 The Commission’s recommendations on financial liabilities
The Commission recommends that the Council:
6. Review the extent of cash reserves in the context of its NFLR outcomes, its financial sustainability outlook and its ratepayers’ capacity to pay higher rates
7. Monitor borrowing liabilities, to ensure that levels are sustainable with reference to the operating income and any grants for capital projects that it receives.
52 Meeting with ESCOSA, 1 May 2024.
53 The SEIFA index ranks areas according to their relative socio-economic advantage and disadvantage using Census data.
5.3.1 Key points
Key points:
Between 2013-14 and 2022-23, the net asset renewal funding ratio averaged 101.6 percent although the data on which it was based may not be reliable
The IAMP forecasts (in the financial reporting template) were provided in real terms which is incongruent with other data provided for analysis indicating a misunderstanding of forecasting.
The Council is likely to be understating its asset renewal requirements.
Asset values are likely to be understated and newly acquired assets have not been included in depreciation forecasts, with the result that forecast depreciation is unlikely to reflect actual asset consumption.
The Commission has concerns regarding the reliability of the Council’s LTFP and IAMP, and the extent to which the Council can, and does, use these for long-term strategic planning. The extent to which the Council is potentially underestimating its asset renewal requirements, while investing in new and upgraded assets that will increase the Council’s liabilities longer term, is also relevant. These concerns relate to both the IAMP and depreciation forecasts.
The Council has an IAMP for transport, buildings, structures and public domain infrastructure, plant and machinery, CWMS, stormwater and water infrastructure assets. It states that in preparing the IAMP it considers matters such as the quality, function and condition of the assets, as well as community satisfaction. However, the Commission notes that, as presented, the IAMP provides no detail about condition assessments or service standards, other than for CWMS. Of relevance, the IAMP also states that several asset classes are lacking detail and require better information and condition audits. 54
In addition, the IAMP appears internally inconsistent in relation to the price base of the IAMP forecasts. The figures are either in January 2024 prices (real terms) or include yearly CPI growth of 2.0 percent (nominal terms), based on the conflicting statements in the IAMP. 55 This provides a range for the forecast net ARFR of between 95.7 percent and 84.3 percent. It is, however, also unclear whether the IAMP data for the historical period is in real or nominal terms and what weight can be given to this.
The ARFR can also be considered on a depreciation basis. As noted in the expenses section, the Commission has some concerns regarding the depreciation forecast being underestimated (see section 5.1.4). In this regard, the Commission notes that the most recent asset revaluations undertaken by the Council were in 2023-24 for some asset classes, the most notable impacts being for CWMS and Buildings and Other Structures. These resulted in the value of these assets increasing from $53.1 million to $78.6 million, with annual depreciation rising from $1.3 million to $1.6 million. 56 It is possible subsequent upcoming revaluations of the remaining assets will exhibit similar trends, with the depreciation charges rising further. The remaining asset classes include Transport, which represents just over half the value of the Council’s asset stock. This is before considering whether the impact of increasing capital expenditure on new and upgraded assets has been fully accounted for.
Notwithstanding these concerns, calculating the depreciation-based approach to the ARFR using the Council’s depreciation forecasts in the LTFP results in the ratio being an average of 64.4 percent over the period of the LTFP. This compares to 61.2 percent for the 2013-14 to 2022-23 historical period
54 Renmark Paringa Council Infrastructure and Asset Management Plan 2025-2034, p. 11.
55 Renmark Paringa Council Infrastructure and Asset Management Plan 2025-2034, p. 4 and p. 31.
56 Renmark Paring Council 2023/24 Annual Report, Financial Statements, p. 94.
(calculated on the same basis). This is consistently well below the LGA recommended range of 90.0 to 110.0 percent, and would worsen if the Council’s depreciation forecast is found to be understated.
The Commission also notes that, over the 21-year period from 2013-14, the Council’s cumulative actual and forecast renewal capital expenditure diverges sharply from the cumulative depreciation charge, with cumulative depreciation higher (see Figure 9).
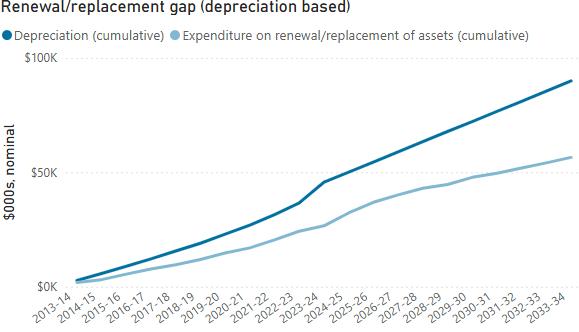
While some divergence might be expected, persistent and increasing divergence over 21 years likely indicates a genuine risk of lower than needed renewal expenditure having occurred (noting that this is before accounting for the possibility of understating of depreciation and underspending of capital renewal and hence the potential underestimation of this risk).
The Commission notes that, if asset condition is better than expected, that fact may mitigate this risk to some extent. To identify whether this is the case will require the Council to undertake comprehensive asset condition assessments alongside asset revaluations. It would also be necessary for the Council to ensure alignment of its LTFP, IAMP and asset condition assessments. In that regard the Commission notes that the Council has outsourced development of aspects of its LTFP and IAMP and observes that developing and retaining some in-house capability and capacity in relation to these core parts of its strategic management planning obligations may be advantageous (although the costs of doing so would also need to be carefully considered).
The Council’s current reactive approach based upon annual cash budgeting does not necessarily assist it in developing a strategic approach to asset management and financial planning. This potentially increases long-term risks and operational inefficiencies, which are likely to be passed onto ratepayers through higher than necessary rates.
Against this background, the Commission notes that the Council’s planned new capital expenditure will primarily be expended on transport assets and public domain infrastructure 57 The Council spent $24.1 million on new/upgraded capital assets (between 2013-14 and 2022-23) and forecasts spending the same between 2024-25 and 2033-34. More than 50.0 percent of the forecast new capital spending is attributable to the major capital projects required post flood and was unavoidable due to the extensive damage to the Twenty First Street bridge and the Renmark Wharf.
The Council’s forecast renewal expenditure is mainly attributed to transport assets (covering sealed roads, sheeted roads, kerbs, and footpaths), and accounts for approximately 42.0 percent of total
57 Renmark Paringa IAMP 2024-2034 published 9 July 2024, pp. 54-55.
renewals from 2024-25 to 2033-34. 58 Aside from transport works, the Council has planned renewals for CWMS representing 25.0 percent of total renewals.
The Council must exercise robust strategic planning to carry this out this capital program successfully, both logistically and in terms of cost efficiency, for the benefit of its community. This needs to be built on solid knowledge of the assets and well-formed and understood forecasts. This highlights the benefits which could flow from a revised approach by the Council in terms of moving away from a reactive response and incorporating more strategic approaches.
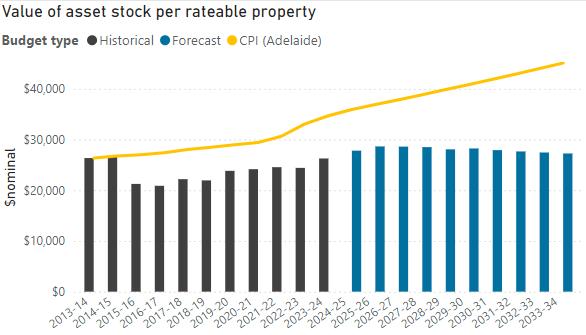
The Council decreased the value of its asset base over the past 10 years, while still incurring total capital expenditure of $4 8 million per annum (including $2.4 million per annum on new or upgraded assets) between 2013-14 and 2022-23. The decrease in the value of the asset stock per property per annum was $215.0 (0.8 percent) for each year from 2013-14 to 2022-23, as shown in Figure 10. Work is still required on the IAMPs (as discussed above), and the value of infrastructure assets is forecast to grow by 0.2 percent per annum between 2024-25 and 2033-34 (below both the Council’s and RBA’s inflation forecasts). This indicates it is likely that the values of asset stock are understated, 59 leading to a likely inaccuracy in the reported value of asset stock per rateable property. The Council forecasts that asset stock per property will continue to decline by $62.0 (0.2 percent) on average per annum between 2024-25 and 2033-34, despite the forecast capital expenditure on new assets and expected inflation over that period. Figure 10 represents the Council’s forecast; however, for the reasons discussed above, this is unlikely to be an accurate assessment of the real value of asset stock per rateable property.
5.3.2 The Commission’s recommendations re asset renewals expenditure
The Commission recommends that the Council:
8. Ensure financial forecasting practices include presenting data consistently, in either real or nominal terms, with appropriate explanations to provide clarity for ratepayers and other stakeholders.
9. Review the IAMP renewal expenditure forecast in the LTFP, including inflation, to better understand the impact on the ARFR.
58 Renmark Paringa IAMP 2024-2034 published 9 July 2024, pp54-55
59 Discussion with Council staff 30.1.2025 confirms that several asset classes require revaluation.
10. Review the estimates of asset lives and valuations, to inform its forecast rate of asset consumption and depreciation expenses.
11. Consider providing more funding to the renewal of its assets after completing its major projects, rather than prioritising initiatives that involve new or upgraded infrastructure.
12. Forecast and include the impact of new assets into the LTFP (including to depreciation expense) to provide transparency for existing and future ratepayers.
6.1 Key points
Key points;
Rate revenue per property increased at an average rate of 4.8 percent per annum over the 10-year historical period, which was more than the RBA’s average rate of inflation (2.6 percent over the historical period 2013-14 to 2022-23).
The forecast rate revenue per property between 2024-25 to 2033-34 is 5.3 percent per property per annum, which is above the RBA inflation forecast (2.6 percent over the forecast period 2024-25 to 2033-34).
Affordability risk among the community for the further rate increases appears to be an emerging issue.
Figure 11: Average rates revenue per property – historical and projected
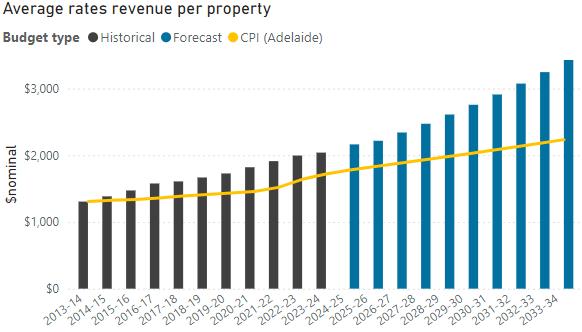
The Council’s rate revenue per property growth averaged 4.8 percent (approximately $77.0) per annum for each property over the past 10 years, 60 reaching an estimated $1,995.0 per property in 2022-23. This exceeded CPI growth of an average of 2.6 percent per annum over the same period, 61 and encompasses 0.7 percent average annual growth in rateable property numbers. Current rate levels partially reflect the Council’s recent history of spending growth, predominantly on ‘materials, contracts and other expenses’, depreciation and capital expenditure.
60 From 2013-14 to 2022-23
61 ABS historical time series 2013-14 to 2023-24, available at: https://www.abs.gov.au/statistics/economy/priceindexes-and-inflation/consumer-price-index-australia/sep-quarter-2023#capital-cities-comparison
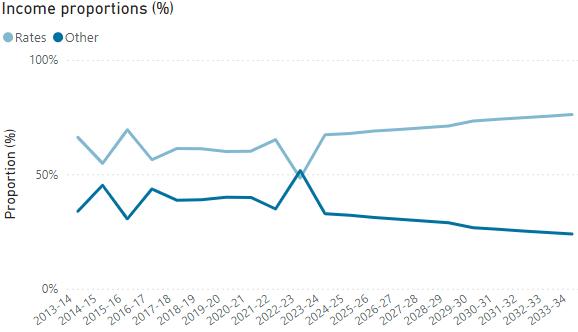
The Council remains reliant on its rate base in order to deliver operating outcomes, with grant funding utilised for capital expenditure. As noted above, in 2022-23 the Council received a grant of $6.2 million for flood recovery purposes. Removing that grant and relying on underlying income proportions for the 2013-14 to 2022-23 period provides a clearer picture of those trends (see Figure 12). Overall, the underlying trend in rates as a proportion of total income is relatively constant. In 2013-14 it was 66.2 percent, while in 2022-23 it was 65.8 percent (after removal of the flooding related grant), with the underlying proportion of other income has also been relatively constant.
Figure 12 also indicates that Council expects the share of rates revenue as a percentage of total income to increase over the forecast period of the LTFP. Rates revenue is forecast to account for an average of 72.5 percent of budgeted operating income between 2024-25 and 2033-34 which reflects the relatively higher growth rate forecast for rates income.
The Commission notes that the Council has relatively low average rates compared to similar councils. 62
The Council has budgeted for rate revenue (including CWMS and other rates) of $12.8 million in 2024-25. This would result in an average residential rate of $2,163 per property - an increase of approximately $123.0 per property over 2023-24, 63 an average rate increase of 6.0 percent The rates revenue includes income from waste collection, the CWMS charge, and the Regional Landscape Levy.
Different rate categories are subject to varying changes, with residential ratepayers to pay 0.235 cents per dollar compared to commercial and industrial ratepayers at 0.492 cents per dollar and primary producers at 0.345 cents per dollar. 64
On a proportional revenue basis, residential ratepayers account for 55.4 percent of 2024-25 budgeted rates revenue but hold capital values in the Council area of 60.9 percent. Primary production ratepayers contribute 27.5 percent of revenue with an aggregate capital value of 25.6 percent. 65
62 Refer to Councils in Focus rates data for 2019-20, available at: https://councilsinfocus.sa.gov.au/councils/renmark_paringa_council. The Commission is not relying on these rate comparisons for its advice; the data source provides one indicator, among many, which has informed its advice on the appropriateness of the rate levels.
63 Based on calculations from 2024-25 LTFP estimates on Financial Reporting Template provided by the Council to the Commission.
64 Renmark Paringa Council Annual Business Plan and Budget 2024/25, p. 27.
65 Renmark Paringa Council Annual Business Plan and Budget 2024/25, p. 24.
The Council has forecast an increase of 5.6 percent per annum on average in rate revenue for the period from 2024-25 to 2033-34 (excluding statutory and user charges and reimbursements)
In total, the LTFP effectively projects a cumulative increase of $1,265.0 per existing ratepayer (to approximately $3,428.0 per annum) by 2033-34, which is consistent with the Council’s assumed inflation growth over this period but is above the RBA-based inflation forecast of an average of 2.6 percent per annum. 66
Affordability risk among the community for these further rate increases appears to be an emerging issue, on balance, when considering:
the Council’s relatively low socio-economic index (SEIFA) economic resources ranking, 67 and
the current relatively low average rates compared to similar councils
6.4.1 The Commission’s advice regarding affordability risk
As the current economic environment is putting more pressure on most communities’ capacity to pay for further rate increases, including those of the Council, the Commission recommends that the Council:
13. Consider limiting any further average rate increases above inflation, to help reduce any emerging affordability risk in the community.
66 The forecast average annual growth in the CPI from 2024-25 to 2033-34 is estimated to be 2.6 percent based on the RBA forecasts for the CPI (Australia-wide) to the December quarter 2026 (and the Commission’s calculations of average annual percentage growth) and the midpoint of the RBA’s target range (2.5 percent) thereafter
67 The Renmark Paringa Council area is ranked 19 among 71 South Australian ‘local government areas’ (including Anangu Pitjantjatjara and Maralinga Tjarutja Aboriginal community areas and ‘unincorporated SA’) on the Australian Bureau of Statistics SEIFA Index of Economic Resources (2016), where a lower score (eg, 1) denotes relatively lower access to economic resources in general, compared with other areas, available at https://www.abs.gov.au/ausstats/subscriber.nsf/log?openagent&2033055001%20%20lga%20indexes.xls&2033.0.55.001&Data%20Cubes&5604C75C214CD3D0CA25825D000F91AE&0&2016&2 7.03.2018&Latest
In the next cycle of the scheme, the Commission will review and report upon the Council’s:
ongoing performance against its current LTFP estimates
the identification and reporting of opportunities for cost savings
the planned asset renewal and replacement expenditure versus actual expenditure
the updating, alignment and implementation of strategic asset management plans with accurate inclusion of forecast capital expenditure into strategic financial management plans, and
the Council’s efforts to minimise any emerging affordability risks
ABS
AMP
ARFR
Commission
CPI
Council
CWMS
ESC Act
F&A
FTE
IAMP
LG Act
LGA SA Financial Indicators Paper
LTFP
NFLR
OSR
Australian Bureau of Statistics
Asset management plan (also called an IAMP)
Asset Renewal Funding Ratio
Since 2013, the asset renewal funding ratio has been defined as:
Asset Renewal Expenditure ÷ IAMP Renewal Expenditure
Where IAMP Renewal Expenditure is that required according to the IAMP.
Essential Services Commission, established under the Essential Services Commission Act 2002
Consumer Price Index (Adelaide, All Groups)
Renmark Paringa Council
Community Wastewater Management System
Essential Services Commission Act 2002
Local Government Advice: Framework and Approach – Final Report
Full Time Equivalent
Infrastructure and asset management plan (also called an AMP)
Local Government Act 1999
Local Government Association of South Australia, Financial Sustainability Information Pa per 9 - Financial Indicators Revised May 2019
Long-term financial plan
Net Financial Liabilities Ratio
Net Financial Liabilities are defined as:
Total Liabilities
LESS Current Assets (Cash and Cash Equivalents) LESS Current Assets (Trade and Other Receivables) LESS Current Assets (Other Financial Assets)
LESS Non-Current Assets (Financial Assets - excluding equity accounted investments in council businesses)
The net financial liabilities ratio is: Net financial liabilities ÷ Total Operating Income
Operating Surplus Ratio
The Operating Surplus (Deficit) is defined as: Total Operating Income LESS Total Operating Expenses28
The Operating Surplus Ratio is defined as: Operating Surplus (Deficit) ÷ Total Operating Income
ABS Australian Bureau of Statistics
Regulations
Local Government (Financial Management) Regulations 2011
RBA Reserve Bank of Australia
SEIFA
Socio-Economic Indexes for Areas
SMP Strategic management plan
The scheme or advice
Local Government Advice Scheme


Contact Details
Telephone 0 8 8580 3000
Email council@renmarkparinga.sa.gov.au
Web renmarkparinga.sa.gov.au
Engage RPC engagement.renmarkparinga.sa.gov.au
Opening Hours
Monday 9am – 5pm
Tuesday 9am – 5pm
Wednesday 9am – 5pm
Thursday 9am – 5pm
Friday 9am – 5pm