
croy@exprealty com (904) 803-7897 (904) 803-7897 justin.croy@exprealty.com justincroy.exprealty.com
Report valid for May 1, 2024 FOR: DAVID & ALCIRA Presented
JUSTIN CROY
eXp Realty in Northeast Florida eXp Florida Corporate O�ce: 10752 Deerwood Park Blvd Suite 100 Jacksonville, 32256 P RE S E N T AT I O N P RE PA RE D F O R 932 GRAP E LN, SAINT JOHNS, FL 32259
by: Justin Croy
justin
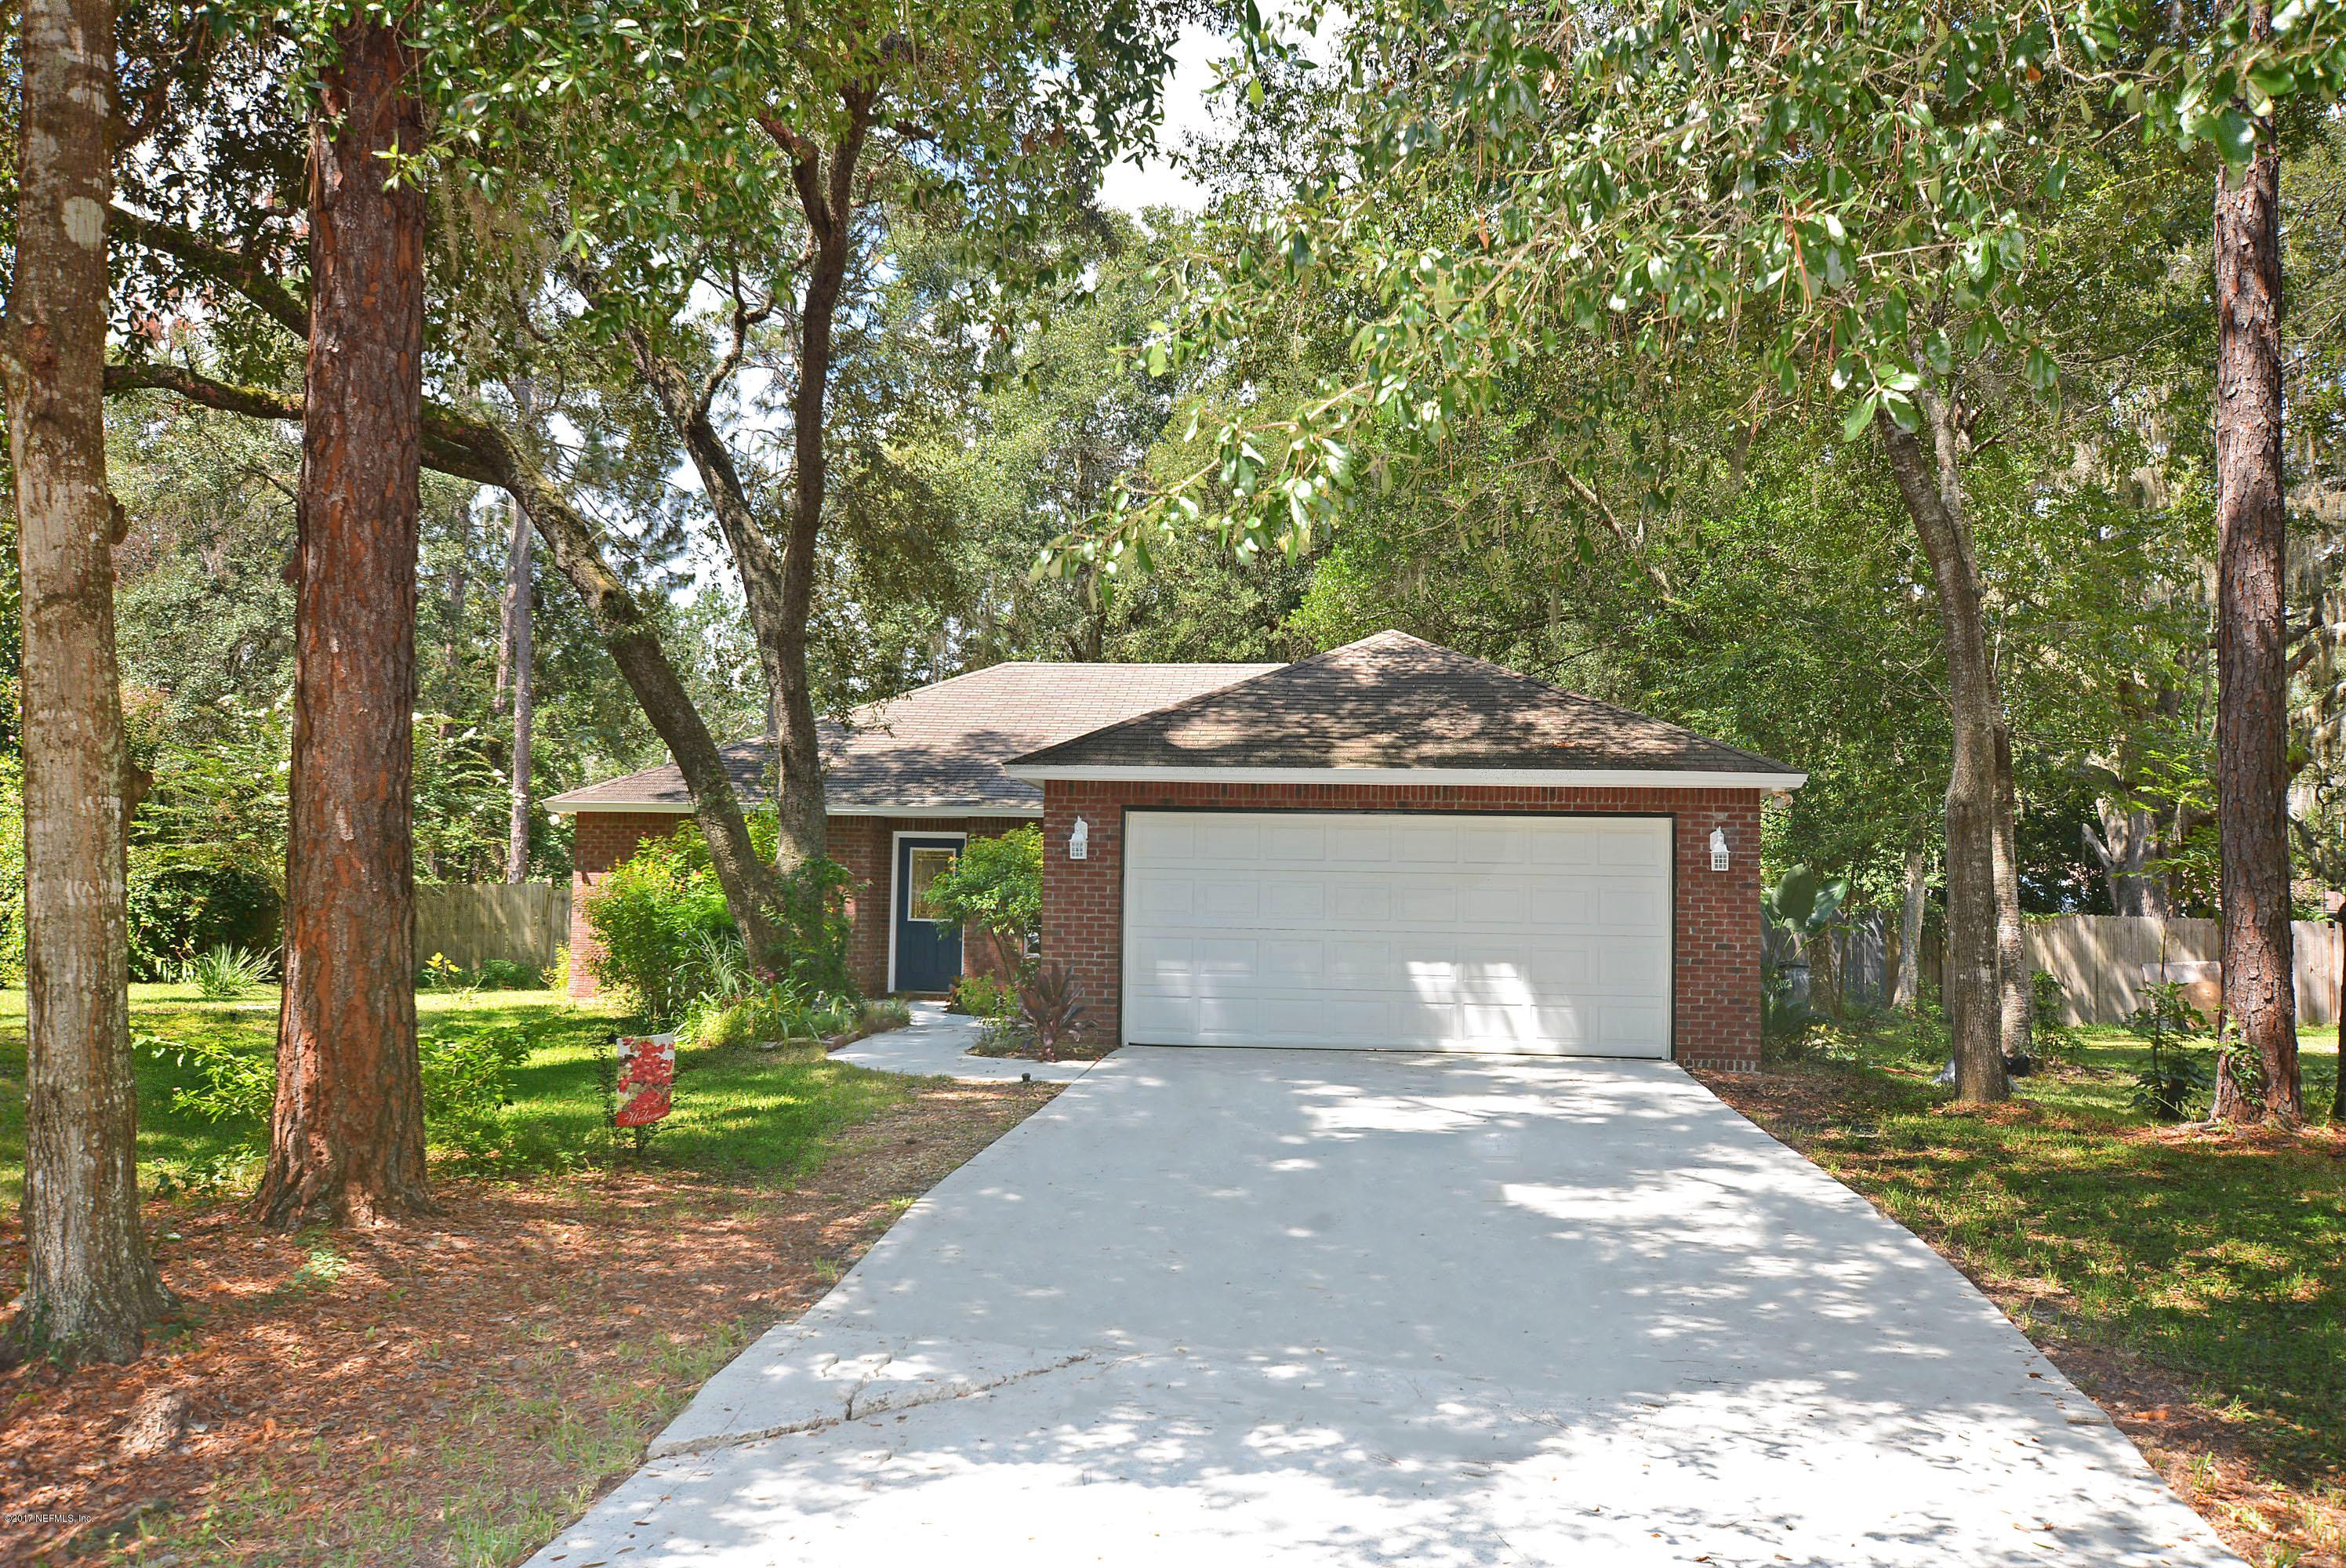
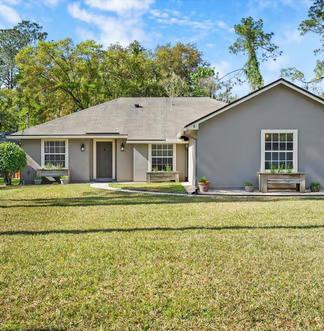
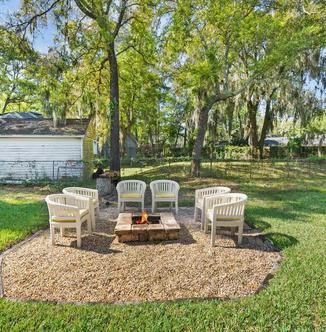
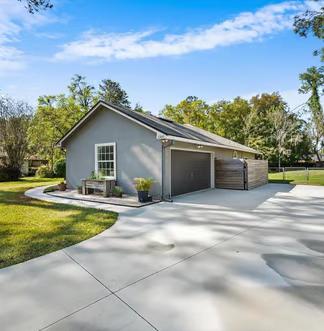
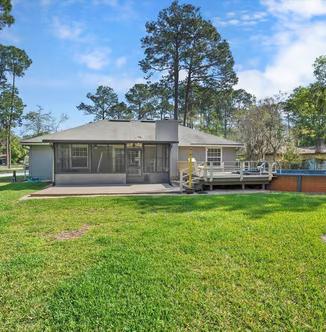
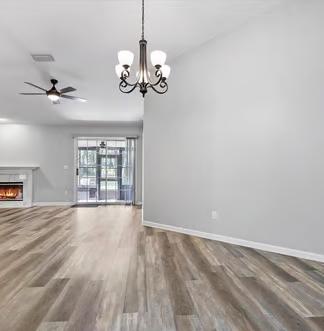
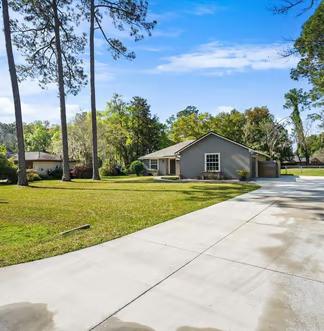
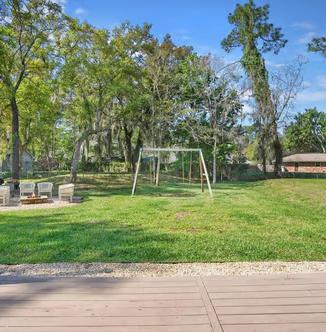
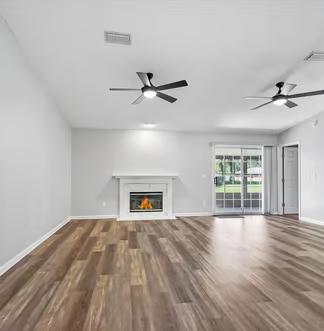
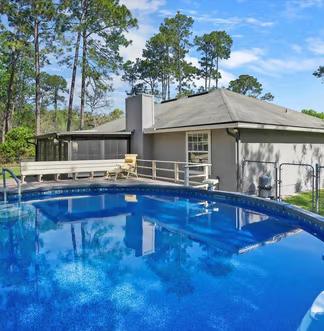
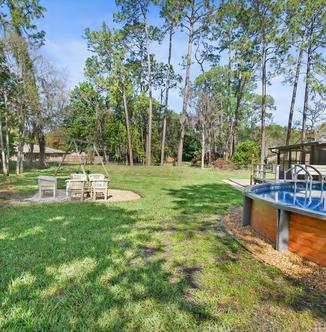
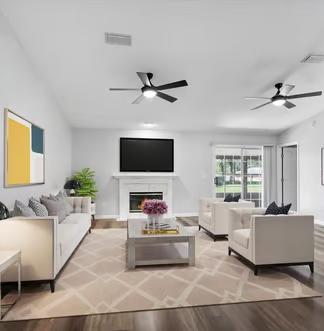
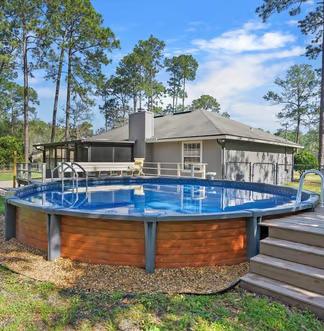
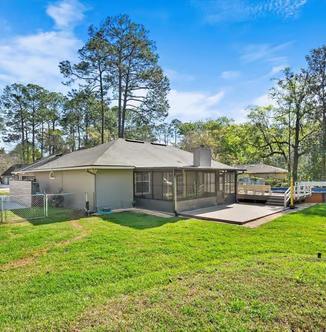
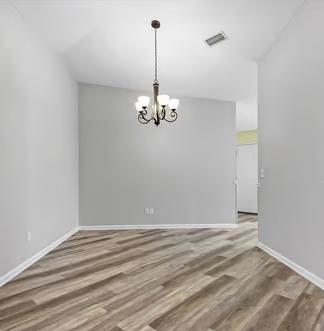
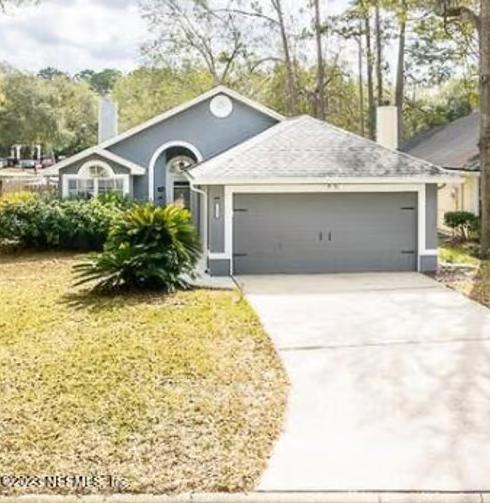
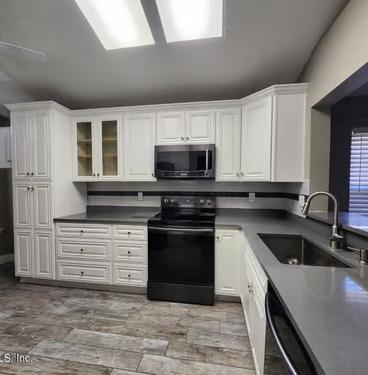
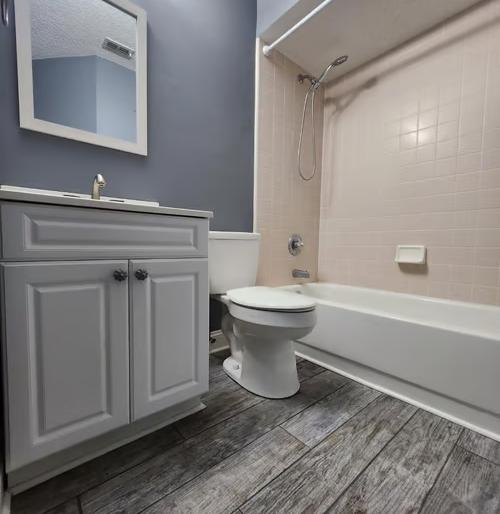
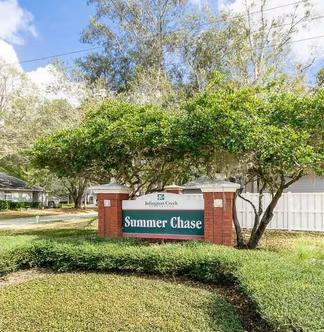
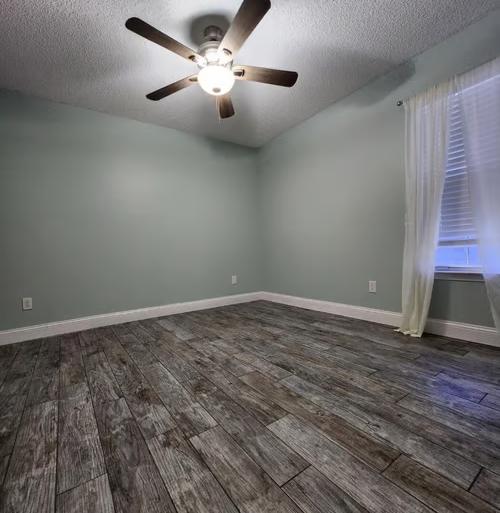
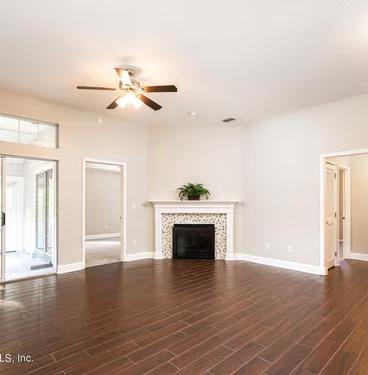
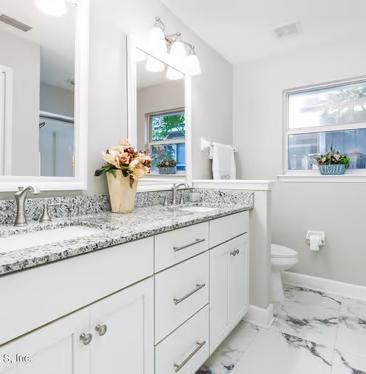
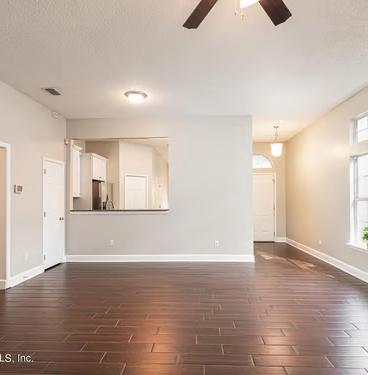
932 GRAPE LN
3 Bedrooms | Living Area Size 1427 sqf t Repor t valid f or 5/1/2024

COMPARABLE CRITERIA REVIEW
At a minimum, comparables must match the following criteria:
COMPARATIVE MARKET ANALYSIS m s e s a


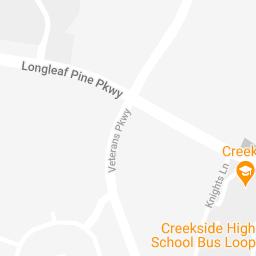
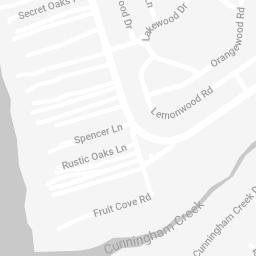
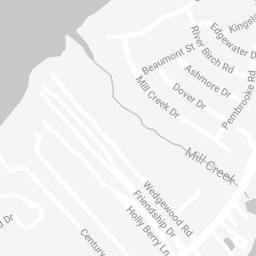
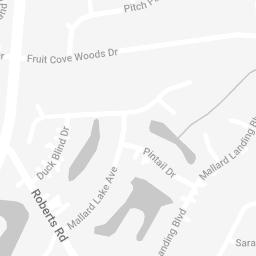
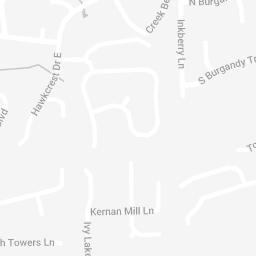
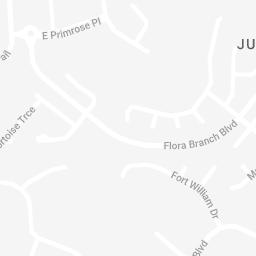
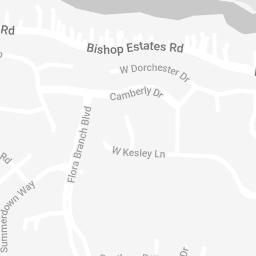
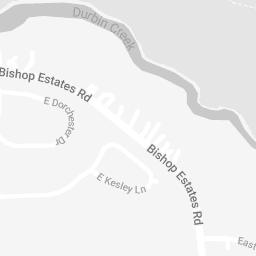
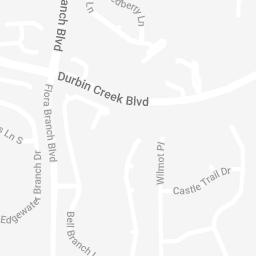
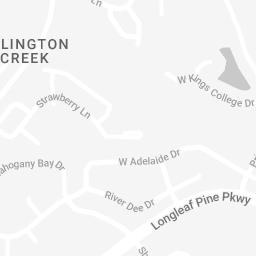
SAINT JOHNS, FL 32259
Living Area Size 1,142 - 1,712 Bed Count 3 m e c Map data ©2024 Google Report amap error


$389,575 $399,681 $409,787 $419,893 $430,000 Justin Croy Lic # justin croy@exprealty com (904) 803-7897 http://justincroy exprealty com JUSTIN
$398,000
3
749
$399,000 3
$389,575 AVERAGE
$405,850 AVERAGE
$430,000
CROY
1350 TANGERINE DRIVE $398,500 3 bed, 1,615 sqft, 0 09mi away P 876 PUTTERS GREEN WAY N $399,000
bed, 1,509 sqft, 1 46mi C
TEE TIME LANE
bed, 1,506 sqft, 1 45mi C AVERAGE OF CLOSED COMPS
OF PENDING COMPS
OF ACTIVE COMPS
$247 $255 $263 $271 $279 Justin Croy Lic # justin croy@exprealty com (904) 803-7897 http://justincroy exprealty com 1350 TANGERINE DRIVE $247 3 bed, 1,615 sqft, 0 09mi away P 876 PUTTERS GREEN WAY N $264 3 bed, 1,509 sqft, 1 46mi away C 749 TEE TIME LANE $265 3 bed, 1,506 sqft, 1 45mi away C JUSTIN CROY $279 AVERAGE OF PENDING COMPS $251 AVERAGE OF CLOSED COMPS $260 AVERAGE OF ACTIVE COMPS $264
COMPARABLE PROPERTY DETAILS
Active Address List $ Sale $ Bd Bth Sqft $/Sq Built List Date DOM 798 S LILAC Loop $430,000 N/A 3 2 1,629 $264 2003 04/26/2024 5 $430,000 N/A 3 2 1,629 $264 2003 5 Pending Address List $ Sale $ Bd Bth Sqft $/Sq Built List Date 1350 TANGERINE Drive $398,500 N/A 3 2 1,615 $247 1996 03/22/2024 911 FRUIT COVE Road $350,000 N/A 3 2 1,666 $210 1983 03/22/2024 1350 LEMONWOOD Road $399,900 N/A 3 3 1,500 $267 2023 04/17/2024 1130 LINWOOD Loop $475,000 N/A 3 2 1,687 $282 1987 03/29/2024 $405,850 N/A 3 2 25 1,617 $251 1997 Closed Address List $ Sale $ Bd Bth Sqft $/Sq Built Sold Date DOM 908 BUTTERCUP Drive $359,900 $328,000 3 2 1,253 $262 2000 02/20/2024 131 876 PUTTERS GREEN Way N $399,000 $399,000 3 2 1,509 $264 1997 01/22/2024 18 949 W DOTY BRANCH Lane $415,000 $405,000 3 2 1,692 $239 2001 03/20/2024 12 749 TEE TIME Lane $389,000 $399,000 3 2 1,506 $265 1995 02/23/2024 116 180 HAWTHORN HEDGE LANE Lane $365,000 $350,000 3 2 1,358 $258 1998 01/10/2024 101 CLOSED continued on next page Justin Croy Lic # justin croy@exprealty com (904) 803-7897 http://justincroy exprealty com
Closed Address List $ Sale $ Bd Bth Sqft $/Sq Built Sold Date DOM 273 BELL BRANCH Lane $435,000 $415,700 3 2 1,646 $253 1998 03/29/2024 0 1727 PITCH PINE Avenue $480,000 $470,000 3 2 1,657 $284 1990 04/17/2024 89 525 REDBERRY Lane $349,900 $349,900 3 2 1,367 $256 1998 01/12/2024 119 $399,100 $389,575 3 2 1,499 $260 1997 84 Justin Croy Lic # justin croy@exprealty com (904) 803-7897 http://justincroy exprealty com
1350 TANGERINE Drive
COMPARABLE DETAILS
Distance: 0 09 mi away
Comp Type: Pending
Year: 1996
Bed Count: 3
Bath Count: 2 (Full: 2)
Living Area Sqft: 1,615
Full Lot Sqft: 20,473
Basement: none
Garages: 2

FEATURES
LISTED INFO
Listing Date: 03/22/2024
MLS ID: 2015674
Property Type: Single Family
Justin Croy Lic # justin croy@exprealty com (904) 803-7897 http://justincroy exprealty com
Listed Price: $398,500 ($247/ft) Sold Price: $0 Status: Pending All information provided is deemed reliable but is not guaranteed and should be independently veri�ed
Pool Deck Air Condition Master on Main
COMPARABLE DETAILS
Distance: 1 45 mi away
Comp Type: Sold
Year: 1995
Bed Count: 3
Bath Count: 2 (Full: 2)
Living Area Sqft: 1,506
Basement: none
Garages: 2
Date: 02/23/2024
116 MLS ID: 1250536 Property Type: Single Family
Justin Croy Lic # justin croy@exprealty com (904) 803-7897 http://justincroy exprealty com 749 TEE TIME Lane Listed Price: $389,000 ($258/ft) Sold Price: $399,000 Status: Closed All information provided is deemed reliable but is not guaranteed and should be independently veri�ed
Deck Golf Course Air Condition Master on Main LISTED INFO Sold
DOM:
Association Fees: $480 (Annually) FEATURES
876 PUTTERS GREEN Way N
COMPARABLE DETAILS
Distance: 1 46 mi away
Comp Type: Sold
Year: 1997
Bed Count: 3
Bath Count: 2 (Full: 2)
Living Area Sqft: 1,509
Basement: none
Garages: 2
Association Fees: $490 (Annually)
Sold Date: 01/22/2024 DOM: 18
MLS ID: 1260371
Property Type: Single Family
Justin Croy Lic # justin croy@exprealty com (904) 803-7897 http://justincroy exprealty com
Listed Price: $399,000 ($264/ft) Sold Price: $399,000 Status: Closed All information provided is deemed reliable but is not guaranteed and should be independently veri�ed
FEATURES Pool Deck Golf Course Air Condition LISTED INFO
$500,000
$450,000
$400,000
$350,000
$300,000
PRICE PER SQUARE FOOT ($/SQFT)
PRICE PER SQUARE FOOT
WHAT IS PRICE PER SQUARE FOOT?
The average price per square foot is calculated by dividing the list/sold price by the property’s living area size.
HOW IS PRICE PER SQUARE FOOT USED IN A PRICE ANALYSIS?
On its own, the price per square foot is not a very insightful metric However, when compared to other similar-sized properties in the area, the price per square foot metric can be bene�cial for illustrating norms and outliers
ACTIVES
COMING SOON
PENDING CLOSED $258
Justin Croy Lic # justin croy@exprealty com (904) 803-7897 http://justincroy exprealty com 1,200 1,300 1,400 1,500 1,600 1,700 SQFT
P R I C E
Pricing Rate of Change
PRICING RATE OF CHANGE
WHAT IS PRICING RATE OF CHANGE?
Pricing rate of change is the difference between the list price at the start of escrow and the sold price at the close of escrow.
HOW IS PRICING RATE OF CHANGE USED IN A PRICE ANALYSIS?
The pricing rate of change can help determine momentum and gauge the possibility of a multiple offer scenario Given that the data’s crux is rooted in sold data, it is imperative to remember what has happened and does not necessarily represent recent trends or what might currently be happening in the active market.
LIST PRICE CLOSED PRICE
2%
Lic
justin croy@exprealty com (904) 803-7897 http://justincroy exprealty com 01/10 01/12 01/22 02/20 02/23 03/20 03/29 04/17 $0 $150,000 $300,000 $450,000 $600,000
Justin Croy
#
SELLING PACE
Half of closed comparables took less than 95 days on market
WHAT IS SELLING PACE?
Selling pace highlights the days on the market from the original listing date to the closing date of each comparable against the �nal closing sale price.
HOW IS SELLING PACE USED IN A PRICE ANALYSIS?
Examining days on the market in the same view as sold price can help pinpoint whether pricing affects the selling pace of comparable homes in the neighborhood In a market with low buyer momentum, a property that’s priced too high can sit too long and lead to costly price reductions
95
Lic
justin croy@exprealty com (904) 803-7897 http://justincroy exprealty com 0 10 20 30 40 50 60 70 80 90 100 110 120 130 140 DOM
S O L D P R I C E
Justin Croy
#
$300,000 $350,000 $400,000 $450,000 $500,000
FRESH/STALE


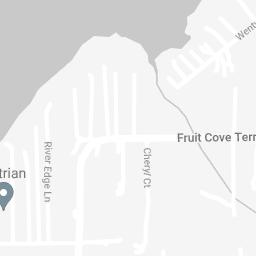


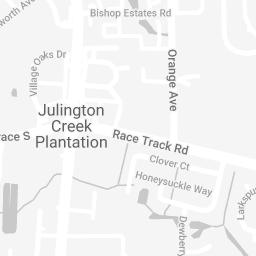
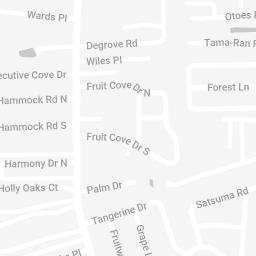
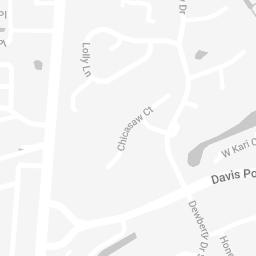
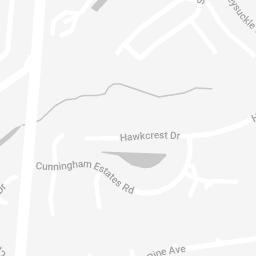


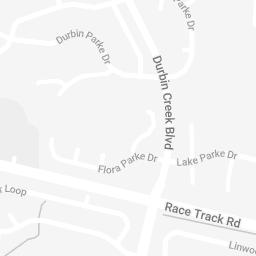
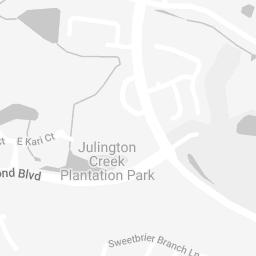
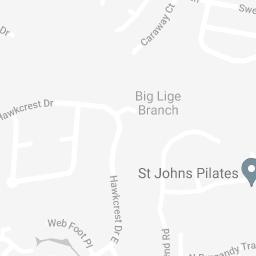


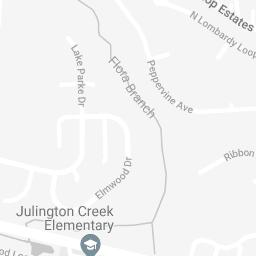
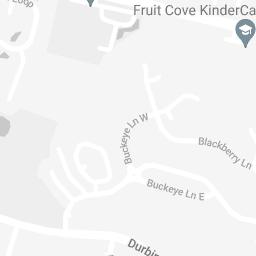
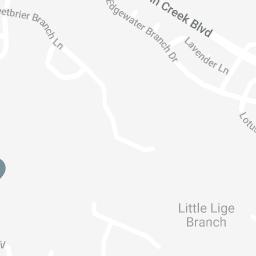


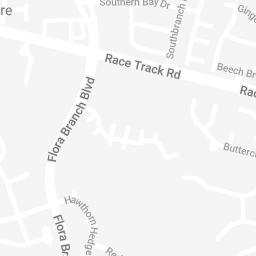
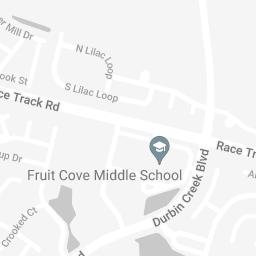
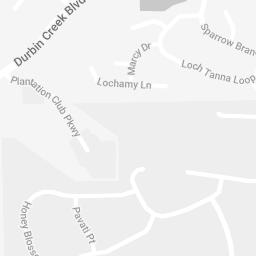
currently on the market, where they are located in relation to the subject property, and how long they have been on the market (a fresh or stale indicator).
HOW IS FRESH/STALE USED IN A PRICE ANALYSIS?
Quantity, proximity, and time spent on the market are critical variables in determining a solid offense pricing strategy Quantity helps identify other options buyers have, while the time spent on the market can reveal pricing expectations and price fatigue
0 s 4 v e on market for 1 week Fresh S t o
Justin Croy Lic # justin croy@exprealty com (904) 803-7897 http://justincroy exprealty com Map data ©2024 Google Report amap error
AVERAGE MONTHLY LIST/SALE PRICE
AVERAGE LIST PRICE
AVERAGE SALE PRICE
Average list price of all monthly active and pending comparables
$410,680
WHAT IS AVERAGE MONTHLY PRICE?
The chart illustrates a monthly comparison of the average list and sold price of comparable properties.
HOW IS AVERAGE MONTHLY PRICE USED IN A PRICE ANALYSIS?
The monthly trend can help identify how supply and demand is in�uencing the list price of comparable properties While the trend can be very insightful for gauging how aggressive/conservative to price, it’s critical to balance these insights with an analysis of recent closed sales too.
justin croy@exprealty com (904) 803-7897 http://justincroy exprealty com Dec
Jan 2024 Feb 2024 Mar 2024 Apr 2024 May 2024
Justin Croy Lic #
2023
$0 $150,000 $300,000 $450,000 $600,000
Current Active Shelf Life
5 DAYS
ACTIVE SHELF LIFE
WHAT IS ACTIVE SHELF LIFE?
Active shelf life highlights the average number of days active and pending comparable properties are on the market each month.
HOW IS ACTIVE SHELF LIFE USED IN A PRICE ANALYSIS?
Understanding how long similar homes are sitting on the market can help set expectations on how long it might take to �nd a buyer – and when to consider a price reduction.
Lic
justin croy@exprealty com (904) 803-7897 http://justincroy exprealty com 0 10 DAYS ON MARKET
$450,000 L I S T P R I C E
Justin Croy
#
$400,000