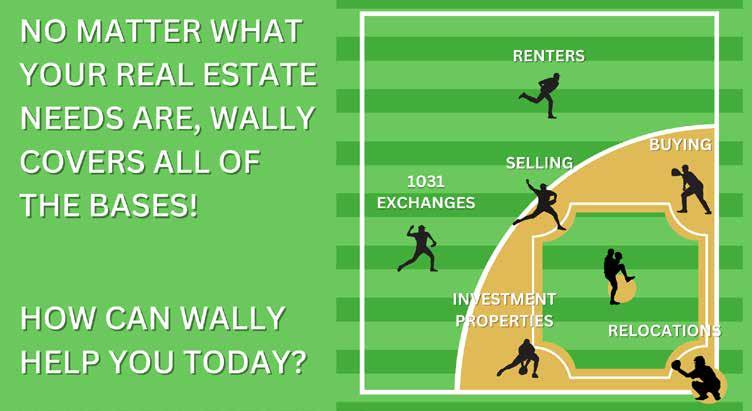
5 Reasons To List Your Home With Wally Hughes


put my clients’ interests above all else by NEGOTIATING the best possible outcome!

When I list your property, my marketing not only reaches the local buyers, it also reaches buyers globally! As a partner with RE/ MAX Global, your property will be seen in over 95 countries and by my 100,000 colleagues around the world! We all share the same goal, getting your property sold!


West Broad Village YOUR WEST BROAD VILLAGE REAL ESTATE SPECIALIST IN SALES, RELOCATION, NEW AND RESALE HOMES, AND INVESTMENTS PROPERTIES PRESENTED BY WALLY HUGHES Real Estate Market Report | August 2023 PREPARED ESPECIALLY FOR WWW.WESTBROADVILLAGEPROPERTIES.COM Wally Hughes Associate Broker, ABR, CRS, GRI, CDPE Each office independently owned and operated. 804.513.3240 WallyHughes@gmail.com www.WestBroadVillageProperties.com www.WallyHughes.com 200 Westgate Pkwy, Ste #102 Richmond, VA 23233 Office: 804.360.5200 COMMONWEALTH Published by REAL Marketing (RM) | www.REALMarketing4You.com | 858.952.4280 | ©2023 1 I have the EXPERIENCE in selling homes in West Broad Village! My real estate career started in the West End of Henrico in 1982. I have focused on sales and market trends in West Broad Village for
EXPERIENCE 2 My MARKETING plan is professionally created - flyers, photography, staging, property website, public and broker catered open houses,
mailings, and
MARKETING 3 TRUST - over 80% of my business is
TRUST 4
NEGOTIATION 5
GLOBAL MARKETING
several years!
direct
more!
referrals from past clients. Repeat business is what I strive for every day!
I
Leonardo and Angelica Washington
WEST BROAD VILLAGE MARKET REPORT
804.513.3240

Sell with a West Broad Village Specialist and Buy with a trusted Richmond Realtor® with over 35 years of experience. It’s the experience that counts!

Local Market Update – June 2023
WallyHughes@gmail.com
Local Market Update
Local Market Update – June 2023
www.WestBroadVillageProperties.com www.WallyHughes.com


MLS Area 22
June 2023
MLS Area 22
MLS Area 22
MLS Area 22
MLS Area 22
Wally Hughes and RE/MAX Commonwealth are not in any way affiliated with West Broad Village Home Owners Association, nor is this in any way an official advertisement or publication of West Broad Village. ©2023 RE/MAX All rights reserved. This representation is based on sales and data reported by multiple brokers/agents to the CVRMLS as of July 21st, 2023. Listings and sales may not be those of RE/MAX Commonwealth. The CVRMLS does not guarantee the accuracy of this data, which may not reflect all of the real estate activity in the area. This market report is not intended to solicit properties already listed for sale nor intended to cause a breach of an existing agency relationship. E&OE covered. Wally Hughes is a licensed Agent in the Commonwealth of Virginia.

Wally Hughes Associate Broker ABR, CRS, GRI, CDPE
NORWOOD’S AVERAGES (1 Unit) Avg Sold Price Avg PPSQF Avg. Building Size Highest Sale Lowest Sale $591,000 $204.35 2,892 $591,000 $591,000 FAIRGATE’S AVERAGES (2 Units) Avg Sold Price Avg PPSQF Avg. Building Size Highest Sale Lowest Sale $462,500 $229.98 2,011 $470,000 $455,000 BROWNSTONE’S AVERAGES (4 Units) Avg Sold Price Avg PPSQF Avg. Building Size Highest Sale Lowest Sale $632,125 $192.52 3,335 $698,500 $545,000 VILLAGE TOWN’S AVERAGES (2 Units) Avg Sold Price Avg PPSQF Avg. Building Size Highest Sale Lowest Sale $476,825 $249.06 2,969 $492,300 $465,000 MCKINNEY AVERAGES (2 Units) Avg Sold Price Avg PPSQF Avg. Building Size Highest Sale Lowest Sale $442,018 $298.85 1,504 $445,038 $439,000 URBAN BROWNSTONES (2 Unit) Sold Price PPSQF Building Size Highest Sale Lowest Sale $662,500 $234.26 2,828 $675,000 $650,000
Local Market Update – June 2023 A Research Tool Provided by Centra V rg nia Regiona MLS
22-Henr co Single Family June Year to Date Key Metrics 2022 2023 % Change Thru 6-2022 Thru 6-2023 % Change New List ngs 152 88 - 42 1% 670 464 - 30 7% Pending Sa es 123 93 - 24.4% 593 423 - 28.7% Closed Sales 125 99 - 20.8% 504 376 - 25.4% Days on Market Unt Sale 7 10 + 42 9% 9 10 + 11 1% Median Sales Pr ce* $473,894 $531 600 + 12 2% $461,000 $492 378 + 6 8% Average Sales Pr ce* $605,211 $637 048 + 5 3% $567,542 $582 086 + 2 6% Percent of Or ginal L st Pr ce Rece ved* 109 8% 104.9% - 4 5% 109 4% 104.6% - 4 4% Inventory o Homes for Sa e 77 41 - 46 8% ––Months Supp y o Inventory 0 8 0.6 - 25 0% ––Condo/Town June Year to Date Key Metrics 2022 2023 % Change Thru 6-2022 Thru 6-2023 % Change New List ngs 48 49 + 2 1% 248 256 + 3 2% Pending Sa es 49 43 - 12 2% 236 235 - 0 4% Closed Sales 46 36 - 21 7% 204 214 + 4 9% Days on Market Unt Sale 15 22 + 46 7% 31 23 - 25 8% Median Sales Pr ce* $360,000 $470 000 + 30 6% $375,000 $375 220 + 0 1% Average Sales Pr ce* $385,249 $493 127 + 28 0% $402,166 $404 793 + 0 7% Percent of Or ginal L st Pr ce Rece ved* 102 9% 104.3% + 1 4% 103 7% 101.9% - 1 7% Inventory o Homes for Sa e 39 43 + 10 3% Months Supp y o Inventory 1 0 1 2 + 20 0% Does no accoun for sa e concessions and o downpayment assistance Percent changes are ca cu a ed using rounded figures and can some mes ook ex reme due to sma samp e size A ro ng 12-mon h ca cu a on epresents the cur ent month and the 11 mon hs pr or n a sing e data po nt f no ac vity occu red dur ng a month he ine ex ends to he nex ava ab e data po nt Median Sales Price - Single-Family Ro ing 12-Mon h Calcu at on CVRMLS MLS Area 22 1-2012 1-2014 1-2016 1-2018 1-2020 1-2022 $150 000 $200 000 $250 000 $300 000 $350 000 $400 000 $450 000 $500 000 Median Sales Price - Condo/Town Rol ng 12-Month Ca cu a ion CVRMLS MLS Area 22 1-2012 1-2014 1-2016 1-2018 1-2020 1-2022 $150 000 $200 000 $250 000 $300 000 $350 000 $400 000 Cur ent as o Ju y 10 2023 A da a f om Cent a V g n a Reg ona MLS Repor © 2023 Show ngT me
A Research Tool Provided by Centra V rg nia Regiona MLS
22-Henr co Single Family June Year to Date Key Metrics 2022 2023 % Change Thru 6-2022 Thru 6-2023 % Change New List ngs 152 88 - 42 1% 670 464 - 30 7% Pending Sa es 123 93 - 24 4% 593 423 - 28 7% Closed Sales 125 99 - 20 8% 504 376 - 25 4% Days on Market Unt Sale 7 10 + 42 9% 9 10 + 11 1% Median Sales Pr ce* $473,894 $531 600 + 12 2% $461,000 $492 378 + 6 8% Average Sales Pr ce* $605,211 $637 048 + 5 3% $567,542 $582 086 + 2 6% Percent of Or ginal L st Pr ce Rece ved* 109 8% 104 9% - 4 5% 109 4% 104 6% - 4 4% Inventory o Homes for Sa e 77 41 - 46 8% Months Supp y o Inventory 0 8 0 6 - 25 0% Condo/Town June Year to Date Key Metrics 2022 2023 % Change Thru 6-2022 Thru 6-2023 % Change New List ngs 48 49 + 2 1% 248 256 + 3 2% Pending Sa es 49 43 - 12 2% 236 235 - 0 4% Closed Sales 46 36 - 21 7% 204 214 + 4 9% Days on Market Unt Sale 15 22 + 46 7% 31 23 - 25 8% Median Sales Pr ce* $360,000 $470 000 + 30 6% $375,000 $375 220 + 0 1% Average Sales Pr ce* $385,249 $493 127 + 28 0% $402,166 $404,793 + 0 7% Percent of Or ginal L st Pr ce Rece ved* 102 9% 104 3% + 1 4% 103 7% 101 9% - 1 7% Inventory o Homes for Sa e 39 43 + 10.3% ––Months Supp y o Inventory 1 0 1.2 + 20 0% ––Does no accoun for sa e concessions and o downpayment assistance Percent changes are ca cu a ed using rounded figures and can some mes ook ex reme due to sma samp e size A ro ng 12-mon h ca cu a on epresents the cur ent month and the 11 mon hs pr or n a sing e data po nt f no ac vity occu red dur ng a month he ine ex ends to he nex ava ab e data po nt Median Sales Price - Single-Family Ro ing 12-Mon h Calcu at on CVRMLS MLS Area 22 1-2012 1-2014 1-2016 1-2018 1-2020 1-2022 $150 000 $250 000 $300 000 $350 000 $450 000 $500 000 Median Sales Price - Condo/Town Rol ng 12-Month Ca cu a ion CVRMLS MLS Area 22 1-2012 1-2014 1-2016 1-2018 1-2020 1-2022 $150 000 $200 000 $250 000 $300 000 $350 000 $400 000 Cur ent as o Ju y 10 2023 A da a f om Cent a V g n a Reg ona MLS Repor © 2023 Show ngT me
–
A Research Tool Provided by Centra V rg nia Regiona MLS
22-Henr co Single Family June Year to Date Key Metrics 2022 2023 % Change Thru 6-2022 Thru 6-2023 % Change New List ngs 152 88 - 42 1% 670 464 - 30 7% Pending Sa es 123 93 - 24 4% 593 423 - 28 7% Closed Sales 125 99 - 20 8% 504 376 - 25 4% Days on Market Unt Sale 7 10 + 42 9% 9 10 + 11 1% Median Sales Pr ce* $473,894 $531 600 + 12 2% $461,000 $492 378 + 6 8% Average Sales Pr ce* $605,211 $637 048 + 5 3% $567,542 $582 086 + 2 6% Percent of Or ginal L st Pr ce Rece ved* 109 8% 104 9% - 4 5% 109 4% 104 6% - 4 4% Inventory o Homes for Sa e 77 41 - 46 8% Months Supp y o Inventory 0 8 0 6 - 25 0% Condo/Town June Year to Date Key Metrics 2022 2023 % Change Thru 6-2022 Thru 6-2023 % Change New List ngs 48 49 + 2 1% 248 256 + 3 2% Pending Sa es 49 43 - 12 2% 236 235 - 0 4% Closed Sales 46 36 - 21 7% 204 214 + 4 9% Days on Market Unt Sale 15 22 + 46.7% 31 23 - 25.8% Median Sales Pr ce* $360,000 $470 000 + 30 6% $375,000 $375 220 + 0 1% Average Sales Pr ce* $385,249 $493 127 + 28 0% $402,166 $404,793 + 0 7% Percent of Or ginal L st Pr ce Rece ved* 102 9% 104.3% + 1 4% 103 7% 101.9% - 1 7% Inventory o Homes for Sa e 39 43 + 10 3% ––Months Supp y o Inventory 1 0 1.2 + 20 0% ––Does no accoun for sa e concessions and o downpayment assistance Percent changes are ca cu a ed using rounded figures and can some mes ook ex reme due to sma samp e size A ro ng 12-mon h ca cu a on epresents the cur ent month and the 11 mon hs pr or n a sing e data po nt f no ac vity occu red dur ng a month he ine ex ends to he nex ava ab e data po nt Median Sales Price - Single-Family Ro ing 12-Mon h Calcu at on CVRMLS MLS Area 22 1-2012 1-2014 1-2016 1-2018 1-2020 1-2022 $150 000 $200 000 $250 000 $300 000 $350 000 $400 000 $450 000 $500 000 Median Sales Price - Condo/Town Rol ng 12-Month Ca cu a ion CVRMLS MLS Area 22 1-2012 1-2014 1-2016 1-2018 1-2020 1-2022 $150 000 $200 000 $250 000 $300 000 $350 000 $400 000 Cur ent as o Ju y 10 2023 A da a f om Cent a V g n a Reg ona MLS Repor © 2023 Show ngT me
A Research Tool Provided by Centra V rg nia Regiona MLS
22-Henr co Single Family June Year to Date Key Metrics 2022 2023 % Change Thru 6-2022 Thru 6-2023 % Change New List ngs 152 88 - 42 1% 670 464 - 30 7% Pending Sa es 123 93 - 24 4% 593 423 - 28 7% Closed Sales 125 99 - 20 8% 504 376 - 25 4% Days on Market Unt Sale 7 10 + 42 9% 9 10 + 11 1% Median Sales Pr ce* $473,894 $531 600 + 12 2% $461,000 $492 378 + 6 8% Average Sales Pr ce* $605,211 $637 048 + 5 3% $567,542 $582 086 + 2 6% Percent of Or ginal L st Pr ce Rece ved* 109 8% 104 9% - 4 5% 109 4% 104 6% - 4 4% Inventory o Homes for Sa e 77 41 - 46 8% Months Supp y o Inventory 0 8 0 6 - 25 0% Condo/Town June Year to Date Key Metrics 2022 2023 % Change Thru 6-2022 Thru 6-2023 % Change New List ngs 48 49 + 2 1% 248 256 + 3 2% Pending Sa es 49 43 - 12 2% 236 235 - 0 4% Closed Sales 46 36 - 21 7% 204 214 + 4 9% Days on Market Unt Sale 15 22 + 46 7% 31 23 - 25 8% Median Sales Pr ce* $360,000 $470 000 + 30 6% $375,000 $375 220 + 0 1% Average Sales Pr ce* $385,249 $493 127 + 28.0% $402,166 $404 793 + 0.7% Percent of Or ginal L st Pr ce Rece ved* 102 9% 104.3% + 1 4% 103.7% 101.9% - 1 7% Inventory o Homes for Sa e 39 43 + 10 3% ––Months Supp y o Inventory 1 0 1.2 + 20 0% ––Does no accoun for sa e concessions and o downpayment assistance Percent changes are ca cu a ed using rounded figures and can some mes ook ex reme due to sma samp e size A ro ng 12-mon h ca cu a on epresents the cur ent month and the 11 mon hs pr or n a sing e data po nt f no ac vity occu red dur ng a month he ine ex ends to he nex ava ab e data po nt Median Sales Price - Single-Family Ro ing 12-Mon h Calcu at on CVRMLS MLS Area 22 1-2012 1-2014 1-2016 1-2018 1-2020 1-2022 $150 000 $200 000 $250 000 $300 000 $350 000 $400 000 $450 000 $500 000 Median Sales Price - Condo/Town Rol ng 12-Month Ca cu a ion CVRMLS MLS Area 22 1-2012 1-2014 1-2016 1-2018 1-2020 1-2022 $150 000 $200 000 $250 000 $300 000 $350 000 $400 000 Cur ent as o Ju y 10 2023 A da a f om Cent a V g n a Reg ona MLS Repor © 2023 Show ngT me
A Research Tool Provided by Centra V rg nia Regiona MLS
Local Market Update – June 2023
22-Henr co Single Family June Year to Date Key Metrics 2022 2023 % Change Thru 6-2022 Thru 6-2023 % Change New List ngs 152 42 30 Pending Sa es 123 - 24 4% 593 423 - 28 7% Closed Sales 125 99 - 20 8% 504 376 - 25 4% Days on Market Unt Sale 7 10 + 42 9% 9 10 + 11 1% Median Sales Pr ce* $473,894 $531,600 + 12 2% $461,000 $492,378 + 6 8% Average Sales Pr ce* $605,211 $637,048 + 5 3% $567,542 $582,086 + 2 6% Percent of Or gina L st Pr ce Rece ved* 109 8% 104 9% - 4 5% 109 4% 104 6% - 4 4% Inventory o Homes for Sa e 77 41 - 46 8% Months Supp y of Inventory 0 8 0 6 - 25 0% Condo/Town June Year to Date Key Metrics 2022 2023 % Change Thru 6-2022 Thru 6-2023 % Change New List ngs 48 49 + 2 1% 248 256 + 3 2% Pending Sa es 49 43 - 12 2% 236 235 - 0 4% Closed Sales 46 36 - 21 7% 204 214 + 4 9% Days on Market Unt Sale 15 22 + 46 7% 31 23 - 25 8% Median Sales Pr ce* $360,000 $470,000 + 30 6% $375,000 $375,220 + 0 1% Average Sales Pr ce* $385,249 $493,127 + 28 0% $402,166 $404,793 + 0 7% Percent of Or gina L st Pr ce Rece ved* 102 9% 104 3% + 1 4% 103 7% 101 9% - 1 7% Inventory o Homes for Sa e 39 43 + 10 3% Months Supp y of Inventory 1 0 1 2 + 20 0% Does no accoun o sa e concessions and o downpayment assistance Percent changes are ca cu a ed using rounded figures and can some mes ook ext eme due to sma samp e size A ro ng 12-mon h ca cu a on epresen s he cur ent month and the 11 mon hs pr or n a sing e data po nt I no ac vity occu red dur ng a month he ne ex ends to he nex ava ab e data po nt Median Sales Price - Single-Family Ro ing 12-Mon h Ca cu at on CVRMLS MLS Area 22 1-2012 1-2014 1-2016 1-2018 1-2020 1-2022 $150 000 $200 000 $250 000 $300 000 $450 000 000 Median Sales Price - Condo/Town Rol ng 12-Month Ca cu a ion CVRMLS MLS Area 22 1-2012 1-2014 1-2016 1-2018 1-2020 1-2022 $150 000 $200 000 $250 000 $300 000 $350 000 $400 000 Cur en as o Ju y 10 2023 A da a om Cent a V g n a Reg ona MLS Repor © 2023 Show ngT me Your neighbors know! Do you want to know recent neighborhood prices? Scan with your camera to see the latest sales near you!
