

"While the overall North American luxury market is demonstrating renewed balance, rising sales, and gradually expanding choice for buyers, the reality at the local level remains far more nuanced."
"While the overall North American luxury market is demonstrating renewed balance, rising sales, and gradually expanding choice for buyers, the reality at the local level remains far more nuanced."
North America’s luxury real estate market continues to demonstrate the steady equilibrium that has defined recent months, showing neither signs of overheating nor slipping into decline. Instead, the sector is exhibiting a level of maturity marked by consistent performance, measured growth, and sustained buyer confidence.
October delivered a solid month for luxury sales, with transaction volume rising both year-over-year and month-over-month for luxury single-family homes and attached properties (condos and townhomes). Listing inventory is gradually expanding, offering buyers more choice, yet pricing discipline remains intact: the ratio of sold-to-list price is holding steady, signaling that sellers remain realistic and buyers are willing to meet market value.
Collectively, these indicators reinforce a key narrative that stability is now a defining characteristic of the luxury segment, which in turn suggests that the market is in a healthier, more sustainable cycle rather than one driven by volatility.
Luxury single-family sales in North America continued their upward momentum in October, with transactions rising 9.9% year-over-year and 6.5% month-over-month. This reinforces the pattern to date for 2025, where sales activity has outperformed 2024, suggesting a more engaged and motivated buyer pool.
Inventory levels also remain elevated, up 14.6% compared to October 2024, though down 3.1% from September. The slight month-over-month decline is linked to two counterbalancing forces: fewer new listings coming to market (down 7.3% versus September), paired with stronger sales activity. Interestingly, this pullback in new listings runs contrary to expectations that recent interest rate reductions might encourage more sellers to re-enter the market. However, on an annual basis, new listings are still up 14.3% from last October, an indication that seller confidence has improved meaningfully since 2024.
Pricing continues to hold firm. The median sold price dipped just 0.7% year-over-year, accompanied by a marginal softening in the sales-to-list ratio from 98.2% to 97.8%. These are mild adjustments rather than indicators of price erosion.
Taken together, the data points to a stable, balanced luxury single-family market. The shifts observed are consistent with normal seasonal and annual variations, rather than signs of volatility or structural change.
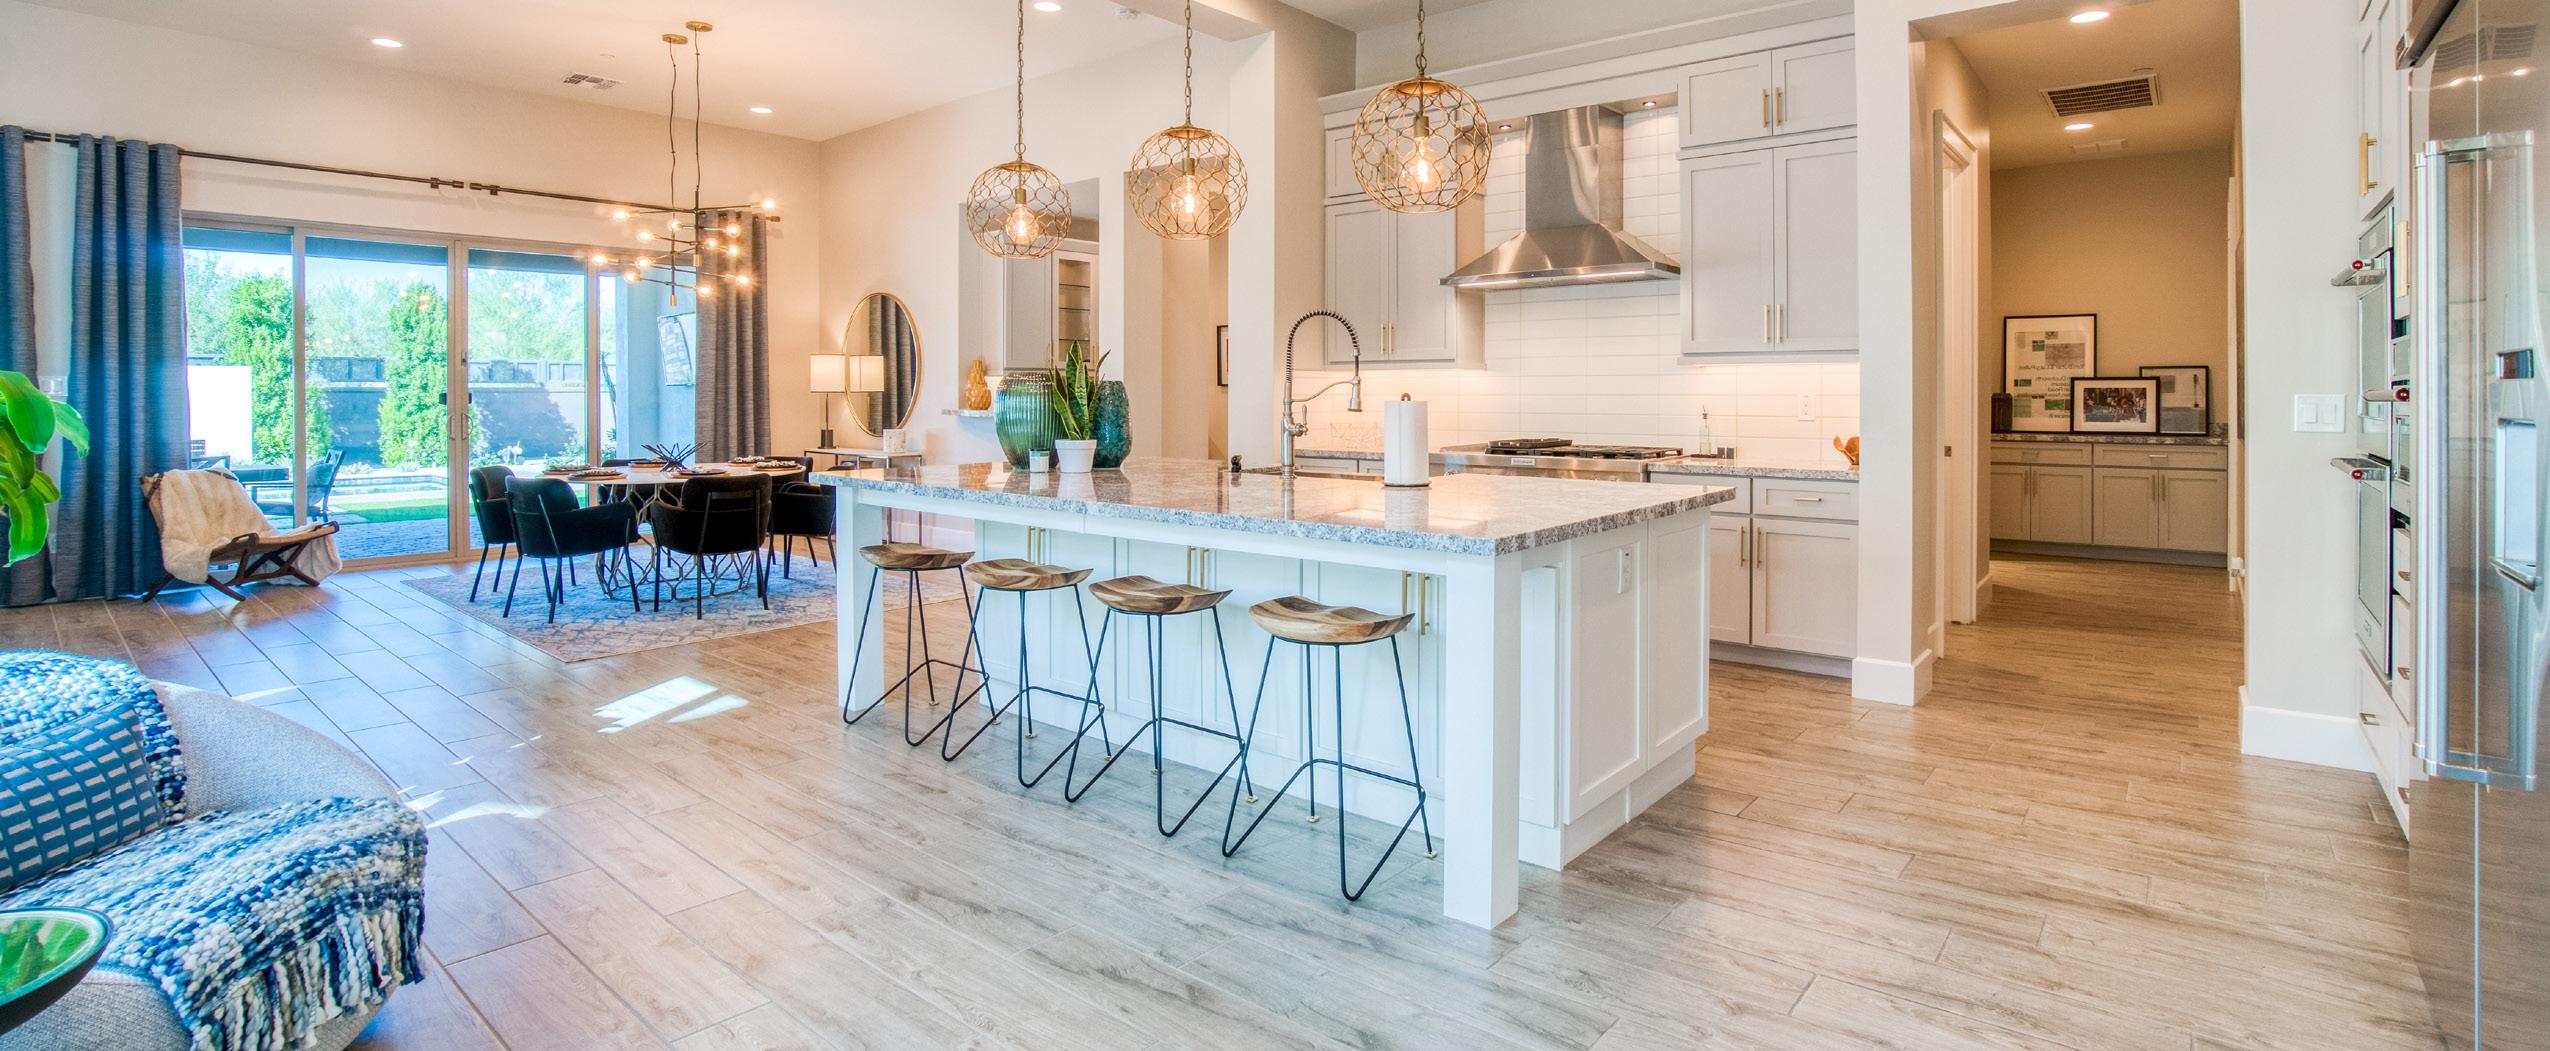
The luxury attached segment (compromised of condos and townhomes) also continued its positive momentum in October, albeit at a more moderate pace than single-family homes. Sales rose 3.0% year-over-year and 2.2% month-over-month, extending the recovery first seen in September when the market posted its first monthly sales increase since May 2025. As a result, the year-to-date sales gap has narrowed meaningfully: attached transactions are now just 1.8% below 2024 levels, compared to a 4.3% shortfall last month.
Inventory remains on an upward trend, up 10.5% year-over-year and edging 0.3% higher month-overmonth. The slight monthly rise mirrors the single-family market dynamic: fewer new listings coming to market (down 6.1% versus September) combined with stronger sales activity. Despite the monthly dip, new listings are still 9.4% higher than a year ago, suggesting sellers are gradually regaining confidence, even if they have not yet returned at the pace hoped for following recent interest rate cuts.
Pricing saw more noticeable movement. The median sold price declined 7.35% year-over-year in October, however, this could likely be influenced by a shift in buyer composition rather than a downward repricing of the market as a whole. With interest rates trending down, easing affordability constraints, more buyers appear to be transacting in the lower end of the luxury attached property spectrum, thereby, rebalancing the market after several months where upper-tier units were more dominate comparatively. The sales-to-list ratio edged higher from 98.2% in September to 98.3% in October, reinforcing that sellers are largely achieving near-asking prices.
Overall, the attached luxury segment remains stable and is gradually strengthening. Momentum is trending back toward a sellerleaning balanced market - reversing the softer conditions observed since April - though not yet enough to signal a clear shift in market power.
While the overall North American luxury market is demonstrating renewed balance, rising sales,

and gradually expanding choice for buyers, the reality at the local level remains far more nuanced. Beneath the stability of the aggregate data, local markets are still moving at very different speeds, reinforcing the familiar “tale of two cities” dynamic that now defines the luxury landscape.
In some luxury markets, inventory remains tight, properties sell quickly, and demand continues to outpace supply. These markets are often characterized by enduring lifestyle appeal, strong wealth inflows, and limited inventory, which are conditions that support price resilience and a seller-leaning environment.
Conversely, other luxury markets are experiencing tempered demand, longer days on market, and a more cautious buyer mindset. Here, higher inventory levels and shifting preferences among affluent buyers are creating pockets of oversupply and/or slower absorption.
Today’s fragmented performance is being shaped by a powerful mix of economic forces, lifestyle evolution, and changing affluent buyer behaviour. While the luxury sector is stable overall, these underlying dynamics are creating divergent outcomes:
At the forefront is the continued movement of wealth across regions. High-net-worth households are still relocating in search of tax efficiency, enhanced lifestyles, and business opportunities, and this redistribution of wealth remains one of the most influential drivers of market performance.
Markets experiencing net inbound wealth are seeing stronger demand, firmer pricing power, and greater market confidence. In contrast, those facing outbound affluent migration are encountering softer conditions, as their value proposition no longer aligns as strongly with the priorities of today’s luxury buyer.
Lifestyle expectations have evolved permanently. For many luxury buyers, quality of life has eclipsed proximity to traditional corporate hubs. Wellness, access to nature, climate, and “live-where-you-love” flexibility are redefining where affluent buyers choose to invest.
Luxury expectations have also risen: branded residences, hospitality-style living, and wellness-driven
amenities now set the benchmark. Climate resilience and sustainability have become integral to buying decisions, with greater focus on long-term environmental risk and insurability.
Availability of luxury inventory is still a major differentiator. Supply-constrained markets maintain pricing strength and velocity, while those with abundant new development, particularly in the attached luxury segment, are seeing slower absorption and more selective buyer behaviour.
Urban and suburban dynamics continue to evolve. Not all major cities have regained the momentum they lost during the pandemic. The ones that have re-energized their urban cores with elevated amenities, culture, walkability, and luxury services are successfully attracting affluent residents back. Meanwhile, luxury suburban and resort communities that built lifestyle-driven value propositions offering nature, privacy, and space remain in high demand.
Finally, sentiment and psychology continue to play a decisive role. While affluent buyers generally have the financial means to purchase at any time, it is confidence that dictates when they choose to engage. Markets that project economic stability, political consistency, and a strong sense of safety tend to inspire greater trust for affluent buyers.
Interest rates are also influencing behaviour, particularly in the mid-tier luxury and condo segments where financing matters more, affecting urgency and absorption rates even as cash buyers remain active at the ultra-luxury level.
The result is a luxury real estate market that is stable overall, yet highly segmented. Success is increasingly determined at the local level and defined by how well a market meets the evolving financial, emotional, and experiential expectations of today’s affluent buyer.

Single-Family Homes
Attached Homes Single-Family List Price Attached List Price
All data is based off median values. Median prices represent properties priced above respective city benchmark prices.
$1,700,000
$1,500,000
$1,300,000
$1,100,000
$900,000
$700,000
$500,000
• Official Market Type: Seller's Market with a 23.31% Sales Ratio.1
• Homes are selling for an average of 97.82% of list price.
• The median luxury threshold2 price is $900,000, and the median luxury home sales price is $1,312,500.
• Markets with the Highest Median Sales Price: Pitkin County ($11,375,000), Eagle County ($5,125,000), Whistler ($4,535,000), and Paradise Valley ($4,400,000).
• Markets with the Highest Sales Ratio: San Francisco (114.30%), Baltimore City (85.00%), Silicon Valley (79.20%), and East Bay (66.60%).
1
• Official Market Type: Balanced Market with a 17.22% Sales Ratio.1
• Attached homes are selling for an average of 98.33% of list price.
• The median luxury threshold2 price is $700,000, and the median attached luxury sale price is $855,375.
• Markets with the Highest Median Sales Price: Pitkin County ($3,062,500), Park City ($2,895,000), Whistler ($2,800,000), and San Francisco ($2,495,000).
• Markets with the Highest Sales Ratio: Morris County, NJ (123.50%), Fairfax County, VA (77.60%), Coastal Connecticut (63.90%), and Howard County, MD (61.10%).
The Institute for Luxury Home Marketing has analyzed a number of metrics — including sales prices, sales volumes, number of sales, sales-price-to-list-price ratios, days on market and price-per-squarefoot – to provide you a comprehensive North American Luxury Market report.
Additionally, we have further examined all of the individual luxury markets to provide both an overview and an in-depth analysis - including, where data is sufficient, a breakdown by luxury singlefamily homes and luxury attached homes.
It is our intention to include additional luxury markets on a continual basis. If your market is not featured, please contact us so we can implement the necessary qualification process. More in-depth reports on the luxury communities in your market are available as well.
Looking through this report, you will notice three distinct market statuses, Buyer's Market, Seller's Market, and Balanced Market. A Buyer's Market indicates that buyers have greater control over the price point. This market type is demonstrated by a substantial number of homes on the market and few sales, suggesting demand for residential properties is slow for that market and/or price point.
By contrast, a Seller's Market gives sellers greater control over the price point. Typically, this means there are few homes on the market and a generous demand, causing competition between buyers who ultimately drive sales prices higher.
A Balanced Market indicates that neither the buyers nor the sellers control the price point at which that property will sell and that there is neither a glut nor a lack of inventory. Typically, this type of market sees a stabilization of both the list and sold price, the length of time the property is on the market as well as the expectancy amongst homeowners in their respective communities – so long as their home is priced in accordance with the current market value.
DAYS ON MARKET: Measures the number of days a home is available on the market before a purchase offer is accepted.
LUXURY BENCHMARK PRICE: The price point that marks the transition from traditional homes to luxury homes.
NEW LISTINGS: The number of homes that entered the market during the current month.
PRICE PER SQUARE FOOT: Measures the dollar amount of the home's price for an individual square foot.
SALES RATIO: Sales Ratio defines market speed and determines whether the market currently favors buyers or sellers. A Buyer's Market has a Sales Ratio of less than 12%; a Balanced Market has a ratio of 12% up to 21%; a Seller's Market has a ratio of 21% or higher. A Sales Ratio greater than 100% indicates the number of sold listings exceeds the number of listings available at the end of the month.
SP/LP RATIO: The Sales Price/List Price Ratio compares the value of the sold price to the value of the list price.
The Luxury Market Report is your guide to luxury real estate market data and trends for North America
Produced monthly by The Institute for Luxury Home Marketing, this report provides an in-depth look at the top residential markets across the United States and Canada. Within the individual markets, you will find established luxury benchmark prices and detailed survey of luxury active and sold properties designed to showcase current market status and recent trends. The national report illustrates a compilation of the top North American markets to review overall standards and trends.
Copyright © 2025 Institute for Luxury Home Marketing | www.luxuryhomemarketing.com | 214.485.3000
The Luxury Market Report is a monthly analysis provided by The Institute for Luxury Home Marketing. Luxury benchmark prices are determined by The Institute. This active and sold data has been provided by REAL Marketing, who has compiled the data through various sources, including local MLS boards, local tax records and Realtor.com. Data is deemed reliable to the best of our knowledge, but is not guaranteed.