Lafayette Square
R e a l E s ta te M a r k e t Repor t For h o m e s va lu e d a t $ 1 0 0 K a n d a b o v e .
Future Friends and Neighbors, It is such a pleasure helping my Lafayette Square clients with all of your real estate needs. No Thanksgiving would be complete without thanking those who make my job so special. So, thank you, and I hope you have a very Happy Thanksgiving! Call me today at 314-616-8100 and let me assist you with your goals this fall.
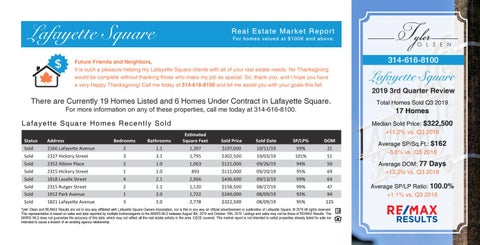
There are Currently 19 Homes Listed and 6 Homes Under Contract in Lafayette Square. For more information on any of these properties, call me today at 314-616-8100.
Bathrooms
Estimated Square Feet
Sold Price
Sold Date
SP/LP%
DOM
2166 Lafayette Avenue
2
1.1
1,397
$197,000
10/11/19
99%
21
Sold
2327 Hickory Street
3
3.1
1,795
$302,500
10/03/19
101%
51
Sold
2352 Albion Place
2
1.0
1,063
$121,000
09/26/19
94%
50
Sold
2315 Hickory Street
1
1.0
893
$112,000
09/20/19
95%
69
Sold
1818 Lasalle Street
4
2.1
2,966
$436,600
09/13/19
99%
64
Sold
2315 Rutger Street
2
1.1
1,120
$158,500
08/27/19
99%
47
Sold
1912 Park Avenue
1
2.0
1,722
$240,000
08/09/19
92%
94
Sold
1821 Lafayette Avenue
3
2.0
2,778
$322,500
08/09/19
95%
125
Sold
314-616-8100
Lafayette Square 2019 3rd Quarter Review Total Homes Sold Q3 2019 Median Sold Price: $322,500 +11.2% vs. Q3 2018
Bedrooms
Address
O L S E N
17 Homes
L a f a y e t t e S q u a re H omes R ece n tl y Sold Status
Tyler
Tyler Olsen and RE/MAX Results are not in any way affiliated with Lafayette Square Owners Association, nor is this in any way an official advertisement or publication of Lafayette Square. Š 2019 All rights reserved. This representation is based on sales and data reported by multiple brokers/agents to the MARIS MLS between August 9th, 2019 and October 19th, 2019. Listings and sales may not be those of RE/MAX Results. The MARIS MLS does not guarantee the accuracy of this data, which may not reflect all the real estate activity in the area. E&OE covered. This market report is not intended to solicit properties already listed for sale nor intended to cause a breach of an existing agency relationship.
Average SP/Sq.Ft.: $162 -3.6% vs. Q3 2018 Average DOM: 77 Days +13.2% vs. Q3 2018 Average SP/LP Ratio: 100.0% +1.1% vs. Q3 2018