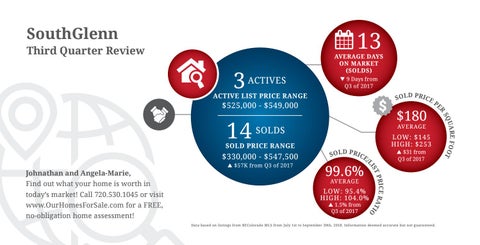
SouthGlenn
13
Third Quarter Review
3 ACTIVES
AVERAGE DAYS ON MARKET (SOLDS) 9 Days from Q3 of 2017
SOLD PRICE
ACTIVE LIST PRICE RANGE
SOLD PRICE RANGE
$330,000 - $547,500 $57K from Q3 of 2017
SO L
D PRI
LOW: $145 HIGH: $253 $31 from Q3 of 2017
CE /
AVERAGE
LOW: 95.4% HIGH: 104.0% 1.5% from Q3 of 2017
RICE RAT IO
99.6%
P ST LI
Johnathan and Angela-Marie, Find out what your home is worth in today’s market! Call 720.530.1045 or visit www.OurHomesForSale.com for a FREE, no-obligation home assessment!
AVERAGE
SOLDS
Data based on listings from REColorado MLS from July 1st to September 30th, 2018. Information deemed accurate but not guaranteed.
UARE FOOT SQ
14
$180
PE
R
$525,000 - $549,000