Jill Van Dusen
12780 High Bluff Drive Ste. 130 San Diego, CA 92130
REALTOR | CalBRE# 01721219 ®
Each Office Independently Owned and Operated
Lomas Santa Fe
619-990-5552 jill@jillsellsrealestate.com www.JillSellsRealEstate.com
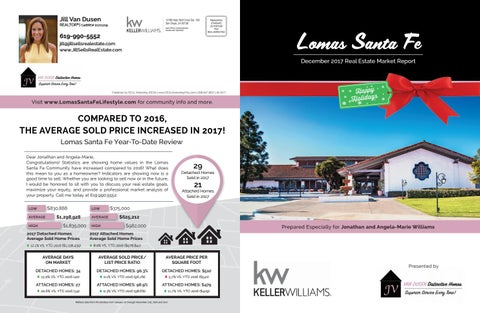
December 2017 Real Estate Market Report
Published by REAL Marketing (REM) | www.REALMarketing4You.com | 858.847.8631 | © 2017
Visit www.LomasSantaFeLifestyle.com for community info and more.
COMPARED TO 2016, THE AVERAGE SOLD PRICE INCREASED IN 2017! Lomas Santa Fe Year-To-Date Review Dear Jonathan and Angela-Marie, Congratulations! Statistics are showing home values in the Lomas Santa Fe Community have increased compared to 2016! What does this mean to you as a homeowner? Indicators are showing now is a good time to sell. Whether you are looking to sell now or in the future, I would be honored to sit with you to discuss your real estate goals, maximize your equity, and provide a professional market analysis of your property. Call me today at 619.990.5552.
$830,888
LOW AVERAGE HIGH
LOW
$1,298,928 $1,835,000
AVERAGE HIGH
29
Detached Homes Sold in 2017
21
Attached Homes Sold in 2017
$375,000 $625,212 $982,000
2017 Detached Homes Average Sold Home Prices
2017 Attached Homes Average Sold Home Prices
12.1% VS. YTD 2016 ($1,158,435)
8.0% VS. YTD 2016 ($578,841)
Prepared Especially for Jonathan and Angela-Marie Williams
AVERAGE DAYS ON MARKET
AVERAGE SOLD PRICE/ LIST PRICE RATIO
AVERAGE PRICE PER SQUARE FOOT
DETACHED HOMES: 34
DETACHED HOMES: 96.3%
DETACHED HOMES: $510
È 15.0% VS. YTD 2016 (40)
Ç 0.1% VS. YTD 2016 (96.2%)
5.7% VS. YTD 2016 ($541)
ATTACHED HOMES: 27
ATTACHED HOMES: 98.9%
ATTACHED HOMES: $479
È 20.6% VS. YTD 2016 (34)
Ç 0.3% VS. YTD 2016 (98.6%)
Ç 11.7% VS. YTD 2016 ($429)
Reflects data from the Sandicor from January 1st through November 21st, 2016 and 2017.
Presented by