Jay Kalinski
Each office independently owned and operated.
OWNER / REALTOR®
303-415-2268
JayKalinski@remax.net www.TableMesaLiving.com Please Recycle! Connect with me on:
Published by REAL Marketing (RM) | www.REALMarketing4You.com | 858.952.4280 | © 2022
Visit www.TableMesaLiving.com for current market activity, community information, and more.
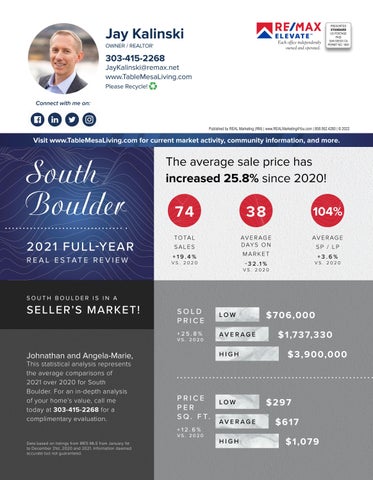
South Boulder 2021 FULL-YEAR R E A L E S TAT E R E V I E W
The average sale price has increased 25.8% since 2020!
74
38
104%
T O TA L
AV E R A G E D AY S O N
AV E R A G E
SALES
SP / LP
MARKET
+19.4%
+3.6%
- 3 2 .1 %
VS. 2020
VS. 2020
VS. 2020
SOUTH BOULDER IS IN A
SE L L E R’ S M A R KE T !
SOLD PRICE
LOW
+25.8%
AV E R AG E
VS. 2020
HIGH
Johnathan and Angela-Marie, This statistical analysis represents the average comparisons of 2021 over 2020 for South Boulder. For an in-depth analysis of your home’s value, call me today at 303-415-2268 for a complimentary evaluation.
PRICE PER S Q . F T. +12.6%
VS. 2020 Data based on listings from IRES MLS from January 1st to December 31st, 2020 and 2021. Information deemed accurate but not guaranteed.
LOW AV E R AG E HIGH
$706,00 0 $1,737,330 $3 ,9 0 0,0 0 0
$297 $617 $1,0 7 9