Presented by
1501 S. Dale Mabry Hwy | Tampa, FL 33629
ALEXIS LELEKIS & LISA KIRKPATRICK
ALEXIS LELEKIS
LIST with BEGGINS
772.532.3557
REALTOR® & Neighbor AlexisLelekis@c21be.com
IN D IAN S HOR E S
LISA KIRKPATRICK
813.220.3534
REALTOR® & Neighbor LisaKirkpatrick@c21be.com
February 2019 | Real Estate Market Report
Visit www.IndianShoresLifestyle.com for community info, current listings, and FREE home evaluations. CURRENT ACTIVE LISTINGS:
2018 YEAR-END
18
9
5
$1,000,000 TO $2,000,000
OVER $2,000,000
2018
2017
Change
Total Sales Average Sold Price Average Price Per Sq. Ft. Average Days on Market Average SP/LP
5 $2,750,000 $486 441 97.7%
1 $2,550,000 $313 384 96.2%
+400.0% +7.8% +55.3% +14.8% +1.5%
Year-End
2018
2017
Change
Total Sales Average Sold Price Average Price Per Sq. Ft. Average Days on Market Average SP/LP
13 $1,614,154 $342 366 97.8%
7 $1,616,071 $385 144 92.5%
+85.7% -0.1% -11.2% +154.2% +5.3%
Year-End
2018
2017
Change
Total Sales Average Sold Price Average Price Per Sq. Ft. Average Days on Market Average SP/LP
31 $658,622 $416 103 97.0%
49 $626,535 $406 73 99.3%
-36.7% +5.1% +2.5% +41.1% -2.3%
OVER $2,000,000
Year-End
$1,000,000 TO $2,000,000
INDIAN S H O RE S
UNDER $1,000,000
UNDER $1,000,000
REAL ESTATE REVIEW
Your Indian Shores Listing & Real Estate Experts
Jonathan and Angela-Marie, This statistical analysis represents the average comparisons of 2018 over 2017 for Indian Shores. For an in-depth analysis of your home’s value, call us today at 772.532.3557 or 813.220.3534 for a complimentary evaluation. Data based on listings from MFRMLS from January 1st to December 31st, 2017 and 2018. Information deemed accurate but not guaranteed.
Published by REAL Marketing (REM) | www.REALMarketing4You.com | 858.952.4280 | ©2019
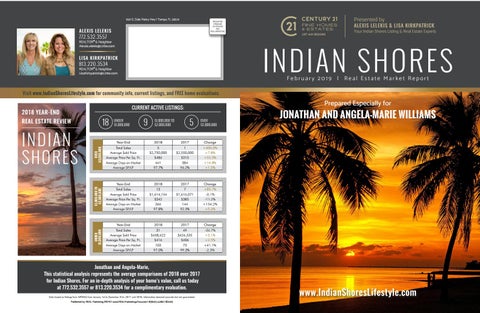
Prepared Especially for
JONATHAN AND ANGELA-MARIE WILLIAMS
www.IndianShoresLifestyle.com