
Home of the CLHMS TM www.LuxuryHomeMarketing.com LUXURY MARKET REPORT JUNE 2023
LUXURY MARKET REPORT
MAP OF LUXURY RESIDENTIAL MARKETS
Welcome to the Luxury Market Report, your guide to luxury real estate market data and trends for North America. Produced monthly by The Institute for Luxury Home Marketing, this report provides an in-depth look at the top residential markets across the United States and Canada. Within the individual markets, you will find established luxury benchmark prices and detailed survey of luxury active and sold properties designed to showcase current market status and recent trends. The national report illustrates a compilation of the top North American markets to review overall standards and trends.
Copyright © 2023 Institute for Luxury Home Marketing | www.luxuryhomemarketing.com | 214.485.3000
The Luxury Market Report is a monthly analysis provided by The Institute for Luxury Home Marketing. Luxury benchmark prices are determined by The Institute. This active and sold data has been provided by REAL Marketing, who has compiled the data through various sources, including local MLS boards, local tax records and Realtor.com. Data is deemed reliable to the best of our knowledge, but is not guaranteed.
THIS IS YOUR
LUXURY REPORT EXPLAINED –
The Institute for Luxury Home Marketing has analyzed a number of metrics — including sales prices, sales volumes, number of sales, sales-price-to-list-price ratios, days on market and price-per-square-foot – to provide you a comprehensive North American Luxury Market report. Additionally, we have further examined all of the individual luxury markets to provide both an overview and an in-depth analysis - including, where data is sufficient, a breakdown by luxury single-family homes and luxury attached homes.
It is our intention to include additional luxury markets on a continual basis. If your market is not featured, please contact us so we can implement the necessary qualification process. More in-depth reports on the luxury communities in your market are available as well.
Looking through this report, you will notice three distinct market statuses, Buyer's Market, Seller's Market, and Balanced Market. A Buyer's Market indicates that buyers have greater control over the price point. This market type is demonstrated by a substantial number of homes on the market and few sales, suggesting demand for residential properties is slow for that market and/or price point.
By contrast, a Seller's Market gives sellers greater control over the price point. Typically, this means there are few homes on the market and a generous demand, causing competition between buyers who ultimately drive sales prices higher.
A Balanced Market indicates that neither the buyers nor the sellers control the price point at which that property will sell and that there is neither a glut nor a lack of inventory. Typically, this type of market sees a stabilization of both the list and sold price, the length of time the property is on the market as well as the expectancy amongst homeowners in their respective communities – so long as their home is priced in accordance with the current market value.
REPORT GLOSSARY
REMAINING INVENTORY: The total number of homes available at the close of a month.
DAYS ON MARKET: Measures the number of days a home is available on the market before a purchase offer is accepted.
LUXURY BENCHMARK PRICE: The price point that marks the transition from traditional homes to luxury homes.
NEW LISTINGS: The number of homes that entered the market during the current month.
PRICE PER SQUARE FOOT: Measures the dollar amount of the home's price for an individual square foot.
SALES RATIO: Sales Ratio defines market speed and determines whether the market currently favors buyers or sellers. Buyer's Market = up to 14%; Balanced Market = 15 to 20%; Seller's Market = 21% plus. If >100%, sales from previous month exceed current inventory.
SP/LP RATIO: The Sales Price/List Price Ratio compares the value of the sold price to the value of the list price.
–

“Smart technology and wellness amenities are certainly top favorites of the affluent homeowner, but today’s buyer is also looking for the home that will fulfill their lifestyle decisions – this more than just the style of the home and/or its location, it is the experience offered by the property that will likely set it apart.”
NORTH AMERICAN LUXURY REVIEW
Luxury Trends for the Summer
As we head into summer, what trends are set to define this season’s must-haves, and are there any surprises?
Smart technology and wellness amenities are certainly top favorites of the affluent homeowner, but today’s buyer is also looking for the home that will fulfil their lifestyle decisions – this more than just the style of the home and/or its location, it is the experience offered by the property that will likely set it apart.
This experience tends to encompass not only unique and spectacular features within the home and its grounds but also the property’s location and surrounding amenities. Affluent buyers’ expectations have shifted, becoming honed by the need to find a sense of purpose for their chosen property and its location as well the opportunity to still add their personal identity and style.
Despite lingering uncertainty outside the luxury real estate market, the steadiness of prices, sales, and inventory levels have resulted in a consistent increase in the demand for luxury properties during the first five months of 2023.
The number of luxury properties sold has risen month over month since the start of 2023, aside from January, which did see a downturn in sales. Despite the slight plateau in April, May’s figures saw a 33% increase in sales for single-family homes compared to April and attached properties sales were 26% higher.
This has been assisted by the increased level of new inventory entering the market, up 22% compared to April 2022 for single-family homes and 14% for attached homes – putting inventory levels back on par with levels seen in May 2022.
While an increase in new inventory has resulted in a greater number of sales, the significant difference in percentage increase of sales versus new inventory proves that the demand for luxury properties continues, enabling the market to remain strong.
Sold Prices also indicate stability in the current market as overall, the monthly median price for both single-family and attached properties has barely shifted, but more significantly, the homes that are selling are being sold very close to their list price.
Strength and Comfort
There is a focus on permanence in all aspects of the luxury real estate market with quick fads a trend of the past; expect to see quality, endurability, and sustainability as the key determinants in the building, design, and refurbishment of homes for the remainder of the year.
Nature is being embraced, creating a more natural feel through layering, texturing, sustainability processes. Color neutrality with warmer palettes, and Artisan and artistic features are being blended into old and new designs to create soothing, comfortable, yet unique environments. These elements will be at the forefront of this season’s design palette, and technology will be implemented to provide efficiency but, more specifically, to create spaces and features that offer a sense of ambient wellness.
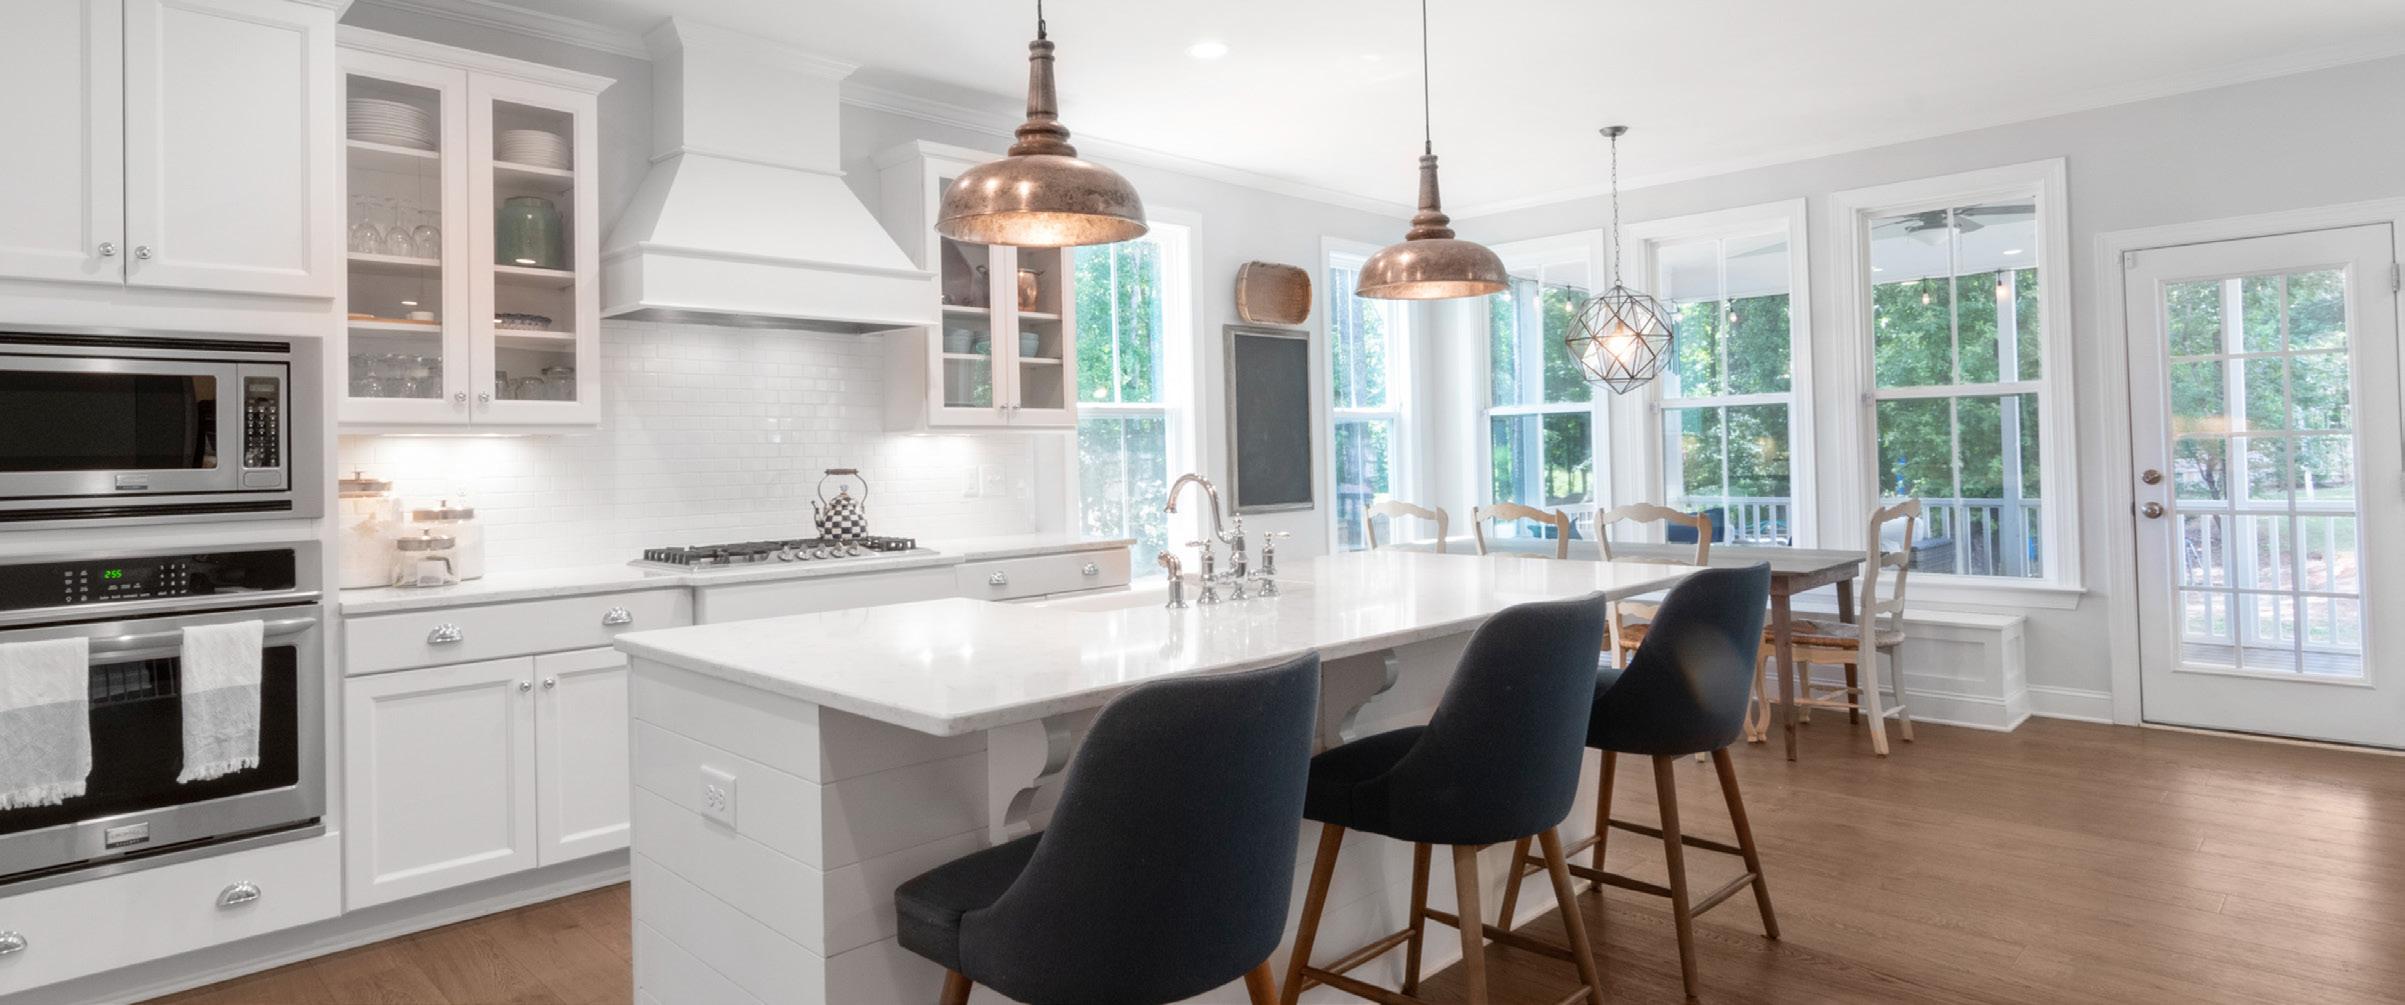
Color and Texture Return
The cool greys, sharp blacks, and clean or pure whites are taking a back seat as earthy greens, soft yellows, deep reds, and gentle pinks, used for accents and contrast, are blended with more warm neutral palettes creating richer dimensions to rooms. Warm greys, creams, and browns create a sense of warmth, coziness, and real “hygge” like luxury living.
Equally, the addition of textures such as wallpaper, fabrics, and soft furnishings are replacing previously streamlined interior surfaces. Concrete, oak, and cork are some natural materials no longer just found in the details but are set to become defining hallmarks of indoor and outdoor

surfaces. “Hyper-textuality” will bring the natural world into everyday living, unprocessed and untreated, stripped of all synthetics. There also seems to be a staunch focus on high-contrast and high-pattern grains alongside overstated veining in marble, stone, and wood.
Blending Old and New with a Touch of Artisan
In the transfer from modernity’s sleek lines to a space that looks ‘more lived-in,’ expect to find vintage, reused, and Artisan pieces mixed in to create a sense of eclectic character that also allows the individuality of the homeowner’s personality to shine.
The purchase of antiques, and even furniture from the 1950s, 60s, and 70s, is finding a home in today’s modern rooms and is being artfully incorporated through the addition of dramatic pops of contrasting color and textures.
Blending delicate and bold colors, soft neutrals, and warm tones achieve a natural aesthetic, making any room feel cozy and comforting. Add in handmade, Artisan artwork and craftsmanship, and the room changes to offer unique pieces of interest and culture.
Environmental Consciousness
Equally important has become the investment into using products that are considered sustainable both in building the home and its interior design.
Net-zero interior design and architecture are not new; still, there is not only a growing demand from affluent homeowners but a drive that is being taken up by builders, developers, and designers. Expect to see the start of every aspect of the project, from design, construction, materials, and layout to furniture and technology, embrace this trend as we all become more environmentally conscious.
From energy-efficient equipment and features such as water purification systems and ambient heating and cooling systems, use of floor-to-ceiling windows to capture the natural light (as well
as views), saltwater pools that require less chlorine to electric car charging stations, these are just a few of the expectations of luxury buyers in today’s market. Incorporating sustainable and selfmaintaining gardening solutions, harvesting rainwater, and using drought-tolerant alternatives are also on the uptick.
Sustainable, recycled, and ethical are hot topics in every avenue of life, and 2023 home décor trends follow suit. Every year, we learn more about sustainable practices and what to opt for regarding the planet’s health. As a result, trendy interiors look and feel different from those of the past. We’ll see an increase in green materials and organic surfaces in upcoming designs, from residential to commercial.
Outdoor Trends
As the warmer weather sets in, it’s natural to gravitate to outdoor spaces, and the trend for blending and opening up the space between indoors and outside is still very much in vogue.
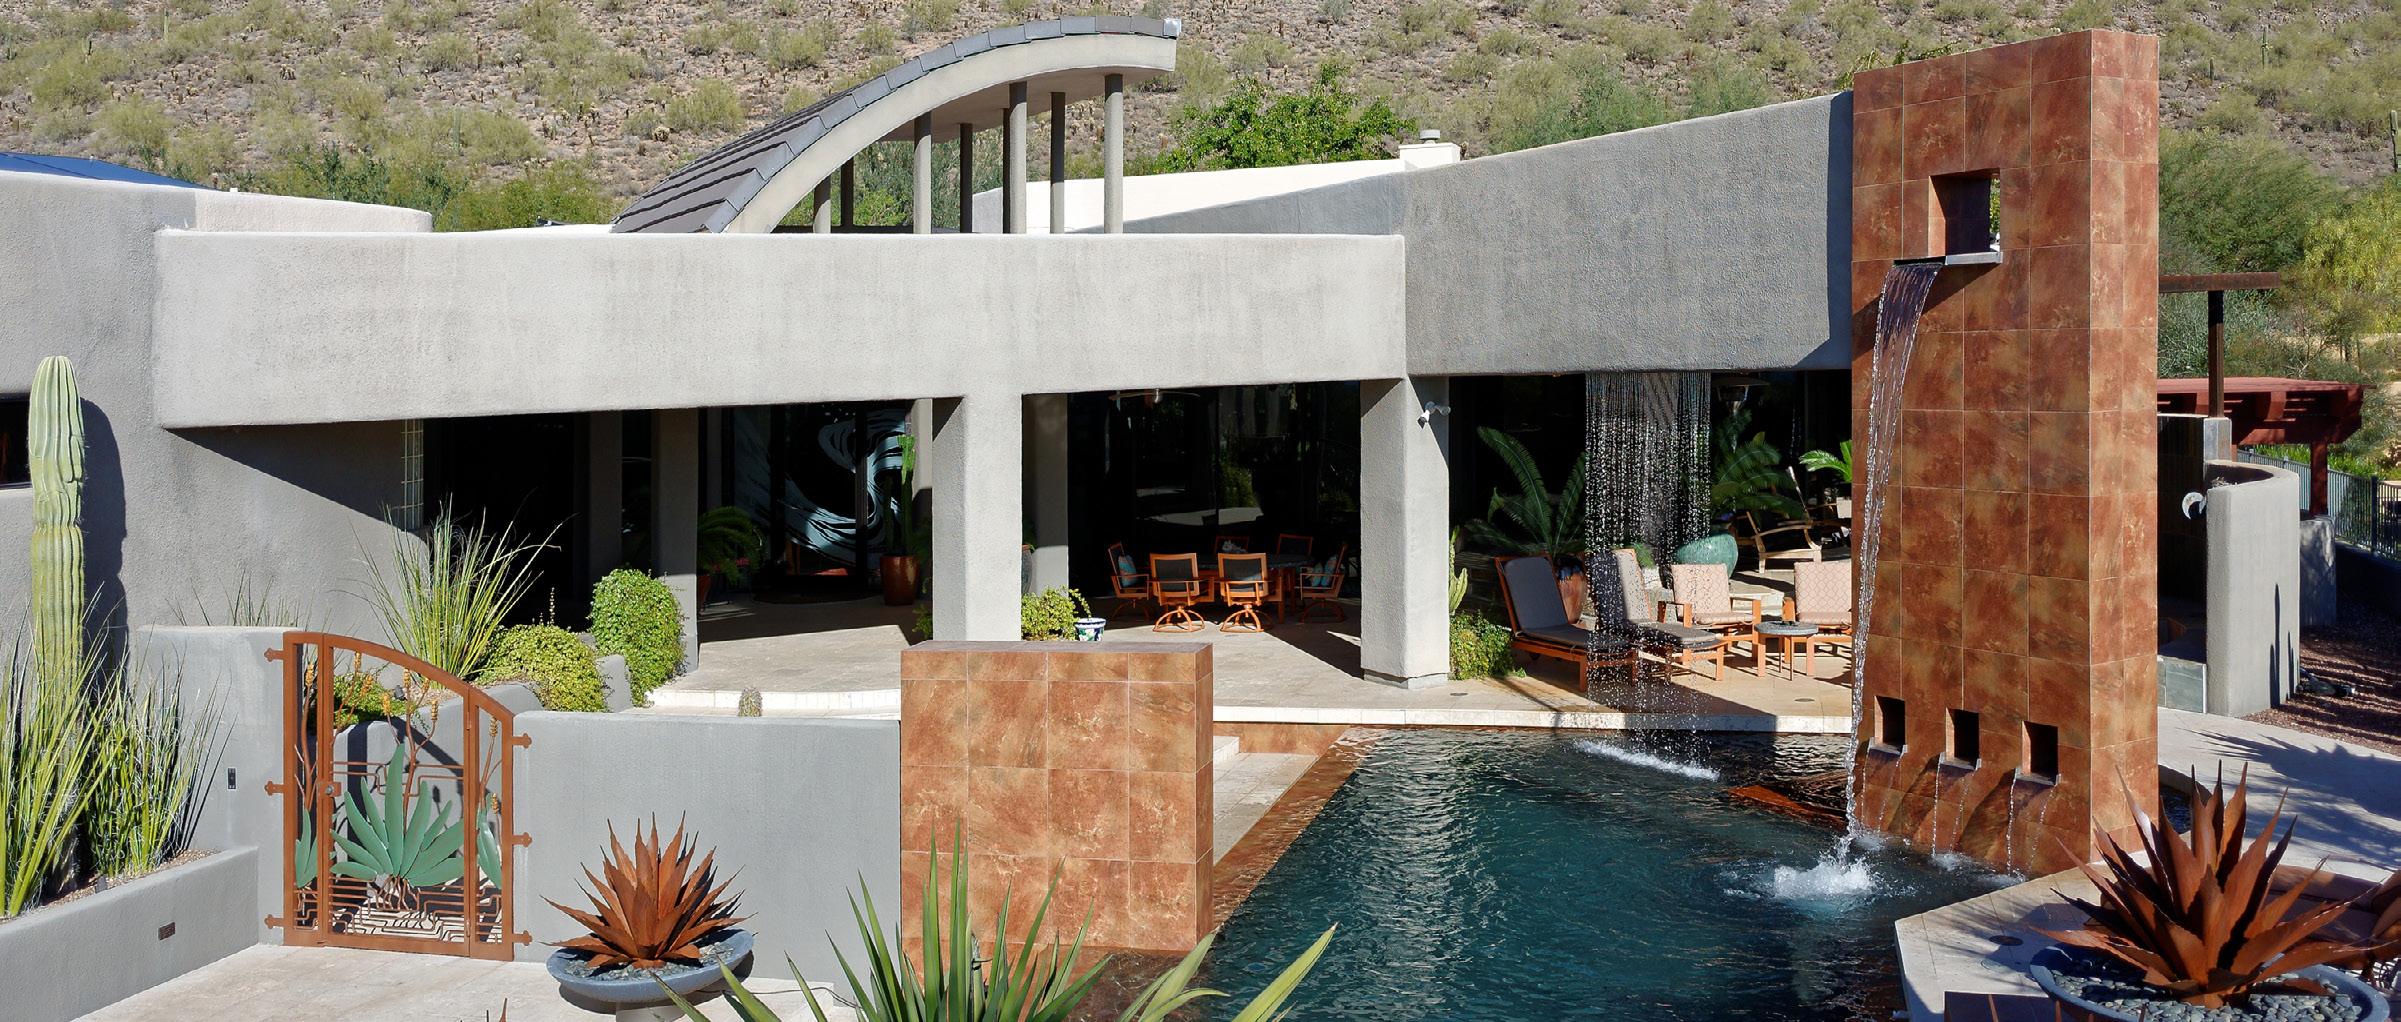
Like the indoors, expect more soft lines, welcoming spaces, and comfortable surfaces. In particular, low-lying outdoor armchairs and sofas are in high demand as they can create relaxing space and a welcoming vibe.
Color schemes are a little more dramatic this year, with shades of red, orange, and green dominating, specifically terracotta, sage green, and seafoam green, set against a rich earthy color or neutral tone background.
The post-pandemic frame of mind has filtered into everyday surroundings to capture peace, a sense of well-being, warmth, and wellness. Overall expect to see a renewal of bright, bold, and inspiring interiors. Plus, organic and sustainable design is gaining more traction. These may not be new concepts, but the passion for creating a natural and healthy space is certainly a growing trend.
The art of selling and buying in this market needs a critical and analytical approach; understanding the realities and setting expectations accordingly will ensure that goals are achieved. For homeowners looking to buy or sell in today’s market, we recommend working with a REALTOR who can capitalize on the preferences, trends, and demands in this dynamic and evolving environment.
FOR THE LUXURY NORTH AMERICAN MARKET
Single-Family Homes Attached Homes Single-Family List Price Attached List Price
All data is based off median values. Median prices represent properties priced above respective city benchmark prices.
– 13 -
–
MONTH MARKET TRENDS
DAYS ON MARKET SALES PRICE VS. LIST PRICE
7 9 12 17 21 22 25 32 35 40 24 17 14 9 10 13 18 20 24 28 29 32 28 23 19 18 0 5 10 15 20 25 30 35 40 45 MAY JUN JUL AUG SEP OCT NOV DEC JAN FEB MAR APR MAY PRICE PER SQUARE FOOT $540 $553 $539 $521 $525 $515 $523 $516 $498 $500 $501 $486 $493 $438 $436 $430 $417 $423 $421 $421 $413 $394 $432 $411 $411 $432 $0 $100 $200 $300 $400 $500 $600 MAY JUN JUL AUG SEP OCT NOV DEC JAN FEB MAR APR MAY $500,000 $700,000 $900,000 $1,100,000 $1,300,000 $1,500,000 $1,700,000 $1,900,000 MAY JUN JUL AUG SEP OCT NOV DEC JAN FEB MAR APR MAY
LUXURY MONTHLY MARKET REVIEW –
A Review of Key Market Differences Year over Year
SINGLE-FAMILY HOMES MARKET SUMMARY | MAY 2023
• Official Market Type: Seller's with a 37.01% Sales Ratio.1
• Homes are selling for an average of 99.80% of list price.
• The median luxury threshold2 price is $950,000, and the median luxury home sales price is $1,388,000.
• Markets with the Highest Median Sales Price: Aspen ($20,000,000), Telluride ($4,995,000), Paradise Valley ($4,600,000), and Naples ($4,450,000).
• Markets with the Highest Sales Ratio: East Bay, CA (133%), Howard County, MD (91%), Cleveland Suburbs, OH (86%), and Frederick County, MD (86%).
–
1Sales Ratio defines market speed and market type: Buyer's < 15.5%; Balanced >= 15.5 to < 20.5%; Seller's >= 20.5% plus. If >100%, sales from previous month exceeds current inventory. 2The luxury threshold price is set by The Institute for Luxury Home Marketing. SINGLE-FAMILY HOMES Median List Price $1,598,500 $1,694,500 Median Sale Price $1,350,250 $1,388,000 Median SP/LP Ratio 100.44% 99.80% Total Sales Ratio 61.58% 37.01% Median Price per Sq. Ft. $438 $432 Total Inventory 40,801 52,874 New Listings 21,712 21,464 Total Sold 25,127 19,569 Median Days on Market 7 14 Average Home Size 3,226 3,171
May 2022 | May 2023 Median prices represent properties priced above respective city benchmark prices. May 2023 May 2022 May 2023 May 2022
New Listings 248 Total Sold 5,558 Med. Sale Price $37,750 Days on Market 7 Sales Ratio 24.57%
–
LUXURY MONTHLY MARKET REVIEW –
A Review of Key Market Differences Year over Year May
ATTACHED 280 Total Sold
HOMES 1,641 Med. Sale Price
$5,250 Days on Market
10 Sales Ratio
23.50%
• Official Market Type: Seller's Market with a 33.33% Sales Ratio 1
• Attached homes are selling for an average of 99.75% of list price.
• The median luxury threshold2 price is $700,000, and the median attached luxury sale price is $866,250
• Markets with the Highest Median Sales Price: Aspen ($4,900,000), Ft. Lauderdale ($2,800,000), Vail ($2,600,000), and Park City ($2,265,000).
• Markets with the Highest Sales Ratio: Howard County, MD (212%), Fairfax County, VA (163%), Arlington & Alexandria, VA (142%), and Montgomery County, MD (126%).
1Sales Ratio defines market speed and market type: Buyer's < 15.5%; Balanced >= 15.5 to < 20.5%; Seller's >= 20.5% plus. If >100%, sales from previous month exceeds current inventory. 2The luxury threshold price is set by The Institute for Luxury Home Marketing. Median List Price $992,000 $989,450 Median Sale Price $871,500 $866,250 Median SP/LP Ratio 100.01% 99.75% Total Sales Ratio 56.83% 33.33% Median Price per Sq. Ft. $540 $493 Total Inventory 13,047 17,320 New Listings 6,574 6,854 Total Sold 7,414 5,773 Median Days on Market 9 18 Average Home Size 1,755 1,883
Median prices represent properties priced above respective city benchmark prices.
2022 | May 2023 May 2023 May 2022 May 2023 May 2022
ATTACHED HOMES MARKET SUMMARY | MAY 2023 New Listings
LUXURY MONTHLY MARKET REVIEW –
SINGLE-FAMILY HOMES
Median prices represent properties priced above respective city benchmark prices. Prices shown for Canadian cites are shown in Canadian Dollars. –
State Market Name Median List Price Median Sold Price Inventory New Listings Sold Days on Market Market Status AB Calgary $1,180,000 $950,000 519 408 363 15 Seller's AZ Chandler and Gilbert $1,099,500 $1,035,000 122 51 86 35 Seller's AZ Flagstaff $1,650,000 $1,300,000 87 31 13 36 Buyer's AZ Mesa $900,000 $899,000 147 58 69 47 Seller's AZ Paradise Valley $6,300,000 $4,600,000 146 35 33 58 Seller's AZ Phoenix $950,000 $802,000 671 247 355 44 Seller's AZ Scottsdale $2,326,369 $1,646,000 667 180 236 49 Seller's AZ Tucson $699,000 $667,000 770 272 345 16 Seller's BC Mid Vancouver Island $1,690,000 $1,475,000 211 113 31 36 Buyer's BC Okanagan Valley $1,749,900 $1,510,000 944 384 102 42 Buyer's BC Vancouver $4,488,000 $3,608,800 1013 474 133 9 Buyer's BC Victoria $2,349,500 $1,900,000 168 114 41 28 Seller's BC Whistler $5,324,003 $4,100,000 40 10 1 2 Buyer's CA Central Coast $2,995,000 $2,250,000 227 86 69 11 Seller's CA East Bay $2,458,888 $1,950,000 323 199 430 9 Seller's CA Greater Palm Springs $1,899,000 $1,890,000 407 140 135 31 Seller's CA Lake Tahoe $2,672,000 $1,792,500 168 79 24 46 Buyer's CA Los Angeles Beach Cities $6,195,000 $4,184,700 363 116 59 23 Balanced CA Los Angeles City $5,245,000 $3,423,611 636 197 102 31 Balanced CA Los Angeles The Valley $2,849,998 $1,989,500 534 240 204 31 Seller's CA Marin County $3,395,000 $3,010,500 107 34 65 10 Seller's CA Napa County $3,995,000 $2,417,500 132 22 18 45 Buyer's CA Orange County $2,999,900 $2,145,000 843 346 386 20 Seller's CA Placer County $1,198,000 $1,047,495 245 102 116 11 Seller's CA Sacramento $1,049,000 $900,000 568 302 322 10 Seller's CA San Diego $2,677,500 $2,000,000 764 371 369 10 Seller's CA San Francisco $5,300,000 $3,400,000 139 32 55 12 Seller's CA San Luis Obispo County $1,894,999 $1,510,000 159 66 75 28 Seller's CA Santa Barbara $5,700,000 $3,657,500 125 65 42 10 Seller's CA Silicon Valley $4,418,000 $3,300,000 485 265 302 8 Seller's CA Sonoma County $2,497,000 $1,800,000 266 70 66 20 Seller's CA Ventura County $2,495,000 $1,625,000 225 88 103 53 Seller's CO Aspen $14,575,000 $20,000,000 58 8 9 43 Balanced CO Boulder $2,300,000 $1,606,000 289 122 80 31 Seller's CO Colorado Springs $925,000 $846,000 428 172 147 14 Seller's CO Denver $1,714,500 $1,376,000 694 310 305 5 Seller's CO Douglas County $1,350,000 $1,126,206 318 137 119 8 Seller's CO Durango $1,665,000 $1,200,000 101 44 21 61 Balanced
LUXURY MONTHLY MARKET REVIEW –SINGLE-FAMILY HOMES
–
Median prices represent properties priced above respective city benchmark prices. Prices shown for Canadian cites are shown in Canadian Dollars. State Market Name Median List Price Median Sold Price Inventory New Listings Sold Days on Market Market Status CO Summit County $3,290,000 $1,705,000 60 13 5 40 Buyer's CO Telluride $6,975,000 $4,995,000 75 13 3 118 Buyer's CO Vail $5,875,000 $4,194,625 67 7 6 173 Buyer's CT Central Connecticut $699,000 $610,000 320 114 139 5 Seller's CT Coastal Connecticut $2,400,000 $1,776,000 544 225 165 22 Seller's DC Washington D.C. $4,200,000 $2,320,000 55 26 21 6 Seller's DE Sussex County Coastal $1,419,995 $1,300,000 132 31 45 5 Seller's FL Boca Raton/Delray Beach $2,999,000 $1,890,000 493 151 99 48 Balanced FL Brevard County $859,900 $775,000 313 134 134 12 Seller's FL Broward County $1,700,000 $1,400,000 654 212 107 50 Balanced FL Coastal Pinellas County $2,275,000 $2,100,000 121 32 32 61 Seller's FL Ft. Lauderdale $4,975,000 $3,500,000 185 36 21 225 Buyer's FL Jacksonville Beaches $1,400,000 $1,150,000 347 124 103 29 Seller's FL Lee County $1,399,000 $1,310,000 812 213 160 27 Balanced FL Marco Island $2,500,000 $2,350,000 144 28 31 31 Seller's FL Miami $2,200,000 $1,485,000 989 235 134 50 Buyer's FL Naples $5,645,000 $4,450,000 441 65 67 42 Balanced FL Orlando $1,249,000 $1,118,003 746 241 222 13 Seller's FL Palm Beach Towns $4,250,000 $3,100,000 301 41 34 58 Buyer's FL Sarasota & Beaches $2,795,000 $1,950,000 442 90 77 48 Balanced FL South Pinellas County $1,550,000 $1,400,000 292 94 87 18 Seller's FL South Walton $2,500,000 $2,100,000 471 141 61 63 Buyer's FL Tampa $785,900 $700,000 1139 413 513 12 Seller's GA Atlanta $1,650,000 $1,225,000 666 287 266 6 Seller's GA Duluth $1,425,000 $1,363,000 19 9 10 13 Seller's HI Island of Hawaii $2,400,000 $1,575,000 120 22 28 27 Seller's HI Kauai $3,250,000 $2,285,000 53 12 10 34 Balanced HI Maui $3,925,000 $3,244,136 150 37 29 105 Balanced HI Oahu $3,295,444 $2,500,000 188 39 35 25 Balanced IA Des Moines $695,000 $745,000 19 7 10 2 Seller's ID Ada County $799,999 $778,850 681 332 258 11 Seller's ID Northern Idaho $1,699,000 $1,425,000 475 215 55 52 Buyer's IL Chicago $1,670,000 $1,275,000 674 351 299 8 Seller's IL DuPage County $1,259,900 $960,000 243 112 135 8 Seller's IL Lake County $1,250,000 $900,000 286 119 132 11 Seller's IL Will County $675,000 $622,265 201 93 144 6 Seller's IN Hamilton County $918,000 $785,000 165 85 135 4 Seller's KS Johnson County $846,424 $815,000 466 87 174 3 Seller's
LUXURY MONTHLY MARKET REVIEW –SINGLE-FAMILY HOMES
–
Median prices represent properties priced above respective city benchmark prices. Prices shown for Canadian cites are shown in Canadian Dollars. State Market Name Median List Price Median Sold Price Inventory New Listings Sold Days on Market Market Status MA Cape Cod $2,400,000 $1,700,000 163 54 36 23 Seller's MA Greater Boston $3,000,000 $2,467,500 187 89 48 21 Seller's MA South Shore $2,125,000 $1,530,000 78 30 29 20 Seller's MD Anne Arundel County $1,099,000 $880,840 173 70 114 5 Seller's MD Frederick County $887,000 $897,505 44 18 38 7 Seller's MD Howard County $1,120,000 $1,005,000 78 30 71 5 Seller's MD Montgomery County $1,892,500 $1,567,500 180 101 126 6 Seller's MD Talbot County $3,345,000 $1,460,000 44 13 6 6 Buyer's MD Worcester County $1,100,000 $800,000 51 19 21 17 Seller's MI Livingston County $749,450 $680,000 98 56 29 6 Seller's MI Monroe County $649,900 $540,450 17 11 8 9 Seller's MI Oakland County $772,400 $650,000 740 339 322 8 Seller's MI Washtenaw County $997,500 $777,500 138 53 86 6 Seller's MI Wayne County $759,000 $646,500 175 94 92 8 Seller's MN Olmsted County $874,900 $851,626 89 26 22 55 Seller's MN Twin Cities $1,200,000 $1,055,463 785 343 202 11 Seller's MO Kansas City $689,950 $669,000 1537 323 547 4 Seller's MO St. Louis $827,450 $632,000 100 49 85 5 Seller's NC Asheville $1,184,000 $900,000 254 93 74 7 Seller's NC Charlotte $1,274,500 $975,000 534 235 419 4 Seller's NC Lake Norman $1,274,450 $1,050,000 214 92 116 9 Seller's NC Raleigh-Durham $1,151,950 $965,000 498 162 293 3 Seller's NJ Bergen County $2,200,000 $1,665,000 239 76 56 19 Seller's NJ Hudson County $1,499,000 $1,861,000 23 7 11 6 Seller's NJ Morris County $1,799,000 $1,412,500 139 61 40 19 Seller's NJ Ocean County $950,000 $850,000 423 173 131 24 Seller's NM Taos $1,225,000 $912,500 59 16 10 107 Balanced NV Lake Tahoe $3,785,000 $2,853,500 110 32 12 64 Buyer's NV Las Vegas $1,750,000 $1,485,000 566 178 122 31 Seller's NV Reno $1,794,500 $1,689,500 98 45 28 55 Seller's NY Finger Lakes $1,799,000 $1,500,000 27 11 8 8 Seller's NY Nassau County $1,989,500 $1,412,500 664 247 124 32 Balanced NY Staten Island $1,270,000 $1,160,000 159 46 22 97 Buyer's NY Suffolk County $1,943,750 $1,225,000 752 234 121 43 Balanced OH Cincinnati $862,000 $719,500 238 73 94 2 Seller's OH Cleveland Suburbs $775,000 $627,550 37 15 32 11 Seller's OH Columbus $875,000 $740,500 415 214 267 4 Seller's ON GTA - Durham $1,799,000 $1,555,000 253 217 115 7 Seller's
LUXURY MONTHLY MARKET REVIEW –SINGLE-FAMILY HOMES
–
Median prices represent properties priced above respective city benchmark prices. Prices shown for Canadian cites are shown in Canadian Dollars. State Market Name Median List Price Median Sold Price Inventory New Listings Sold Days on Market Market Status ON GTA - York $2,499,000 $1,888,000 539 501 311 8 Seller's ON Hamilton $1,924,500 $1,500,000 216 133 47 12 Seller's ON Mississauga $2,981,500 $2,472,500 140 104 50 13 Seller's ON Oakville $3,160,000 $2,275,044 124 123 70 6 Seller's ON Toronto $3,545,000 $3,337,500 523 428 186 7 Seller's ON Waterloo Region $1,500,000 $1,291,825 194 167 104 10 Seller's OR Portland $1,289,850 $1,125,000 680 315 233 6 Seller's QC Montreal - - - - - -SC Charleston $1,975,000 $1,475,000 419 183 161 14 Seller's SC Hilton Head $1,950,000 $1,550,000 233 66 81 33 Seller's SC The Grand Strand $875,000 $822,890 386 104 115 88 Seller's TN Greater Chattanooga $915,000 $875,000 204 66 59 14 Seller's TN Knoxville $943,500 $921,000 129 57 66 5 Seller's TN Nashville $1,775,000 $1,412,500 847 329 290 5 Seller's TX Austin $1,250,000 $965,000 1358 511 388 14 Seller's TX Collin County $765,900 $700,000 1091 592 645 14 Seller's TX Dallas $1,384,500 $1,052,500 434 185 210 10 Seller's TX Denton County $775,000 $739,018 931 452 435 14 Seller's TX El Paso $625,000 $591,575 199 41 20 14 Buyer's TX Fort Worth $909,900 $795,000 901 394 418 15 Seller's TX Greater Tyler $699,900 $657,500 232 90 38 24 Balanced TX Houston $1,050,000 $895,000 1039 443 439 9 Seller's TX Lubbock $659,000 $605,625 139 52 50 80 Seller's TX San Angelo $610,000 $590,000 77 29 7 45 Buyer's TX San Antonio $799,000 $725,000 701 281 188 31 Seller's TX The Woodlands & Spring $859,884 $825,000 182 95 129 5 Seller's UT Park City $4,500,000 $2,700,000 183 63 25 33 Buyer's UT Salt Lake City $1,199,000 $998,500 439 215 180 20 Seller's VA Arlington & Alexandria $2,200,000 $1,815,000 103 48 37 5 Seller's VA Charlottesville $1,262,500 $1,052,000 140 32 47 5 Seller's VA Fairfax County $2,034,108 $1,438,750 330 144 178 6 Seller's VA McLean & Vienna $2,598,444 $1,824,750 150 54 59 6 Seller's VA Richmond $810,400 $818,000 339 113 213 7 Seller's VA Smith Mountain Lake $1,800,000 $1,177,500 36 12 4 5 Buyer's WA King County $2,161,250 $1,637,000 827 417 525 6 Seller's WA Seattle $2,037,500 $1,631,000 236 123 138 6 Seller's WA Spokane $1,200,000 $1,000,000 136 81 29 18 Seller's
LUXURY MONTHLY MARKET REVIEW –ATTACHED HOMES
–
Markets with dashes do not have a significant luxury market for this report. Median prices represent properties priced above respective city benchmark prices. Prices shown for Canadian cites are shown in Canadian Dollars. State Market Name Median List Price Median Sold Price Inventory New Listings Sold Days on Market Market Status AB Calgary $799,000 $704,000 139 93 62 19 Seller's AZ Chandler and Gilbert - - - - - -AZ Flagstaff - - - - - -AZ Mesa - - - - - -AZ Paradise Valley - - - - - -AZ Phoenix - - - - - -AZ Scottsdale $895,000 $800,000 221 75 85 32 Seller's AZ Tucson - - - - - -BC Mid Vancouver Island $875,000 $806,500 63 29 22 15 Seller's BC Okanagan Valley - - - - - -BC Vancouver $1,959,900 $1,750,000 902 444 173 12 Balanced BC Victoria $979,900 $986,750 153 111 68 14 Seller's BC Whistler $2,450,000 $2,088,000 33 17 5 48 Balanced CA Central Coast $1,299,999 $1,067,500 37 20 10 38 Seller's CA East Bay $1,097,833 $1,175,000 97 70 115 8 Seller's CA Greater Palm Springs - - - - - -CA Lake Tahoe $1,747,000 $1,965,000 34 16 8 15 Seller's CA Los Angeles Beach Cities $1,997,000 $1,610,000 122 56 75 17 Seller's CA Los Angeles City $1,750,000 $1,404,500 350 125 92 26 Seller's CA Los Angeles The Valley $849,000 $800,000 92 54 89 22 Seller's CA Marin County $1,315,000 $1,033,000 19 9 14 9 Seller's CA Napa County - - - - - -CA Orange County $1,250,000 $1,125,000 276 162 251 12 Seller's CA Placer County - - - - - -CA Sacramento - - - - - -CA San Diego $1,495,000 $1,077,500 271 157 188 8 Seller's CA San Francisco $2,600,000 $2,250,000 126 22 34 34 Seller's CA San Luis Obispo County - - - - - -CA Santa Barbara $1,567,500 $1,893,570 14 15 10 7 Seller's CA Silicon Valley $1,628,000 $1,702,500 89 56 74 8 Seller's CA Sonoma County $783,639 $778,224 13 4 6 29 Seller's CA Ventura County $819,000 $760,000 85 33 50 41 Seller's CO Aspen $3,500,000 $4,900,000 37 10 3 94 Buyer's CO Boulder $929,000 $809,750 90 42 32 32 Seller's CO Colorado Springs $552,450 $538,330 52 14 9 4 Balanced CO Denver $899,000 $805,000 166 59 59 14 Seller's CO Douglas County $675,000 $585,500 19 7 17 12 Seller's CO Durango $875,000 $777,500 27 9 6 45 Seller's
LUXURY MONTHLY MARKET REVIEW –ATTACHED HOMES
–
Markets with dashes do not have a significant luxury market for this report. Median prices represent properties priced above respective city benchmark prices. Prices shown for Canadian cites are shown in Canadian Dollars. State Market Name Median List Price Median Sold Price Inventory New Listings Sold Days on Market Market Status CO Summit County $1,250,000 $1,175,000 32 19 11 9 Seller's CO Telluride $2,422,500 $2,249,000 38 10 13 125 Seller's CO Vail $3,755,000 $2,600,000 71 10 10 4 Buyer's CT Central Connecticut - - - - - -CT Coastal Connecticut $1,530,000 $660,000 130 37 49 21 Seller's DC Washington D.C. $1,850,000 $1,626,250 231 80 80 11 Seller's DE Sussex County Coastal $1,200,000 $923,000 24 10 7 24 Seller's FL Boca Raton/Delray Beach $1,132,000 $833,000 316 91 111 31 Seller's FL Brevard County $719,900 $655,000 167 53 38 33 Seller's FL Broward County $729,000 $610,000 743 184 129 42 Balanced FL Coastal Pinellas County $1,200,000 $1,100,000 176 64 52 20 Seller's FL Ft. Lauderdale $2,600,000 $2,800,000 132 23 12 67 Buyer's FL Jacksonville Beaches $1,150,000 $1,227,500 37 11 16 34 Seller's FL Lee County $850,000 $744,500 455 103 98 21 Seller's FL Marco Island $1,699,500 $1,527,500 66 18 18 48 Seller's FL Miami $1,534,500 $1,262,500 1378 263 144 91 Buyer's FL Naples $2,337,500 $2,100,000 294 73 82 28 Seller's FL Orlando $566,500 $566,500 260 79 81 30 Seller's FL Palm Beach Towns $1,695,000 $1,938,814 271 60 38 36 Buyer's FL Sarasota & Beaches $1,695,000 $1,500,000 263 65 79 28 Seller's FL South Pinellas County $1,100,000 $987,500 251 72 76 24 Seller's FL South Walton $1,600,000 $1,193,500 201 40 24 36 Buyer's FL Tampa $977,000 $775,000 204 85 97 6 Seller's GA Atlanta $749,673 $604,050 530 209 155 14 Seller's GA Duluth - - - - - -HI Island of Hawaii $1,799,500 $1,450,000 46 7 19 28 Seller's HI Kauai $1,737,500 $1,425,000 38 10 9 10 Seller's HI Maui $2,047,450 $1,562,500 82 21 24 81 Seller's HI Oahu $1,222,500 $900,000 440 100 79 31 Balanced IA Des Moines - - - - - -ID Ada County $598,900 $589,000 47 19 15 21 Seller's ID Northern Idaho - - - - - -IL Chicago $1,200,000 $899,500 888 367 184 23 Balanced IL DuPage County $649,900 $663,500 21 13 14 13 Seller's IL Lake County - - - - - -IL Will County - - - - - -IN Hamilton County - - - - - -KS Johnson County $635,709 $604,975 148 39 38 7 Seller's
LUXURY MONTHLY MARKET REVIEW –ATTACHED HOMES
–
Markets with dashes do not have a significant luxury market for this report. Median prices represent properties priced above respective city benchmark prices. Prices shown for Canadian cites are shown in Canadian Dollars. State Market Name Median List Price Median Sold Price Inventory New Listings Sold Days on Market Market Status MA Cape Cod $895,000 $952,000 31 7 10 12 Seller's MA Greater Boston $2,550,000 $1,865,000 425 147 88 21 Balanced MA South Shore $819,900 $799,000 11 7 9 25 Seller's MD Anne Arundel County $569,990 $575,000 67 33 56 7 Seller's MD Frederick County - - - - - -MD Howard County $615,000 $615,000 17 12 36 5 Seller's MD Montgomery County $828,253 $749,990 58 36 73 7 Seller's MD Talbot County - - - - - -MD Worcester County $695,000 $611,500 61 28 39 12 Seller's MI Livingston County - - - - - -MI Monroe County - - - - - -MI Oakland County $699,450 $550,000 72 30 17 7 Seller's MI Washtenaw County $699,000 $612,498 55 18 20 12 Seller's MI Wayne County $688,530 $587,000 84 33 17 15 Balanced MN Olmsted County - - - - - -MN Twin Cities - - - - - -MO Kansas City - - - - - -MO St. Louis - - - - - -NC Asheville $804,250 $750,000 42 5 15 7 Seller's NC Charlotte $645,770 $610,000 194 75 82 15 Seller's NC Lake Norman $617,065 $617,500 27 11 10 23 Seller's NC Raleigh-Durham - - - - - -NJ Bergen County $1,199,000 $1,054,122 155 53 31 38 Balanced NJ Hudson County $1,430,000 $1,325,000 133 65 37 9 Seller's NJ Morris County $679,900 $613,250 63 40 50 16 Seller's NJ Ocean County $1,044,950 $799,000 64 21 19 48 Seller's NM Taos - - - - - -NV Lake Tahoe $1,397,000 $950,350 24 7 4 62 Balanced NV Las Vegas - - - - - -NV Reno - - - - - -NY Finger Lakes - - - - - -NY Nassau County $1,571,500 $1,672,000 100 33 14 68 Buyer's NY Staten Island $609,999 $595,000 83 31 27 40 Seller's NY Suffolk County $750,000 $595,000 130 44 55 28 Seller's OH Cincinnati - - - - - -OH Cleveland Suburbs - - - - - -OH Columbus $673,911 $587,666 99 30 26 34 Seller's ON GTA - Durham $839,000 $817,000 43 46 40 7 Seller's
LUXURY MONTHLY MARKET REVIEW –ATTACHED HOMES
–
Markets with dashes do not have a significant luxury market for this report. Median prices represent properties priced above respective city benchmark prices. Prices shown for Canadian cites are shown in Canadian Dollars. State Market Name Median List Price Median Sold Price Inventory New Listings Sold Days on Market Market Status ON GTA - York $819,500 $799,999 244 249 157 11 Seller's ON Hamilton $889,900 $950,000 24 21 9 18 Seller's ON Mississauga $999,000 $930,000 123 108 102 7 Seller's ON Oakville $1,439,000 $1,027,500 27 17 12 19 Seller's ON Toronto $1,298,000 $1,100,000 946 728 371 10 Seller's ON Waterloo Region $779,900 $757,750 43 26 22 11 Seller's OR Portland $730,000 $655,000 238 98 57 14 Seller's QC Montreal - - - - - -SC Charleston $1,179,900 $1,025,000 91 39 49 5 Seller's SC Hilton Head $1,212,500 $900,000 24 8 19 13 Seller's SC The Grand Strand $550,000 $529,900 197 82 73 58 Seller's TN Greater Chattanooga - - - - - -TN Knoxville - - - - - -TN Nashville $799,900 $687,500 202 59 64 9 Seller's TX Austin $845,000 $800,000 377 115 53 28 Buyer's TX Collin County - - - - - -TX Dallas $795,999 $650,000 161 69 59 12 Seller's TX Denton County - - - - - -TX El Paso - - - - - -TX Fort Worth - - - - - -TX Greater Tyler - - - - - -TX Houston $615,250 $585,000 98 50 35 18 Seller's TX Lubbock - - - - - -TX San Angelo - - - - - -TX San Antonio $800,000 $722,500 45 9 4 65 Buyer's TX The Woodlands & Spring - - - - - -UT Park City $1,809,000 $2,265,000 78 16 19 36 Seller's UT Salt Lake City $649,900 $565,000 127 55 58 15 Seller's VA Arlington & Alexandria $1,109,500 $1,003,500 64 43 91 6 Seller's VA Charlottesville $589,000 $582,915 47 18 19 4 Seller's VA Fairfax County $805,270 $705,000 115 69 187 5 Seller's VA McLean & Vienna $1,190,475 $965,000 30 10 14 7 Seller's VA Richmond $558,228 $557,493 80 24 30 15 Seller's VA Smith Mountain Lake - - - - - -WA King County $1,299,500 $1,000,000 258 120 99 14 Seller's WA Seattle $1,543,000 $1,325,000 136 65 36 24 Seller's WA Spokane - - - - - - -
