RAINBOW EUCALYPT MAN


1967 2
Botanical exploration 2
Preparation of a paper for the Ninth Commonwealth Forestry Conference 29
Natural regeneration of E. deglupta 30
Artificial regeneration of E. deglupta from seed 32
Grafting E. deglupta 33
Growing cuttings of E. deglupta 37
Confirmation of E. deglupta as a major native tree species for continuing study 44
I enrol in a Master of Forestry Degree at the ANU 46
1968 47
Ninth Commonwealth Forestry Conference 47
Duty travel to Canberra and ANU for initial wood properties examination on E. deglupta 47
Density of the wood of E. deglupta 48
Structure of the wood of E. deglupta 51
Fibre length 51
Statistical design required for the proposed tree improvement programme for E. deglupta 56
Continuation of research on E. deglupta at Keravat 57
Planting trials of E. deglupta 58
Preparation of a paper for a Conference of the Institute of Foresters of Australia 59
Selection and assessment of “candidate” and “breeding” populations of E. deglupta 59
Grafting and cuttings of E. deglupta 60
First visit to Keravat by Professor Pryor of the Department of Botany ANU 62
Helicopter reconnaissance of the Gazelle Peninsula and Central New Britain 66
Flowering and fruiting studies on E. deglupta 69
Emasculation technique developed for flowers of E. deglupta 71
Vegetative propagation of E. deglupta using epicormic and coppice shoots 71
Second visit to the Territory by Professor Pryor of the Department of Botany ANU 75
Wood density variation in E. deglupta 85
Silvicultural Research Conference Bulolo 26 to 30 August 1968 87
1968 96
Writing up a report on the fibre length and density work to date 96
Ordering of a rifle for seed and scion collection 96
Experimental proposals 96
E. deglupta fertilizer trial 98
Professor Pryor visits Mindanao in the Philippines to examine E. deglupta 98
Vegetative propagation of epicormic and coppice shoots of E. deglupta 99
Lopping and tying down branches of E. deglupta to control height growth 99
Establishment of a trial grafted seed orchard for E. deglupta 100
Ordering of a machine for removing wood samples from standing trees 102
Arrival of rifle for collection of seed and vegetative material from tall trees 103
1969 105
Collection of seed and vegetative material of E. deglupta 105
Grafting and cuttings experiments 105
Move to Canberra to take up PhD studies at the ANU 105
Aims of the experimental work to be undertaken during my PhD 104
FAO Forestry and Timber Bureau E. deglupta collecting expedition to Indonesia 106
Fibre wall thickness and lumen diameter 107
Arithmetic ratios of fibre length, wall thickness and lumen diameter 108
Cross sectional area of fibres, fibre wall material and lumens 109
Arithmetic ratios of fibre cross sectional dimensions 109
Percentage of tissue types by volume 109
Number of vessels per unit area of cross section 110
Mean cross sectional area of vessels 110
Co authored paper for 2nd World Consultation on Forest Tree Breeding 110
Formal transfer to a Commonwealth Postgraduate Scholarship 111
Chemistry of the wood of E. deglupta 112
End of wood parameter measurement 113
Associations among the primary and derived variables 114
The association between wood density and other measured wood parameters 116
Baku Forest Station 117
1970 117
Wood sampling in standing trees at Keravat 117
Growing plants in controlled environments 119
Experimental methods for growing plants of E. deglupta in the phytotron 120
Provenance studies in the phytotron 122 Fieldwork in Keravat 123
1971 126
Species trial at Baku, Gogol 126
Membership of Forest Research Working Group No 1 Forest Genetics 127
Wood density among random and candidate populations of trees 127
Environmental and genetic variation in wood density 127
Heritability of wood density in E. deglupta 129
Selection differential 130
Selection of propagation population trees 131
Establishment of provenance trials of E. deglupta in Keravat, Dami and Gogol 132
Investigation of heart rot in E. deglupta 133
Volume tables for E. deglupta 135
1972 139
Site Quality computation for E. deglupta 139
Growth and Yield for E. deglupta 139
Completion of my PhD studies at ANU 141
Bridging Report for Silvicultural Research in PNG 142
E. deglupta seed orchard establishment in Bulolo 142
Hybrid eucalypts 145
Hybridization of E. deglupta and E. “decaisneana” 147
Provenance trials of E. “decaisneana” at Bulolo 148
Simulated pulpwood logging at Baku 151
Confirmation of the award of PhD for my work on E. deglupta 153
First species trial at Baku at age two years 154
1972 continued 161
Exploration of E. deglupta in the Garaina area, Morobe Province 161
Latest (1972), more detailed description of E. deglupta 164
Second provenance trial of E. deglupta at Baku 168
Reconnaissance on New Britain 170
1973 183
JANT start up in the Gogol 1973 183
Membership of Appita 187
JANT harvesting and reforestation activities 187
E. deglupta spacing trial, Baku 190
Thinning trials Keravat 1973 192
Heartwood decay in E. deglupta 192
Continuing harvesting plots at Keravat for pulpwood volume table compilation 194
Overseas duty travel to east Africa and New Zealand 195
Travel Bulolo PNG to Johannesburg, South Africa 196
IUFRO Division 5 Forest Products meeting 24 September to 12 October 1973, Cape Town and Pretoria, South Africa 198
PART 6
1973 continued 203
Rhodesia 203
Malawi 203
Zambia 207 Kenya 208
Back to Australia and on to New Zealand 210
Recreation leave in Australia from 18 November 1973 to 3 January 1974 212 1974 212
Visit by Christian Cossalter of the Centre Technique Forestier Tropical Congo 212
Visit to Bulolo by Edgard Campinhos Jr of Aracruz Florestal S A 221
Papua New Guinea Tropical Forestry Research Note series 221
Assessment of E. deglupta provenance trial No 2, Keravat, New Britain in 1974 at age 2 years 223
Second provenance trial of E. “decaisneana” at Bulolo 226
July Oct 1974: Vegetative propagation of epicormic and coppice shoots of E. deglupta 229 Bole shape of E. deglupta 234
Provenances 235
Initial spacing or initial stocking 235
Site quality 236
Tree age and average size 237
Practical implications of bole shape 238
An updated general volume table for E. deglupta 241
Further provenance trial of E. “urophylla” 241
Forest Tree Series Leaflet on E. deglupta 243
Progress report on tree introduction and improvement 244
1975 244
Provenance seed collection of E. deglupta in the Celebes and Ceram Islands May 1975 244
Provenance seed collection of E. deglupta in Irian Jaya, Indonesia, 3 17 June 1975 247
Natural distribution of E. deglupta 261
Taxonomy of E. deglupta 268
Taxonomic characters 270
Measurements on E. deglupta leaves preserved as herbarium specimens 272
Measurements on leaves from a provenance trial at Keravat 277
Single taxon at the level of species for E. deglupta 281
Reprinting of my PhD thesis 282
Permission to publish my work on E. deglupta 284
1976 285
E. deglupta progeny trial two years old, Kunjingini 285
XVI IUFRO World Congress, Oslo, Norway 287
1977 289
FAO/IUFRO Third World Consultation on Forest Tree Breeding 289
Post Consultation tour to Coffs Harbour 291
IUFRO Workshop, Brisbane 293
1978 293
Visit to Ulamona to investigate damage to a plantation of E. deglupta owned by the Catholic Mission and impacted by a recent volcanic eruption 293
Industrial Timber Corporation of Indonesia 300
Paper Industries Corporation of the Philippines 302
Jari Brazil 306
Seed production from the E. deglupta seed orchard, Bulolo 308 1979 310
Conference on Forest Land Assessment and Management for Sustainable Uses 310 1980 310
Visiting Scientist at the CSIRO Division of Forest Research, Canberra 310
IUFRO Symposium and Workshop on Genetic Improvement and Productivity of Fast Growing Tree Species, Brazil 311
Case studies on forest and watershed development in Asia and the Pacific 325
Reprint of Forest Tree Leaflets 326
1983 326
Publication of the papers given at the IUFRO Symposium on Genetic Improvement and Productivity of Fast Growing Tree Species in Brazil, August 1980 326
IUFRO meeting on frost resistant eucalypts 327 1984 328
Award of the Marcus Wallenberg Prize to the research team at Aracruz working on Vegetative propagation 328
PICOP at its peak in 1984 329
1986 329
Data book on endangered tree species 329 1993 330
PICOP revisited in 1993 330
1993 continued 333
UNDP/FAO Regional Project FORTIP 333
Publication of Eucalypt Domestication and Breeding 333 1994 334
Second edition of Eucalypt Domestication and Breeding 334
1995 335
Genetic variation in height growth and leaf colour in E. deglupta 335
1997 336
Pulping and papermaking potential of plantation-grown E. deglupta from PNG 336
2003 336
Molecular studies on Eucalyptus subgenus Minutifructus 336
2007 342
Breeding programme for E. deglupta in the Solomon Islands 342 2008 342
E. deglupta Seed Orchard Bulolo 342 2011 342
Herbarium collections of E. deglupta by K Damas 342
Open Bay Timber Company 344 2013 345
E. deglupta chloroplast genome sequenced 345
ACIAR Project “Facilitating the availability and use of improved germplasm for forestry and agroforestry in Papua New Guinea” 347 2014 348
Reference genome of E. grandis released 348 2015 349
Article on E. deglupta in “The Forester” 349 2017 350
E. deglupta in the Adelaide Botanic Garden 350 2018 350
E. deglupta in “Trees for Life in Oceania” 350 2019 353
Our book on “Eucalypt Domestication and Breeding” 353 Geological time line with reference to some eucalypts 354
Open Bay Timber Plantations 359
Keravat 2019 360
ABBREVIATIONS AND ACRONYMS 361
After the Silvicultural Research Conference in Bulolo, and as a prelude to the transfer from the Masters Degree enrolment to a PhD, I prepared a detailed formal, but still interim report, on the fibre length and density work that had been done to date. Copies were sent to HQ and to my supervisor Peter Rudman at ANU.
Alan Williams, before coming to the Territory to work in the Research Section at Keravat, had used a 0.222 inch calibre rifle in Australia (when employed by CSIRO) for collecting seed from tall trees and had co authored a paper intended to be published on the subject.1 Alan and I visited the Steamships store in Rabaul on Monday 2 September to discuss the requirements for a rifle and ammunition. An order was placed for a Remington 0.222 inch bolt action rifle, a 3 9 power zoom telescopic sight and mounts, and, initially, 1,000 rounds of PSP (Pointed Soft Point) Imperial brand ammunition.2
While Alan Cameron was visiting Keravat during October, the forward programme on E. deglupta was discussed. A proposal and plan were developed for a fertilizer trial for E. deglupta to be established immediately at Keravat. Possible seed orchard design for E. deglupta was discussed. It was decided lopping and tying down of branches of young trees would be tried to keep trees to a manageable height for seed collection in the seed orchard. In the flowering and fruiting study, a tally would be kept of the rate of production of seed from individual trees with a view to estimating how many trees should be in a seed orchard to provide for the seed requirements of proposed plantation establishment at Keravat and elsewhere. A trial top cleft grafted and patch grafted seed orchard comprising 10 to 12 trees would be established at Keravat. At this time it was considered likely that the operational seed orchard would be established “off site”, for example at Bulolo where the environmental conditions were not ideal for vegetative growth but street trees seemed to flower and fruit in abundance and relatively continuously.
1 Later published as: Green J W and Williams A V 1969. Collection of Eucalyptus branch specimens with the aid of a rifle. Australian Forest Research 4: 19 30.
2 At the time there was no restriction on the import of such a rifle and ammunition into the Territory, nor was there any requirement for the user(s) to be licensed.
There was also a requirement for spacing trials. If pulpwood production was to be a prime objective, much closer initial planting spacing would probably be the norm. E. deglupta, in its natural mode of regeneration developing in very dense stands and self thinning with age, would be an ideal candidate for close spaced plantations not requiring a thinning intervention. A spacing trial (four replications of 1.8 x 1.8, 2.4 x 2.4, 3 x 3 and 3.6 x 3.6 metres initial spacing) had been established at Keravat in 1966 and some of the early plantations in Fryar LA were still at very close spacing at age about 10 years.

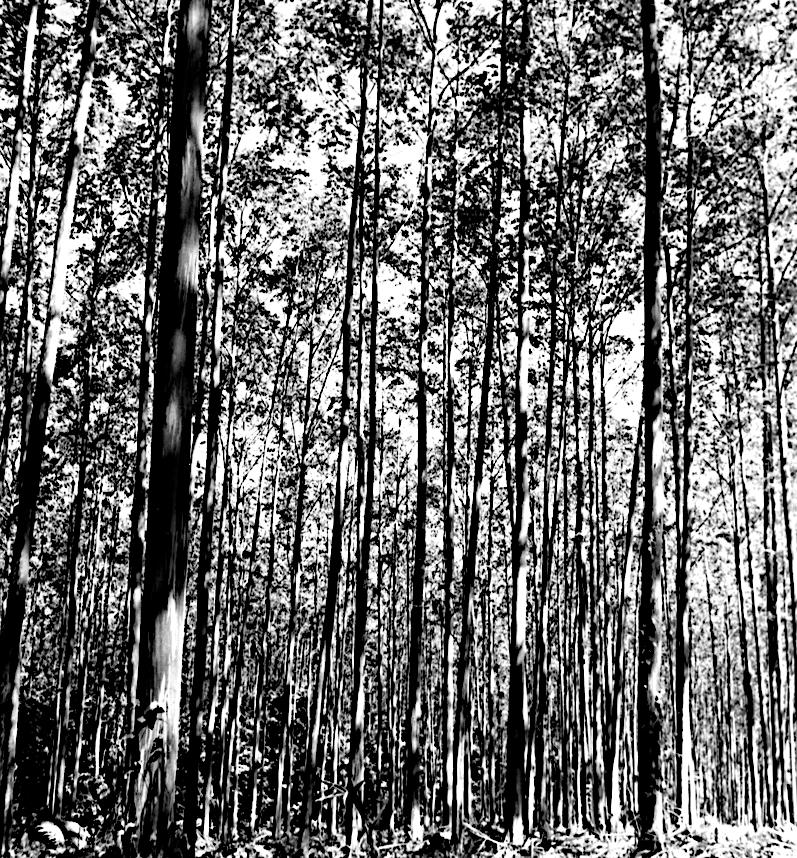
An unthinned plantation of E. deglupta in Fryar LA Keravat still densely stocked (about 500 stems/ha) at age 10 years. Average height was 36.5 m, average diameter at breast height 36.4 cm. Volume production was 78.6 m3/ha/yr, the highest growth rate recorded at Keravat for a plantation of that age, albeit only on this small area. Average volume per tree was about 1.6m3
E. deglupta, spacing trial Keravat, planted 9 November 1966, this plot about 1.8 x 1.8 m initial spacing, was photographed in October 1968 at almost two years of age. At age 2.9 years production was: for 1.8 x 1.8 m 31.6 m3/ha/yr; 2.4 x 2.4 m 29.0 m3/ha/yr, 3 x 3 m 18.6 m3/ha/yr and 3.6 x 3.6 m 20.3 m3/ha/yr
Based on plans and sketch maps sent by me to HQ in early June 1968, an inspection was made with Alan Cameron of areas planned for planting in late 1968 and in 1969 to decide on where new field trials would be established, including Bridge LA, Compartment 3 Vudal LA and Compartment 2 Vunapalading LA. The need for a research station in the Gogol area was communicated to HQ.
On 21 October, the fertilizer trial design was laid out on the ground in a two week old (since planting) routine plantation of E. deglupta on flat land in Bridge LA and pegged. Blank tabular forms were designed for use in the assessment. Application rates were decided on for each fertilizer. The trial was picketed with labels for each treatment. Fertilizers were applied on 28 and 29 October. An establishment report, including layout diagrams, was sent to HQ on Friday 15 November 1968.3
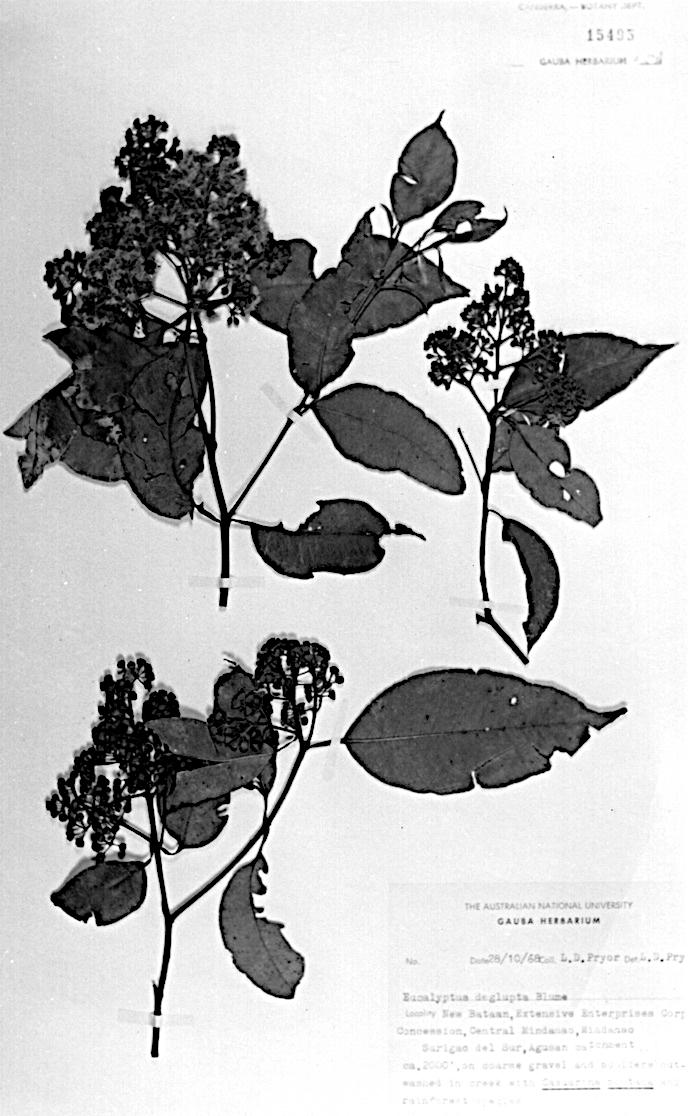
With some partial funding assistance from the Department of Forests, Professor Lindsay Pryor went to Mindanao in the Philippines in October 1968, where he was able to visit a number of natural stands of E. deglupta and some concession areas where the species was being grown in plantations. He was able to collect some seed and botanical specimens, which he brought back to Canberra. This visit was a prelude to the FAO and the Forestry and Timber Bureau jointly sponsored collecting expedition to Mindanao Philippines and eastern Indonesia primarily to collect seed of E. deglupta in April 1969 (see later).
Specimen of E. deglupta collected by Professor Pryor 28 October 1968. Locality: “New Bataan, Extensive Enterprises Corporation Concession, Surigao del Sur, Agusan catchment, Central Mindanao, about 2000` (610 m), on coarse gravel and boulders out washed in creek with Casuarina montana and rainforest species.”
3 Later, on 28 November, a similar trial was designed for Dami (near Cape Hoskins, New Britain).
Vegetative propagation of epicormic and coppice shoots of E. deglupta
Three groups of 20 nodal cuttings were taken from seedlings less than six months of age (controls), from epicormic shoots growing 2 m above ground on a fourteen year old tree and from coppice induced on the stump of a five year old tree by the application of indole 3 acetic acid.
The sixty cuttings were each dipped in sucrose solution then into Seradix No 3 powder (0.8 percent indole butyric acid) before insertion into a mixture of equal parts of coarse sand, shredded peat and vermiculite in plastic cups provided with holes in the base for drainage. These cups were then placed under intermittent mist spray.
Within fourteen days roots had formed on all three categories of cuttings. The juvenile seedling controls exhibited the longest and greatest number of roots, followed by the epicormics and coppice cuttings respectively (Table).
NUMBER AND LENGTH OF ROOTS OF CUTTINGS TAKEN FROM SEEDLING (CONTROL), EPICORMIC AND COPPICE SHOOTS OF E. DEGLUPTA*
Number of Roots/Cutting
Length of Roots (cm)
Type of Cutting
Mean Range Mean Range
Seedling 10 8 13 5.5 2 11 Epicormic 11 6 14 2.0 1 4.5 Coppice 5 3 8 1.1 0.5 3
*Assessment made two weeks after setting cuttings. Twenty cuttings of each type were set.
Lopping and tying down branches of E. deglupta to control height growth
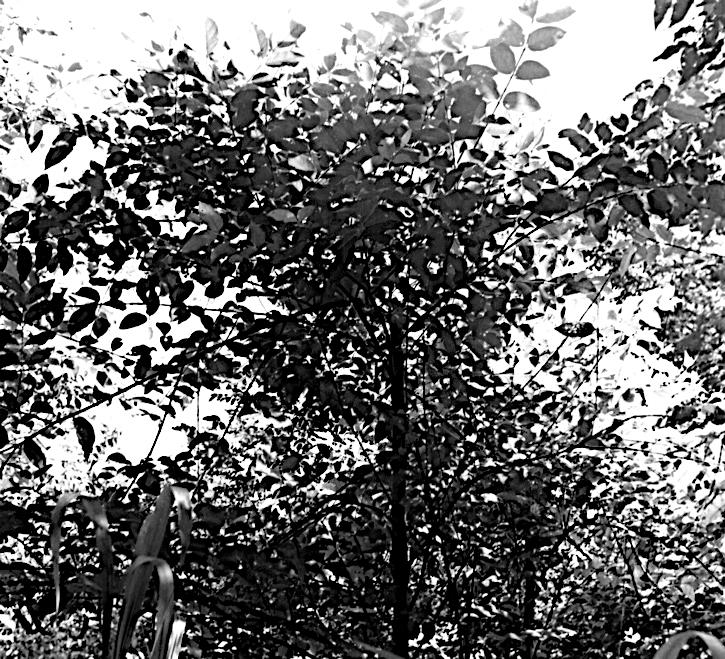
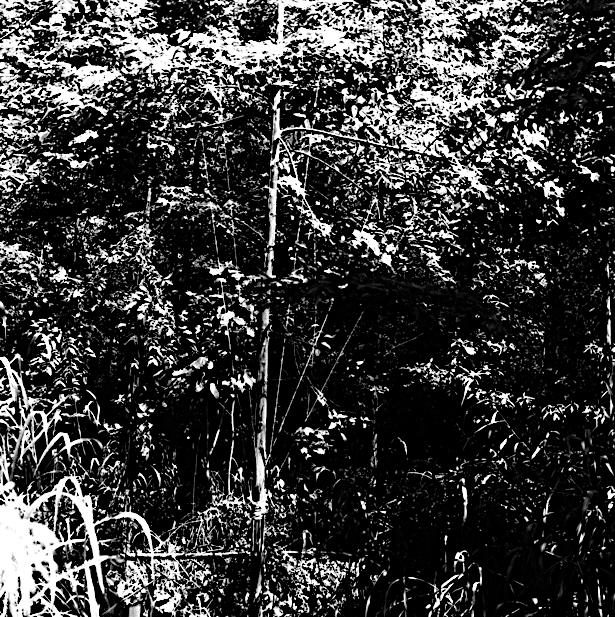
One of the issues with a fast growing tree like E. deglupta was that seed orchard trees would rapidly grow in height making seed collection difficult. A trial was carried out at Keravat on lopping and tying down the branches of young trees in Compartment 5 Fryar LA and in the so called “gravel pit” on Thursday 7 November 1968. Tying down branches was unsuccessful. Decapitation showed some promise.
Above: Tying down branches of young trees to try and stimulate a bushy crown at low level, Keravat, 1968. Left: A decapitated tree of about the same age and size as the ones shown above, one month after the top was removed.

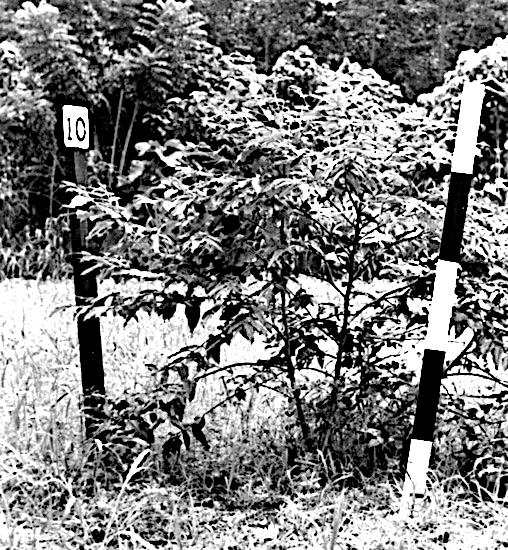
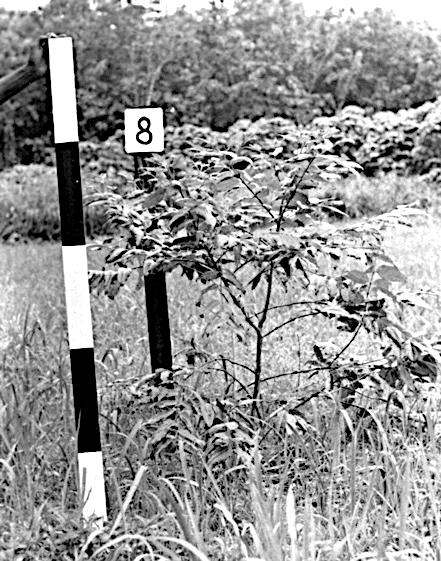
Seedling stocks were planted out in a small cleared area in Fryar LA at Keravat ready for top cleft and patch grafting in the field. The intention was that half would be patch grafted and half top cleft grafted. Grafting was carried out in October 1968.
Area set aside for a trial seed orchard in Fryar LA at Keravat in 1968. Grafts are shown after two months. Each has an identifying number on a creosoted sawn timber stake.
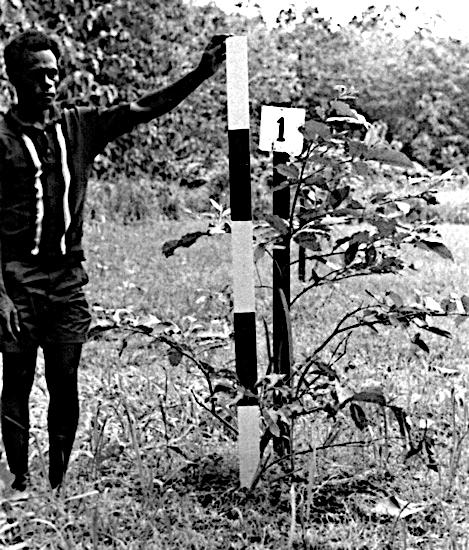
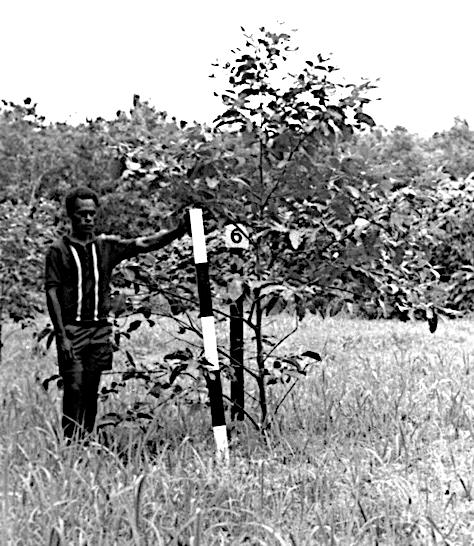
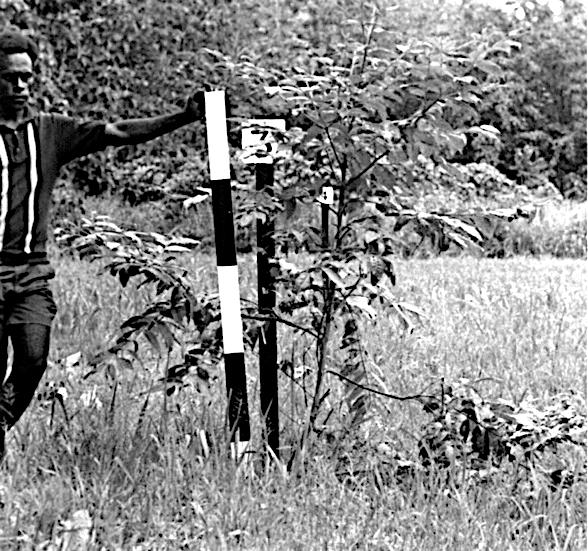
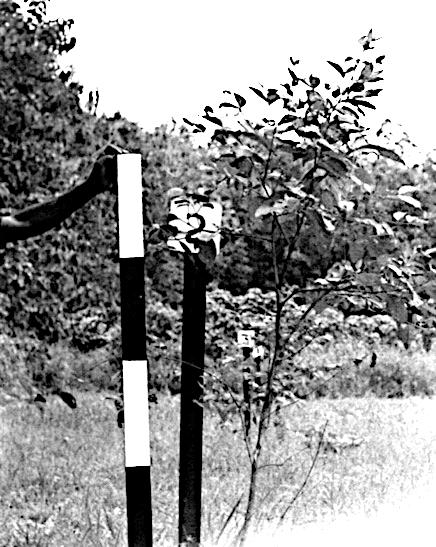
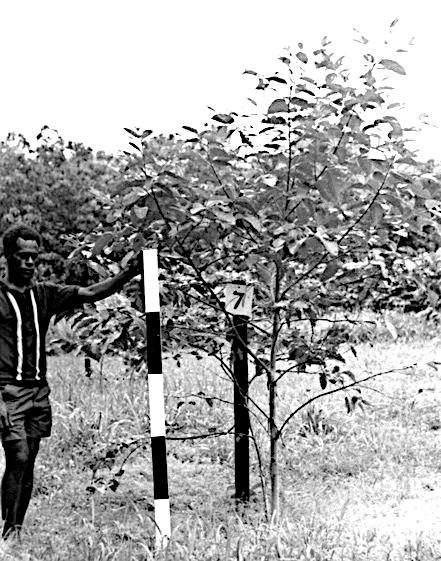

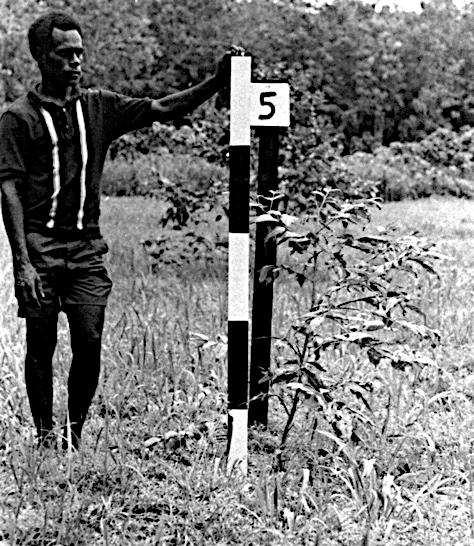
Previous page and this page: Trial seed orchard grafts at Keravat in late 1968, about two months after grafting. Research Assistant Isidor holds a staff marked in feet (1 foot = about 0.3 m). Numbers 2, 6 and 7 were top cleft grafts, the remainder patch grafts. Number 10 was a patch graft that had produced three strong leaders from the single patch, later reduced to one main leader.

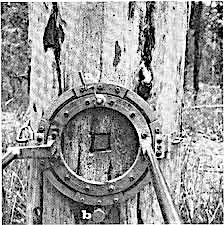
An order was placed directly through Mr Sulc in Canberra for one of the sampling machines described in his paper4and illustrated below.

Machine designed for removing substantial samples of wood from standing trees. It had a rotating gimbal that could be securely and rigidly attached to the trunk with a chain and leveled with two screws (a and b in the bottom right photograph), and which would rotate and lock in one of four positions, and a chainsaw motor driving a cutter chain on a mortising bar that could slide back and forth on two rails (bottom left photograph). The bar with rotating chain was plunged into the tree four times, each after the gimbal was given a quarter turn, to produce a sample about 2½ inches (about 6 cm) square in cross section (bottom right photograph) and depth up to the length of the cutter bar (adequate to sample from bark to pith in the trees under study at Keravat). The sample could be detached at the inner end by sliding a length of flat iron bar into a cut as far as it would go then hitting the outer end sharply away from the sample.

The rifle and ammunition finally arrived. The Keravat police and heads of Vudal Agricultural College, LAES, Jail and Keravat High School were advised that rifle shooting would become a regular occurrence in the Keravat plantation forest areas along the west side of the Keravat River.
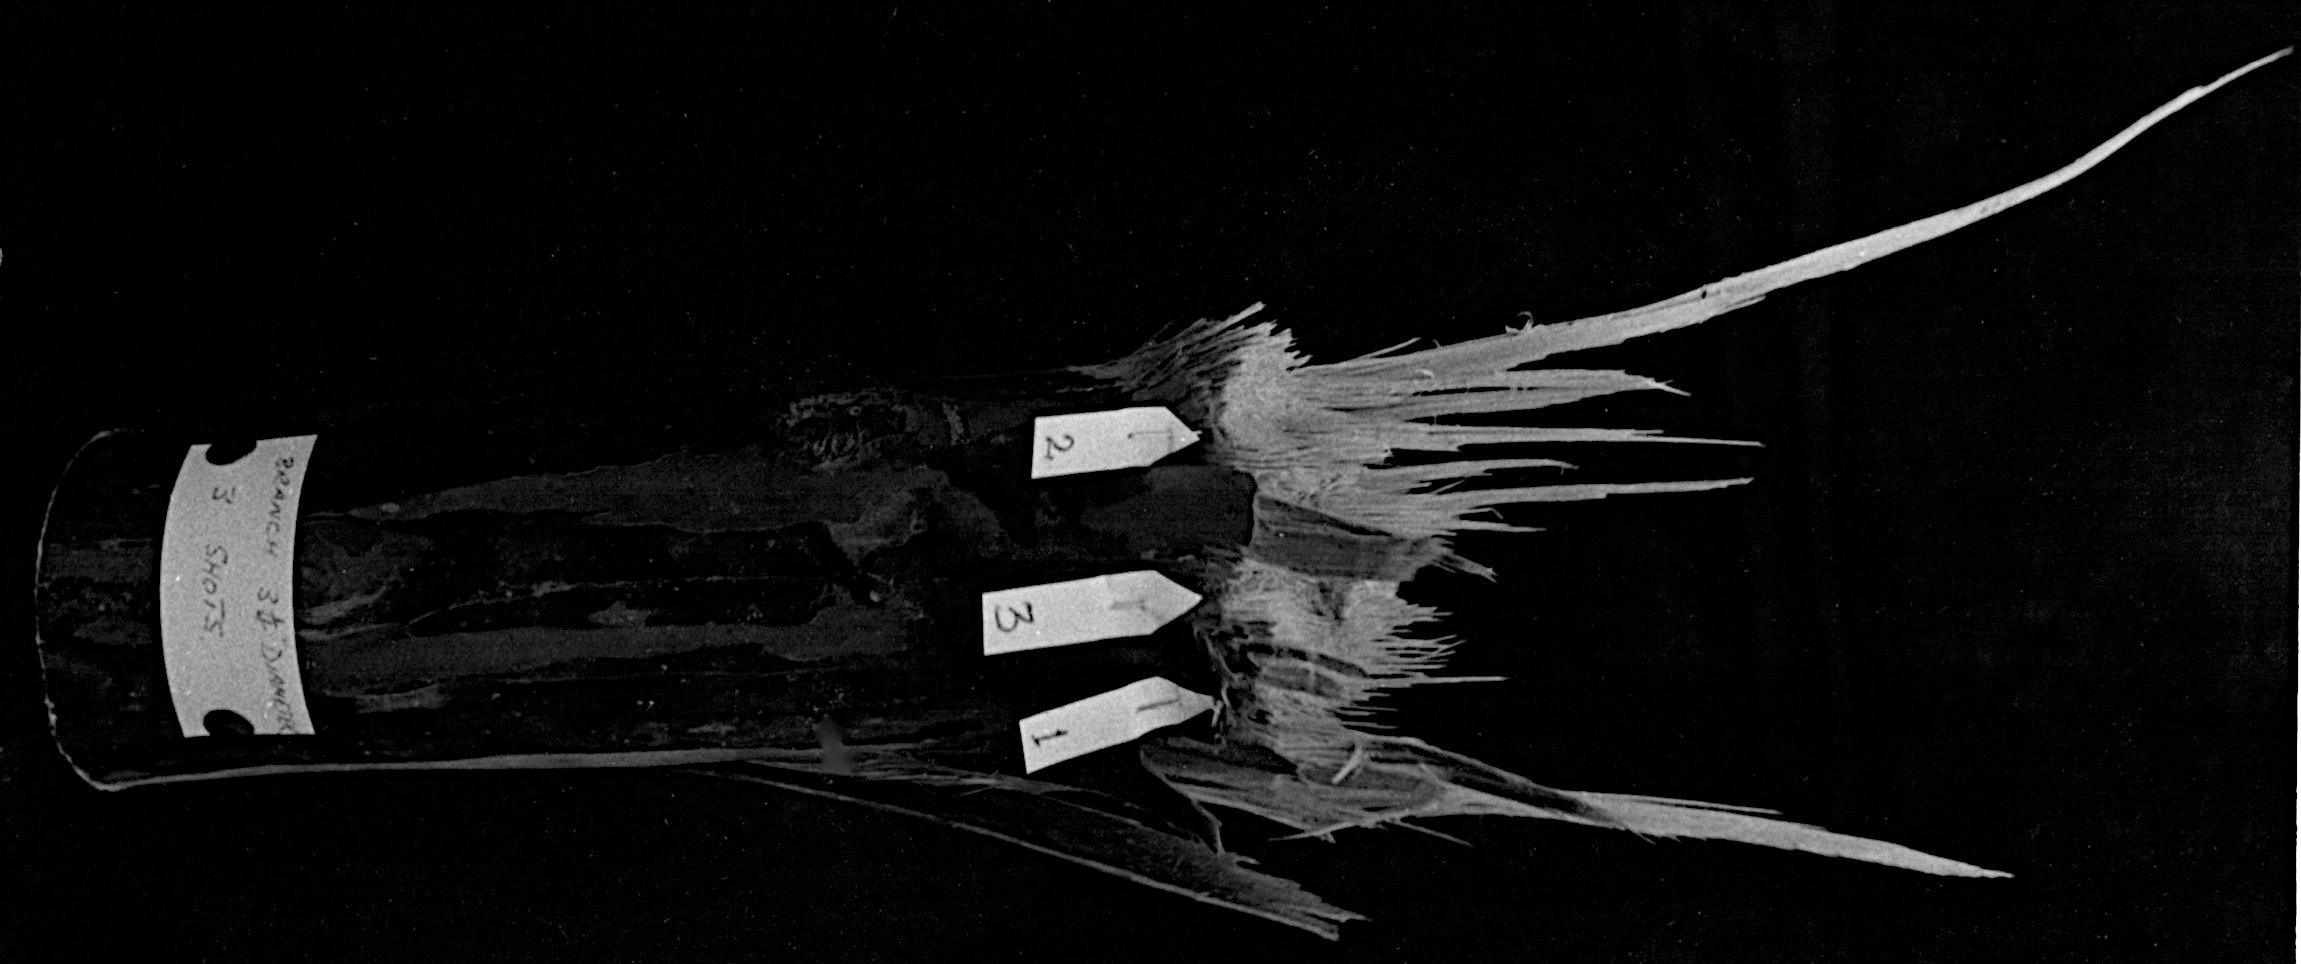
The rifle was assembled on 27 November 1968 and taken down to the Keravat River adjacent to Compartment 5 Fryar LA for sighting in. It was then tested on some branches of one E. deglupta tree about 20 m from the ground. The result was a great success (see photographs below). The .222 inch calibre was adequate for use on the relatively low density and easily shattered kamarere branches.5

Remington 0.222 inch calibre bolt action rifle with a 5 shot magazine and fitted with a 3 9X zoom telescopic sight. The ammunition was Imperial pointed soft point. The pointed soft point was more effective than fully copper jacketed ammunition as the exposed soft lead point deformed on impact and caused a greater shattering effect on the wood of the branch.
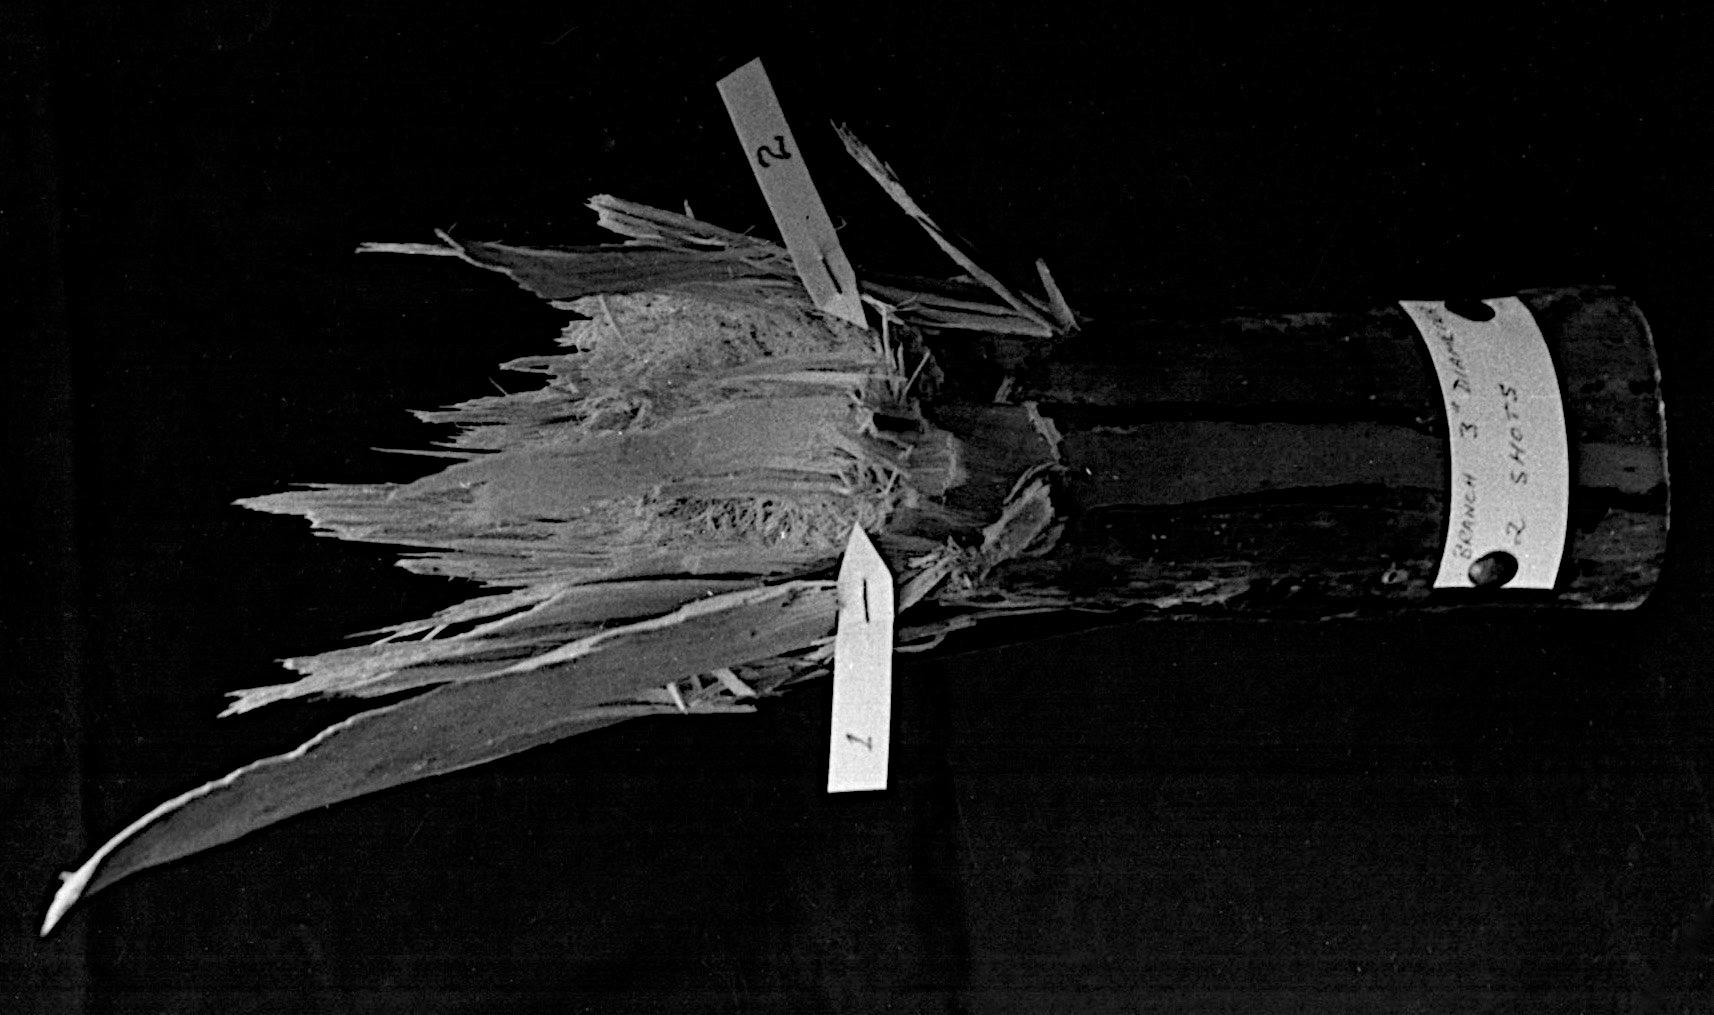
A 3 inch (about 75 mm) diameter branch of E. deglupta brought down with two shots, the first in the lower third and the second one vertically in line in the upper third of the branch
5In Australia, the Australian Tree Seed Centre later found a 0.308 inch calibre rifle to be more effective on larger (10 20 cm diameter) branches than either 0.222 or 0.243 inch calibre rifles.
A 3½ inch (about 90 mm) diameter branch brought down with three shots, the first in the lower side, the second towards the upper side and the third in the middle, all in a near vertical line. The soft pointed ammunition caused significant shattering of the wood in this relatively low density eucalypt.
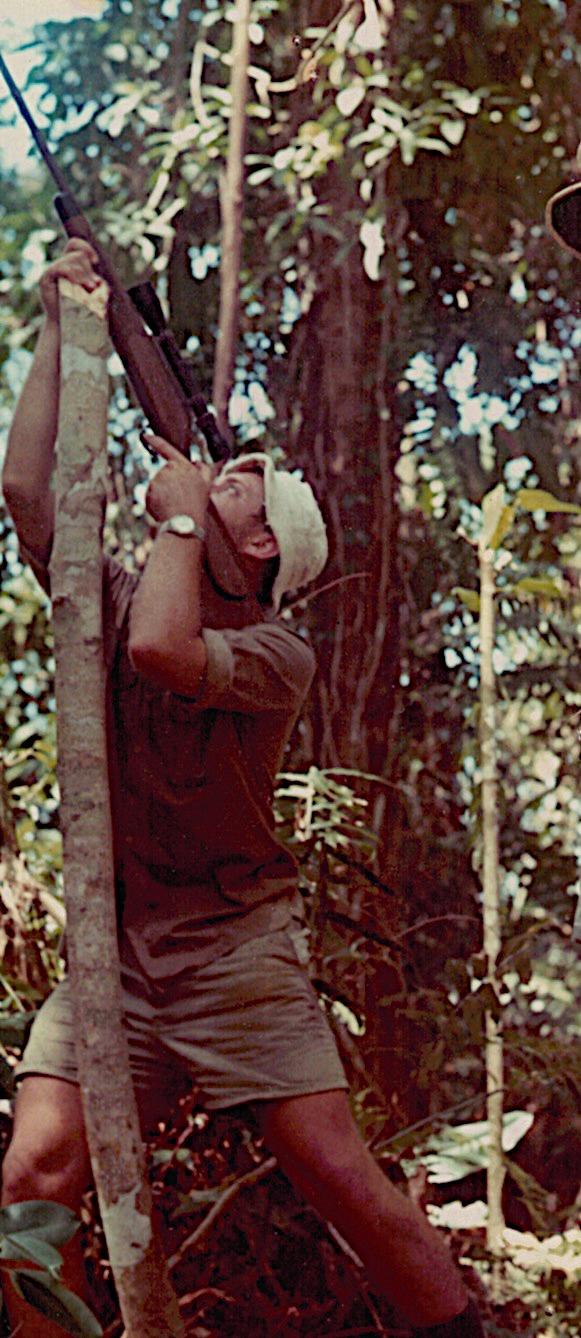
I take aim (left). The number of bullets used depended on the size of branches to be removed and the accuracy of both the rifle and the shooter. The accuracy of the rifle and scope combination was periodically checked by sighting in at a paper bull’s eye target. My marksman’s experience while Captain of our high school rifle team came in very useful for accurate shooting, though the rifle, out of necessity in my absence, had to be used by others with possibly less shooting experience and poorer marksmanship.
The rifle was most effective on branches up to about 10 cm in diameter. Branches were selected that had an acceptable crop of seed or suitable vegetative material for herbarium specimens, cuttings or scions for grafting. They needed to be located strategically to minimize the chance of being caught up in other lower branches in the crown or in the understorey. The shooter was required to adopt a position that ensured the rifle was pointed away from human habitation and at an upwards angle of at least 45° to the horizontal. Shooting normally was done at right angles to the branch, placing shots in a straight line usually at the bottom of the branch first, followed by the top, then with one or more shots in the middle as required depending on the diameter of the branch. Sometimes the shooter had to change position to finally sever the branch.
The use of the rifle enabled an accelerated programme for collecting vegetative material for grafting and growing cuttings and for collecting seed from the candidate trees.
Collection of seed and vegetative material of E. deglupta
Collection of seed and vegetative material from the 150 tree breeding population started in earnest in the beginning of 1969 with the aid of the rifle. Seedlots, after extraction from “dry” capsules, were stored separately for each tree (identified in the field by number on a stake and two yellow rings around the trunk at near breast height). Seed in labeled test tubes sealed with a rubber bung and paraffin wax were kept in a refrigerator at about 1°C in the research room at the end of the Keravat office. Experience had shown that seed kept in this condition would still have good viability for four years or more.
With the relatively easy availability of fresh vegetative material from tall trees obtained by shooting, experimentation continued on patch grafting and raising cuttings. Raising cuttings was carried out directly from shoots from the more mature trees and from shoots rejuvenated by repeated grafting. By the beginning of 1969 some success was being achieved in growing cuttings from trees up to five years of age.
Move to Canberra to take up PhD studies at the ANU
Gloria and I arrived in Canberra on 3 March 1969. On arrival in Canberra we were accommodated in the small Commonwealth Hostel called Narellan House in Coranderrk Street, Reid (left). Our Volkswagen car was shipped from Rabaul to Sydney and picked up from a warehouse almost under the Sydney Harbour Bridge and driven to Canberra. On 24 April we moved into a new house of our own that we had purchased in Ogilby Crescent, Page. A week later I formally enrolled for the PhD for three calendar years, meaning my thesis would have to be delivered to the Registrar precisely on 10 March 1972 under the very strict rules then in force in the Faculty of Science at the ANU.
Aims of the experimental work to be undertaken during my PhD
Fibre length and density of the wood of E. deglupta had been studied. Determination of within tree variation in wood density and how the wood of an individual tree could be characterised by a single representative non destructive bark to pith sample removed from a living tree had been completed. The aims of further work to be undertaken over the coming three years included:
i. To explore the variation of a number of important parameters in the wood of E. deglupta within small samples (1 cc in volume) and determine how this variation could be assessed to derive sample average values.
ii. To use sample average values to determine the degrees of association among the measured parameters.
iii. To try and characterise the small samples by use of only a few of the measured parameters and relate as many as possible to wood density, a complex variable already studied.
iv. To use representative sampling to investigate variation in wood properties among trees, and among geographic areas.
v. To determine the relative importance of genotype and environment as causes of observed variation in wood and morphological characters by imposing a number of different environmental treatments on seedlings and young clonal material.
vi. To use the genetic information obtained to determine which characters would be of value in selection of desirable trees in a tree improvement programme.
vii. To determine phenotypic correlations among the characters used for selection.
At the time gaps existed in our knowledge of many of these aspects, especially in regard to eucalypts. Many earlier studies in the genus were limited to too few samples and the results were not adequate for detailed statistical analysis. The results from these new studies would have immediate practical significance for the developing tree improvement programme for E. deglupta and, as well, be generally applicable to any fast growing eucalypt.
In April 1969 the FAO and the Forestry and Timber Bureau jointly sponsored a collecting expedition to Mindanao Philippines and eastern Indonesia primarily to collect seed of E. deglupta. Egon Larsen, Forestry Officer, Forest Research Institute, Forestry and Timber Bureau, Canberra organised and led the expedition, which included Alan Cameron from the Department of Forests, Papua and New Guinea.
Duplicate Philippine specimens collected by Alan from Daticor
Village Luzon on 5 March 1969 (planted, not native in that location), Bislig Bay area on 7 March 1969 and Milbuk on 11 March 1969, the latter two from native locations in Mindanao, are held in the National Herbarium, Lae.
Unfortunately, Egon was killed in a vehicle accident 300 km north of Makassar City in the Celebes (now called Ujung Padang, South Sulawesi) on 29 April 1969. Alan was injured but later able to return to work. Seed and herbarium specimens collected by Egon and Alan were conveyed to the Seeds Section and Herbarium, Forest Research Institute, Canberra.
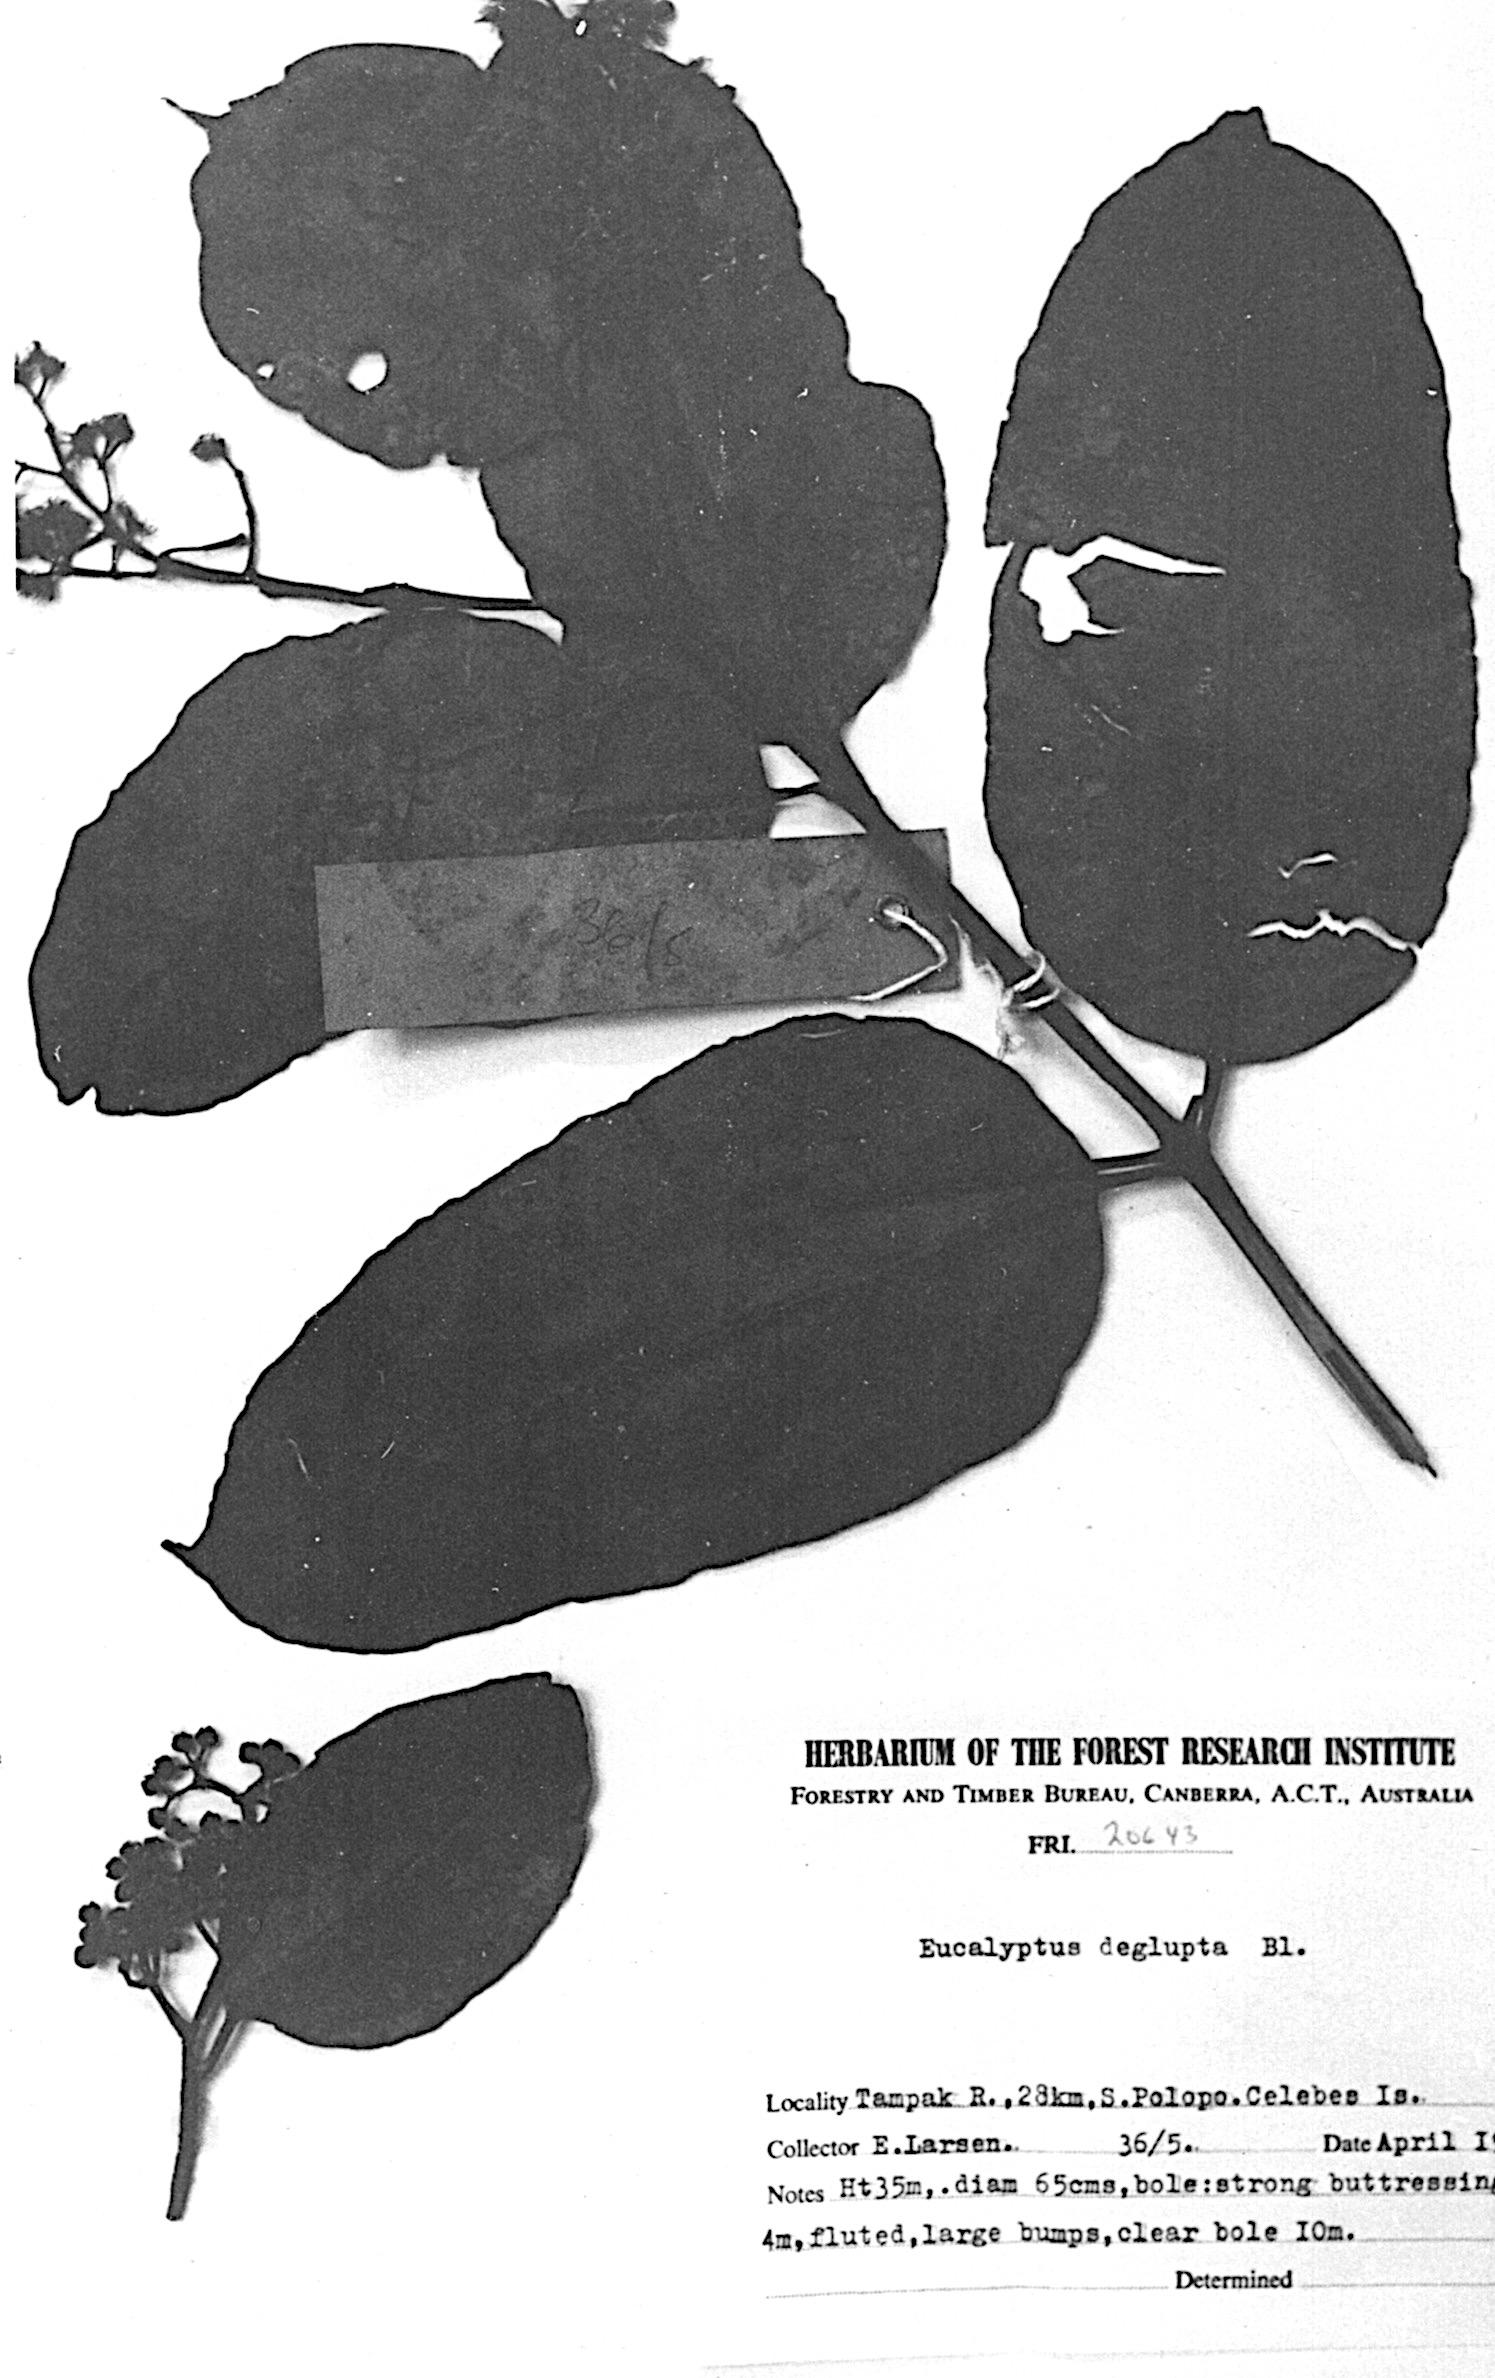
Left: Specimen of E. deglupta collected by Egon Larsen from near the Tampak River, 28 km south of Palopo, Sulawesi, April 1969.
The thickness of the fibre wall of angiosperm wood contributes to its strength, machining ability and pulp quality. The relationships of fibre diameter and lumen diameter with wall thickness have important bearing on fibre flexibility, which in turn affects a number of paper properties.
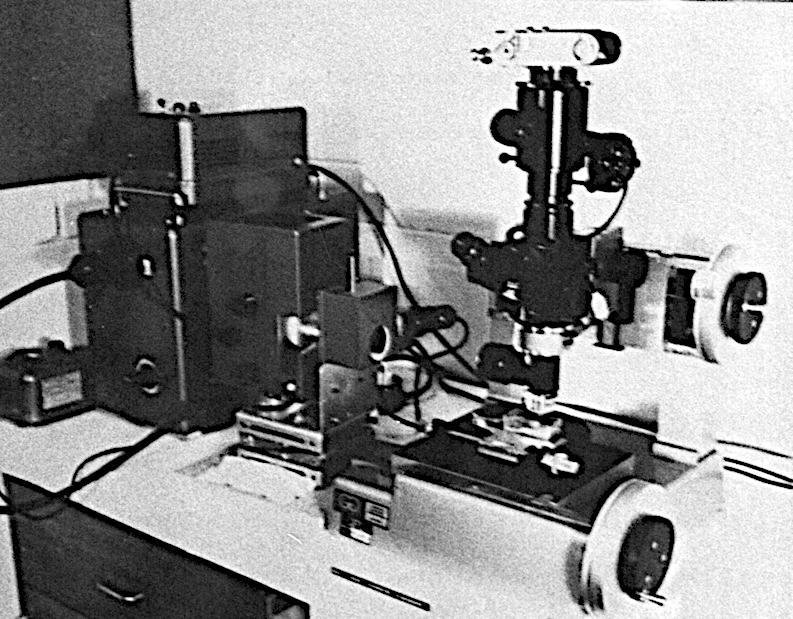
The instrument used in this part of the study was a dual linear traverse measuring micrometer. The methodology and results are set out in my thesis.6
Dual linear traverse measuring micrometer fitted with a Leitz Ultrapack Microscope. A 55X water immersion objective, a 1.25X intermediate stage and a 10X stereoscope ocular with cross hairs were used giving an overall magnification of 687.5X. Illumination was provided by a high intensity Xenon arc lamp located to the left of the microscope and directed through a right angle prism on to the surface of the small (about 1 x 1 cm) wood block which had been smoothed on the transverse sectional surface with a microtome, stained with an aqueous solution of malachite green and methylene blue, subjected to a vacuum to remove air bubbles and held just submerged in water in a small plastic trough.
Arithmetic ratios of fibre length, wall thickness and lumen diameter
Various workers have derived a number of ratios of parameters in attempts to relate measured variables to the properties of wood or reconstituted wood materials like paper. I examined:
i) Fibre length : diameter ratio, possibly associated with paper strength
ii) Runkel’s ratio, fibre double wall thickness : lumen diameter, associated with interfibre bonding
iii) Fibre wall thickness : fibre diameter ratio, sometimes called the Isenberg Coefficient, an expression of fibre density determining the degree of flexibility and collapse of the fibre, both of which control the degree of conformability of the paper sheet. As a measure of the relative proportion of solids in the cell cross section this ratio theoretically should have a high correlation with wood density
iv) Lumen diameter : fibre diameter ratio, sometimes called the coefficient of fibre flexibility, has a positive relationship with tensile (breaking length) and burst strengths of paper, and in describing the relative proportion of void to solid in the fibre cross section might be expected to show some correlation with wood density
v) Reciprocal of fibre diameter, numerically equal to the number of fibres per unit length of traverse in the radial direction is an index of fibre packing density and an indication of the amount of solid material present, thus would be expected to have some connection with wood density
For results and discussion see my thesis.7
Parameters recording actual amount of fibre wall substance in cross section are more likely to indicate wood and pulp properties than the pure arithmetic ratios described in the previous section.
Five feasible models of fibre cross sections were devised8and cross sectional area of fibre, wall substance and lumen were obtained in terms of double wall thickness and lumen diameter. One model (No 3) was chosen to represent the most common fibre cross section shape present in E. deglupta wood.9
Four arithmetic ratios were examined:
i) Transverse area of wall : transverse area of fibre. Provided there are no intra cellular spaces, this ratio represents the proportion of wall material in the space occupied by fibres. This ratio when expressed as a percentage is sometimes known as the Mulsteph coefficient. Some relationship of this ratio with wood density could be expected.
ii) Transverse area of the lumen : transverse area of the fibre represents the proportion of voids in the fibre tissue, provided there is no space between the fibres themselves. Again some connection with wood density could be expected.
iii) Transverse area of the lumen : transverse area of the wall determines the extent to which the fibre will flex and collapse and should also bear some relation to wood density.
iv) Reciprocal of cross sectional fibre area, equivalent to the number of fibres in a given area of wood cross section.
It was important to discover the relative importance of each tissue type in respect to wood properties as large differences in size and weight occur among different cell types in eucalypts. The large numbers of small diameter fibres with relatively thick walls would be expected to determine largely the weight per unit volume. The vessels are numerous and large in E. deglupta but are thin walled, so their effect on wood density is mainly to increase volume without adding weight. To resolve these issues, percentage by volume of rays, vessels and fibres and parenchyma were determined. Fibres and parenchyma were
8 Figure 3.4, Page 56 In Davidson J 1972 loc. cit.
9 Pages 55 and 58 and Table 3.3 Page 57 In Davidson J 1972 loc. cit.
considered together as the amount of parenchyma present in E. deglupta was small, being of diffuse and vasicentric10 types.
i) Percentage of rays by volume. The dual linear traversing micrometer was again used; the two dials summing ray and non ray tissues on tangential surfaces of small wood blocks.
ii) Percentage vessels and fibres by volume were determined on the transverse surface using the dual linear traversing micrometer with the sample oriented so the traverse as far as possible was parallel to and avoided passing over rays.
Vessels have a bearing on wood density of E. deglupta because of their relatively large size. A unit quadrat was fixed at four mm2 and a 2 x 2mm shape was inscribed on a sheet of clear acetate. The number of vessels falling inside the quadrat was counted. Four to eight quadrats were assessed per sample, depending on the number and size of vessels present.11
As radial and tangential measurements of individual vessels would have been difficult and tedious, mean cross sectional area of vessels was accepted as an index of vessel size and calculated using data already available and dividing percentage area of vessels appearing on a unit area of cross section by the number of vessels per unit area.
P Rudman (Supervisor), M Higgs, N Malajczuk and myself (three of Rudman’s PhD Students) prepared a paper for the IUFRO FAO USA 2nd World Consultation on Forest Tree Breeding to be held in Washington DC, August 7 16 1969.
10 Forming a distinct round to oval sheath about a vessel 11 Pages 61 to 63 In Davidson 1972 loc. cit.
12
None of the four authors attended but below is a summary of our paper, which later appeared in the proceedings in English accompanied by French and Spanish summaries.
“For three eucalypt species, Eucalyptus regnans, E. calophylla and the tropical E. deglupta, the within tree variations in wood density and fibre length are discussed, and weighted whole tree values derived. An examination of the data is made to determine if cores taken at breast height or certain percentile heights can adequately represent the whole tree in a superior tree selection programme. Breast Height sampling is inadequate, although other positions have merit.

Very highly significant phenotypic differences in whole tree density and fibre length are reported. These differences, which are sometimes greater than thirty per cent, are assumed to reflect genetic differences since very highly significant genetic differences of similar magnitude are shown to exist in young clones of E. camaldulensis and open pollinated seedling E. regnans Heritabilities, together with their standard errors, are presented for height, stem diameter, wood density and fibre length in the seedling E. regnans, and a very highly significant genotype environment interaction is reported. It is thought that open pollinated E. regnans seed, which is insect pollinated, is largely full sibling.
Selection of phenotypes for early maturity is discussed in relation to rotation length, and segregation into density classes rather than selection for high density is proposed. Finally, vegetative propagation of the three species is discussed.”
From 3 March until 6 August 1969, I remained on full pay while I used up my normal and long leave entitlements. From 7 August I went on leave without pay but with continuation of service granted by the Public Service Commissioner Papua and New Guinea provided I continued to work on E. deglupta and kept up payments into the Superannuation Fund. From that day onwards I received a Commonwealth Postgraduate Scholarship supplemented by funds provided through the ANU from the Commonwealth Government’s Australian Research Council following a successful application for a grant through the Australian Research Grants Committee.
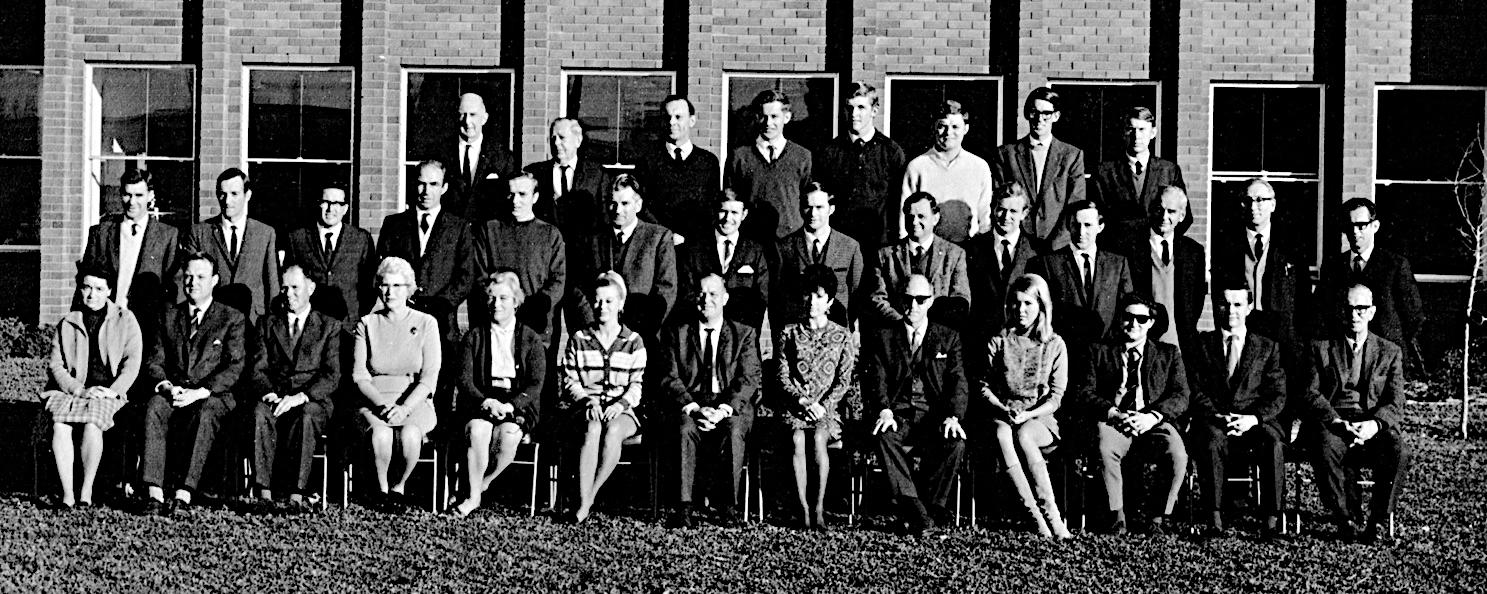
Staff of the Department of Forestry, ANU in 1969. I gained a place in the photograph (fourth from left, back row) for joining Mike Slee (fourth from left, middle row) in demonstrating one afternoon a week to the Fourth Year practical class in Wood Science and Technology. Second from left, front row, was my then PhD supervisor Dr Peter Rudman. Third from the right, middle row was Dr Bill Heather, my PhD supervisor after Dr Rudman left the University.
Chemistry of the wood of E. deglupta
Total extractives, lignin and crude yield were examined.13
The presence, distribution and nature (physical and chemical) of extraneous materials in wood may markedly affect its density and its end use properties. Extraneous materials include calcium salts, kinos (phenolic substances), silica, gums, resins, fats, waxes, oils, tannins, starch, alkaloids, volatile substances and colouring matter. Those from this list that can be removed from wood by various solvents are termed extractives. Commonly used solvents include alcohol (removes tannins), alcohol benzene solution (removes, resins, oils, fats and waxes) and hot water (removes starch, salts and colouring matter). For E. deglupta I used the appropriate Appita Standard P5M 61 ‘Solubility of wood in boiling tenth normal sodium hydroxide’ on duplicate samples to dissolve tannins, kinos and colouring matter and report solubility in per cent by weight as ‘total extractives’.
Lignin is a complex aromatic compound which is deposited in the cell walls of vessels and fibres conferring on them strength and rigidity. Some 35 30 per cent of the wood of eucalypts is lignin. I determined the amount of lignin in the wood of E. deglupta by using a modified Tappi Standard Method T13 m 54. The modification involved deleting the section referring to pre extraction with benzene alcohol as it had been found unsuitable for application to Eucalyptus spp and substituting a pre extraction
with dilute alkali. This meant that the extractive free samples from the analyses described earlier could be passed directly on to this next stage where the wood was treated with strong (72%) sulphuric acid. The acid hydrolysed the carbohydrates leaving an insoluble residue, which was determined as lignin and recorded on a dry weight un extracted wood basis.
After the stepwise removal of extractives and lignin what was left could be termed ‘holocellulose’ or ‘total carbohydrate fraction’. However, as a tiny amount of carbohydrate may have been removed with the extractives, I chose to use the term “crude yield” to describe the fraction [(100 dilute alkali extractives concentrated sulphuric acid insoluble lignin) per cent].
As the end of 1969 approached, the end too was reached for the measurement of the wood parameters in the nine sample trees from Keravat. To reiterate, nine heights (ground level, breast height, 10, 20, 30, 40, 50, 60 and 70 % of total tree height) and six pith to bark positions (5, 25, 45, 65, 85 and 95% of the radius) were sampled, that is 9 trees x 9 heights x 6 radii = 486 sample points. Nine variables were measured directly (“primary’ variables) providing 4,374 data points. Another 15 variables were computer generated from various combinations of the measured variables (“derived” variables) adding another 7,290 data points (grand total = 11,664 data points).
Primary
1.* Fibre length (FL) 2. Fibre double wall thickness (2W) 3. Fibre lumen diameter (L) 5. Proportion of rays by volume (RV) 6. Proportion of fibres and vertical parenchyma by volume (FV) 7. Proportion of vessels by volume (VV) 8. Number of vessels per unit area of cross section (VNO) 22. Percentage of lignin by weight (LIG) 23. Percentage extractives by weight (EXT)
Derived 1. Fibre diameter (2+3) (D) 9. Vessel cross sectional area (vessel size) (from 7 and 8) (VS)
10. Felting coefficient. Fibre length/fibre diameter ratio (from 1 and 4) (FL/D) 11. Runkel ratio. Ratio fibre double wall thickness/fibre lumen diameter (from 2 and 3) (2W/L) 12. Isenberg coefficient. Ratio fibre double wall thickness/fibre diameter (from 2 and 4) (2W/D) 13. Flexibility coefficient. Ratio fibre lumen diameter/fibre diameter (from 3 and 4) (L/D) 14. Number of fibres per unit length of radial traverse (reciprocal of 4) (FIBS)
15. Cross sectional area of fibre wall material (from 2 and 3 according to a model fibre) (WA) 16. Cross sectional area of fibre (from 2 and 3 through a model fibre) (FA) 17. Cross sectional area of fibre lumen (from the difference between 15 and 16) (LA) 18. Mulsteph Coefficient. Ratio cross sectional area of fibre wall material/cross sectional area of fibre (from 15 and 16) (WA/FA)
19. Ratio cross sectional area of fibre lumen/cross sectional area of fibre (from 16 and 17) (LA/FA)
20. Ratio cross sectional area of fibre lumen/cross sectional area of fibre wall material (from 15 and 17) LA/WA)
21. Number of fibres per unit area of cross section (reciprocal of 16) (FIBS/A)
24. Percentage of crude yield (holocellulose) by weight [100% (22 + 23)] (HOLO)
* The numbers preceding each parameter were used for reference to the parameter as a subscript of an x variable; for example, x2 referred to fibre double wall thickness. The capital letters at the end of the description of each variable were used as abbreviations for the variables in computer program coding.
The amount of data available was prodigious. I wanted to be careful not to use any preconceived ideas to reduce the quantity of data. While subjective decisions were made as to what parameters could be measured in the time available, sampling and measurement procedures were fundamentally objective, and the techniques used, some of them quite tedious, allowed estimates within certain limits of precision to be made. A considerable amount of computer time was required for analyses. Mark Higgs (in the final stages of writing up his PhD thesis) and I co booked time on the University computer between 1 AM and 3 AM for a couple of nights a week to run our own jobs and thus circumvent the long turnaround time otherwise normally required.
The first stage was to screen all of the data through my program SCREEN, written earlier, to satisfy whether each of the variables closely approximated the normal distribution. This was done to ensure the statistical techniques used later, which relied on assumption of a normal distribution, could be applied with confidence.14 All of the parameter measurements were normally distributed. No transformation of any of the data was required.
This work is described in my PhD thesis.15 Product moment correlation coefficients and their standard errors were computed using my program CORRE for all possible paired combinations of the variables while assuming linear relationships among them. The resulting matrix was more compact than the original giant data matrix and solved the issue of different units and scales in the variables but the resulting high number of significant correlations that were observed did not advance the understanding of the associations among the parameters. The high correlations may not have been wholly the result of causal effects of one single variable on another single variable but because of multiple effects of more than one variable on another, or because of position of the sample within a tree, or both.16Some other
14 The recommended texts of the time were: Sokal R R and Rohlf F J 1969 Biometry; Rohlf F J and Sokal R R 1969 Statistical Tables Both W H Freeman and Company, San Francisco; Fisher R A and Yates F 1953 Statistical Tables for Biological, Agricultural and Medical Research. 4th Edition. Oliver and Boyd, London.
15 Chapter 4, pages 67 83 In Davidson J 1972 loc. cit.
16 See Table 4.4 pages 74 and 75 In Davidson J 1972 loc. cit.
statistical technique was required to better understand these data. It would have to employ multivariate analyses.
Methods of principal component analysis (PCA) and factor analysis (FA) were originally developed and applied largely by psychologists. They were used for analysing the structure of abilities reflected in batteries of memory tests, and were beginning to be used to understand complex systems in nature. They had not been used in the study of variation in wood properties until I applied them in this work on E. deglupta. 17 I wrote the Fortran program FACTO to do this.
PCA involved examining the dimensions of variation and giving the components physical meaning. FA is generally considered to work the other way round; that is, testing the agreement of new data with a model derived by PCA. This broad distinction between PCA and FA is often blurred in practice, as it was in this study, because both of these operations were carried out at the same time to understand the complicated data structure.
After a PCA it was found 93.5% of the variation in the wood of E. deglupta could be represented by only four components. Factor analysis of these four components showed 12 variables had a high degree of association with the first factor. They were all fibre cross section parameters or their derived ratios. All were equally well correlated with the component and any one of them could determine the component.
The three chemical constituents lignin, extractives and holocellulose, proportional volumes of the three tissue types and vessel size showed a good degree of correlation with the second component. Lumen area and lumen diameter were the only important variables in the third component. Fibre length and fibre length/fibre diameter ratio were the only prominent variables in the fourth component. To describe most of the variability (93.5%) in wood of this species, one important variable in each component would need to be measured. If just one variable in each of the first three components, for example, fibre double wall thickness (x2 (2W)), vessel size (x9 (VS)) and fibre lumen diameter (x3 (L)) were measured they would describe close to 90% of the variability in wood of E. deglupta
17 Simultaneous PCA and FA analysis formed the basis of the new intellectual input required from me for the award of a PhD at the ANU. The method was described also in a conference paper at a meeting of the International Union of Forest Research Organisations (IUFRO) Division 5 Forest Products: Davidson J 1973 The association between wood basic density and some measurable wood parameters and possibilities of growing wood of optimum density in tropical plantations of Eucalyptus deglupta Blume, Meeting of IUFRO Division 5, Working Party S5.01.3, Cape Town, South Africa 24 28 September 1973. The method was recognised again later by publication of my entire thesis chapter in the peer reviewed journal Wood Science and Technology: Davidson J 1975 Use of Principal Components, Factor Analysis and Varimax Rotation to Describe Variability in Wood of Eucalyptus deglupta Blume. Wood Science and Technology 9:275 291.
In deciding which variables are suitable to use in practice, ease of measurement is important. Of the important variables in the first three components, only number of fibres per unit length of traverse (x14 (FIBS)) is relatively easy to measure, albeit requiring a microscope with a travelling stage. Vessel number per unit area x8 (VNO)), another variable readily determined in this species with its large vessels, does not feature prominently in any component. Similarly, fibre length is fairly easy to measure but only appears prominently in the fourth component describing only some 4% of the wood variability. Hence vessel number and fibre length are of little practical use in characterising the wood of E. deglupta. The poor result here for fibre length reinforced my earlier decision to relegate fibre length to a secondary role in selection of superior trees in the tree improvement programme.
The next stage was to investigate whether a new single parameter could be found, which would be easy to measure, and which would adequately describe more than one component. This would simplify the task of describing the variation in the wood of this species.
Before the small wood blocks were used for measuring the parameters described earlier, they had had their density determined by the maximum moisture content method. The next step was to determine how well density as a surrogate for the other variables could by itself characterise the wood sample. This was judged by attempting to fit density into the same four component model already developed.
The density data were distributed normally (determined using program SCREEN). A PCA of all data including density indicated that density could be absorbed into the four component representation without changing its structure. Density strongly identified with components 1 and 3, which in turn represent some 70% of the total variability in the wood of E. deglupta. A weak association was found with component 2, which represents 19% of the variability in the wood. There was only a very weak association with component 4.
As wood density is strongly associated with many of the other wood properties across two of the four components of variation, and whole tree wood density is easily and reliably estimated from a single non destructive pith to bark sample removed at 10% of the tree height, I considered it an excellent single criterion for selection of individual trees with desirable wood properties in a tree improvement programme for E. deglupta
A bridge was built over the Gogol River in 1968 giving easier access the Gogol concession area. The Department purchased outright some land. Baku Forest Station was built near the village of Mawan in late 1969 and later expanded to serve as a research laboratory, nursery and an administration office.
Following my decision to use wood density as the single but highly representative surrogate for a suite of wood properties of importance in pulping and paper making from E. deglupta, and the decision made earlier to sample at 10% of total tree height to provide a representative whole tree density value, sampling of standing trees at Keravat could commence in 1970 with confidence. Samples were required from the breeding population of 150 candidate trees and from the random population (= base population) of 125 trees, a total of 275 trees. The sampling was under the supervision of Alan Williams and took place over much of 1970, alongside the continuing felling of trees for volume table compilation. The wood sample trees were spread through the plantations at Keravat as shown in the following table. Alan surveyed each of the sampled trees by theodolite to a “permanent” reference point, usually one end of an under road culvert on the Kalabus Road (except the 1948 plantation where the trees were surveyed to a corner of the Davidson’s former house). Survey books and a map of the survey lines and locations of the candidate and random population trees were hand carried to Headquarters for safekeeping.
Compartment Year Planted Area (acres/ha)
Growth Plot Numbers Candidate Tree Numbers Random Tree Numbers Station 1948 4/1.6 4 thinning plots 1 5 1 25
Fryar 1 1950/51 10/4.0 YP 2 6
Fryar 7 1952/53 18/7.3 YP 4 7
Fryar 9 1952/53 14/5.7 YP 5 8,9 26 40
Fryar 11 1952/53 23/9.3 YP 6 29 41 50
Fryar 13 1953/54 60/24.3 YP 8 10 22, 35 46 51 75
Fryar 14 1954/55 118/47.8 YP 10 13 23 28, 30 34, 47 113 76 100
Fryar 15 1955/56 56/22.7 YP 14, 15 114 150 101 125
Totals 303/122.7 15 plots 150 trees 125 trees
Stocking and spacing among trees were similar in the compartments involved. Most of the trees were between 14 and 16 years old at the time of selection (140 of 150 candidates, 75 of 125 random trees).
The methodology for choosing the candidate trees on a phenotypic basis for inclusion in a breeding population of 150 superior trees was described earlier. The random population trees were located in groups of five by dividing a map of the compartments into numbered grid squares, and selecting 25 of the squares by consulting random number tables, then finding those locations in the field.
Sampling two of the random population trees at Keravat during 1970. Left: Attaching and leveling the gimbal to point at the pith in as near a level orientation as possible judged by eye and located at 10% of the height of the tree from the ground. Right: Sliding the motor driven mortising chain unit on the paired horizontal bars. The mortising chain was plunged into the tree four times to the full length of the cutter bar while rotating the gimbal a quarter turn after each cut, to produce a sample about 2.5 cm on a side and extending from bark to pith.

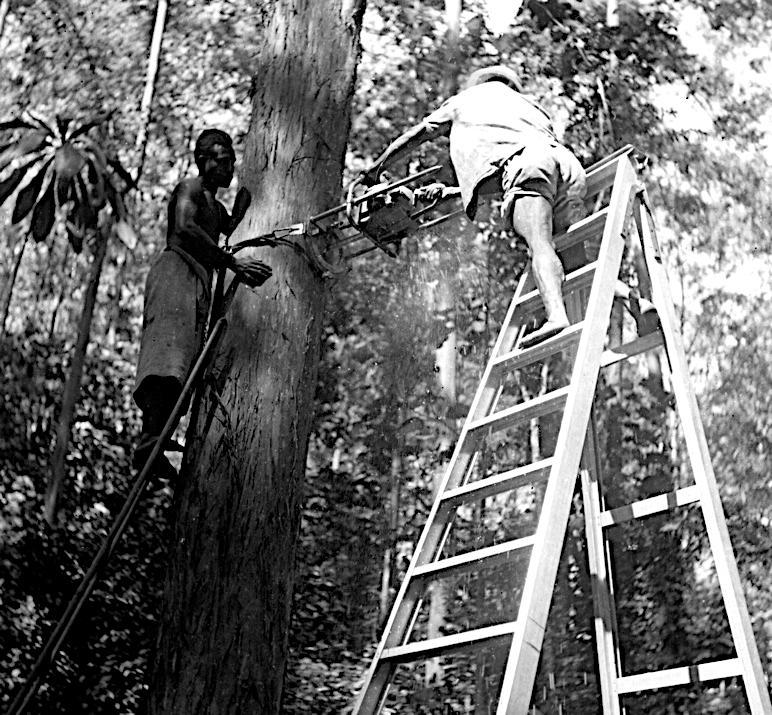
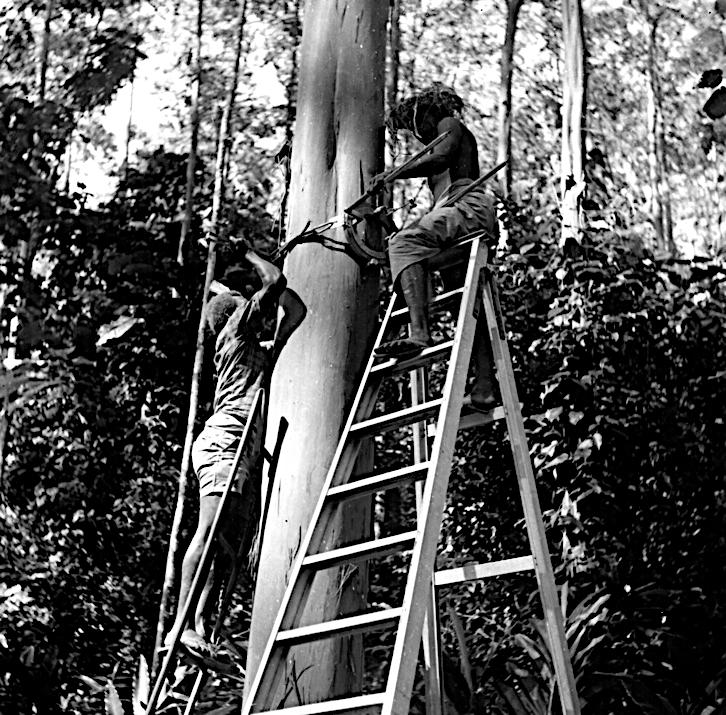
A balsa plug of the same cross section as the removed sample was dipped in a dilute solution of copper oxychloride then coated with grafting mastic before being hammered into the cavity to its full depth. The plug was cut off flush with the surface of the trunk and the wound covered with a generous coat of grafting mastic. Shown at left is a sampling site after six months, almost occluded by new wood growth. The scratch marks in the bark surrounding the sample site were from the attachment and leveling of the gimbal but also were healing. The tree was growing apparently without any ill effects. As far as is known no tree died at Keravat as a result of this wood sampling procedure.
At each field location, five trees were sampled. (Note: These were different sets of five trees to the “five nearest neighbour trees” that were compared next to each candidate earlier for determining their growth advantage.) Candidate trees were selected at a rate of about 1 in 400, random trees at a rate of about 1 in 500 across the seven compartments assessed across most of the Fryar LA.
Samples were periodically airfreighted to the ANU in Canberra for wood density determination.
From the beginning of 1970 in Canberra, attention was directed to growing young plants of E. deglupta under controlled environment conditions.18 The Commonwealth Research Grant provided funds and access to the CSIRO CERES phytotron19 located off Clunies Ross Street in Acton and within easy walking distance from the Department of Forestry ANU.
The CSIRO CERES phytotron was built in 1962, the third major facility of its type in the world. Seen here in 1970 it was associated with the former Division of Plant Industry of CSIRO. CERES is a two storey building, 65 m long and 24 m wide, which still exists today. It had 15 naturally lit north facing glasshouses each 14 m2 in area. In each glasshouse day and night temperature could be closely controlled. In addition there were portable cabinets in which plants could be grown under even more closely controlled conditions. Some of these cabinets (“C” type cabinets) could be used inside the glasshouses as required. The building contained offices, preparation rooms, an engineering room, a workshop, dark rooms, and a "frost" room. There were strict quarantine procedures for the entry of personnel, equipment and biological materials.

Professor Pryor in December 1968, after his return from the Philippines, grew seedlings from seed collected near Goroka and Ossima, PNG and from New Bataan, Mindanao, Philippines in the Department of Botany ANU glasshouse. Both the Goroka and Ossima examples had shorter and broader leaves with less pronounced drip tips compared to the Mindanao specimen, which had longer and narrower leaves with very pronounced drip tips. This trend in the seedlings mirrored what was observed in the adult foliage in the field. I used the phytotron facilities to expand on this result.
18 See Chapter 8, pages 156 174 In Davidson J 1972 loc. cit.
19 CERES = Controlled Environment RESearch. See Morse R N and Evans L T 1962 Design and development of CERES an Australian Phytotron. Journal of Agricultural Engineering Research, 7:128 140. Dr L T Evans and the phytotron staff were thanked for the provision of the controlled environment facilities across two years during my PhD studies, and for the care of the plants including routine watering and fertilizing in my extended absences from the phytotron while working in the nearby Forestry Department, ANU.
Specimens of seedlings grown from seed collected in three localities that were raised by Professor Pryor in the glasshouse of the Department of Botany, ANU in November 1968. Left: Goroka PNG, Middle: Ossima PNG, Right: New Bataan, Mindanao, Philippines. (My photographs of dried specimens in the Gauba Herbarium, Department of Botany, ANU, 1970.)


Firstly, geographic (provenance) variation was investigated by using seedlings, of undetermined genetic origin, grown from seed collected from several localities over the natural range of E. deglupta and grown under a number of controlled temperature regimes across several of the naturally lit glasshouses.20 Secondly, half sib seedlings and clonal cuttings were used to separate the observed variation among plants into genetic and environmental components. The controlled environment facility of the phytotron, using suitably identified genetic material, could be employed to study genotypic variation and genotype x environment interactions with minimum replication using controlled temperature and day length treatments applied in “C” type cabinets.
Experimental methods for growing plants of E. deglupta in the phytotron
The experimental techniques used were common to more than one experiment.21 Five temperature regimes were used in the open glasshouses, selected from among the standard ranges that each of the 15 glasshouses was set at: 21/16, 24/19, 27/22, 30/24 and 33/28 °C.22Relative humidity was not controlled but remained above 40% in all glasshouses.
20 The naturally lit glasshouses used had their photoperiod set at a constant 16 hours of “daylight” (4 AM to 8 PM) by using incandescent lamps to supplement the seasonal variation of natural sunlight in Canberra.
21 Chapter 8, pages 156 174 In Davidson J 1972 loc. cit.
22 This convention is used throughout. The day (higher) temperature was held for 8 hours from 8.30 AM to 4.30 PM, the night temperature for the remaining 16 hours. Temperatures were held within ±1.5°C of specification.
Mean air temperatures in the C type cabinets made available were 24/19, 27/22 and 33/28 °C day/night. Day temperatures were controlled within ±0.25°C of specification. The natural daylight part of the daily photoperiod was limited to eight hours by separate automatic lightproof shutters that closed over the cabinet. The “day” photoperiod was extended from eight hours of natural daylight to 12 and 16 hours by incandescent lamps, which came on when the shutters closed. So, there were 3 temperatures x 3 day lengths or 9 “treatments” possible. There was space for up to 24 plants in 13 cm diameter pots in each treatment, up to a total of 216 plants.
Time clock control settings for temperature, daylight and photoperiod light settings were accurate to about ±3 minutes.
Plants were grown in sterilized vermiculite and watered with tap water in the morning and a standard Hoagland’s solution in the afternoon. In the 33/28 °C regimes, additional water was applied at mid day.
A number of variables was measured on each plant (seedling or cutting):
28.* Total number of nodes produced (TNODES)
29. Density of stem wood in the internode above the marked node (gms/cc) (DENSN)
30. Basal stem diameter under bark at harvest (cm) (DIAMB)
31. Density of the wood at the base of the stem (gms/cc) (DENSB) 32. Rate of elongation of the internode above the marked node (that is where the density sample for 29 was obtained) (cms/week) (RELONG) 33. Rate of total height growth (cms/wk) (RTHT) 34. Branch oven dry weight at harvest (gms) (BRWT) 35. Mean oven dry weight of the two leaves at the marked node at harvest (gms) (LEAF) 36. Stem oven dry weight at harvest (gms) (STWT) 37. Mean leaf area of the two leaves at the marked node at harvest (square inches) 23(AREA) 38. Mean leaf width of the two leaves at the marked node at harvest (cms) (WIDTH) 39. Mean length of the two leaves at the marked node at harvest (cms) (LENGTH) 40. Rate of diameter growth at the base of the stem (cms/week) (RTDIA) 41. Rate of diameter growth at the internode above the marked node (that is where the density sample for 29 was obtained (cms/week) (RTDIAN) 42. Total height of plant at time of harvest (cms) (TOTHT)
* The numbers opposite each parameter were used for reference to the parameter as a subscript of an x variable; for example x28 referred to total number of nodes produced. The capital letters at the end of the description of each variable were used as abbreviations for the variables in computer program coding. 23 Leaf outlines were traced, and the area of the trace measured with a planimeter available at the time, which was calibrated in the British Imperial System. The results later were converted to metric.
For the experiment in the phytotron, where at first space was limited, five provenances from extremes of the natural range were sampled: two areas in Mindanao, Philippines, one in New Britain, PNG, one from mainland PNG lowland and one from mainland PNG highland.24The seed from Mindanao was collected by the Larsen Cameron field trip and had recently become available from the Forestry and Timber Bureau Tree Seed Centre in Canberra.
In a preliminary experiment, eight seedlings from each of the five provenances were grown in a C type cabinet for 108 days at 27/22 °C and 12 hour daylength. Measurements were made in each of the final five weeks and at harvesting. The results were investigated using PCA and FA to determine the main components of variation among the provenances when grown at a specific temperature daylength regime.
Provenance ranking in descending order based on average whole seedling dry biomass harvested above the surface of the growing medium was New Britain (Keravat), Mindanao (Caliwan River), Mindanao (Milbuk), Mainland PNG lowland (Raba Raba) and Mainland PNG highland (Kundiawa).
PCA and FA were carried out on the correlation matrix of all the variables listed above (Nos 28 42). The cumulative percentage of eigen values indicated that 82% of the total variation across the 15 variables measured on the seedlings could be described by four components (45.7, 21.5, 8.1 and 6.7% respectively). The two density values, weight of stem and branches, rate of diameter growth of the node from where one of the density samples was taken and seedling size (basal diameter and total height) were correlated with the first component. Leaf length, width and area were very highly correlated with the second component. Number of nodes produced and their rate of elongation featured in the third component. Rate of height and basal diameter growth were prominent in the fourth component.25 These results mean that while whole stem density is strongly associated with seedling height and basal diameter at any fixed point in time, whole stem density varies relatively independently of the rate of growth of the seedling over time. Put another way, one could simultaneously set both a size and a particular density goal and separately select the individual(s) that grow to that goal at the fastest rate (that is under the shortest rotation, if the analogy is extended to full size plantation trees).
24 See Chapter 9, pages 175 189 In Davidson J 1972 loc. cit.
25 See Table 9.5, page 185 In Davidson J 1972 loc. cit.
In a second experiment conducted after more space became available in the phytotron, the five provenances were grown in C type cabinets at three temperature regimes (21/16, 27/22 and 33/28 °C) and three day lengths (8, 12 and 16 hours) per temperature regime. Eight seedlings were assigned to each temperature photoperiod cell: temperatures x photoperiods x provenances x replicates = total seedlings 3 3 5 8 360 The plants were grown for 108 days and measurements undertaken as in the preliminary experiment.
Provenance ranking remained the same as before for growth rate. Growth rate of all provenances increased with both increasing temperature and longer day length. An analysis of variance revealed there was no difference for seedling woody tissue density among the five provenances (not significant at the 5% level when the among provenances mean square, with only four degrees of freedom, was tested against an error mean square derived from the sum of all the mean squares containing a replication component).26Despite the limitations of this study I felt confident that any wood density work done on the Keravat provenance could be applied to E. deglupta over most of its natural range.
The Faculty of Science ANU, not wanting to set a precedent for PhD students, grudgingly granted me up to three months leave of absence from Canberra for fieldwork on E. deglupta to be undertaken at Keravat. One of the official conditions was that Kevin White was appointed my interim PhD supervisor for the period. Since the Public Service Commissioner had granted me continuity of service while I was in Canberra, an automatic promotion to Forest Officer Class 2 had taken place on 6 August 197027 , and my Scholarship was topped up to that level by the Department of Forests for the 74 days I spent at Keravat 21 October 1970 3 January 1971. I was billeted with Heather and Terry Duggan.
One of the first field visits I wanted to make in Keravat was to the cuttings plantation at Vudal. The remainder of my time would be spent with the wood sampling crew, seed collection from selected trees using the rifle and supervision of felling operations for thinning trials and collection of data for volume and yield tables. An assessment was made of the fertilizer trial at age two years.
26 Table 8.3, page 174 In Davidson J 1972 loc. cit.
27 See page 3, Papua New Guinea Gazette No. 44 of 6 August 1970. Because I was out of the country, the Forest Officer Class 2 post was held against a vacant Position No. R.76 in Goroka, which listed duties as: “Assist in direction of forestry extension work. Control timber permits and licences within the area. Carry out special investigations, surveys, etc. Prepare detailed reports. Train subordinate staff.”! According to this same Gazette (on page 4), Rod Holesgrove was promoted at Bulolo on the same day.
Keravat from the air, on descent into Rabaul, 22 October 1970. 1. E. deglupta plantations in which random, candidate and breeding population trees had been selected, 2. Tectona grandis (Teak) plantations, 3. Early examples of encroachment into the plantation areas by squatters for food garden cultivation, 4. Keravat River.

During my visit the remaining trees out of the total of 275 random and candidate trees were sampled for wood density study. The bark to pith samples were packed and airfreighted to Canberra and released to the care of the Forestry Department ANU after fumigation with methyl bromide by Quarantine Officials. Checking for seed on the candidate trees was a regular task. Capsule laden branches when found were shot down, the capsules stripped and dried in the sun to release the seed. Seed of individual trees was kept separate, labelled, sealed in test tubes and stored in the Keravat Forest Office refrigerator. Ten grams of each of twenty of the half sib seedlots was weighed out and kept separate to take to Canberra for use in experiments in the phytotron.
In the fertilizer trial the best growth over the unfertilized control was from the application of rock phosphorus equivalent to 100 kg elemental phosphorus per hectare. This rock phosphorus treatment was better than the same amount of elemental phosphorus applied as superphosphate or triple superphosphate and better than the application of any of the several rates of application of NPK fertilizer possibly because it was less subject to leaching out of reach of the roots in this porous soil.
E. deglupta clonal cuttings plantation at Vudal in October 1970, age 2 years and 10 months. Though planted at 2.5 x 2.5 m spacing, survival here was high (over 95%). Despite early crown closure, there had been very little self thinning so far. There was high apical dominance and trunks were generally straight and cylindrical. Crown architecture seemed deeper and denser than would have been expected on trees of the same age grown from routine seedling stock. The dense crowns had already taken control of the site and there were few weeds underneath. The cuttings were from 30 unselected sapling ortets. Ramets of a particular clone were kept together in a row, but the number of ramets per clone varied across the site. Clones were not separately identified in the field, however the best individual trees at this time were more than 15 m in height and 14 cm in diameter at breast height.

Patch grafted tree in the trial seed orchard, Keravat, late 1970, just over two years from grafting. Decapitation of the main stem about 5 ft (1.5 m) above the ground (about shoulder height on the officer here) at year one set back growth by about a year, but, as this photograph shows, a single main leader had been reestablished and rapid height growth had started up again in the second year. (Scale was marked in feet, 1 ft = about 0.3 m.)

The criteria for selection of species for reforesting areas of tropical lowlands rainforest that had been clear felled were numerous because in any large project area such as at Gogol different sites were likely to be involved, such as lowland terraces, hills and swamps, and a clear goal had to be formulated around the probable use of at least the first generation of the plantation forest.
Norm Endacott had just listed certain specifications that should be met by prospective plantation species28 , including fast growth, tolerance to variable site quality, readily available seed supply and adaptability with respect to genetic improvement. In PNG, beyond silvicultural aspects of selection, and apart from E. deglupta, little attention to date had been paid to specific requirements of the chemical and morphological characteristics of the wood, the results of various pulping processes and the suitability of the pulp for the final end uses in the pulp and paper industry. It was important to consider that E. deglupta might not be the single species that fulfilled all the requirements. Also requiring consideration was the prospect of vulnerability of a monoculture to natural predators and diseases and this alone might lead to selection of a range of species for a particular project area.
One of the main indices of the economic potential of a pulpwood resource managed in perpetuity is the annual yield of chemical pulp per unit area. That is: 10 5 x ΔV x D x Y metric tonnes of oven dry pulp/ha/yr where ΔV = is the volume increment in m3/ha/yr (growth rate), D = basic wood density in kg/m3 and Y = pulp yield (weight of oven dry pulp as a % of weight of oven dry wood).
The unbleached screened yield of chemical pulp for 10 year old E. deglupta at Keravat was about 50%. For a wood density 400 kg/m3 and 50 m3/ha/yr of wood production, the yield would be 10 tonnes of oven dry chemical pulp/ha/yr.
E. deglupta, Anthocephalus cadamba29 and Terminalia brassii were among a small number of species raised in the local nursery and planted on a cleared site near the Baku Station at the end of 1970. Other species with acceptable pulping qualities, singly or in mixtures, that could have been trialled at the time,
28 Endacott N D 1971 Australian Timber Journal 37(4):54 61. 29 Now Leolamarkia cadamba (Roxb.) Bosser, though the name Anthocephalus is still widely used.
but were not, were Acacia auriculiformis, Albizzia falcataria, 30 E. robusta, E. brassiana, E. pellita, E. “decaisneana” and Gmelina arborea. Seeds of Acacia crassicarpa and A. mangium were available at the time but local nursery personnel at Baku were unfamiliar with the specific techniques required for dormancy breaking, pre germination treatment and optimum germination conditions for these acacia species.
Blocks were not replicated. The site adjacent to the Gogol River had been felled, bunked and burned prior to planting.
On 13 January 1971, the then Head of the Department of Forests, D H McIntosh, in a letter to the Secretary, Australian Forestry Council, nominated me as the PNG representative on Research Working Group No. 1 Forest Genetics.31
Back in Canberra, from January 1971, the wood samples from Keravat were run through the x ray density process over a period of several months, interspersed with the work in the CSIRO phytotron.
Up until this time considerable variation in wood density and other parameters had been shown to be present in E. deglupta. This variation was evident among trees and among geographic races/areas. However, such phenotypic variation was not proof of genotypic variation.32 Properly designed and analysed clonal and seedling progeny tests were needed to reliably determine the genotypic component.
30 Now Falcataria moluccana (Miq.) Barneby & J W Grimes, with synonyms Albizia moluccana, Albizia falcata, Albizia falcataria and Paraserianthes falcataria
31 The Australian Forestry Council (AFC) was established in 1965, operated for almost 30 years, and was disbanded in 1994.The Research Working Groups (RWGs) were charged with meeting periodically to develop and send recommendations to the AFC through its Research Priorities and Coordination Committee. Other nominees in the Department’s letter at the time were for: RWG 2 Forest Mensuration and Management D Num (to replace E T Hammermaster and E D Shield); RWG 3 Soils and Nutrition J E N Smith (no change); RWG 4 Native Forest Management K J White (no change); RWG 5 Plantation Silviculture K J White (no change); RWG 7 Forest Health Dr D Shaw (Department of Agriculture, Stock and Fisheries, to continue to represent the Department of Forests); RWG 8 Forest Entomology B Gray (no change). There were no nominees at that time for RWGs 6 Forest Fire and 9 Forest Products. Formal PNG participation in the Australian RWGs ended at Independence in September 1975, however F Arenz attended the RWG 1 Fifth Meeting of Representatives in Canberra and Tumut 16 to 20 August 1976 as an “Observer” representing the Department of Forests PNG.
32 Zobel B J 1964 Breeding for wood properties in forest trees. Unasylva 18(2/3):89 103.
Therefore, from January 1971 studies continued in the phytotron to examine further environmental variation in wood density but only to the extent required to estimate heritabilities.
Two separate experiments were conducted to obtain observational components of variance within and among clonal cuttings and within and among half sib seedlings that could be used for the estimation of heritabilities.33
In the first experiment ten clones of E. deglupta, raised as cuttings, were grown in C type cabinets. There were three temperature regimes; 21/16, 27/22 and 33/28 °C, three daylengths; 8, 12 and 16 hours and five replications per temperature daylength cell.
temperatures x photoperiods x clones x replications = total plants 3 3 10 5 450
Length of the experiment was 108 days. This was the maximum time this experiment could be allowed to run because, unlike the usual plants like wheat, oats and barley being grown in the phytotron by agricultural scientists, E. deglupta quickly grew tall enough to touch the top of the cabinet and foul the shutter closing mechanism, as well as damaging the growing tip of the plants.
In the second experiment, which followed on after the first, because of the limited space available in the phytotron,34twenty half sib35families were grown in the phytotron glasshouses at five temperatures; 21/16, 24/19, 27/22, 30/25 and 33/28 °C. There were five replications per family in each temperature regime.
temperatures x families x replications = total seedlings 5 20 5 500
Length of this second experiment was 128 days. Vertical space available was greater in the glasshouse allowing an additional 20 days of growth, but still limited, especially under the lower part of the sloping glasshouse roof. All the plants had to be harvested simultaneously in all five glasshouses when the tallest was almost touching the roof in the 33/28 °C glasshouse.
33 See Chapters 10 and 11, pages 190 204 in Davidson J 1972 loc. cit.
34 Usually, the most demand on space was in the 21/16, 24/19, 27/22 °C glasshouses by scientists working on Australian agricultural crop species. It was easier to find space in the more “tropical” glasshouses (30/25 and 33/28 °C) to grow E. deglupta, but the wider range in temperatures extending into the cooler glasshouses was required to force a more marked environmental response in this tropical eucalypt. 35 It was necessary to assume the half sib genetic relationship among the open pollinated progenies of E. deglupta At the time I had no hard data to demonstrate the proportion of selfs and half sibs in a seedlot from a particular parent. I considered E. deglupta to be largely outcrossing and pollinated by insects and birds, but effective distances travelled by these vectors were unknown. Even though individual trees were closely spaced in a plantation it was unlikely that the sticky, clumped pollen could be wind borne across a sufficient distance to reach a neighbouring tree. Natural self pollination was probably rare, since I was unable to artificially induce selfing, as explained elsewhere. There was unlikely to be any neighbourhood inbreeding effect in the plantation stands grown at Keravat from seedlots containing a mixture from usually several unrelated parents themselves already growing in a plantation situation. Differences in pollen production, viability and flowering time may have affected the number of male parents contributing to a seedlot collected from a particular female parent.
In the first experiment, difference in woody tissue density among clones was significant at the 1% level of probability. There was a pronounced clone x temperature interaction effect (significant at the 5% level).
In the second experiment, there was a significant difference (at the 1% level) in woody tissue density among families. An interaction effect of temperature x family was significant at the 5% level of probability.
There was sufficient information available from this pair of experiments to determine the degree of genetic control of wood density in E. deglupta, at least in young plants.
Of important note was the significant (at the 5% level of probability) genotype (vegetatively propagated clones or families of half sib seedlings) x environment (different day/night temperature regimes) interaction. This indicated a specific difference in environment (temperature) had different effects on different genotypes (clones or families). When these results are extended to where large changes in environment are involved, such as among markedly different habitats or planting locations, the genotype x environment interaction component may considerably influence the average genotypic response and should be regarded as part of the environmental variance. If favourable, this type of variance would be extremely useful in plantation forestry with E. deglupta since a desirable genotype (or preferably several desirable genotypes) for a particular planting area could then be utilised by vegetative propagation by cuttings (“clonal forestry”).
Heritability of wood density in E. deglupta
The theoretical basis and estimation of heritability of wood density is covered in my PhD thesis.36From the first experiment using clonal cuttings described earlier, the resemblance among clones was estimated by partitioning the observed components of variance corresponding to the grouping of plants into clones.
Broad sense heritability for woody tissue in the E. deglupta clones grown in the phytotron was found to be 0.68 with a standard error of 0.17.37
36 Chapter 11, pages 197 204 In Davidson J 1972 loc. cit. Heritability measures the proportion of phenotype variability that can be attributed to genetic variation and is expressed as a decimal fraction, that is a value between 0 (genes make no contribution at all to phenotypic individual differences) and 1 (genes are the sole reason for phenotypic individual differences) An estimate of heritability is specific to a particular population in a particular environment. The heritability value is not the same as saying that this fraction of an individual phenotype (what one sees in the field) is caused by genetics. Standard errors for the heritability estimates were calculated using a computer program developed by a then PhD student colleague, Ken Eldridge. See: Eldridge K G 1969 Altitudinal variation in Eucalyptus regnans A thesis submitted in partial fulfilment of the requirements for the Degree of Doctor of Philosophy in the Australian National University, Canberra.
37 Broad sense heritability is the ratio of total genetic variance to total phenotypic variance.
The second experiment using half sibs (progenies having one common parent) was used to calculate narrow sense heritability.38 Narrow sense heritability for woody tissue in the E. deglupta half sib families grown in the phytotron was found to be 0.44 with a standard error of 0.23. Therefore, wood density in E. deglupta appeared sufficiently heritable to enable its manipulation by selection. However, these small experiments using young seedlings and juvenile clones could only be used as a guide.
Heritability is a parameter arising from a particular experiment, applicable only for the specific environmental conditions and to the specific population from which the sample of parents is drawn. The precision of the heritability estimate is strongly influenced by the sample variance. A greater number of cloned and half sib plants than was used in the experiments described here would be required to improve the precision of the estimate of heritability.
Since vegetative propagation in conjunction with tree selection offered the opportunity to secure a high genetic gain more quickly than by sexual propagation, the relatively high broad sense heritability for wood density in E. deglupta, even though based on data from young plants, was particularly encouraging for pursuing a tree improvement programme for this species.
The selection differential is the difference of the random (base) population mean (of 125 trees) and the mean of parents selected for the breeding population (150 trees). As related already, there was a first stage selection based on their measurable appearance in the field. The breeding population had, on average, a 1.44 inch (3.66 cm) diameter at breast height, a 6.7 feet (2.0 m) total height and a 4.9 feet (1.5 m) bole length advantage over the random population. The breeding population trees were much straighter, and had less fluting of the stem cross section. However, mean whole tree wood density was slightly lower in the breeding population trees (down from 0.36 to 0.34 gms/cc). Given that the phenotypic variation in whole tree wood density in the breeding population was more than 20%, this small drop was within the margin for error. More desirable trees had been obtained by the pre selection based on tree size and form (critical wood volume production variables) for only an apparent 1% fall in the mean whole tree wood density.
38 Narrow sense heritability is the ratio of additive genetic variance to the total phenotypic variance.
PCA and FA analyses on the 150 breeding population trees confirmed the results obtained in the original test sample of nine trees; that is that it was possible to select separately for wood density without affecting the production variables.39
Thirty two trees having a whole tree wood density range of 0.36 0.40 gms/cc were selected from the breeding population as “plus trees” destined for the propagation population sub line (in this case a grafted clonal seed orchard and/or a half sib seedling seed orchard). This selection would fulfil the two most desirable attributes of wood density for pulp production from E. deglupta: i) increased uniformity in density among trees, and ii) average wood density towards the higher end of the range found in this age group of this generally low density species.
The 32 trees were identified in the field by adding a third yellow painted ring near breast height. Effort was intensified at Keravat to collect any seed produced by these trees to ensure their inclusion in the propagation population.
Left: “Plus tree” selected at Keravat in Fryar LA. Age 15 years. Diameter at breast height was 45.1 cm. Height 51 m. Whole tree wood density was 0.40 gms/cc (400 kg/m3). Whole tree wood volume was 3.6 m3 under bark. Whole tree wood weight (8% moisture content, under bark) was 1.44 tonnes, and this could produce potentially about 700 kg of air dry chemical pulp. This tree also scored very high for straightness and bole cylindricity.

Right: Three yellow paint rings and a metal number plate on a creosoted picket identify this “plus tree” 49.4 cm diameter at breast height. Buttress was less than about 3 feet (about 1 m) in height (Scale is marked in feet (numbered marks) and inches, 1 foot = about 0.3 m.)

Establishment of provenance trials of E. deglupta in Keravat, Dami and Gogol
The first field based provenance trials of E. deglupta were established at Keravat, Dami (near Cape Hoskins) and Gogol (near Madang) during the 1970/71 planting season.
Near Keravat at a site close to the Vudal River Wilelo, Keravat, Mingende, Philippines, Sulawesi and Raba Raba provenances were included in four replications of each, except Mingende (2) and Raba Raba (3).40 The nursery layout was in randomized blocks. The field layout was a balanced lattice. Plots were square, comprising 36 trees at 2.5 x 2.5 m spacing, with the inner 16 trees being assessed. Soils were deep, fine textured and generally well drained volcanic pumice layers and some alluvial material of the same material nearer the river. The site was part of the normal annual planting and was clearfelled and burnt prior to planting. Natural stands of E. deglupta occurred in the area.
At Dami the provenances planted were Wilelo, Keravat, Hagen41, Mingende, Philippines (Caliwan River), Philippines (Milbuk) and Raba Raba. Four replications were established except for Mingende (3) and Raba Raba (3). Design was the same as for Keravat. E. deglupta did not occur at this site previously. Soils were the result of periodic emissions from numerous volcanoes in the area and showed little profile differentiation. Dami experienced a very heavy wet period from November to March with up to 1,000 mm in January. Soil drainage was very poor and waterlogging was experienced during these wet conditions.
At Gogol, only four provenances were raised in the Baku station nursery, Keravat, Hagen, Philippines (Caliwan River) and Philippines (Milbuk). The trial was established in four replications to the same design as for Keravat on a river terrace site adjacent to the Gogol River. Soil was derived from recent fine-grained alluvium and had a heavy clay texture, massive structure and variable drainage. E. deglupta was not found there naturally and the site in Baku Compartment 1 was clearfelled and burnt prior to planting.
Heights of all the trees were measured at the end of the nursery stage and six months after planting. Measures were to be carried out thereafter on a yearly basis.
40 The Keravat, Philippines (Caliwan River and Milbuk) and Raba Raba seedlots were the same as those used in the seedling provenance trial in the CERES phytotron in Canberra. See page 177 In Davidson J 1972 loc. cit, for detailed descriptions. Wilelo was a PNG batch No. 325 collected near Wilelo, New Britain in March 1970, Mingende was a combined seedlot of PNG batches Nos 206, 207, 208 and 209 from natural highlands populations occurring at about 2,500 m elevation, Sulawesi (PNG Batch No. 265, CSIRO batch No. S9313) was from the Larsen/Cameron 1969 collection on the bank of the Tampak River upstream of Tampak Village about 28 km south of Palopo.
41 “Hagen” (PNG batch No. 301, CSIRO batch No. S8861) was a land race originating from Keravat or Warangoi, East New Britain.
Heartwood decay had been reported in plantations of E. deglupta in Papua and New Guinea, Solomon Islands and Fiji since the early 1960s. In young trees a distinction has to be made between the colour change at the beginning of normal heartwood formation and change in colour caused by wood rot fungi. For technical assessment and economic considerations, the actual stage of the rot damage is of greatest interest. Four decay types were recognized by their appearance and hardness in the wood of E. deglupta: stained sound wood, sound dark rot, soft dark rot and soft light rot. A rot was considered sound if pressure from a blunt instrument such as a ballpoint pen would make no impression or the same impression in the decayed wood on the end grain surface as in the corresponding sound non decayed wood. The rot was termed soft if the instrument could be pushed into the decayed area to a greater depth than into the sound wood. Dark and light rots were distinguished subjectively by colour.

It was possible to re examine positive prints of the x rays of the random and candidate trees and interpret them for decay type as in the example illustrated below.
Top: Positive photographic print of an x ray of a bark to pith sample of one tree of E. deglupta. The sample is in three parts with the pith near the right hand end of the bottom image. Below: The interpretation of the image reveals that only the patches of soft dark rot and light coloured soft rot were relatively transparent to x rays, that is they were of a lower density than the sound wood.

A standard for the various degrees of decayed wood could be developed from the density as determined by x ray densitometry. A marked loss in weight per unit volume of wood occurred only in the soft rots (see table below).

A COMPARISON OF THE VISUAL DECAY TYPES AND WOOD DENSITY DETERMINED BY X RAY DENSITOMETRY+
Visual decay type* No. of samples Range of density (gms/cc) Mean density (gms/cc)
Sound wood 150 0.36 0.70 0.45
Stained sound wood 150 0.28 0.51 0.44
Sound dark coloured rot 44 0.29 0.45 0.36
Soft dark coloured rot 10 0.22 0.30 0.25
Soft light coloured rot 6 0.21 0.28 0.27
+ The apparatus was calibrated for wood moisture content of 8% (approximately air dry under laboratory conditions in Canberra).
* Samples were taken from the same incremental position in different trees. Samples were also subjected to chemical analyses for lignin, extractives and crude yield. Lignin and extractives increased substantially with a consequent fall in “crude yield”. A routine pulpwood consignment would not consist of segregated decay types as examined above. Typically, it might consist of a mixture of decayed and sound wood therefore some mixtures were also examined (see table below).
CHANGES1 IN VOLUME WEIGHT, LIGNIN AND EXTRACTIVES CONTENT, CRUDE YIELD AND WOOD CONSUMPTION WHEN WOOD OF E. DEGLUPTA OF VARIOUS DECAY TYPES AND ADMIXTURES OF DECAYED WOOD WITH SOUND WOOD ARE COMPARED WITH SOUND WOOD ALONE
The mixtures of sound wood with 10% stained wood, 5% soft dark rot and 3% soft light rot respectively had little effect on crude yield or wood consumption whereas 30% of mixed decay types did. This indicated that the typical amount of decay present in a large part of the pulpwood supply would have only a minor effect on the economics of production, at least for the Keravat plantations represented by these sample trees.42The 32 plus trees of the density sub line selected for the propagation population were free of decay.
Staff and postgraduate students Department of Forestry ANU in 1970 71. Standing on the far left is Dr Bill Heather my PhD supervisor, I am standing 11th from the left and still working with Mike Slee, standing 8th from the left, as a demonstrator in the fourth year Wood Science and Technology weekly practical class. Standing 9th from the left is Dave Lamb who later took up a post in research in PNG from 1972 to1977.

In the letter from the Department of Forests dated 9 September 1968 over the signature of K J White, Chief Division of Silviculture, supporting my application for the PhD Scholarship, it was pointed out that “it is essential that work continues on the volume tables and productivity investigations.” Therefore I had monitored that work from Canberra from 1969 to 1971 and at Keravat during my field visit in late 1970.
In deriving tree volume tables there are two approaches. One is to derive a single general volume table for a species for application to all situations of stand origin, age and size, site factors, and silvicultural and management regimes, while accepting any deviation that may occur from the true volume in any particular situation. A second method is to derive separate volume tables to be applied to the specific situations of site, stand origin and so on, in order to obtain volume regressions of “better fit”. Priority
42 See additional results In Davidson J 1973 Decayed wood in living trees of Eucalyptus deglupta Blume. Presented at a meeting of IUFRO Division 5, Working Party S5.01.9, Cape Town, South Africa 24 28 September 1973. (Pages 208 224 in the Proceedings.) This paper was also referred to later by Dun D and Fenton R T 1974 Some Aspects of Reforestation in Papua New Guinea Report on Project Results, Conclusions and Recommendations. UNDP/FAO Project Report FO:PAP/73/007 April 1974, FAO, Rome.
was given to the first approach that was to derive a general volume table for E. deglupta to be applied to stands of trees rather than to individuals.
By this time 200 trees had been felled across several age classes at Keravat. The total height, and over bark and under bark diameters at 10 cm and 50 cm height above ground, breast height (1.3 m), 2 m above ground then at one metre intervals along the stem to the tip. Heights from 10 cm above ground (stump height) to each of 5, 10 and 15 cm diameter small end under bark were also measured. Alan Williams working in the office at Keravat derived the total volume and volumes to each of the small end diameters of all the trees by a graphical method on large sheets of millimeter graph paper using the metric system.
The computing services of the ANU were used on the data. While I was at ANU, data were also sent to Dr Howard Wright, Commonwealth Forestry Institute (CFI), Oxford, UK who provided without charge computer computation, interpretation and compilation of one of the sets of volume tables. Complicating this project was that the ANU worked with the metric system, while the data coming in from PNG were in imperial units from the growth plots and metric from the research section at Keravat. The imperial data had to be converted to metric in Canberra for use at the ANU. However as the CFI was working in imperial units Dr Wright was sent both original imperial data where it already existed plus data from Keravat that were converted from metric to imperial units before dispatch.43As well as the primary variables of volume (V) in cubic feet, diameter at breast height (D) in inches and height (H) in feet, various functions and ratios of these variables such as D2, 1/D, 1/D2, Log (V), DH, D2H, V/D2H, 1/DH, 1/D2H, H/D2, H/D and Log (H) were derived to provide additional variables for testing in form factor and volume regression analyses.
The metric data set was transformed at the ANU using a Fortran program to also create an equivalent imperial data set, which was sent to Oxford. A preliminary volume table for E. deglupta in imperial units was received in Canberra from Oxford in late 1971. This comprised nine sets of tables giving total volume (V) under bark (UB) and merchantable volume UB to 3 inch, 4 inch, 8 inch and 12 inch diameter44 upper limits for diameter at breast height (D) and total height (H) as variables, and the same for diameter and “predominant height” (Hdom).45
43 On 12 June 1970, the Australian Metric Conversion Act passed by the Australian Parliament was given assent. This Act created the Metric Conversion Board to facilitate the conversion of measurements from imperial to metric. PNG followed the same timeline as Australia over the protracted period of introduction of the metric system across various industries. However, the forest and timber industries took several years to be fully metricated.
44 Metric equivalents were 7.6 cm, 10.2 cm, 20.3 cm and 30.5 cm respectively.
45 Predominant height was defined in PNG at the time as the mean height of the tallest 20 trees per acre. A typical half acre plot was divided into ten parts and the tallest tree in each part was measured. (This was judged equivalent to 50 trees/ha or 10 trees on a 0.2 ha plot.)
In Oxford, for total height (H), 15 regression models were tried for best fit to the data using different variables where V, D and H are as described above, a is the regression constant and b, c and d are regression coefficients. The logarithmic functions are to the base e (natural logarithms ln).
1. V = a + bD
2. V = a + bD + cD2
3. V = a + bD2
4. V = a + bD2H
5. V = a + bD2 + cH + bD2H
6. V = a + bD2 + cDH + bD2H
7. (lnV) = a + b(lnD)
8. (lnV) = a + b(lnD) + c(lnH)
9. V/D2 = a + b/D2 + c/D
10. V/D2 = a + b/D
11. V/D2H = a + b/D2H
12. V/D2H = a + b/D2 + cH/D2 + dH
13. V/D2H = a + b/D2H + cH + d/D2
14. V/D2 = b/D2 + cH/D + dH
15. V/D2H = a + b/D2H + c/H + d/D
The regression model of best fit was chosen by reference to various parameters describing the regression including the lowest Furnivall index and highest multiple correlation coefficient. Regression model number 8 from the list above was best. The resulting equation, based on diameter at breast height over bark (D in inches) and total height (H in feet), was: ln V = 6.298 + 1.6458(lnD) + 1.2368(lnH)
For predominant height (Hdom) the best model was the so-called Shield equation weighted by D2Hdom V = 6.194 + 0.16Hdom + 0.002823D2Hdom 0.001151Hdom 2 0.00000334D2Hdom This equation produces negative volumes for some of the extreme values of D and Hdom because of the very quadratic nature of this regression. However these extreme values were well outside of the range of actual data used and would also be well outside the range of D and Hdom to which the equation would be applied in practice.
The 3 , 4 and 8 inch merchantable volume conversion factors (F) to be applied to reduce total volume to merchantable volume under bark were derived from an exponential function of breast height diameter (D) of the type:
F3,4 or 8 = a + bcD
The values of the regression constant a and regression coefficients b and c to be substituted in the above equation to arrive at each conversion factor were as follows for each of the three smaller merchantable diameter limits:
Merchantable top diameter Constant a Coefficient b Coefficient c
3 inches (7.6 cm) 0.9944 5.0949 0.6476 4 inches (10.2 cm) 0.9923 4.2986 0.5039 8 inches (20.3 cm) 0.9850 7.5477 0.2871
The 12 inch (30.5 cm) diameter factor was derived from a quadratic regression: F12 = 2.1036 + 0.2514D 0.00529D2 for values of D up to 23.0 inches [58.4 cm]. For diameters greater than 23 inches a constant 0.883 could be used as the conversion factor.
Fortran computer programs were written to generate tables of volumes and conversion factors across a range of D, H and Hdom. A stand table was prepared to show the range of data used and it was pointed out that caution should be observed if extrapolating outside that range. Within the range of D from 4 to 24 inches (10.2 cm to 61 cm) and H or Hdom from 40 feet (12.2 m) to 180 feet (55 m) the percentage errors in the mean predicted volume were likely to be small as indicated in the following table.
D (inches) H (feet) Total Height Predominant Height 4 40 1.9% 8 60 2.2% 8 80 0.8% 8 100 1.3% 12 100 1.2% 12 120 0.8% 12 140 1.3% 16 140 1.2% 16 170 2.1% 20 140 1.4% 20 160 1.3% 20 180 2.6% 24 180 1.5% 2.7%
Using the stand volume tables and error estimates given here to determine the volume of individual trees is not appropriate. Values of D, H and Hdom entered in the formulae should be stand mean values derived from measuring a prescribed number of trees in plots to return a stand mean volume result.
I was able to construct graphs of diameter at breast height on age and predominant height on age for 22 growth plots from PNG, four plots from Java, Indonesia46 and results from other countries such as the Solomon Islands and Costa Rica. Using predominant height at age 10 years as a surrogate for site quality, I was able to create four site quality classes from those data.
With the site quality results and a two way volume table to hand it was possible to compute a provisional yield table for E. deglupta for pulpwood production. The Philippines and Indonesia, followed by Brazil, had the most extensive plantations. Yields of 20 40 m3/ha/yr were common in several countries Some major industrial projects were under way in the tropics based, at least in part, on reforestation using this species in fast growing plantations, for short rotations of 10 12 years or less, and a considerable database had been assembled on its performance, for example in the Solomon Islands and Costa Rica.
Despite E. deglupta’s potentially spectacular growth rate and suitability of both its wood and bark for pulp, planting it has been constrained in several countries as initial trial plantations were poorly sited and not appropriately tended to reduce weed competition. It is extremely site sensitive, severely affected by even a small amount of weed competition, very easily damaged by fire and does not coppice. It is susceptible to heartwood decay and to a variety of pests and diseases, especially when growth is retarded on waterlogged sites. Potential pests and diseases have a lesser detrimental impact in short rotations grown for pulp. Good examples of the extreme variation that can be found across sites come from Costa Rica, where 2 4 year old stands had mean annual increments ranging between 2 and nearly 40m3/ha/yr! The maximum yield that had been recorded in Costa Rica was 89 m3/ha/yr over 4.5 years! One plot at Keravat for a time had gained a place in the Guinness Book of Records for containing the world’s fastest growing tree!47
46 Figure 2.6 on page 29 and pages 28 31 In Davidson J 1972 loc. cit.
47 Guinness Book of Records (1975) Twenty second edition 1975. Guinness Superlatives, Enfield, Middlesex, UK.
Paper Industries Corporation of the Philippines (PICOP) at the time had extensive E. deglupta plantations near Bislig Bay in Mindanao. In plantations with an initial stocking of about 625 680 stems/ha an average yield of 25 30 m3/ha/yr (over bark to 10 cm top diameter) was obtained over a ten year rotation (Site Quality Class 2). Much higher yields of 40 60 m3/ha/yr (total volume over bark) could be obtained from higher stocking on above average sites (Site Quality Class 1) in Mindanao (photograph at left).
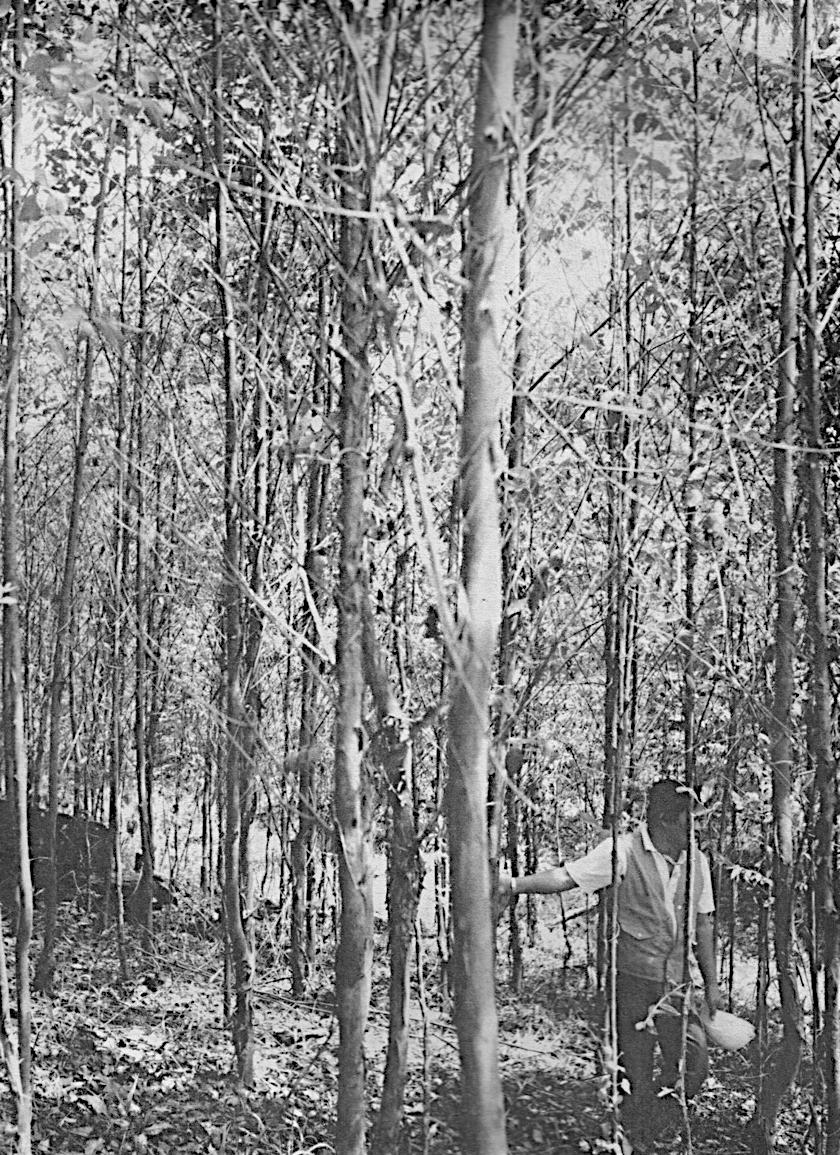
Close spacing with intensive site preparation with E. deglupta in a large scale trial, PICOP, Bislig Bay, Mindanao, Philippines.
DEGLUPTA WOOD YIELD (M3/HA/YR, TOTAL, UNDER BARK)
QUALITY 1
QUALITY 2
QUALITY 3
QUALITY 4
2.5x2.5 4.5x4.5 3x3 2.5x2.5 4.5x4.5 3x3 2.5x2.5 4.5x4.5 3x3 2.5x2.5
493 1111 1600 493 1111 1600 493 1111 1600 493 1111 1600 5 yrs 22.6 51.0 73.4 17.8 40.0 57.6 11.9 26.7 38.4 5.9 13.4 19.2 6 yrs 27.7 62.3 89.8 21.4 48.2 69.4 13.6 30.6 44.0 7.1 16.0 23.0 7 yrs 33.2 74.8 23.6 53.1 76.6 15.3 34.5 49.7 8.2 18.4 26.5 8 yrs 37.5 84.7 25.9 58.4 17.0 38.2 55.0 9.3 20.9 30.0 9 yrs 43.0 28.5 64.2 18.6 42.0 10.4 23.5 33.8 10 yrs 48.2 30.3 19.7 44.5 11.6 26.1 37.6 15 yrs 67.6 38.6 24.7 55.6 14.0 31.5 Ageñ The yield table above reflects the fact that site quality and spacing among trees both have a huge effect on wood production. The 3 x 3 and 2.5 x 2.5 m spacing were being used routinely in experimental trials and were proving feasible in spacing trials in Papua New Guinea, but were not at that time being
employed in new commercial plantations that were still being planted at too wide a spacing to achieve optimum pulpwood production while supressing weedy undergrowth, for example in the Gogol.
Following my query by letter on 17 January 1972 to the Department of Forests on where I would be posted after my return to PNG, a reply dated 21 February was received advising that I would be posted to the “Forest Research Centre at Bulolo”. I had learned from a letter from Dave Lamb dated 7 February 1972 that he also had arrived in Bulolo and had been requested to concentrate on soils and nutrition issues with Kamarere at various sites. He requested information a suitable nutrition solution, glasshouse temperature and provenances for possible glasshouse pot trials. I replied with information on the CERES phytotron work that I had done.
I received news from the Chairman of the Public Service Board that I would receive six months (4 September 1971 to 3 March 1972) backdated study leave on full pay as a result of a change in the rules governing study assistance for PNG public servants.48 Three bound copies of my PhD thesis were submitted to the Registrar’s office at the appointed hour on the appointed day (3 PM 3 March 1972).
The ANU advised that my two thesis examiners would be Dr Ted Hillis49 as the Australian representative and Professor Bruce Zobel50 as the overseas representative. However, I was requested to remain in Canberra while the thesis was examined, after which I would be required to answer in writing any queries raised and to make any alterations or additions to the thesis that might be suggested or required by the examiners. This meant a further unexpected period in Canberra on leave without pay, but still supported by the ANU Scholarship, from 4 March to 4 May 1972. I answered in writing a number of written queries from Professor Zobel, and had a face to face session with Dr Hillis in Canberra. I was not required to make any changes or do any extra work on the thesis. I was able to resume duty in PNG from 5 May 1972.
48 I had applied at the beginning of my PhD studies in 1969 for paid study leave but this was declined then because I had not completed two full terms of 21 months service in PNG, which was then one of the requirements. This constraint was dropped in 1971 and I had reapplied in September 1971 for the maximum period of six months available under the revised rules “for the completion of a period of higher degree study”.
49 Dr William Edwin (Ted) Hillis (1921 2008) was then Chief Research Scientist, Division of Forest Products CSIRO Melbourne. His vision of tree biology, forestry and wood science and technology fields being strongly linked made him supportive of research on wood structure and he always recognized the pivotal role wood structure played in understanding other wood properties. He was awarded the Order of Australia in 2003.
50 Dr Bruce John Zobel (1920 2011) was Professor Emeritus in the Department of Forestry and Environmental Resources at North Carolina State University, USA until he “retired” in 1979. He was recognized as a world authority in his special discipline, the variation of wood properties and their genetic improvement. In his co authored book Zobel B J and Talbert J T 1984 Applied Forest Tree Improvement published by John Wiley & Sons, reference was made to my PhD thesis about the encouraging heritability result for wood density in E. deglupta and to Tropical Forestry Research Note SR2 (1973) on the tree improvement programme for the species in PNG.
The Principal Research Officer, Forest Research Station, Bulolo, in 1972 was Barry Gray. I was designated Head of the Silvicultural Section. Barry was Head of the Entomology Section, Dave Lamb Head of Soils and Nutrition, Jack Simpson Head of Pathology. Office and laboratory accommodation was limited for the newly expanded staff. The Department of Forests temporarily leased a building from Commonwealth New Guinea Timbers in downtown Bulolo for the overflow, since Entomology already fully occupied the existing building. My first task was to write and submit a Bridging Report for Silvicultural Research in the context of a developing Lowlands Reforestation Programme. This was sent to HQ at the end of May 1972. It seems to have remained uncommented on in HQ file 106 7 7 until referred to extensively later during a consultancy mission by Dun and Fenton in 1974.51
The trial grafted seed orchard at Keravat was largely a success, despite a couple of losses through incompatible grafts.
Trial grafted seed orchard at Keravat in 1972, age about four years. Left: Two widely spaced trees in flower. Right: Compatible patch graft union about 30 cm in diameter and 20 cm above the ground on the tree located to the left of the vehicle.
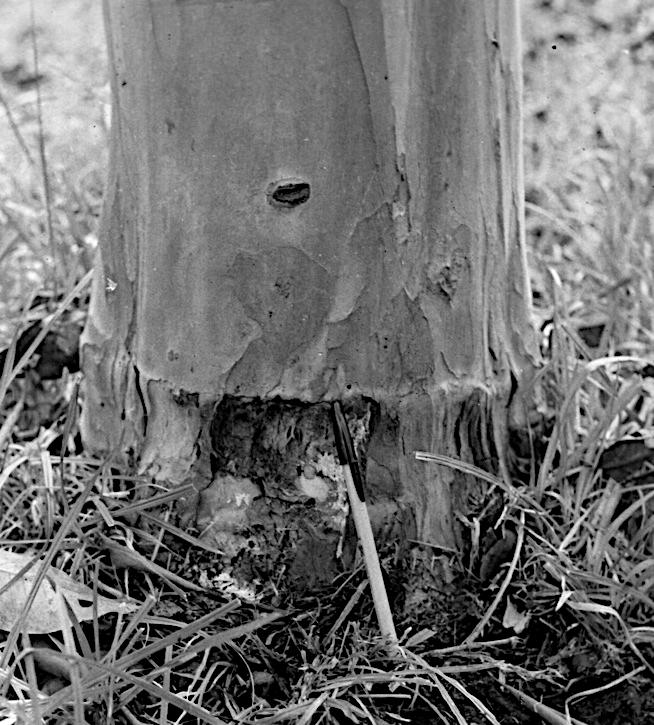
51
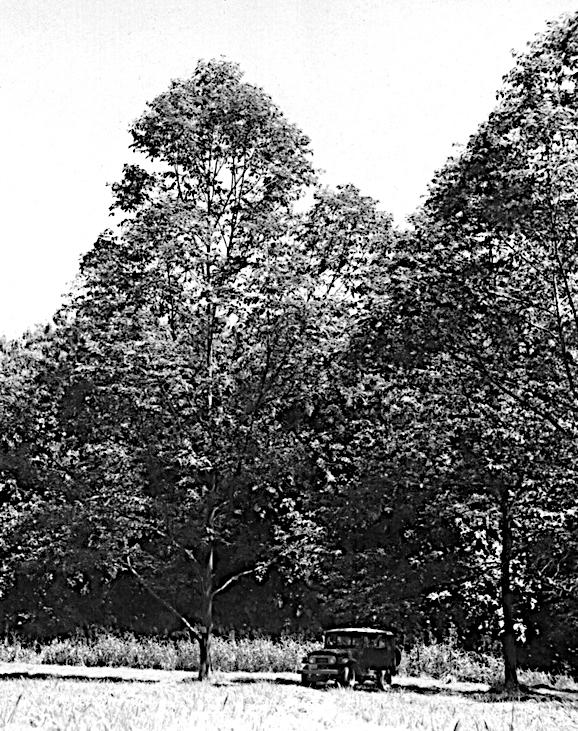
Seedlots of the 32 Keravat trees in the wood density sub line had been received in Bulolo with each tree in a separate batch (half sib seed). Jeff Fairlamb, Research Technical Officer (Silviculture) took charge of these seed lots and proceeded to raise them in separately identified germination trays in a sandy medium that had been fumigated with methyl bromide
Grafting material, which had been shot down from the same 32 trees a few at a time also began to arrive by air cargo, sealed in “Eski” insulated containers. This material was arriving in poor condition, since there was no direct flight from Rabaul to Bulolo. The route was via Lae. While there were daily flights Rabaul to Lae, there were only three flights a week Lae to Bulolo. Cargo was often left sitting on the tarmac or stored in a hangar in Lae waiting for onwards movement to Bulolo. Having someone from Regional Office in Lae meet the flight from Rabaul and try to ensure the Eski was loaded on a connecting Bulolo flight met with little success. Having an officer travel with the grafts as passenger’s luggage from Rabaul through to Bulolo worked once but was impractical and expensive. Often the Bulolo flight left Lae before the Rabaul flight arrived in Lae when the latter was running late.
Left: Scion received from Keravat in poor condition with the tip and some leaves shriveled, but with a couple of leaves, the stem and some included axillary buds healthy. Right: Approach grafting the same scion to a stock plant already established on the seed orchard site at Geshes, Bulolo. Success was too low by this method.
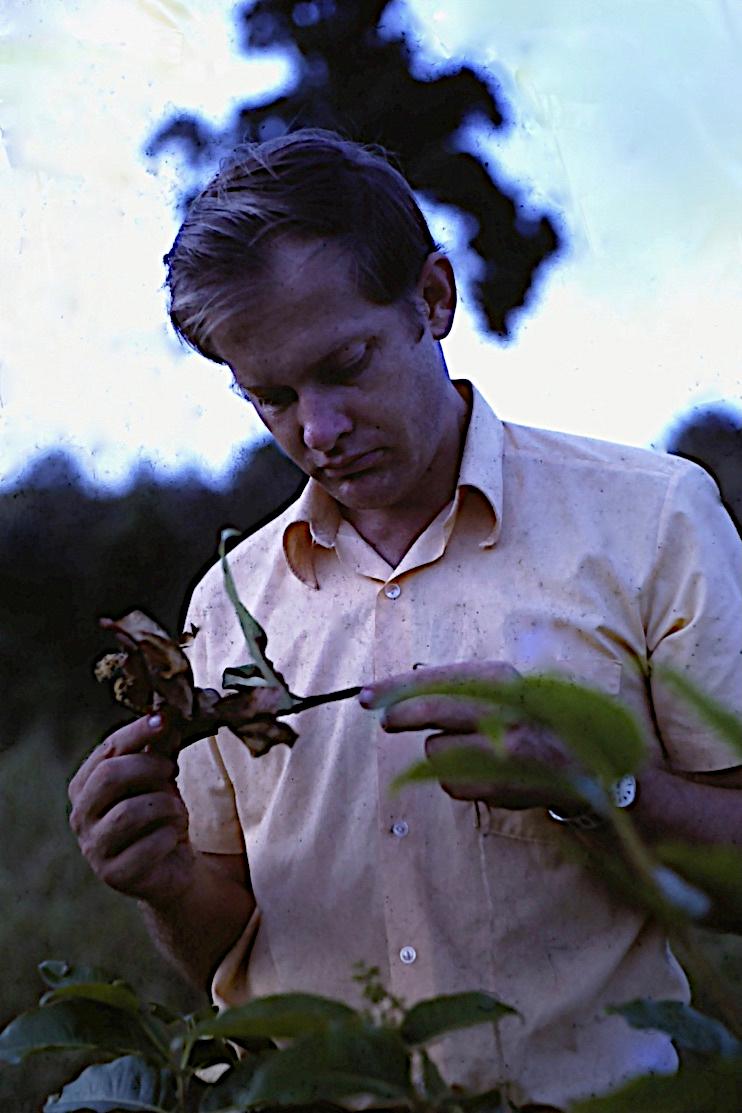
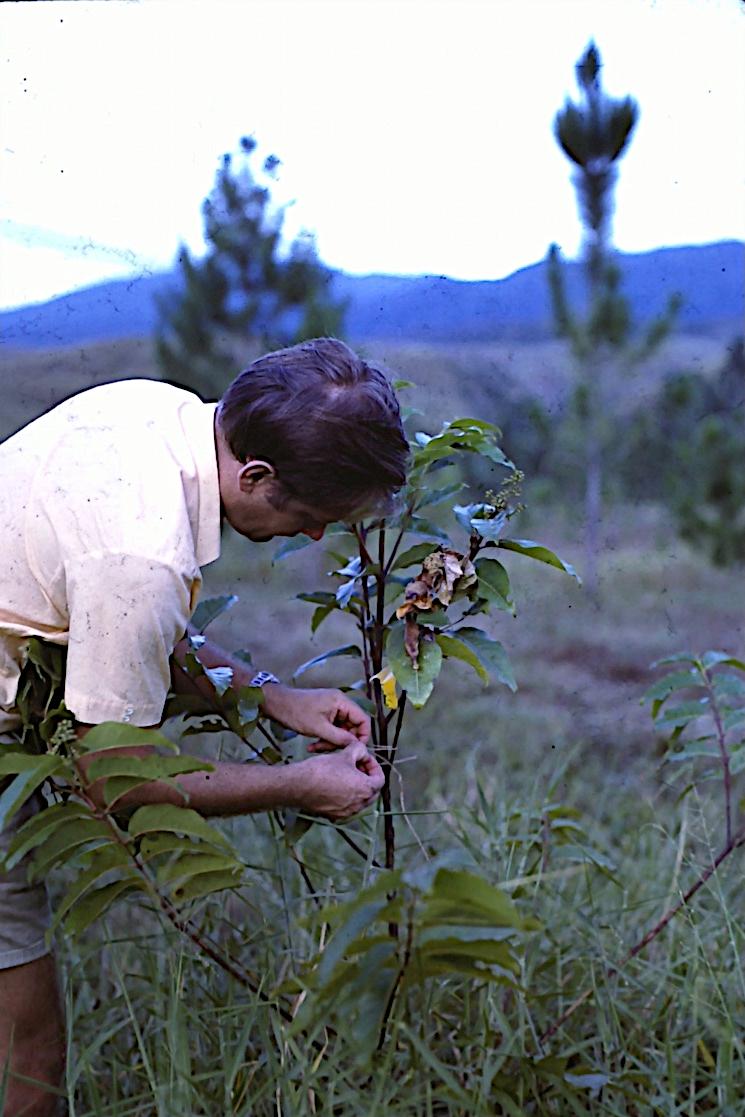
A change in strategy was required. Since the dormant bud regions on the scions received from Keravat seemed to be healthy and surrounded by green tissue even though most of the leaves had turned brown and shrivelled, it was decided to raise stock plants in large plastic bags in the nursery at Bulolo and use patch grafting carried out in the nursery and only plant the successful grafts in the field.
Above: Stock plants raised in large plastic bags in the Bulolo nursery ready for patch grafting scions received by air from Keravat. Right: Plants shown after grafting and the first high decapitation of the stock. Patches low down on the stem were still taped. The next stage was removal of the tape and another decapitation further down to stimulate growth of one or more shoots from the dormant bud(s) in the patch. After the final decapitation and when the shoots had developed sufficiently, the successful grafts were planted in the field in the seed orchard area. Aluminium tags identified the mother trees by number.

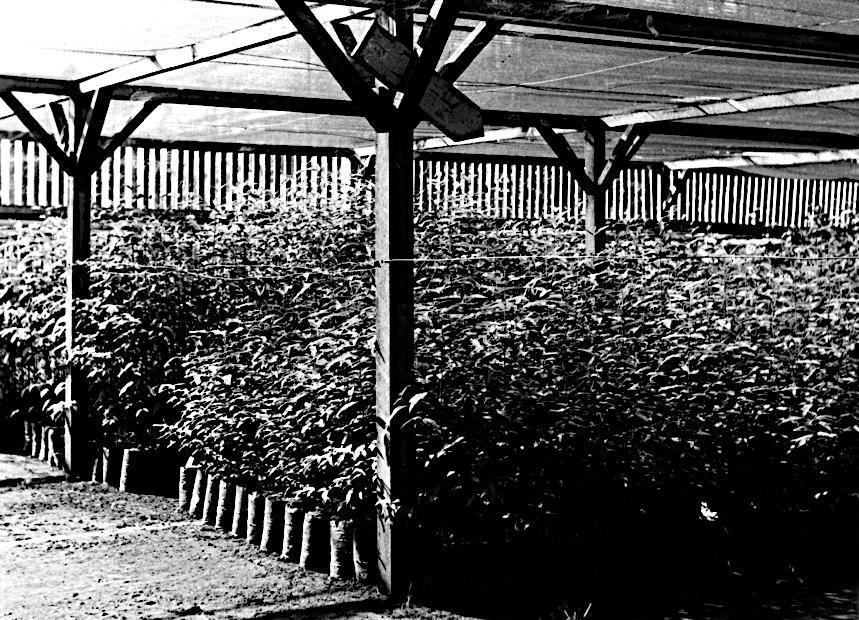
The seed orchard area for E. deglupta at Geshes was divided into two parts, one for grafts and one for the half sib seedlings. Spacing was 12 x 12 m triangular for the grafts and 15 x 15 m triangular for the seedlings. In the seedling seed orchard, four representatives of the same family were planted on the corners of a 0.5 m square situated at each planting location. The reasons for this were:
i) A colleague Ken Eldridge52 had reported reduced height growth of young selfed progenies relative to outcrosses for E. regnans. Although I believed selfing in E. deglupta to be low to non existent, it was prudent to wait as long as possible to allow any inbred, less heterozygous individuals to be placed at a selective disadvantage and fall behind or even die, leaving the remainder with a higher average level of heterozygosis.
52 Eldridge K G 1970 Breeding system of Eucalyptus regnans Proceedings of IUFRO
1.
ii) Seedlings in each family of known female parentage would almost certainly be the result of random mating with nearby male parents of unknown and variable pedigree. To cull very early three out of the four individuals at each planting location leaving only the best was an easy and effective method for early upgrading of the quality of the orchard.


iii) Having four chances to ensure the survival of a representative at the designated spot on the seed orchard grid ensured there were fewer ‘holes’ in the final layout, thus increasing the chance of effective random cross mating which the layout was designed to promote.
Above:
Top: Terminal branchlets of E. torelliana with large, terminal and axillary, corymbose panicles of 3 and 7 flowered umbellasters in bud. Bottom: Branchlet of the hybrid E. torelliana♀ x E. citriodora♂ with axillary, corymbose panicles of 3 flowered umbellasters in bud, with inner calyptra being shed and first flowers opening. 7 flowered umbellasters were rare in the hybrid. Peduncles of the hybrid were much more elongated than those of either species.


I was certain that these were natural genetic hybrids of Eucalyptus torelliana♀ x Eucalyptus citriodora♂53 that had occurred at the location of the seed collection for E. torelliana. When this observation was reported to HQ, a senior officer wrote back dismissing them as “sports”54 of no consequence. There was no further opportunity for observation or debate as most of the mixed eucalypt stand and the hybrids in Heads Hump LA were killed by fire in August 1972.
The availability of pollen from a nearby provenance trial of E. “decaisneana” prompted me to try to produce a hybrid with E. deglupta as the female parent. Some flowers, which had already emerged near ground level on recent grafts of E. deglupta in the Geshes seed orchard, were emasculated, dusted with E. “decaisneana” pollen and bagged with unwoven terylene bags. This first attempt in 1972 was unsuccessful and I did not repeat the experiment, as I did not have sufficient knowledge then about how long the pollen of E. “decaisneana” remained viable.
53 Later reclassified in the new eucalypt genus Corymbia as Corymbia torelliana and Corymbia citriodora respectively

54 In botany a “sport” is a part of a plant that shows morphological (phenotypic as distinct from genotypic) differences from the rest of the plant. Sports may differ by foliage shape, colour of flowers, fruit or branch structure.

With the possibility that I would be able to create hybrids between E. deglupta as the female parent and E. “decaisneana” as the male parent,55 I decided to follow up on the early history of the introduction of the E. decaisneana to PNG at Bulolo.
On 20 April 1970, John Turnbull of the Forest Research Institute, Canberra, despatched four seedlots of E. “decaisneana” to the “Assistant Director, Silviculture, Department of Forests, Konedobu, Papua”.
Seed lot no.* Species Quantity (ounce) Locality Latitude Longitude Altitude (feet) Soil Viable seeds/ounce 9003 (336) Euc. decaisneana 4 Nr. Dili, Port Timor 8° 47’ 125° 25’ 3,600 Schist 14,000 9008 (337) Euc. decaisneana 2 Flores, Indonesia 8° 40’ 122° 30’ 1,400 Fine grained volcanic rock
13,500 9010 (339) Euc. decaisneana 1 Indonesian Timor 9° 37’ 124° 15’ 4,100 Yellow soil, quartz
5,600 9016 (338) Euc. decaisneana 1 Portuguese Timor 8° 39’ 125° 27’ 1,900 Schist 15,000 * 9xxx numbers were Forest Research Institute, Canberra seed lot numbers; numbers in brackets were the assigned Department of Forests PNG seed batch numbers.
These were assigned PNG seed batch numbers at HQ. After some delay, quantities of each of these four batches were received by the Department of Forests, Bulolo, and receipt acknowledged by letter drafted by N H S Howcroft and signed by K J Hart, Acting Officer in Charge on behalf of J L R Godlee. Apparently, Neville Howcroft took charge of the seed intending to establish a provenance trial. He arranged for the sowing of 23 trays from 1 to 11 September 1970. Germination took place from 5 to 17 September. On 16 September a letter was sent to HQ, requesting instructions on the design, area of plots and spacing to be used. Kevin White, then Assistant Director, Silviculture, wrote back 29 September directing the proposal to be reduced to a single planting on a rainforest site, planted in blocks of four rows, one row each provenance. Another exchange took place on 21 October and 30 October about spacing and area to be planted for each provenance. The outcome was for a spacing of 9 x 9 feet (about 2.75 x 2.75 m) and general block planting by provenance after stock had been allocated to the line plots, each of about 20 trees (8 line plots, 2 for each provenance were actually planted).
55 The small fruited E. deglupta was used as the female parent, fertilized by pollen from the large fruited E. “decaisneana”. The other way around, the inheritantly short pollen tube development from the pollen of E. deglupta that is adapted to travel down a relatively short style would probably not be able reach the ovary down the relatively longer style of E. “decaisneana”. An emasculation technique that involved simultaneous decapitation of the upper part of the style of the large fruited eucalypts was developed later.
By the end of October all the seedlings had been tubed. On 14 January 1971, Neville Howcroft submitted a progress report to HQ over Rod Holesgrove’s A/OIC signature, with the following results:
Batch Number and Locality
Surviving tubed stock (number) Mean Minimum Height (cm) Mean Maximum Height (cm)
336 Dili, Portuguese Timor 1,531 1.6 10.6 337 Flores, Indonesia 1,060 0.7 12.7 338 Portuguese Timor 876 0.5 10.1 339 Indonesian Timor 395 1.2 13.7
Neville carried out a study of leaf shapes when the seedlings were 3 6 inches (7.5 15 cm) in height (two leaves per seedling, being the third last whorl). Provenance 336 had the best germination result and was the most vigorous in the germination trays. 336 had predominantly narrow lanceolate and broad lanceolate leaves. Provenances 337 and 338 had mainly narrow lanceolate leaves while provenance 339 had similar leaf shapes to 336. Provenance 338 alone had a high number of leaves described by Neville as “peculiar” in shape, this was “more or less very narrow linear with undulate edges, and sometimes with the lamina interrupted by a gap down to the mid rib”. Most of these “peculiar” seedlings died or were culled before they reached the field. My later interpretation of these unusually shaped leaves was that Provenance 338 might have contained a high proportion of inbred individuals arising from selfed seed. Lignotubers were developing in all batches.

The “peculiar” leaf shapes Neville observed in E. “decaisneana” seemed to me similar to rare individuals I had observed with E. deglupta at Keravat in 1968 (left, compared alongside a normal seedling, shown on the right). This was not pest damage, for example from cutworms consuming all but the central main vein, since the narrow leaf laminae still had all the features of normal leaves in miniature including intact intramarginal veins. This was more likely a genetic mutation of some kind.
The chosen planting area was Nauti LA Compartment 1A off Road 53, near the Watut River. The lines were planted in July 1971, and given an initial measurement by Bob Johns and Toni on 27 July 1971.
Provenance 337 Mean height 41 cm
Provenance 338 Mean height 38 cm
Provenance 339 Mean height 33 cm
Provenance 336 Mean height 29 cm
Planting of the blocks at Bulolo took place from October 1971. The whole planting (the 8 lines of 20 trees each, plus the four blocks) originally occupied about 12.7 acres (about 5 ha).
Meanwhile, Professor Lindsay Pryor made a memorable trip to Portuguese and Indonesian parts of the island of Timor and to the Indonesian island of Flores with John Turnbull and Jerry Cole of the Forestry and Timber Bureau, Canberra in August 1971, primarily to collect botanical specimens of Eucalyptus alba and E. “decaisneana”. With the help of tiny overburdened ponies and Lindsay’s provisioning and catering (sardines for breakfast, lunch and dinner), the party reached peaks nearing 3,000 m above sea level. In addition to the botanical specimens about 20 more seedlots were collected and later distributed to several countries including Papua and New Guinea (see later) where the seed was used in some of the first formal provenance trials of E. “decaisneana”. Botanical material from this trip much later was included in extensive cooperative analyses of the Timor eucalypts and allied species published by Australian scientists in 1993 and 1995.56
Jeff Fairlamb remeasured the line plots on 5 December 1972. They had been severely affected by a lack of weeding and many stems were dead or missing especially near the road (Road 53). Results were:
EUCALYPTUS “DECAISNEANA” PROVENANCES, LINE PLOTS AT ONE YEAR Provenance Mean Height (cm) Survival (%) 338 149 90 337 131 53 336 157 43 339 152 33 It was decided to establish a (temporary) growth plot near the middle of each of the provenance blocks where growth and survival seemed to be better than in the line plots. These were 1 chain by 2 chains with the long dimension along the rows. About 7 rows were included in each of the plots, about 100 potential tree locations per plot.
56 Pinyopusarerk K, Gunn B V, Williams E R and Pryor L D 1993 Comparative geographical variation in seedling morphology of three closely related red mahoganies, Eucalyptus urophylla, E. pellita and E. scias, Australian Journal of Botany 41:23 24 and, Pryor L D, Williams E R and Gunn B V 1995 A morphometric analysis of Eucalyptus urophylla and related taxa with descriptions of two new species, Australian Systematic Botany 8:57 70.
Jeff Fairlamb and John Dalton established and measured these temporary plots on 5 and 6 December 1972. Results were:
EUCALYPTUS “DECAISNEANA” PROVENANCES, RANDOM PLOTS AT ONE YEAR Provenance Mean Height (cm) Survival (%) 338 237 83 336 169 75 337 174 66 339 120 31
Left: E. “decaisneana” provenance trial Bulolo at age about one year. Large trees at rear: Provenance 338; small trees at the front: Provenance 339.

Both sets of results indicated provenance 338 (Portuguese Timor, low altitude) was the best and provenance 339 (Indonesian Timor, high altitude) was the worst, at least at this site. Provenance 338 was the one that early on had a high number of apparently inbred (selfed?) seedlings, so most of these must have died or been culled before reaching the field, leaving the vigorous outcrossed ones to perform well.
A 20 acre (about 8 ha) area of typical lowland rainforest at Baku was subjected to a simulated pulpwood logging in 1972 (photographs next page).
Noticeable features of this site were the large amount of logging slash left on the ground, many potential pulpwood stems left behind in the coupe and a considerable number of living trees and understorey vegetation remaining on the site. What was also noticeable, but the significance of which was overlooked at the time, was a marked rise in the water table after felling most of the trees. This alone was later determined to probably result in a drop of at least two site quality ranks with regard to reforestation with E. deglupta, even before considering adequacy of site preparation before planting.
Matching near vertical aerial photographs of simulated pulpwood logging at Baku in 1972. Top: Natural colour (Kodak Kodachrome 35 mm), Bottom: colour infrared (Kodak Aerochrome III 1443 35mm). The top photograph reveals a considerable number of small logs and slash left on the ground, the bottom photograph shows in red live vegetation remaining, and the damp ground in grey, especially on the snig tracks at the top.


On 8 September 1972, my work on E. deglupta received a boost in recognition with approval and conferring of the award of a PhD in the field of forestry. It was also a reminder that my PhD had not been duplicated and widely distributed yet in PNG as called for by the Public Service Commissioner in granting paid study leave to attend the ANU over the final six months of study.


species
at
at age two years Balsa (Ochroma lagopus) had been grown at Keravat since 1952. From the early 1960s nearly 100 ha of Terminalia brassii had been grown there and done extremely well on wet sites. There were also trial areas of Gmelina arborea and Anthocephalus chinensis (Philippines source). Over 50 species of exotic eucalypts had been introduced to PNG, some with promising results, including E. camaldulensis, E. citriodora, E. grandis, E. robusta, E. saligna and E. torelliana. However, species testing on the challenging sites intended for reforestation at Baku early on was very limited apart from E. deglupta, Anthocephalus sp and T. brassii
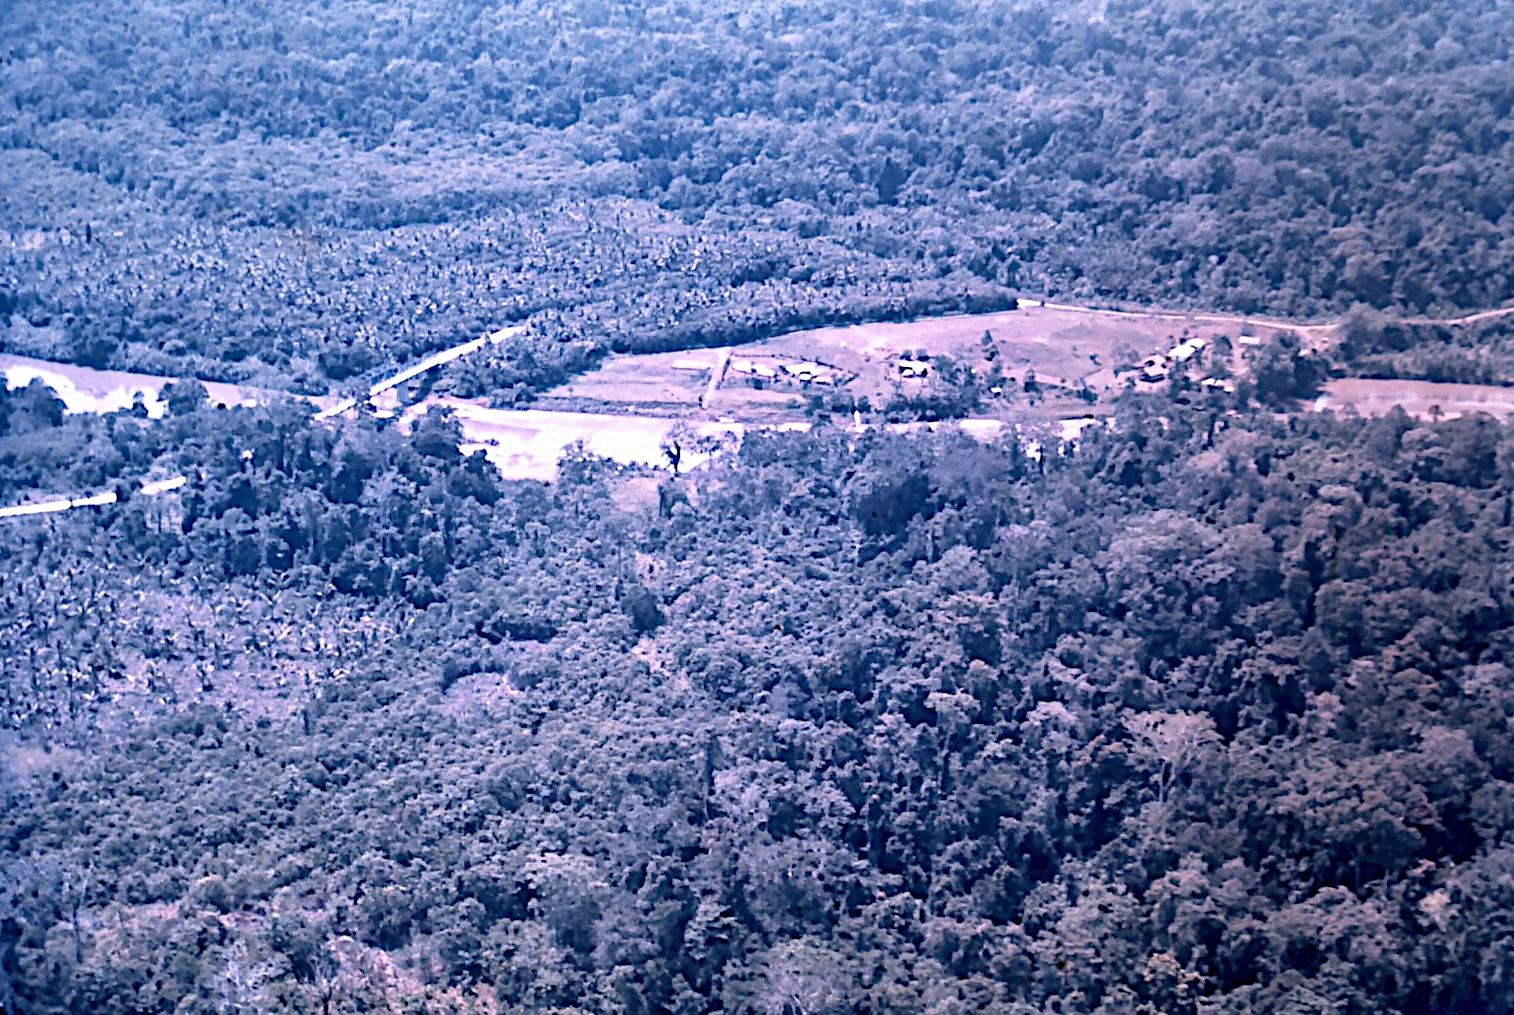
First species trial, Baku, planted late 1970. Top: Age 20 months. 1. Kamarere, 2. Anthocephalus, 3. Terminalia. Bottom: Infrared image of the same site, late 1972 at age two years. Dark blue to grey tones on the ground indicate still waterlogged soils. The growth of the Kamarere (left) seems to have improved over the four intervening months, possibly because its early growth has drawn down the water table. There seems to be less grey blue colour on the surface under the Terminalia trees (right). The ground is still wet throughout under the Anthocephalus (middle).
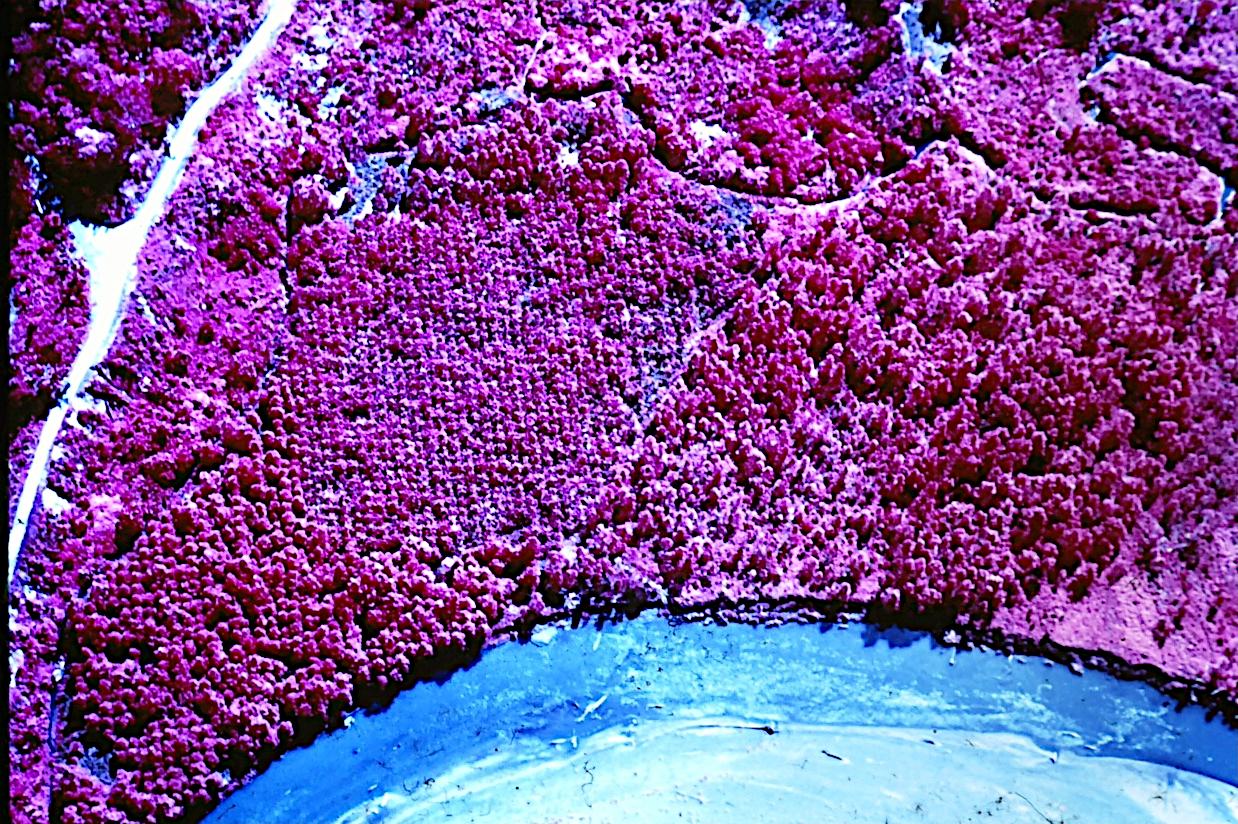

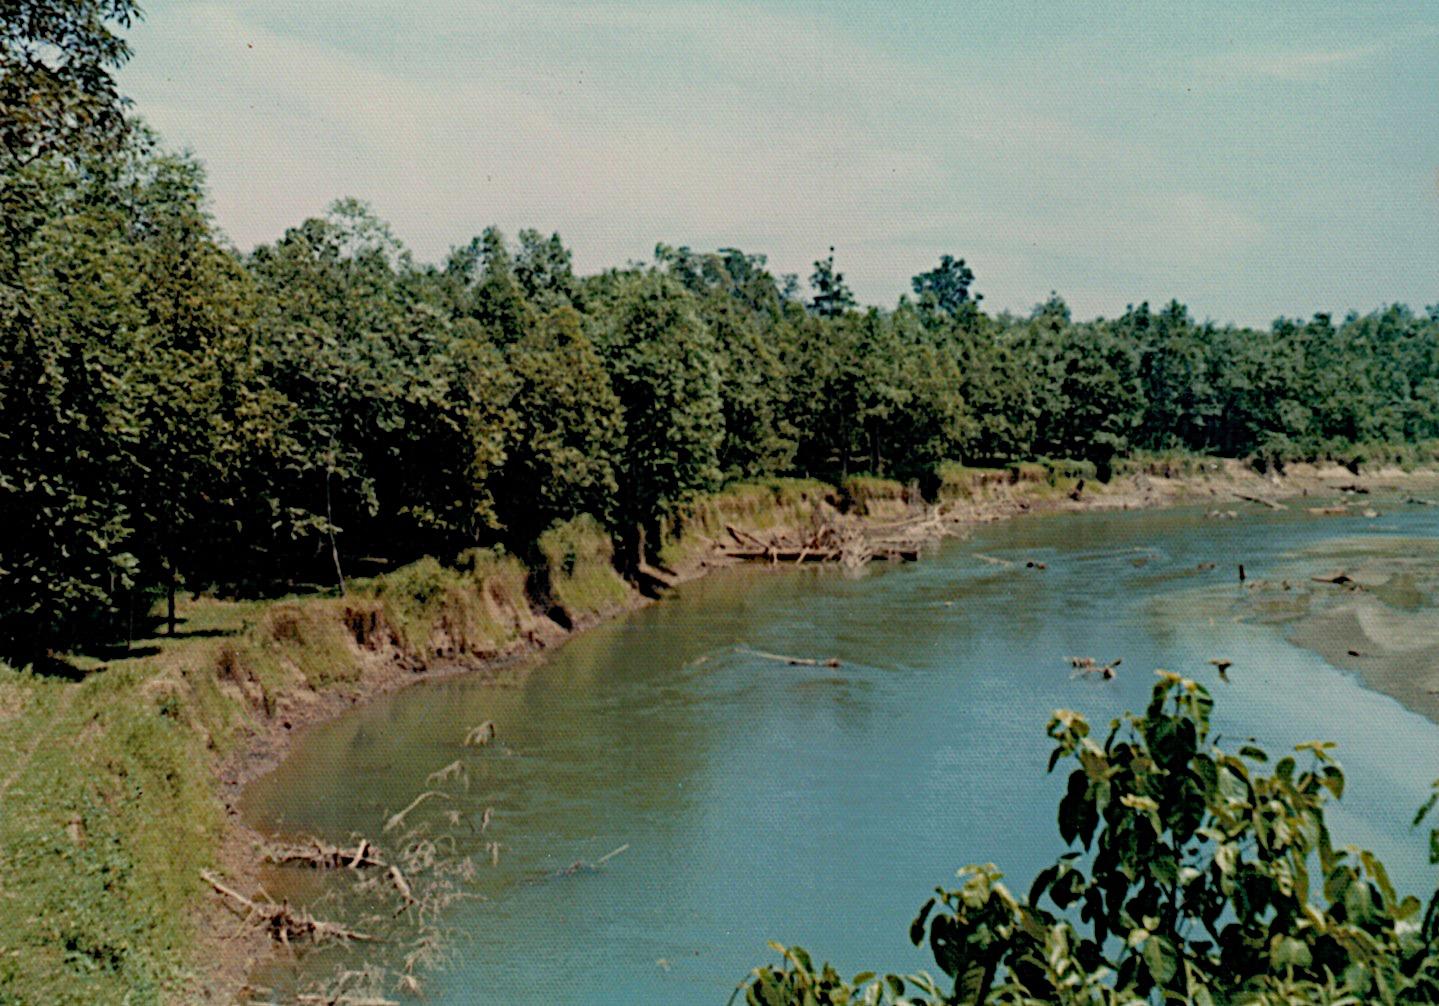
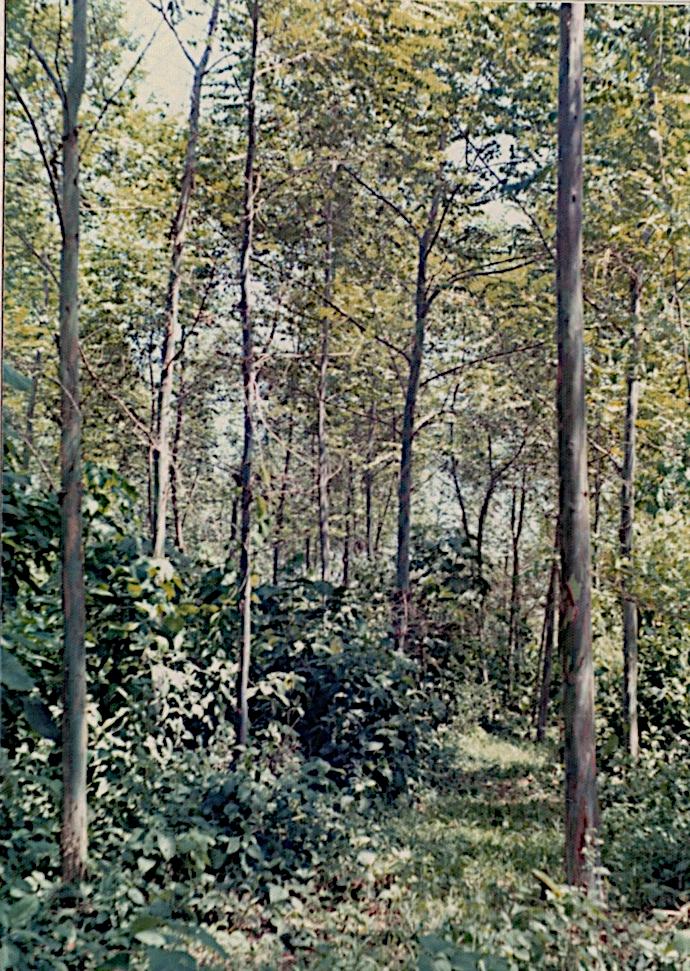
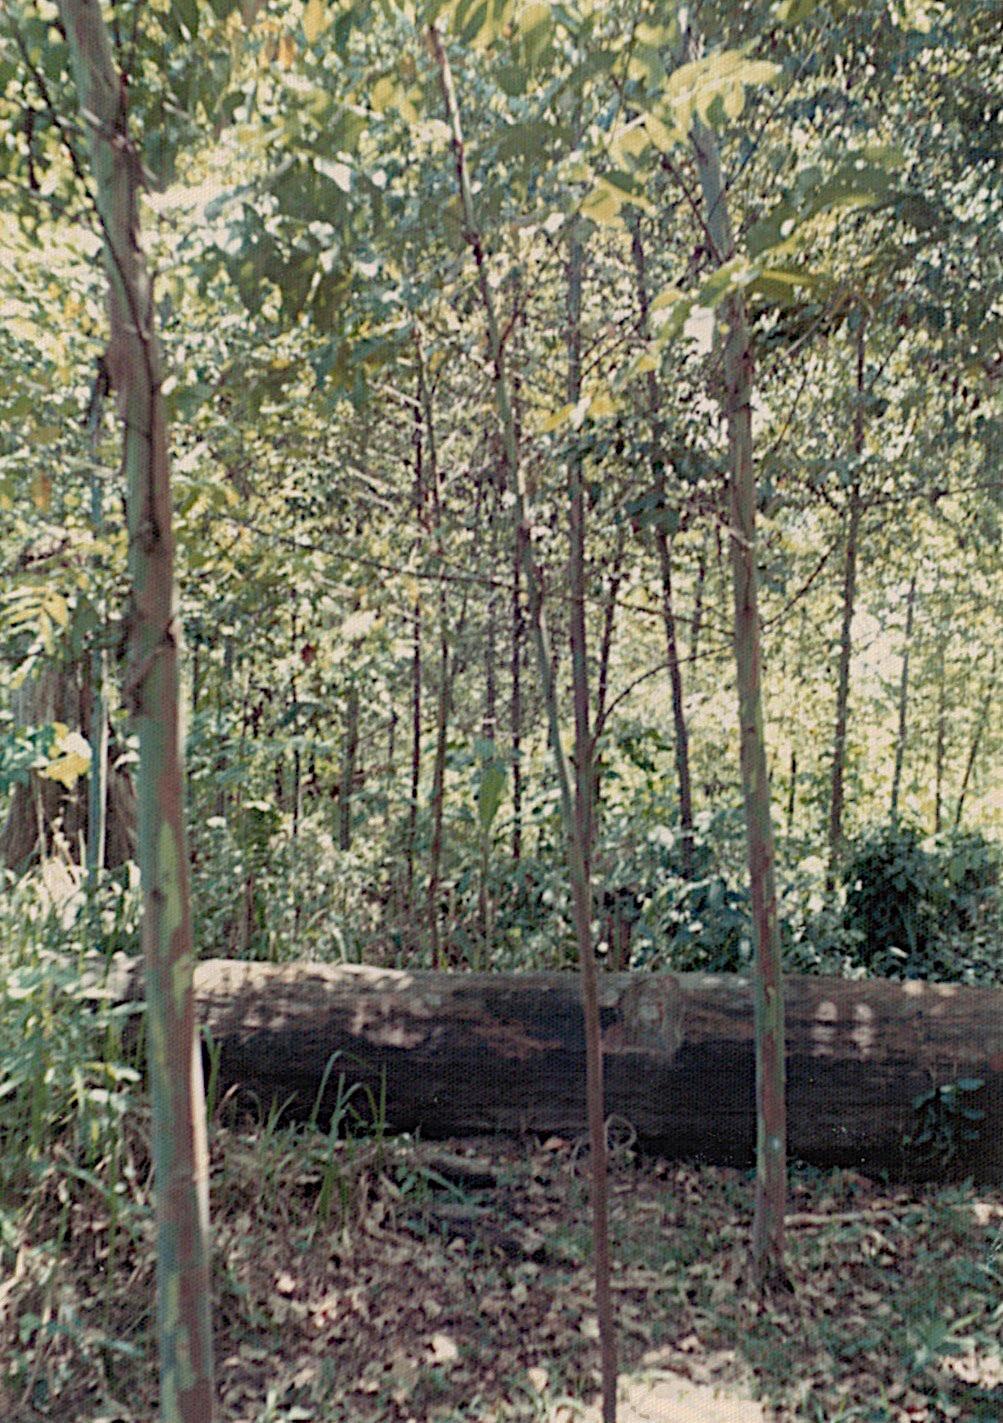
Top left and right: Gogol land classified as “7. Poorly Drained River Terrace Forest” (bordering on “5. River Floodplain Forest”). Water was flowing over the surface after rain. Left: A soil pit dug at this location filled with water because the water table was at the surface and drainage was poor. Estimated site quality for E. deglupta: Class 4. Below: Soil pit in land classified as “8. Well drained River Terrace Forest”. Estimated site quality for E. deglupta: Class 2 3.
In contrast to the Gogol soils, deep layers of porous, well drained pumice in places tens of metres deep occurred on both ridges and river terraces near Keravat. Site quality of these soils for E. deglupta was Class 1 2.
Site (aburned bnot burned) Depth (cm) pH P Olsen (ppm)
Ca (m eq %)
Mg (m eq %)
K (m eq %)
Na (m eq %) C (%) N (%) C/N S (%) Ulamona fresh pumice dust 0 2 5.0 0.2 8.5 0.07 0.06 0.06 0.02 0.006 3.3 0.26 Ulamona recent topsoil
0 10 6.6 15.8 21.5 0.4 0.51 0.46 4.1 0.65 6.3 50 60 7.6 4.5 1.0 0.02 0.01 0.12 1.2 0.15 8.0
0 2 5.0 2 1.2 0.07 0.06 0.06 0.14 0.015 4.6 0.08 2 5 6.0 8 9.3 1.1 0.1 0.12 3.1 0.31 10.0 0.08 Keravat River terracea
Dami flood plaina 0 10 6.3 8.0 25.5 3.5 0.86 0.75 8.6 1.0 8.6 50 60 6.2 4.0 7.5 0.5 4.48 0.55 2.1 0.23 9.1
Gogol River terraceb 0 10 6.4 17.0 31.6 14.4 1.39 0.17 5.3 0.50 10.6 50 60 6.7 8.0 28.2 15.7 0.60 0.49 0.7 0.10 7.0 Gogol River floodplainb
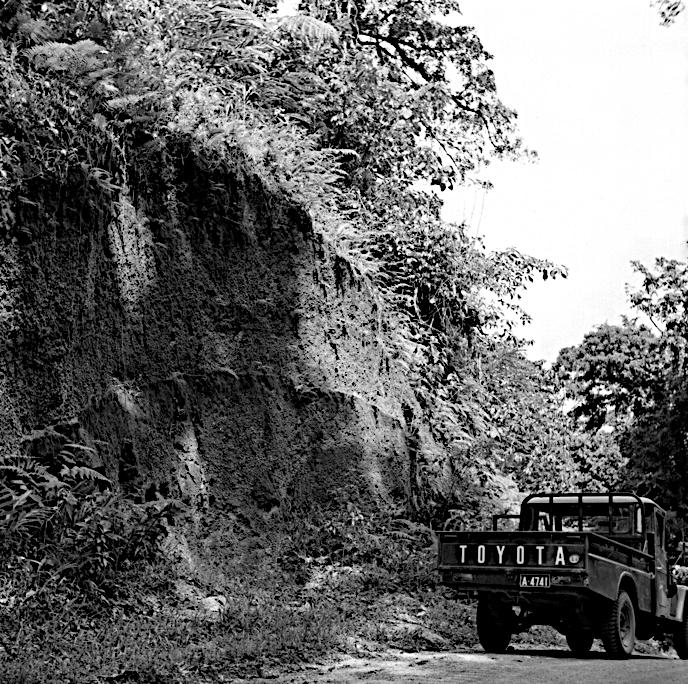
0 10 6.6 22 27.8 9.2 2.7 0.25 3.2 0.33 9.7
P = phosphorus, Ca = calcium, Mg = magnesium, K = potassium, Na = sodium, C = carbon, N = nitrogen, S = sulphur, ppm = parts per million, m eq % = milli equivalents percent.
Data in the table indicate surface soil nutrients were more favourable at Gogol than they were at Keravat, so soil nutrient deficiency was unlikely the cause of the poor growth of E. deglupta at Gogol relative to Keravat. Soil at 50 60 cm depth was about 10 times more alkaline (about 1 pH unit) at Keravat compared to the Gogol soils. Waterlogging at Gogol seems to have been the main causal factor in the poor growth soon after planting of the species there. Later this setback was compounded by poor control of early weed growth in too widely spaced establishment, especially on unburned sites.
Top: Part
Baku
Bottom: Compartment 3 Baku four months after planting with E.
in the top
in 1972. Site preparation was clearfelling and burning after logging. Except for one small patch and a few scattered trees on higher ground or perhaps on an ashbed, or both, waterlogging, too wide initial spacing and poor weed control mean most this plantation had a poor start. An indication of the wetness of the locality can be seen from the free water lying on the track in the bottom right hand corner. A corduroy of small poles had been laid on a particularly boggy length of track, and a small bulldozer was on standby to tow vehicles that became bogged.

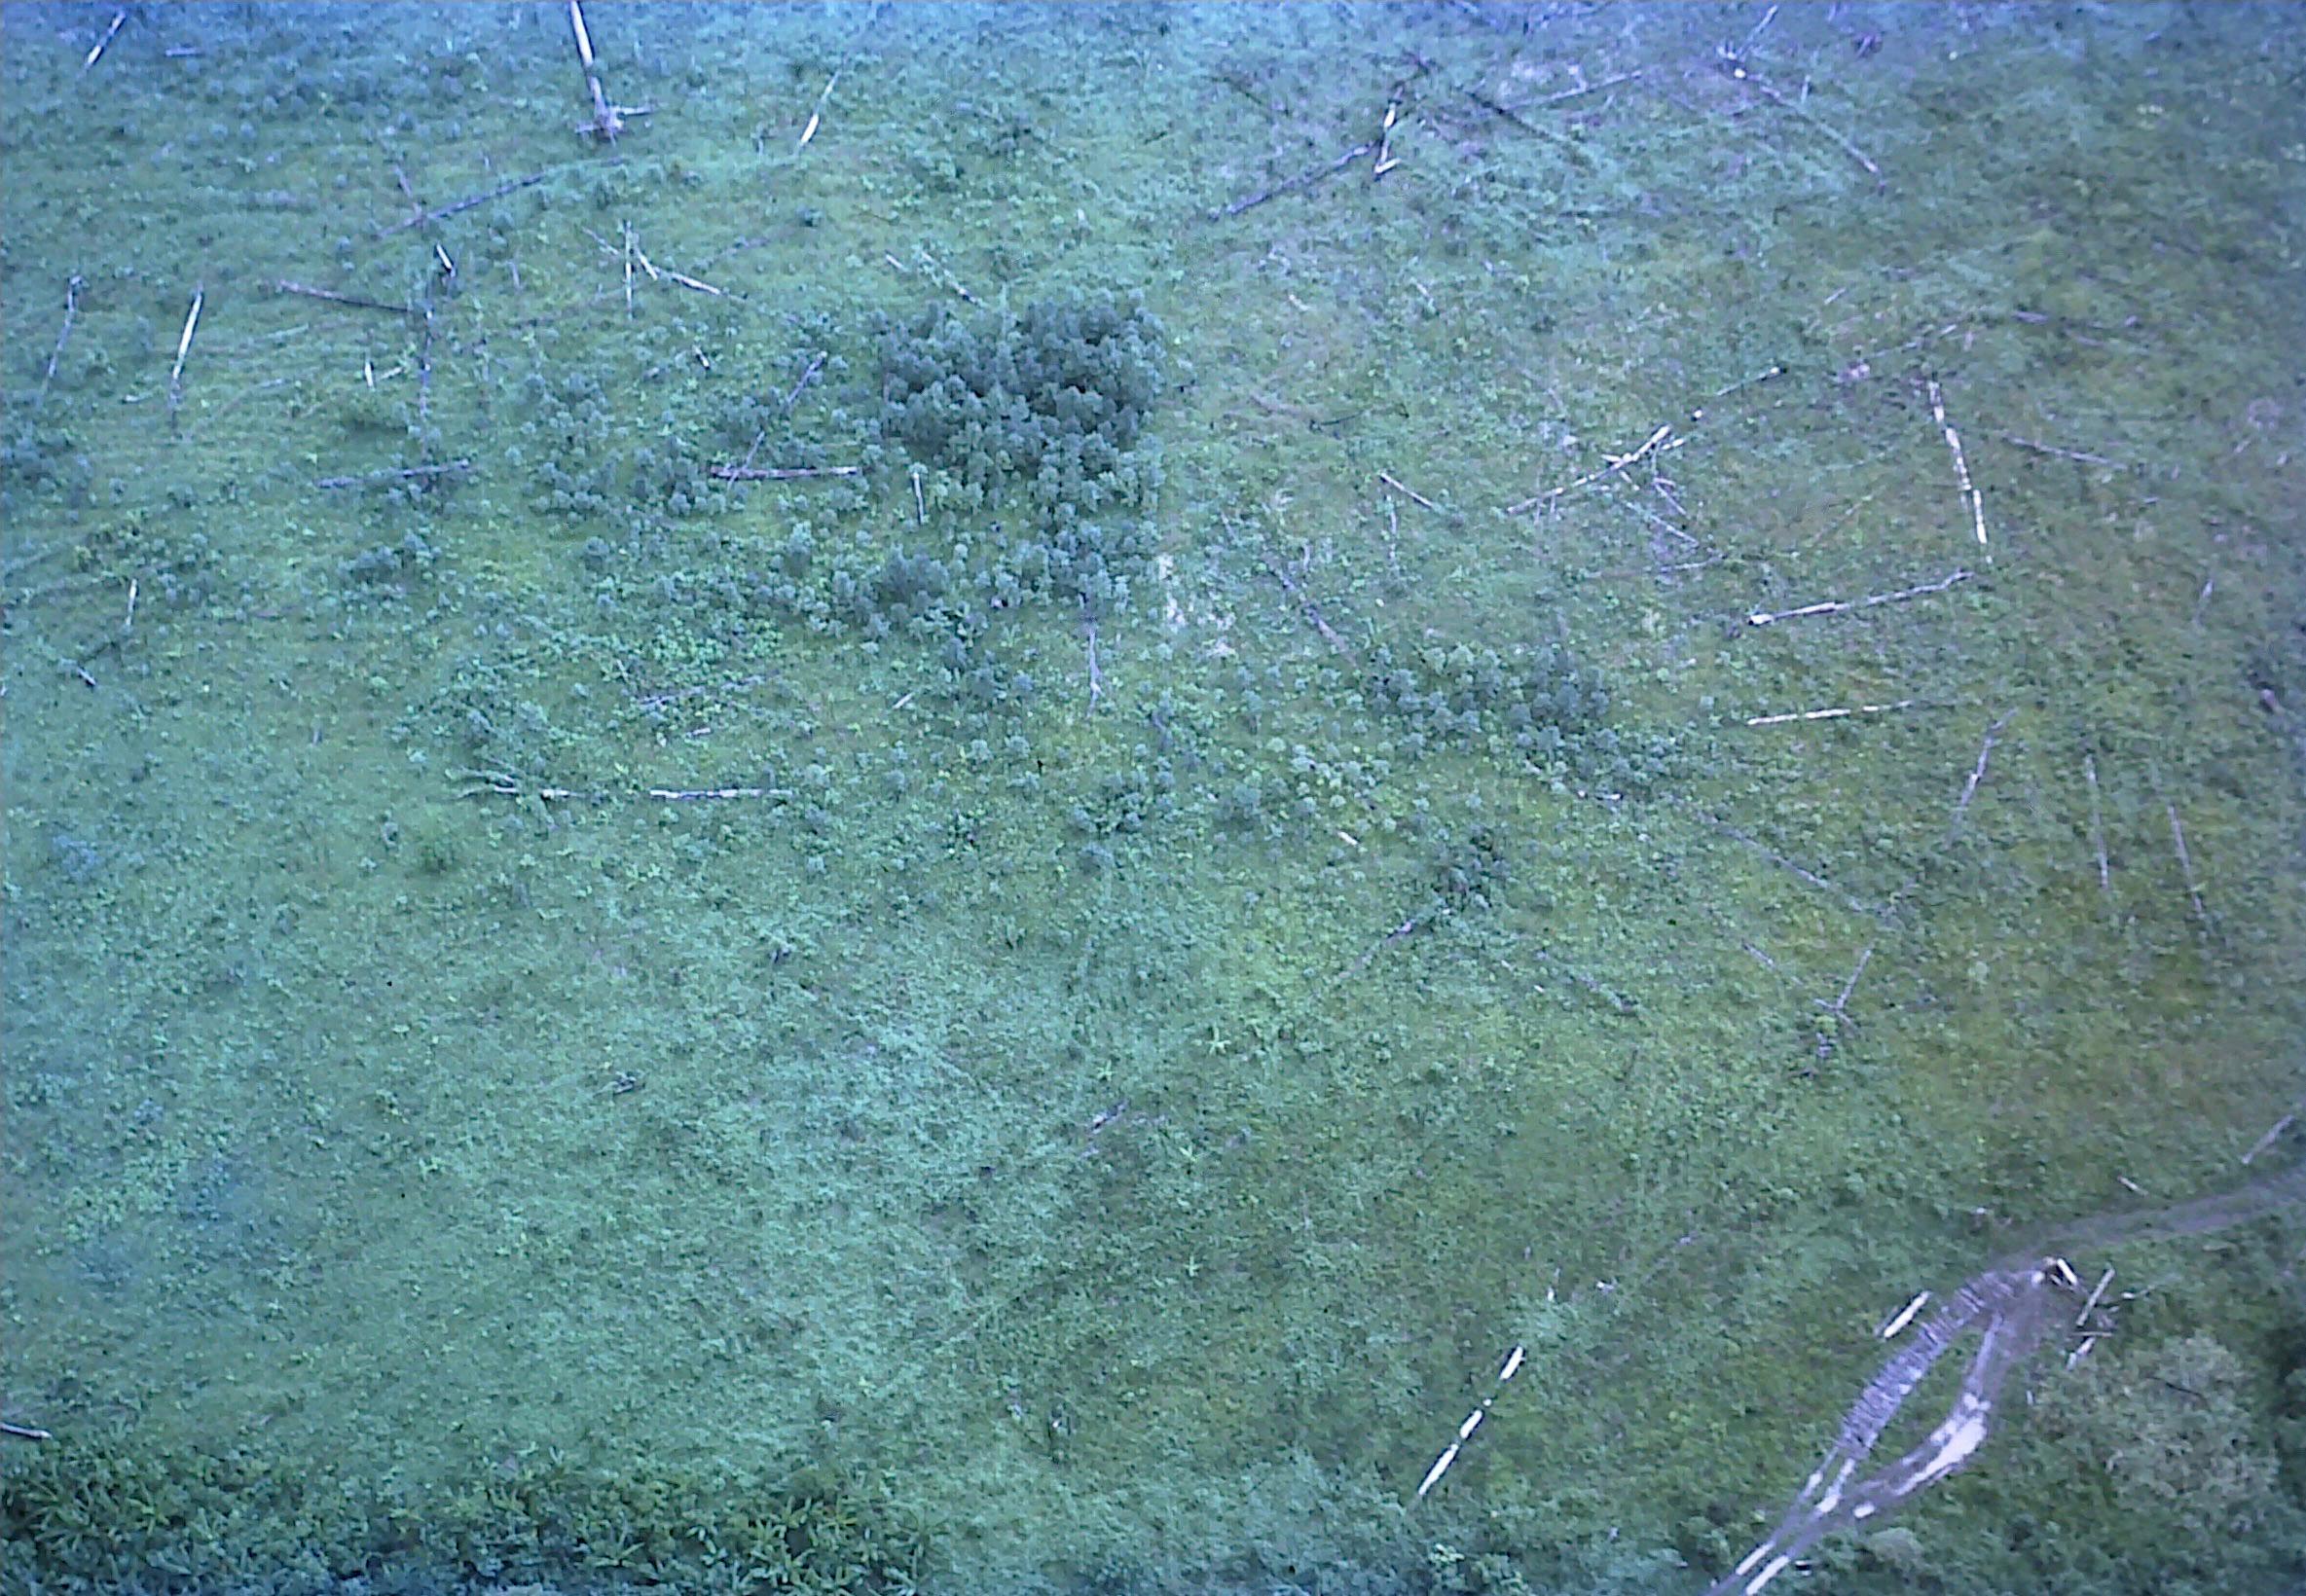
Top left: Dark areas indicate ash beds after clear felling, partial windrowing and burning the residual vegetation. Top right: Compartment 2 Baku LA, near the Gogol River showing a highly variable growth response a few months after planting E. deglupta in 1972. Below: The same area from the ground about a year later, with already variable growth rates further adversely impacted by prolific weed growth, the result of an inadequate tending regime. Much of the land in the centre of the photograph was originall y classified as “7. Poorly Drained River Terrace Forest”, while that in the centre and right at a distance near the Gogol River was classified “8. Well Drained River Terrace Forest”. Surviving early growth of E. deglupta on land class 7 was about site quality 4 or worse, and that on class 8 was site quality 2 to 3 at best.
