

G O L D C O A S T
PROUDLY PRESENTING PROPERTY MARKET INSIGHTS IN REAL TIME


G O L D C O A S T
PROUDLY PRESENTING PROPERTY MARKET INSIGHTS IN REAL TIME
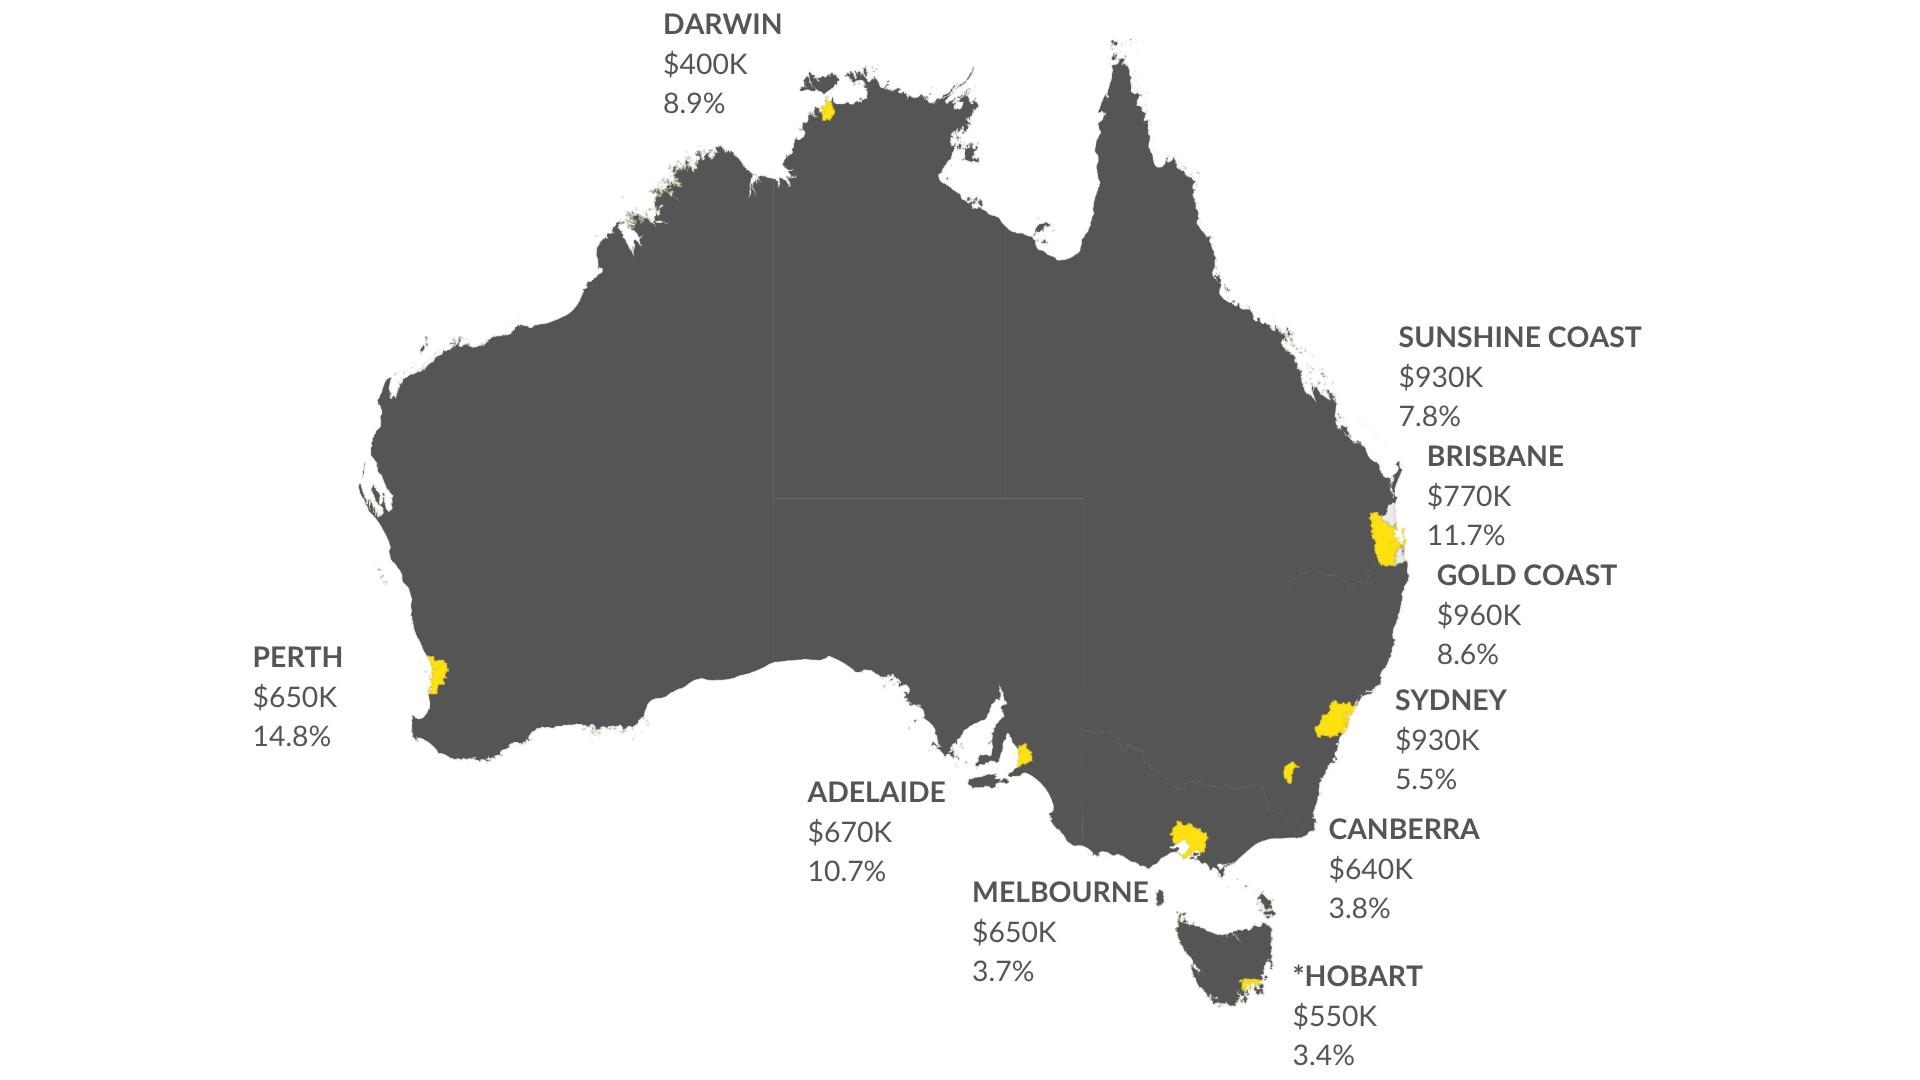
Price map chart
Shows property prices and their percentage change across major cities and regional areas This offers a quick understanding of where market activity is most dynamic and where values are strongest.
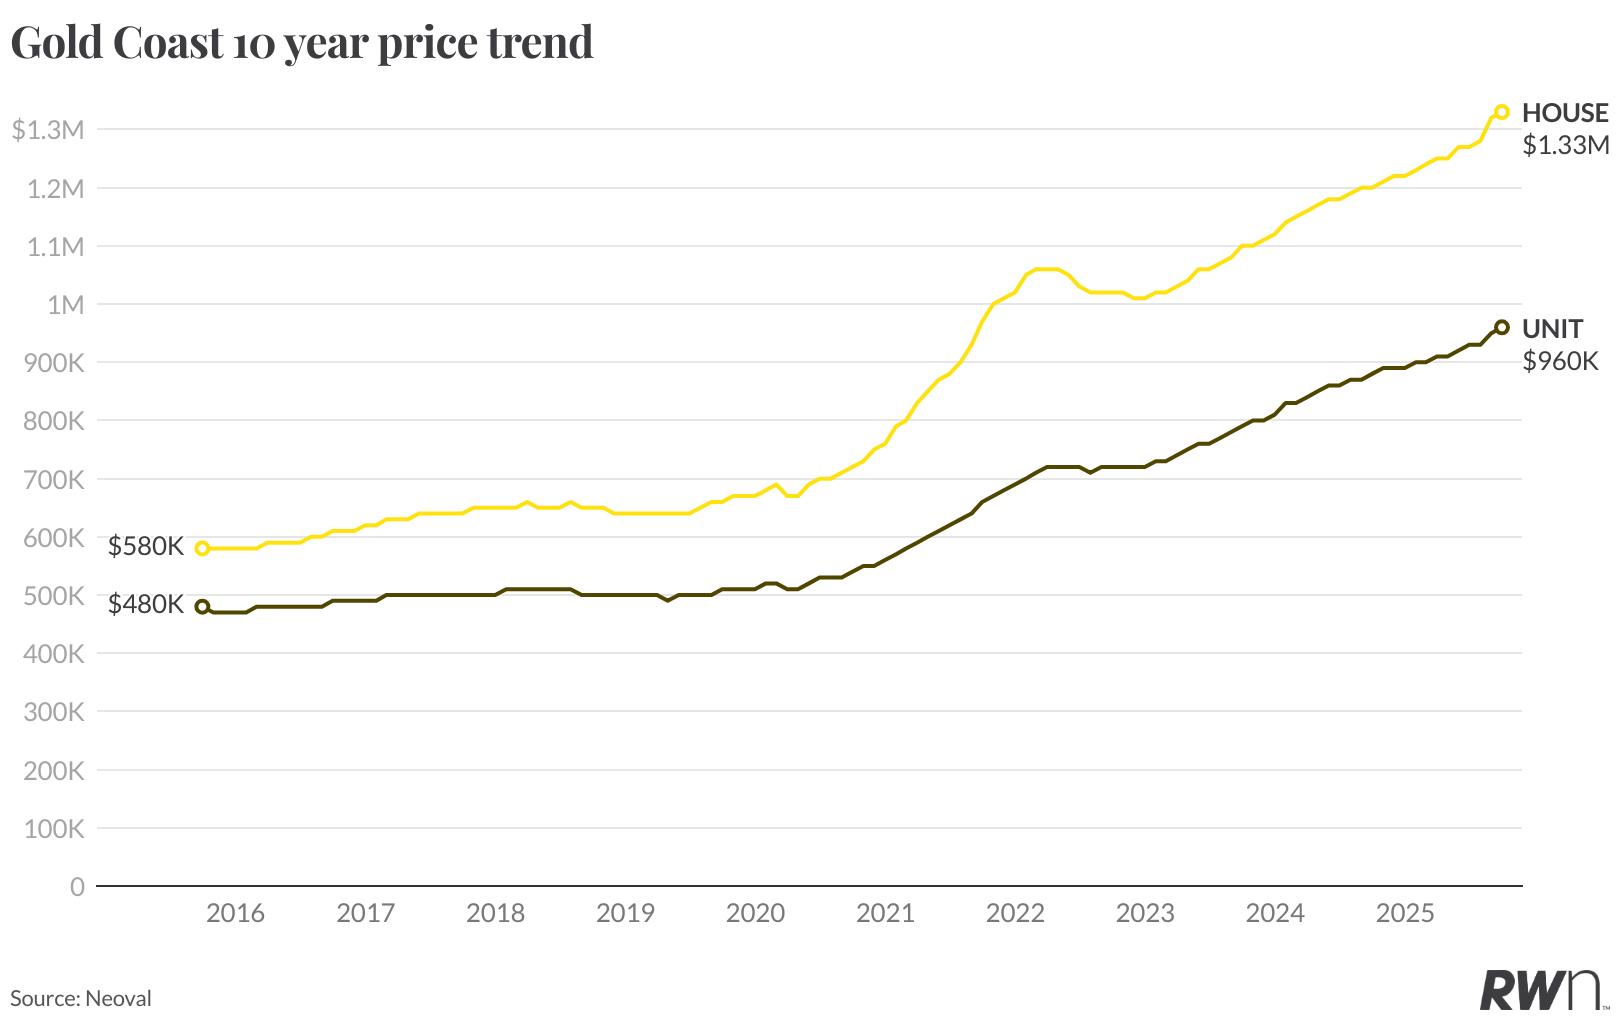
Price growth 10 year line chart
Displays historical house and unit prices over a 10year period, revealing their long-term growth and current values This helps to understand the market's long-term stability and potential for future appreciation 01 02
Growth by Price Segment
Shows property prices and their percentage change across major cities and regional areas. This offers a quick understanding of where market activity is most dynamic and where values are strongest
Listings growth line chart (3 year)
06 Methodology
Count of House and Unit Sales per Value Range
Presents the number of house and unit sales within specified price brackets This offers crucial insight into the affordability and popular price points within the market 05
Outlines our data sources and collection methods, explains the rationale behind selected metrics and statistical approaches, provides guidance on interpreting various data points and visualisations, and details the underlying calculations and methodologies used throughout the analysis
07
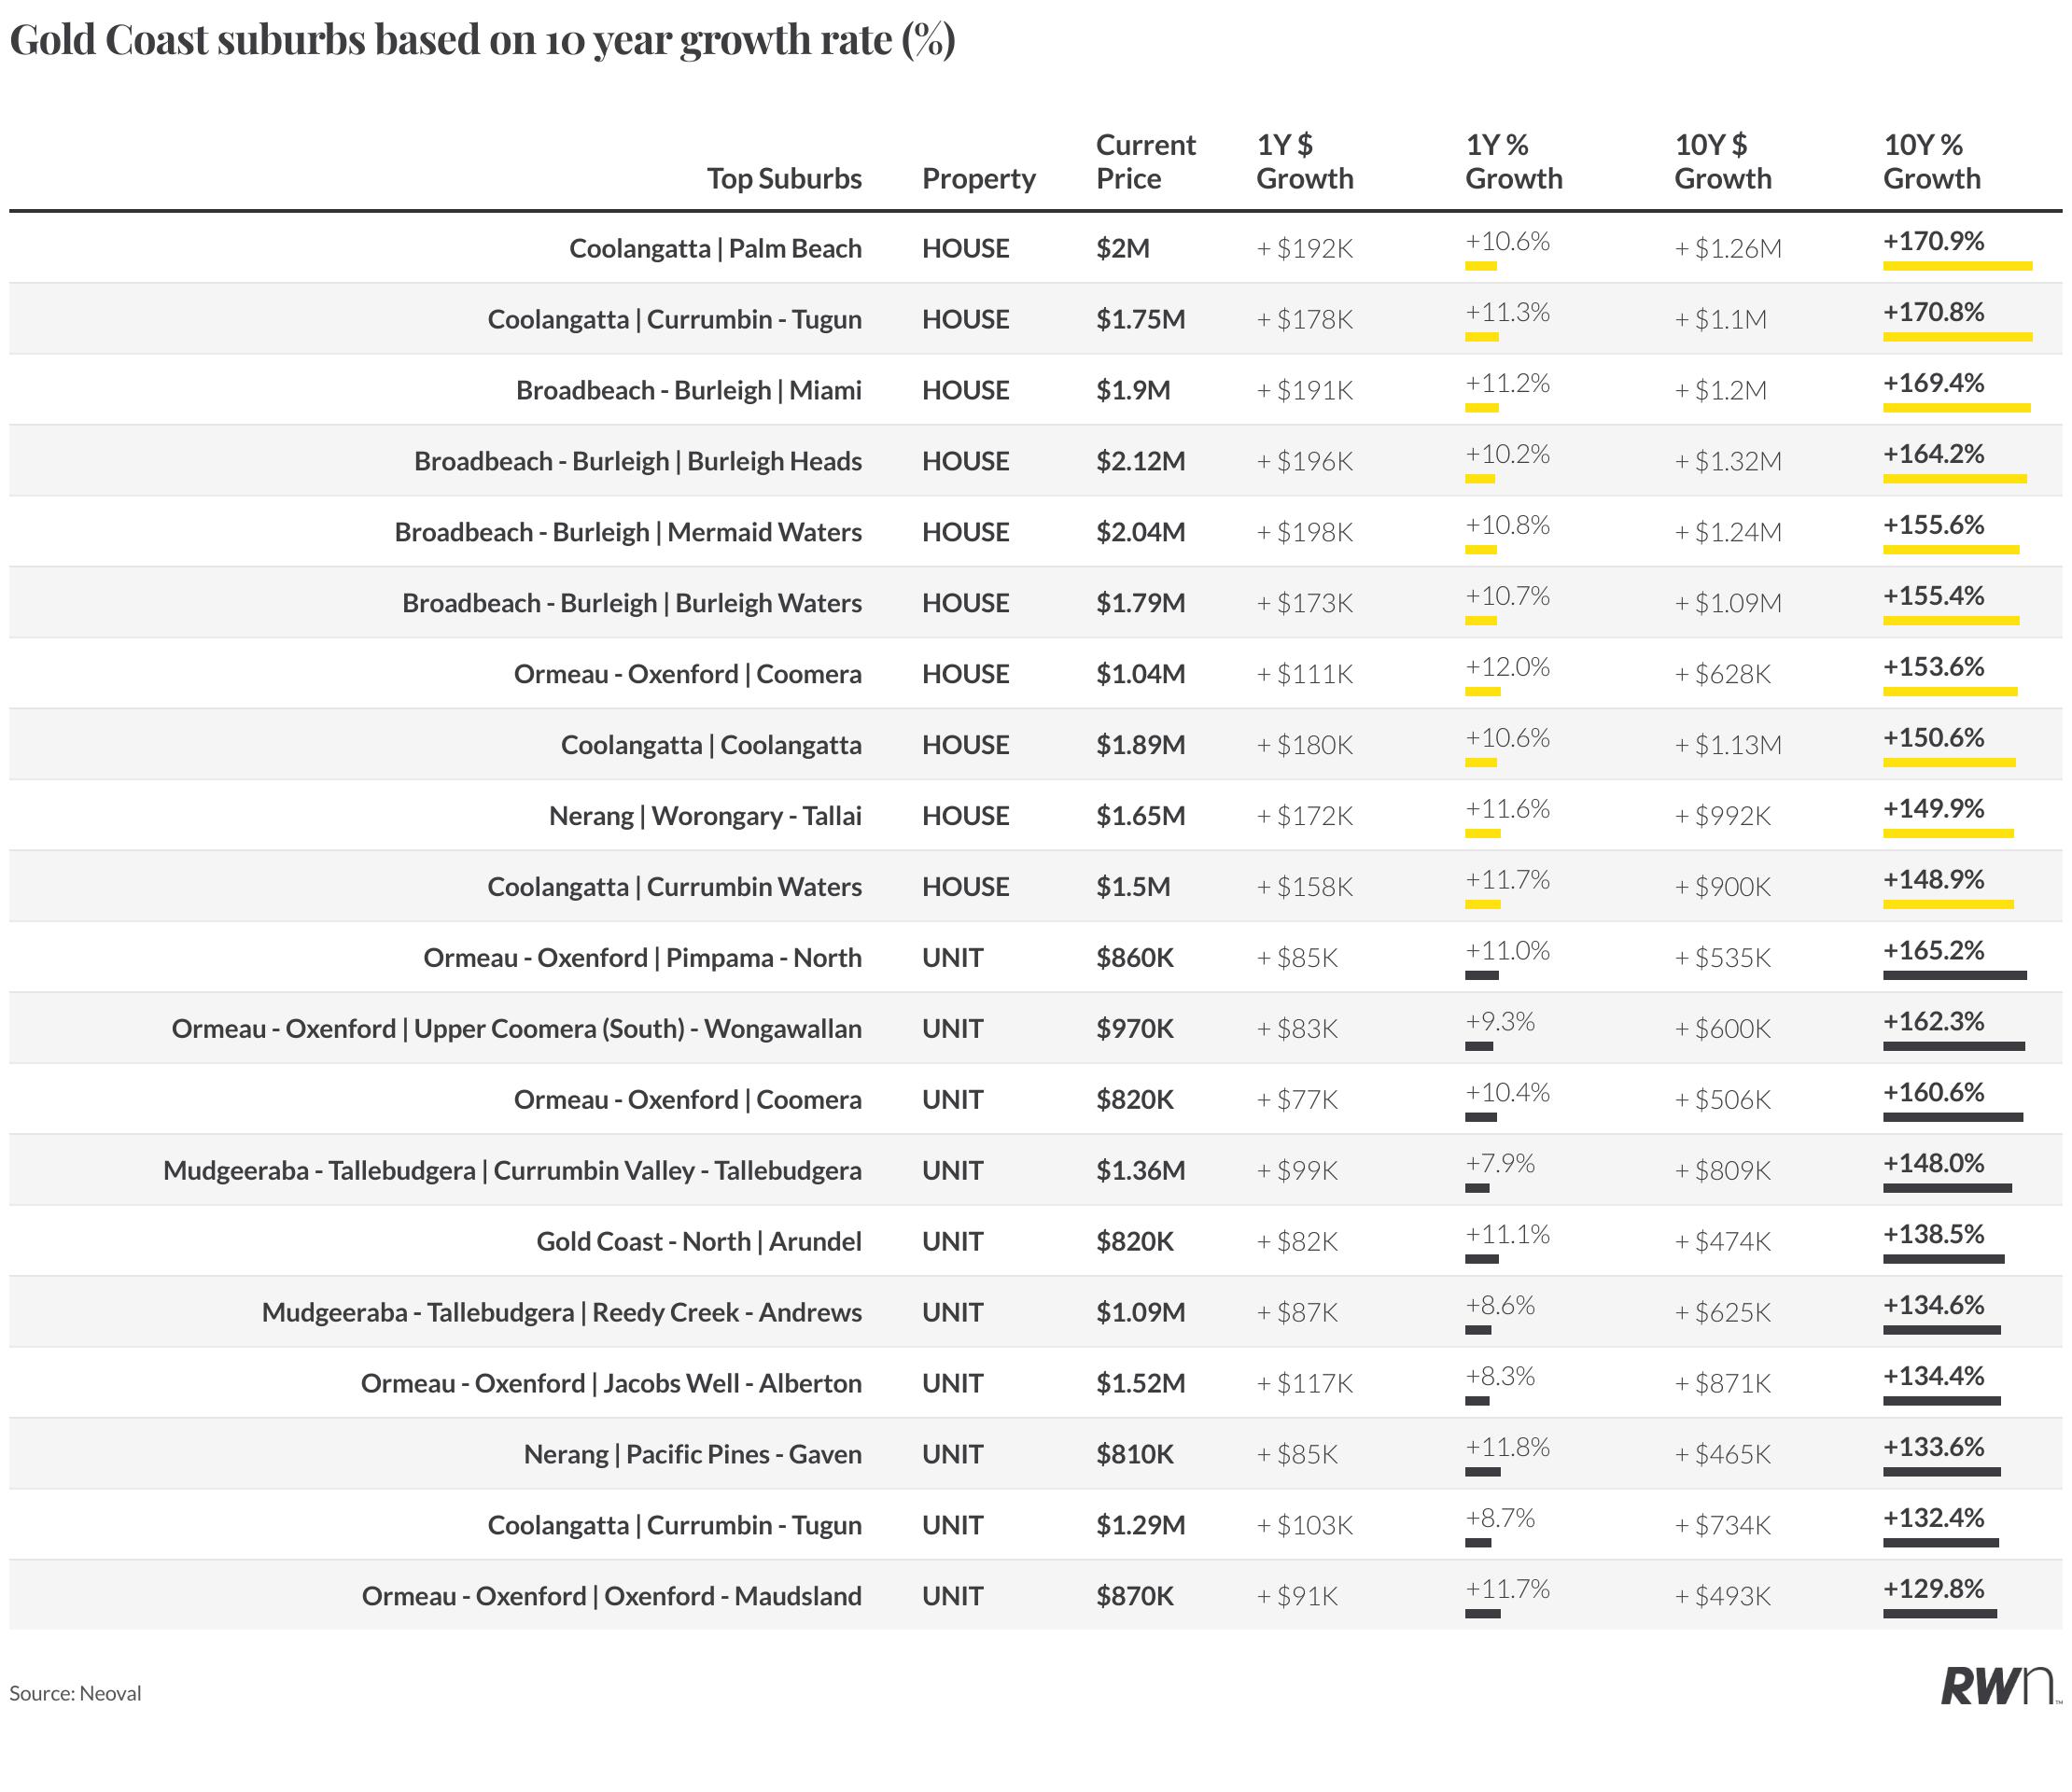
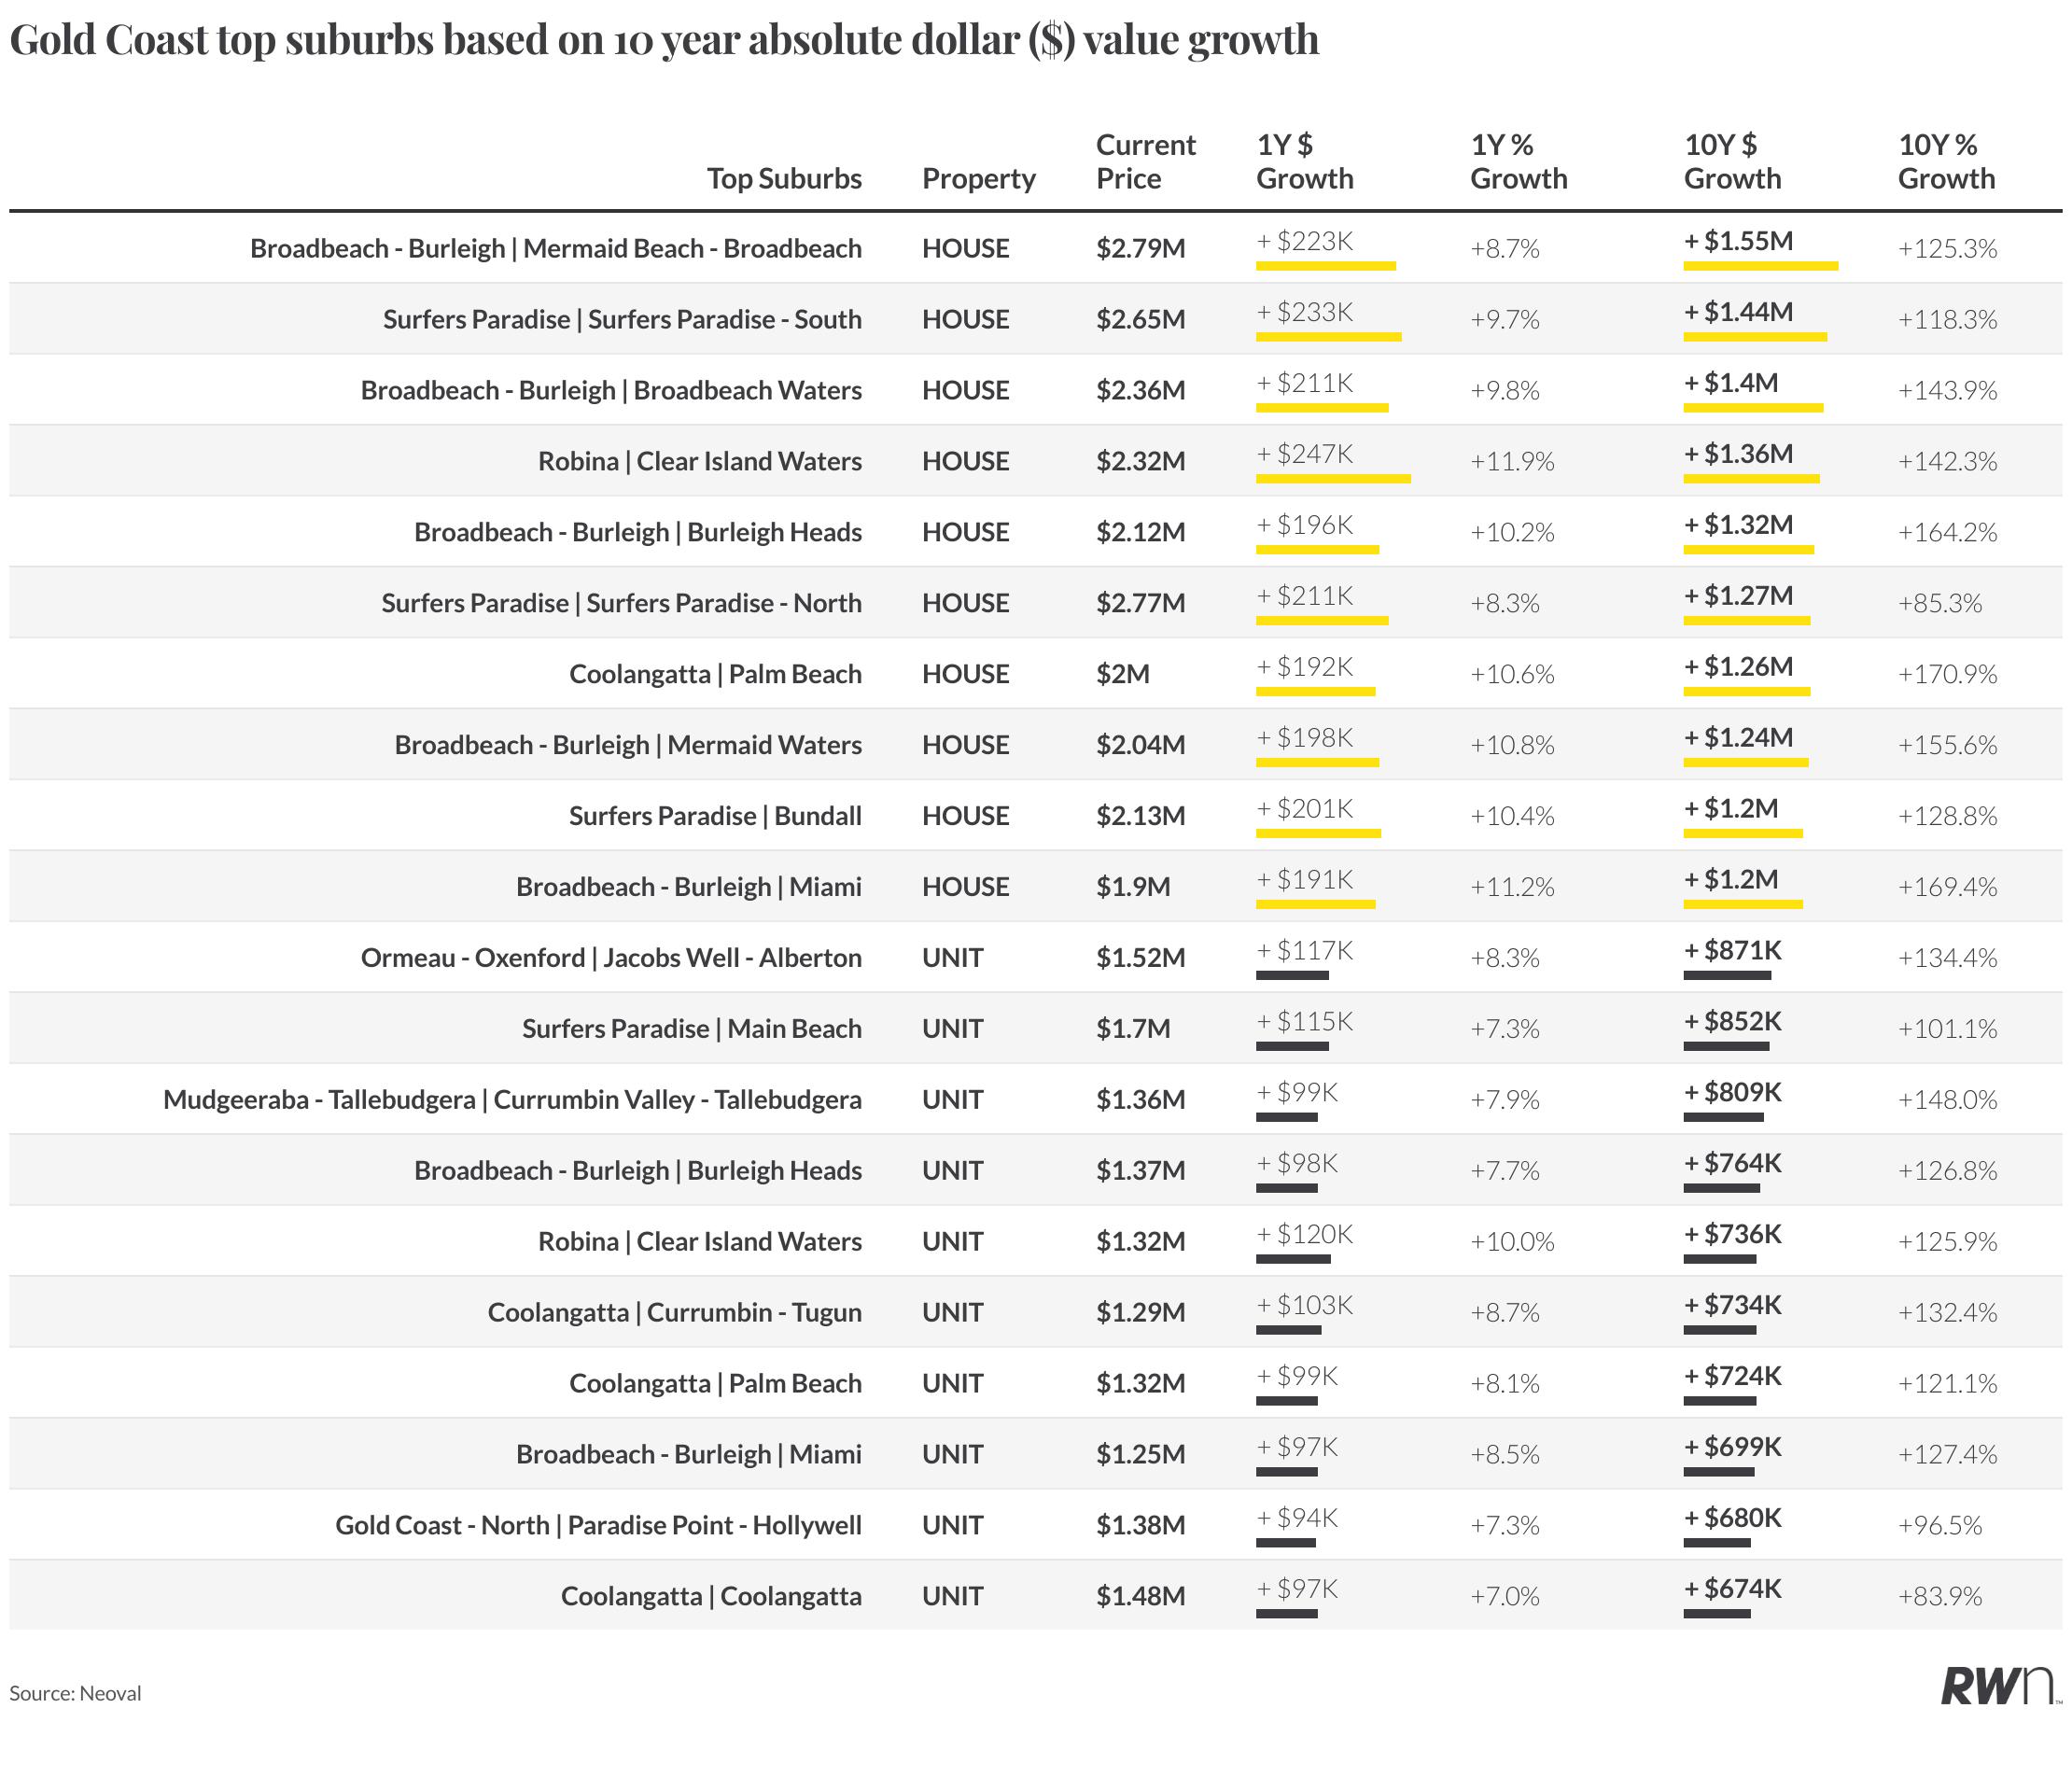
Appendix: Top Growth SA2s by Property Type
Identifies the highest performing SA2s in the region based on both absolute dollar gains and percentage growth rates This breakdown by houses and units reveals which specific locations are driving market momentum and where investment opportunities may be strongest
Tracks new listing volumes over three years, showing the number of properties entering the market This provides insight into supply levels and their potential impact on buyer competition and prices 03 04

$ HOUSE PRICE
% CHANGE IN PRICE
Source: Neoval
*Due to the unavailability of Hobart and Regional TAS data on Neoval, the latest data from Cotality was used to provide an estimate for the Hobart region
$ UNIT PRICE % CHANGE IN PRICE
*Due to the unavailability of Hobart and Regional TAS data on Neoval, the latest data from Cotality was used to provide an estimate for the Hobart region

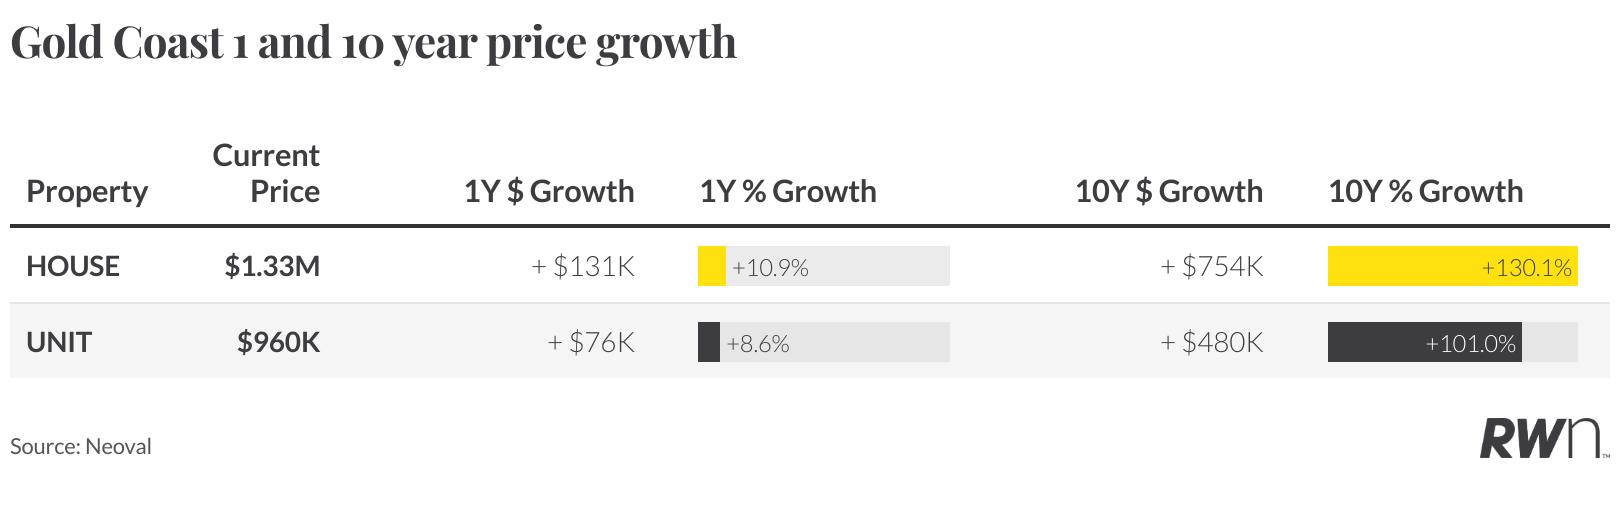
In August 2025, the Gold Coast house market continued its upward trajectory, with the geometric mean price reaching approximately $1.33M. This reflects a solid gain of approximately 10 9% compared to this same month last year, and an impressive increase of approximately 130.1% over the past decade. Unit prices also recorded strong performance, with their geometric mean price standing at approximately $960K This represents a growth of approximately 8.6% from this same month last year, and an appreciation of approximately 101% over the last ten years This robust growth, particularly for units, represents stronger performance than many capital city trends, occurring alongside sustained buyer demand

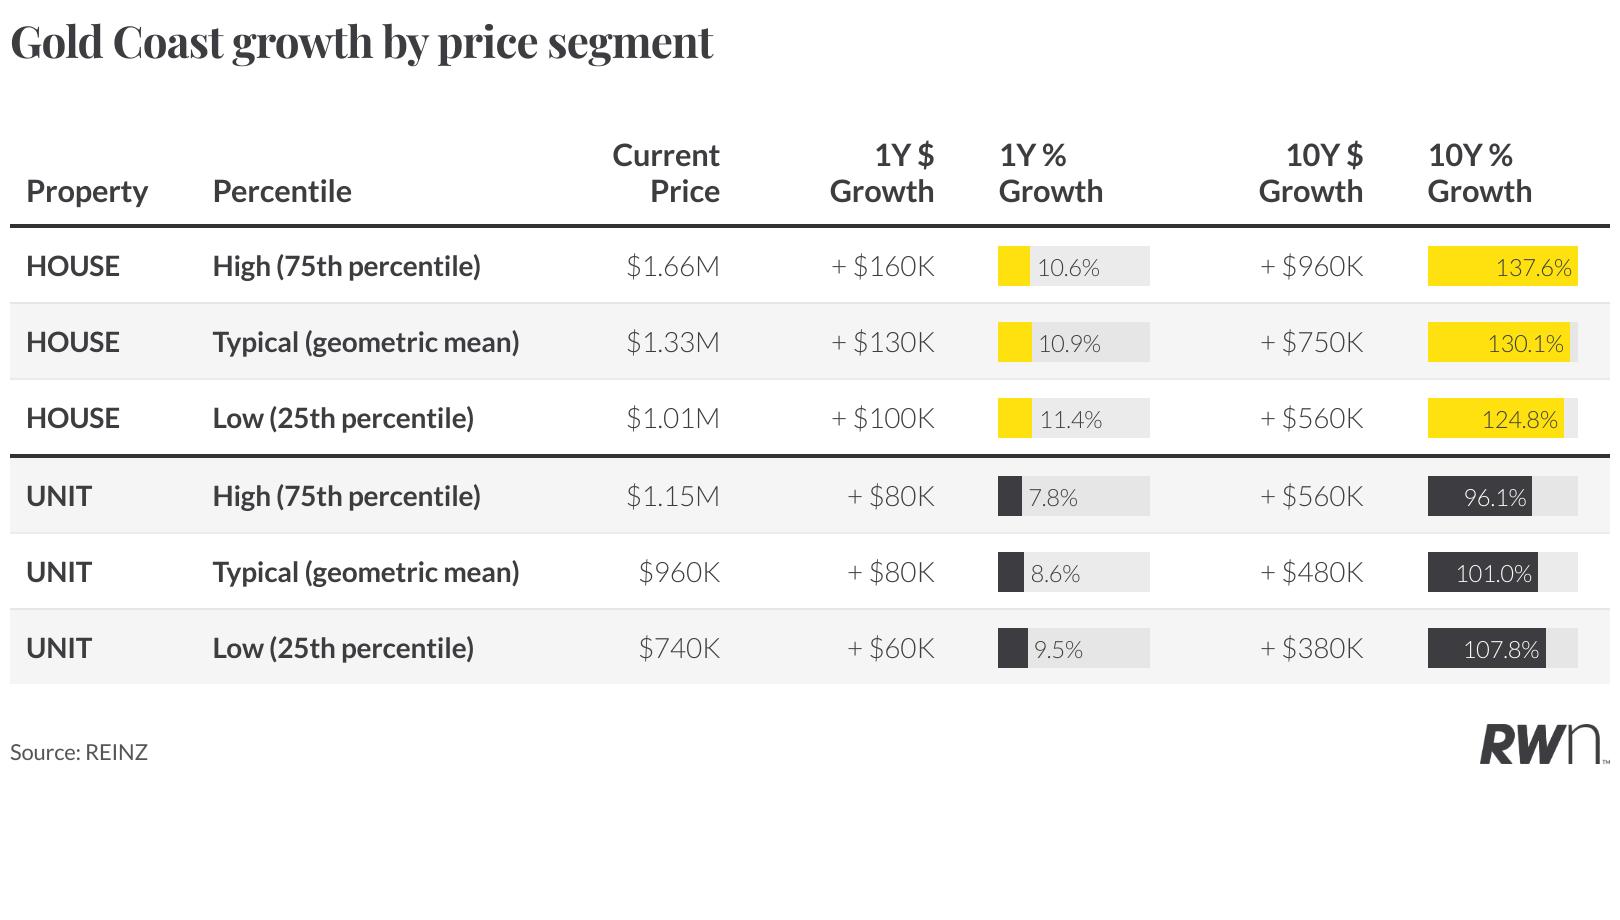
Delving into different price brackets as of August 2025, Gold Coast houses at the 75th percentile reached approximately $1 66M, reflecting approximately 10 6% growth this same month last year and an impressive 137.6% over a decade. Meanwhile, 25th percentile houses, at approximately $1 01M, saw approximately 11 4% growth annually and 124.8% over ten years. For units, the 75th percentile stood at approximately $1 15M, appreciating approximately 7 8% yearly and 96 1% over a decade Lowerpriced units at the 25th percentile were approximately $740K, showing robust approximately 9 5% annual growth and 107 8% over ten years, reinforcing the region's diverse market strength.

The Gold Coast property market, as of August 2025, reflects a diverse sales landscape.
The house sector saw its highest activity between $750K and $1 5M, with 4,867 sales, while the $1.5M to $3M segment also recorded a solid 2,064 transactions, maintaining its premium position For units, the $750K to $1 5M bracket was similarly dominant with 4,207 sales, closely followed by 3,444 units under $750K, showcasing robust activity in affordable and mid-tier price points Luxury sales exceeding $3M were present in both houses (413) and units (209), indicating a well-rounded market performance across all price tiers

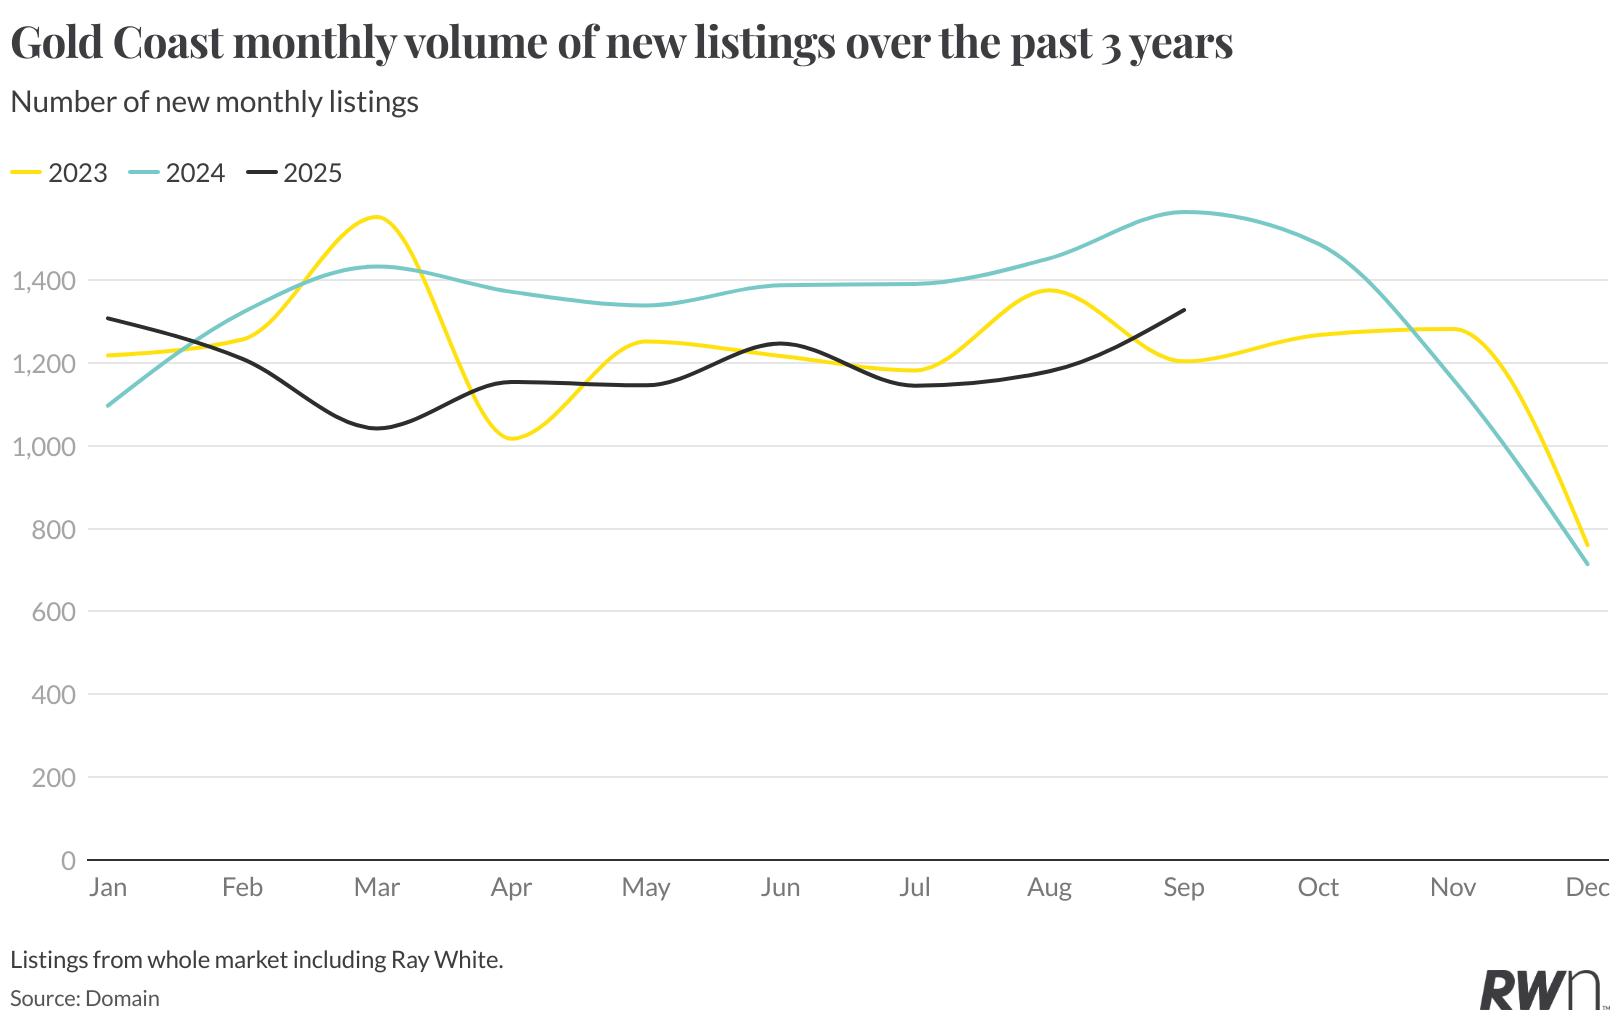
New listings in Gold Coast recorded a modest 3 1% monthly gain in August, reaching 1,180 properties. This occurred alongside an 18.8% annual decrease compared to August 2024, and remained below the 1,376 listings observed in August 2023 This trend reflects persistent supply constraints and reinforces limited vendor activity in the region Gold Coast's annual decline in listings is more pronounced compared to broader metropolitan market trends, representing a challenging supply-side dynamic.
Price data is sourced from our research partners at Neoval Research Group, providing comprehensive coverage across all major Australian capital cities and regional markets Price movements are calculated using geometric mean rather than median or arithmetic mean to ensure more accurate representation of market performance
The geometric mean provides superior accuracy for measuring price growth rates over time compared to median or arithmetic mean measures Unlike arithmetic averages, which can be skewed by extreme values, the geometric mean accounts for the compounding nature of price appreciation and provides a more stable measure of underlying market trends This methodology is particularly valuable when analysing markets with significant price volatility or when comparing growth rates across different time periods, as it reduces the impact of outliers and provides a truer reflection of consistent market performance Tasmania exception: due to licensing restrictions, geometric mean data from Neoval is not available for Tasmania For Tasmanian markets, we utilise the Median Sales AVM Value from Cotality, which represents the median (50th percentile) estimated sales value of all properties based on the hedonic imputation method, irrespective of whether the property transacted or not
Our analysis utilises the Australian Bureau of Statistics (ABS) geographical classification system, employing GCC, SA4, SA3 and SA2 naming conventions as the statistical and computational standard established by the ABS This hierarchical structure provides a consistent framework for analysing property markets at various geographical scales, from major metropolitan areas down to individual SA2s The visual representation and practical application of these classifications can be explored through the ABS mapping portal at https://maps abs gov au, which displays the 2021 GCC, SA4, SA3 and SA2 shape files These are the same shape files and naming conventions used by Neoval in their price modelling computations, ensuring consistency between our data sources and official statistical boundaries
For comparative analysis purposes, the Sunshine Coast and Gold Coast regions are classified alongside GCC Major City regions This classification reflects their substantial price growth over recent years and their common comparison with major metropolitan markets Given their economic significance and market characteristics, these regions are considered Major City regions for the purposes of this analysis
National property listing volumes are sourced from Domain, Australia’s leading property portal, providing comprehensive coverage of new property listings across all markets National listings: presented as monthly counts spanning the last three years (2023-2025) to identify seasonal patterns and year-over-year trends in property supply Major city and regional listings: current month data is presented with both monthly percentage change (comparison to previous month) and annual percentage change (comparison to same month in previous year) to highlight both short-term fluctuations and longer-term supply trends
Sales count data by price point is sourced from Australian Property Monitors (APM) and Valuer General records, providing transaction data across all fixed price segments for market segmentation analysis While filtered for residential properties only, some commercial or rural properties may be incorrectly classified as residential in the source data, potentially affecting data precision
All data series are presented on a monthly basis covering the three-year period from 2023 to 2025, enabling identification of seasonal patterns, cyclical trends, and year-over-year comparisons This timeframe captures the full interest rate cycle from peak rates through to the current cutting cycle, providing context for current market dynamics All data sources represent substantial market coverage but may not capture 100 per cent of market activity Price data from Neoval provides broad market representation Regional variations in data coverage may exist, with metropolitan markets generally providing more comprehensive data
The market commentary throughout this report was generated using Google's Gemini 2 5 Flash, a state-of-theart large language model chosen for its exceptional ability to analyse complex datasets and translate them into clear market insights The model was fed comprehensive data from both our national report along with region specific metrics, enabling it to contextualise local movements within broader market trends Through multiple iterations of refinement, we optimised the system to provide straightforward, factual descriptions of the data presented in charts and tables, avoiding speculation while highlighting key trends and significant data points This approach represents our ongoing efforts to deliver consistent, data-driven commentary that accurately reflects underlying market information in accessible language for both property professionals and general readers

raywhite.com