

The Perth retail strip market has seen a notable uptick in occupancy across the eight surveyed areas. This improvement comes amid a favourable economic climate in Western Australia, characterised by robust economic performance, low unemployment rates, and a significant boost in population growth.
These positive economic indicators have had a ripple effect on the residential market, which had previously been stagnant for an extended period. The Perth housing sector has experienced substantial price increases and rental growth rivalling all other Australian markets. This surge in residential sales prices can be attributed to two main factors: growing interest from investors attracted by low vacancy rates and high rental yields, and the need to accommodate the expanding population during a period of limited housing supply.
The flourishing housing market has, in turn, bolstered consumer confidence, driving retail trade, particularly in the food and homeware sectors. This economic vitality has not gone unnoticed by investors, with Perth witnessing unprecedented levels of commercial property investment activity, peaking in 2021. Interstate buyers have shown particular interest in these investments, drawn by the state’s strong economic position, growing population, and the scarcity of new retail supply.
As interest rates are anticipated to continue to decrease this year, there’s renewed focus on the investment landscape. Local private investors and owner-occupiers are also competing for quality properties, although the volume of transactions has significantly decreased. Despite falling funding costs, astute buyers continue to seize opportunities in the retail sector, especially in strip locations with a proven history of high occupancy. While yield expectations have shifted over the past 6-12 months, sales typically range between 5% and 7%.
The retail landscape remains intriguing in the current environment. Although online sales grew substantially in recent times, these levels have now stabilised. Local retail strips continue to perform well, defying the digital trend. High inflation remains a concern for consumers, impacting the retail market, but recent data suggests this is becoming more manageable.
Looking ahead, future interest rate movements are likely to be the key determinants of continued success for these retail strips over the next year. While challenges persist, the resilience and adaptability of Perth’s retail strip market, coupled with the state’s strong economic fundamentals, position it well for continued growth and stability.
The Perth retail strip market has seen a notable uptick in occupancy across the eight surveyed areas. This improvement comes amid a favourable economic climate in Western Australia, characterized by robust economic performance,

The recent retail survey results have yielded some impressive outcomes, with individual markets showing improvements across the board. Particularly encouraging is the continued decline in the overall average vacancy rate, signalling a robust recovery in the retail sector.
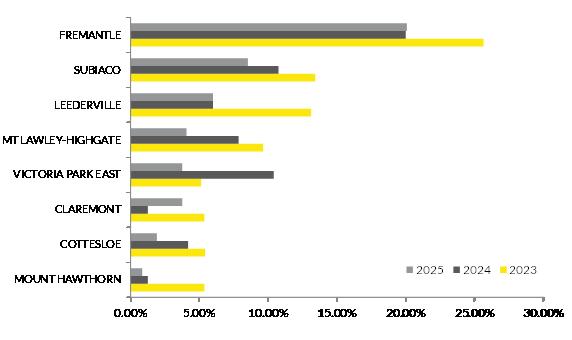
Our comprehensive survey encompassed eight key locations, examining a total of 581 shop fronts that represent nearly 82,000 square metres of retail space. The current vacancy rate stands at 5.32%, a notable improvement from last year’s 6.33%. This positive trend is even more significant when compared to the challenging period of 2019-2020, which saw a sharp increase in vacancies due to pandemic-related lockdowns.
The composition of retail strips has evolved in response to changing consumer behaviours and preferences. Interestingly, some markets are defying national trends. Bay View Terrace and Napoleon Street, for instance, remain strongholds of fashion retail, a category that has become increasingly rare across the country. Similarly, Albany Highway, particularly in the east, maintains a strong clothing segment.
Other markets in our survey showcase strong levels of food and service establishments, sectors that have experienced substantial growth in recent years. These segments not only contribute to retail trade but also enhance local vibrancy by necessitating in-person patronage. For areas with higher vacancy rates, we anticipate an influx of food and service businesses. This shift is expected to invigorate these locations, as these categories typically require physical presence and interaction, thereby increasing foot traffic and overall market activity.

Source: RWC WA

Bay View Terrace has experienced some moderation in occupancy levels, with vacancy rates rising to 3.75% in 2025, representing a shift from the exceptionally tight market conditions seen in recent years. While this marks an increase from the previous year’s 1.25%, the strip continues to out perform many retail locations across Perth and maintains its position as a resilient neighbourhood retail destination.
This adjustment reflects the broader recalibration occurring across Perth’s retail market as conditions normalise following the exceptional period of ultra-low vacancy rates. The increase can be attributed to several factors including the completion of new retail supply, some tenant relocations, and the ongoing structural shifts in retail as businesses adapt to changing consumer behaviours.
Despite the uptick in vacancy, Bay View Terrace continues to benefit from Perth’s strong economic fundamentals, including sustained employment growth, robust residential price appreciation, and steady population growth. The strip’s affluent catchment area has maintained discretionary spending levels, supporting the diverse tenant mix that characterises this location.
Bay View Terrace maintains its unique positioning within Perth’s retail hierarchy, with clothing and soft goods continuing to represent 26.47% of retail space. This concentration remains notably higher than most retail strips, reflecting the location’s continued appeal as a fashion destination despite broader industry pressures toward online channels.
The services sector has solidified its presence at 18.27% of total space, encompassing beauty services, optical stores, and traditional service providers. This diversification has provided stability to the strip’s occupancy profile and aligns with consumer preferences for experiential retail offerings.
Cafes and restaurants represent 9.42% of the retail space, while specialised food retailing accounts for 1.03%. The “other personal and household goods” category comprises 11.38% of the mix, and recreational goods represent 9.32%. This balanced composition continues to differentiate Bay View Terrace from more conventional retail strips while supporting its premium market positioning.
Supermarket & Grocery
Specialised food retailing
Cafes and restaurants: 23.37%
Clothing & soft goods: 35.02%
Furniture, housewares & applicances: 7.29%
Recreational goods: 3.40%
Other personal & household goods: 21.05%
Services: 7.97%
Pubs, tavens & bars Vacant: 1.90%
Napoleon Street has demonstrated exceptional performance in 2025, with vacancy rates improving to just 1.90% from 4.18% in the previous year. This outstanding result underscores the strip’s enduring appeal and the strength of its affluent local catchment, which has continued to support retail spending despite broader economic uncertainties.
The strip’s success reflects the broader strength of Perth’s western suburbs property market, where sustained residential price growth has bolstered household wealth and discretionary spending capacity. This dynamic has been particularly pronounced in Cottesloe, where the combination of lifestyle appeal and proximity to the CBD continues to attract both residents and visitors.
Investment demand for Napoleon Street assets remains consistently strong, though opportunities are limited due to the tightly held nature of the market. The strip’s proven resilience and quality tenant mix continue to attract interest from both local private investors and interstate buyers seeking exposure to Perth’s premium retail markets.
*estimate
Napoleon Street continues to distinguish itself within Perth’s retail landscape through its unique tenant composition, with clothing and soft goods maintaining a dominant 35.02% share of retail space. This concentration has strengthened compared to previous years, reinforcing the strip’s reputation as a high-street fashion destination.
The cafe and restaurant segment represents 23.37% of retail space, reflecting growing demand for lifestyle and experiential offerings. This growth caters to both the local community and the strip’s role as a destination for visitors.
Other personal and household goods account for 21.05% of the retail space, primarily driven by jewellery retailers and specialty goods that complement the strip’s fashion-forward identity. Services represent 7.97% of the total mix, maintaining a deliberately limited presence that preserves the strip’s character as a fashion and lifestyle precinct rather than a convenience-focused retail location.
The retail mix also includes furniture and housewares at 7.29%, recreational goods at 3.40%, and specialised food retailing representing a minimal presence. This composition reflects the strip’s successful adaptation
Retail vacancy (sqm)
The Subiaco retail market has achieved significant progress in 2025, with vacancy rates declining to 8.52% from 10.76% in the previous year. This improvement represents the continuation of a positive trend that has seen the strip gradually recover from the challenges experienced in recent years.
Subiaco maintains its strong reputation as a hub serving residents, workers, and visitors alike. The investment climate remains diverse, attracting both local investors and owner-occupiers seeking quality spaces for small businesses. This renewed interest is further bolstered by substantial gains in local residential property values, with both houses and units experiencing notable appreciation over recent years.
The area’s retail strip is steadily reclaiming its position as a dynamic and attractive destination, reflecting the broader resurgence of the local property market and community confidence. The continued presence of major tenants including banks and established food operators provides stability to the strip’s tenant mix.
Rokeby Road continues to evolve, with notable shifts in its retail composition reflecting changing consumer preferences and market dynamics. The clothing sector now represents a slightly increased 11.26% occupancy, maintaining its reduced presence from previous years as consumers continue to favour online channels for fashion retail.
Food-related businesses have experienced seen some consolidation, with cafes and restaurants now accounting for 20.83% of retail space, while specialised food retailing represents 6.55%. This combined food and beverage segment of over 27% aligns with local demographic preferences and the strip’s role as a dining destination.
The “other personal and household goods” sector remains strong at 24.01%, reflecting sustained discretionary spending in the area. Services maintain a steady presence at 12.62%, with banks continuing to be major tenants along the strip, complemented by medical and beauty services.
The furniture, housewares, and appliances sector represents 6.82% of retail space, while recreational goods account for 3.75%. This diverse mix of retail and service offerings underscores Rokeby Road’s adaptation to changing consumer needs and local market dynamics, creating a vibrant and varied shopping precinct.
Supermarket & Grocery
Specialised food retailing: 14.88%
Cafes and restaurants: 49.68%
Clothing & soft goods: 4.40%
Furniture, housewares & applicances: 2.71%
Recreational goods: 3.72%
Other personal & household goods: 8.39%
Services: 4.05% Pubs, tavens & bars: 6.18%
5.99%
The Leederville strip has maintained stable performance with vacancy rates of 5.99% in 2025, representing consistency from the previous year’s level. Oxford Street continues to be a vibrant location, particularly known for its strong food and beverage offering that has cemented the street’s reputation as a dining destination.
The area’s resilience is evident in its ability to attract tenants and maintain appeal through its focused positioning as a food-driven precinct. The strip benefits from its proximity to local employment centres and its established reputation among both the local workforce and after-work dining crowd.
Investment activity remains selective, with yields typically ranging between 5-7%, reflecting the area’s ongoing appeal to investors and its potential for future growth. The strip’s specialised positioning has provided resilience against broader retail challenges while capitalizing on the continued growth in experiential dining.
Oxford Street has solidified its transformation into a predominantly food-driven precinct, with cafes and restaurants now occupying 49.68% of all tenancies. This
concentration capitalizes on the local workforce and after-work crowd, cementing the street’s reputation as Leederville’s primary dining destination.
The specialised food segment is expanding to 14.88%, offering a diverse mix of takeaway options, luxury consumables, and specialty grocery items catering to the high daytime population. This segment complements the broader food offering and enhances the strip’s appeal to both workers and residents.
Clothing and soft goods represent just 4.40% of retail space, reflecting the continued decline of traditional retail categories in favour of the strip’s dining focus. Other personal and household goods account for 8.39% of the mix, while recreational goods represent 3.72%.
Services remain a limited portion of the strip at just 4.05%, highlighting Oxford Street’s distinctive positioning as a food and dining hub rather than a service-oriented retail location. This composition reflects a strategic alignment with local demographics and consumer preferences, positioning the street as a vibrant culinary destination within Perth’s retail landscape.
Beaufort Street has achieved its strongest performance since the inception of the retail strip survey, with vacancy declining to 4.06% in 2025 from 7.85% in the previous year. This remarkable improvement represents the lowest vacancy rate recorded for this location, with just 5 vacant shops across the 123-shop precinct.
The strip’s recovery reflects the broader improvement in local economic conditions, including enhanced office activity that has contributed to increased foot traffic during daytime hours. Unlike other strips in the survey, Beaufort Street maintains a diverse mix of businesses without being dominated by any single retail category, contributing to its resilience and broad market appeal.
The area has benefited from the national trend toward services, which have proven instrumental in driving in-store customer traffic. This shift has been particularly important given the ongoing competition from online retail in traditional goods categories.
Beaufort Street’s diverse retail landscape reflects its successful adaptation to changing market conditions, with cafés and restaurants representing 29.45% of retail space. The specialised food retailing segment accounts for 7.87%, indicating strong local demand for unique culinary offerings and gourmet products.
Services also dominate the retail composition at 21.18%, particularly in beauty and hairdressing categories that play a crucial role in attracting customers to the strip. This high proportion of service businesses provides stability and regular foot traffic generation.
The clothing and soft goods sector has continued to reduce to 4.80% of retail space, while other personal and household goods represent 5.78%. Furniture, housewares, and appliances account for 1.22% of the mix, and recreational goods represent 4.04%.
The buoyant housing market has bolstered consumer confidence, reflected in increased retail expenditure across multiple categories. Beaufort Street maintains a stronger presence of furniture, housewares, recreational goods, and personal household items compared to other areas, aligning with growing population and rising property values as residents continue to invest in their homes.
Supermarket & Grocery: 2.35%
Specialised food retailing:
Cafes and restaurants: 25.37%
Clothing & soft goods: 8.80%
Furniture, housewares & applicances: 1.02%
Recreational goods: 5.73%
Other personal & household goods: 7.11%
Services: 36.86%
Pubs, tavens & bars: 11.20%
0.85%
Retail vacancy (sqm)
Scarborough Beach Road has achieved exceptional performance with vacancy declining to just 0.85% in 2025, representing one of the lowest vacancy rates across all surveyed retail strips. This outstanding result reflects the strip’s strong appeal and the continued economic resilience of the Mount Hawthorn area.
The strip’s success extends beyond local residents, attracting a dynamic workforce from surrounding areas. This diverse patronage contributes to consistent foot traffic, supporting the varied retail offerings and enhancing overall vibrancy. The exceptional occupancy levels observed underscore the location’s popularity as both a local shopping destination and thriving community hub.
Investment opportunities remain notably scarce, with many properties held long-term or passed down through generations. This tight market condition creates a highly competitive environment for potential investors, with yields typically sitting at the lower end of the retail strip range, reflecting both high demand and perceived stability of investments in this prime location.
Retail mix
Scarborough Beach Road has firmly established itself as a services hub with 36.86% of uses devoted variety of service orientated tenancies in particular in the health,
beauty and wellness sectors. The high proportion of service-oriented establishments enhances the strip’s diverse appeal and supports its role as a comprehensive neighbourhood retail destination.
Food remains a big focus also for the strip with cafes occupying 25.37% of retail space and pubs and bars accounting for an additional 11.20%. This concentration of hospitality venues underscores the strip’s reputation as a vibrant social and culinary destination.
Other personal and household goods represent 7.11% of the retail space, while recreational goods account for 5.73%. Clothing and soft goods maintain a minimal presence, reflecting the strip’s specialisation in food, beverage, and service offerings rather than traditional retail categories.
The buoyant local housing market has generated increased wealth for many area families, reflected in heightened consumer spending particularly in the food and beverage sector. This economic strength, combined with the strip’s established reputation, positions Scarborough Beach Road as a prime example of successful suburban retail strip performance.
Retail vacancy (sqm)
Albany Highway has demonstrated solid performance with vacancy rates declining to 3.76% in 2025, representing a significant improvement from the 10.40% recorded in the previous year. This substantial reduction in vacancy reflects the strip’s growing appeal and successful tenant attraction strategies.
The strip has benefited from enhanced streetscape improvements and increased local activity that have contributed to greater foot traffic throughout the week. The area’s retail environment has evolved to better serve both the local community and workers from surrounding areas, establishing itself as a viable neighbourhood retail destination.
Investment interest in the precinct has grown alongside the improved occupancy rates, with the combination of better performance metrics and the area’s potential for continued development making it increasingly attractive to both local and interstate buyers seeking opportunities in Perth’s retail strip market.
Albany Highway’s retail composition is heavily weighted toward food and beverage operations, with cafés and restaurants representing 42.62% of all tenancies. This concentration has established the strip as a significant dining destination, catering to both local residents and the growing workforce in the area.
Services account for 32.70% of tenancies, providing a comprehensive range of everyday amenities including hairdressers, barbers, real estate agencies, and healthcare providers. This high proportion of service businesses ensures regular foot traffic and supports the strip’s role as a community hub.
Specialised food retailing represents 8.45% of the tenant mix, offering specialty groceries and gourmet products that complement the broader food offering. Recreational goods account for 2.82% of tenancies, while furniture, housewares, and appliances represent 2.48% of retail space.
Pubs and bars comprise 4.70% of the businesses, contributing to the area’s evening economy and social atmosphere. Other personal and household goods maintain a smaller presence at 1.11%, while clothing and soft goods represent just 0.60% of the retail space. This retail composition positions Albany Highway as primarily a food and service destination, reflecting successful adaptation to changing consumer preferences and local market dynamics.
Supermarket & Grocery: 0.69%
Specialised food retailing: 2.08%
Cafes and restaurants: 35.49%
Clothing & soft goods
Furniture, housewares & applicances
Recreational goods: 4.49%
Other personal & household goods: 9.75%
Services: 16.25%
Pubs, tavens & bars: 11.16%
Vacant: 20.09%
South Terrace maintains the highest vacancy rate among surveyed areas at 20.09% in 2025, though this represents a marginal worsening from the previous year’s 20.00%. The strip continues to face challenges related to its dependence on tourism and visitor traffic, which have been slower to recover to pre-pandemic levels.
Despite these challenges, South Terrace retains its unique character and diverse business mix, with several establishments having achieved institutional status after operating for many years. This long-standing presence contributes significantly to the area’s distinctive appeal and helps maintain a connection to Fremantle’s rich history and culture.
Recent improvements in local activity have sparked increased business interest, signalling potential for gradual recovery. The strip’s broad appeal to both locals and visitors, combined with its diverse mix of businesses, positions it for potential improvement as tourism recovers and local patronage increases.
*estimate
South Terrace’s retail composition remains oriented toward its strengths as a dining and socializing destination, despite the challenging vacancy environment. Cafes and restaurants account for 35.49% of occupied spaces, reflecting the area’s continued appeal as a culinary destination within Fremantle’s hospitality landscape.
Services represent 16.25% of the business mix, providing offerings for both residents and tourists. The presence of traditional services alongside tourismoriented businesses reflects the strip’s dual role serving both local and visitor markets.
Pubs and bars comprise 11.16% of the businesses, underscoring South Terrace’s important role in Fremantle’s nightlife and social scene. Specialised food retailing accounts for 2.08% of the mix, while other categories maintain smaller presences due to the elevated vacancy levels.
This retail mix, while facing occupancy challenges, still embodies the essence of Fremantle’s laid-back, culturally rich atmosphere. The high proportion of food and beverage outlets, combined with the area’s historical significance, positions South Terrace to