THE INSIGHT

Perth Office Market Overview
RWC WA | March 2025


Perth Office Market Overview
RWC WA | March 2025
The Perth office market is demonstrating clear signs of recovery in early 2025, outperforming east coast markets across key metrics.
Perth CBD has recorded 25,186sqm of positive absorption over the past six months, ranking second nationally behind only Sydney CBD (46,234sqm), while West Perth has stabilised with minimal absorption of 18sqm, essentially maintaining equilibrium after previous periods of stronger take-up.
Perth CBD’s vacancy rate has improved to 14.9%, though with notable spread across quality grades – Premium at 9.4%, A-grade at 14.2%, and B-grade facing greater challenges at 21.3%. West Perth maintains its position as one of Australia’s better-performing non-CBD markets with vacancy at 11.8%, significantly below the non-CBD average of 17.2% and well ahead of struggling markets like Crows Nest/St Leonards (30.5%).
Face rents continue their upward trajectory with CBD prime rates now reaching $655/sqm and secondary at $556/sqm, representing significant growth of 12.3% since their 2022 lows. This rental growth is occurring despite persistently high incentives in the 40-50% range, highlighting improving market sentiment and rising construction costs establishing new economic rent thresholds.
Investment transaction volumes have contracted dramatically to just $177.4 million in 2024 ($125.6 million in CBD, $51.7 million in West Perth), the lowest level since COVID-impacted 2020. However, yields have shown early signs of stabilisation, with Perth CBD prime yields compressing slightly to 7.50% in December 2024 after two years of expansion.
Total office returns for Perth CBD have turned positive at approximately 1.5%, contrasting sharply with Sydney and Melbourne CBDs still experiencing significant negative returns approaching -10%. This performance divergence, combined with improving leasing fundamentals, suggests Perth is transitioning from trough to early recovery phase in the property cycle ahead of east coast markets, potentially offering counter-cyclical opportunities as broader market sentiment catches up with improving operational metrics.

Net supply (2024) = 26,507sqm
Net absorption (2024) = 15,375sqm
Future supply completions (12 months)
Refurbishment 7,639m2 New Stock 33,554m2
Net Face Rents
Investment Yield
“Perth CBD enjoys more occupied stock today than prior to COVID, one of the few Australian CBD’s who have grown their tenanted demand.”
Source: Property Council of Australia, Ray White Commercial
Where has the office demand been?
Six monthly, net absorption (sqm)
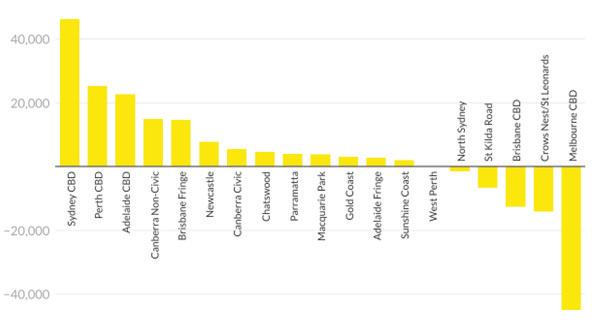
Source: Ray White * Property Council of Australia OMR January 2025
The latest Property Council data reveals Perth CBD as a standout performer with 25,186sqm of net absorption, ranking second nationally behind only Sydney CBD (46,234sqm). This performance is particularly impressive considering Perth’s smaller market size relative to Sydney.
Perth’s strong showing aligns with other secondary markets including Adelaide CBD (22,606sqm) and Canberra Non-Civic (14,867sqm), collectively outperforming traditional powerhouse locations.
The contrast with struggling east coast markets is stark. Melbourne CBD recorded an alarming -44,962sqm of negative absorption, while Brisbane CBD (-12,646sqm), Crows Nest/St Leonards (-14,037sqm), and St Kilda Road (-6,702sqm) all continued to lose tenants.
West Perth has stabilised with a modest positive absorption of 18sqm, essentially maintaining equilibrium after previous periods of tenant loss. This stability positions West Perth favourably compared to struggling markets like North Sydney (-1,489sqm).
The data highlights Perth’s continued outperformance relative to other major office markets, reflecting its earlier recovery trajectory and stronger office attendance rates compared to east coast cities still grappling with hybrid working challenges.
Perth CBD leads the office recovery - total office returns
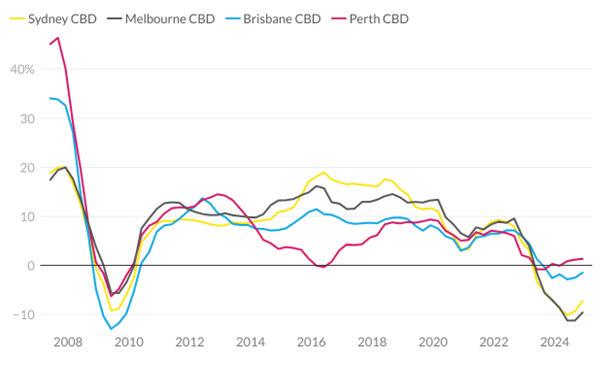
Chart: Ray White • Source: MSCI
Total office returns reveals Perth CBD as the first major market to emerge from negative territory, recording a modest positive return of approximately 1.5% by early 2025. This recovery contrasts sharply with Sydney and Melbourne CBDs, both still experiencing significant negative returns approaching -10%.
Perth’s earlier cycle position reflects its unique market fundamentals, including stronger absorption, stabilising vacancy rates, and improving rental growth. This recovery trajectory mirrors historical patterns where Perth has typically followed different cycle timing than east coast markets, often influenced by its resources-driven economy.
Brisbane CBD shows early signs of stabilisation at -2%, positioning it between Perth’s recovery and the continued challenges facing southern markets. This divergence in performance suggests a two-speed office recovery is underway nationally.
What’s particularly noteworthy is Perth’s recovery emerging despite elevated vacancy rates, highlighting the forward-looking nature of total returns as investors begin pricing in expectations of improving fundamentals. This pattern suggests Perth may be transitioning from trough to early recovery phase in the property cycle, potentially offering first-mover advantages for investors seeking to position ahead of a broader market turnaround.
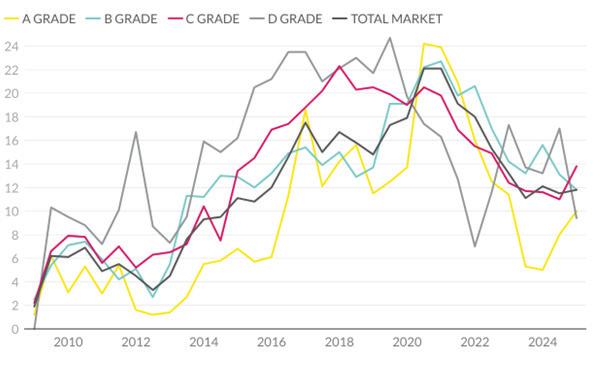
Total vacany by quality grade (%)
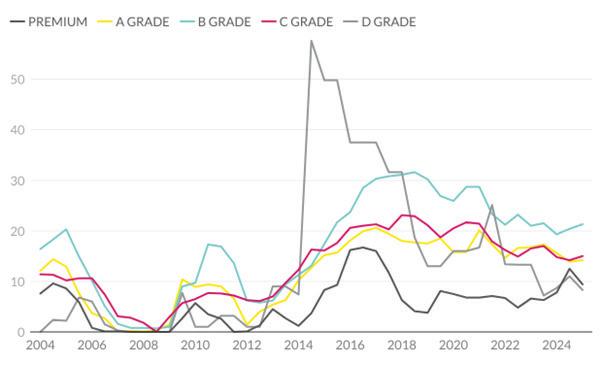
The long-term vacancy data by grade reveals the persistent flight to quality trend across Perth’s office market. Premium grade vacancy has increased to 9.4% in January 2025, up from 7.8% in January 2024, likely reflecting new supply additions at the top end of the market, while A-grade has improved to 14.2%.
B-grade continues to face the greatest challenges with vacancy at 21.3%, showing the widening gap between prime and secondary assets. C-grade space has maintained relative stability at 15.0%, while D-grade has decreased to 8.3%, though this smaller segment often experiences greater volatility.
Examining the historical pattern since 2014 shows the cyclical nature of Perth’s flight to quality, with premium grade consistently outperforming despite occasional fluctuations. The recent convergence in rates between premium and other grades from 2022-24 has begun to widen again, highlighting renewed tenant selectivity.
This polarisation reflects growing tenant preference for buildings with superior sustainability credentials, modern amenities, and flexible configurations. As ESG considerations become increasingly central to corporate occupier decisions, this quality gap is likely to persist despite the overall market recovery underway.
Take up back in postitive territory across Perth CBD
Six monthly net absorption (sqm)
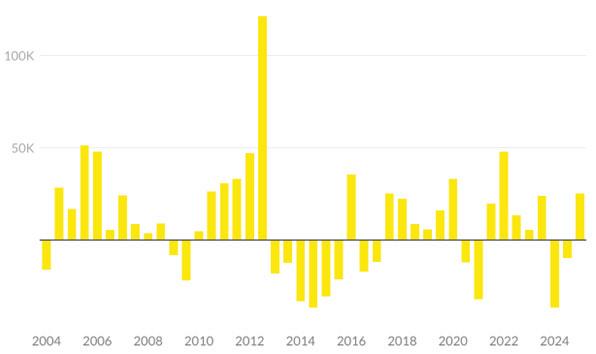
Perth CBD has returned to positive absorption territory with 25,186sqm of take-up in the six months to January 2025, marking a significant recovery from the -9,811sqm recorded in the previous period. This rebound continues the market’s generally positive trajectory since 2018, despite occasional negative quarters.
The long-term absorption pattern reveals Perth’s cyclical nature, with the current uptick resembling previous recovery phases in 2006, 2010-11, and 2019-20. While not matching the extraordinary peak of 121,202sqm in July 2012, the current positive absorption represents healthy demand in the context of challenging national office conditions.
This renewed take-up is being driven by tenants’ growing preference for quality offerings that satisfy ESG requirements, with Premium and A-grade spaces commanding the strongest interest. Many occupiers are using the opportunity to upgrade their accommodation, often growing their footprints modestly as they lock in highquality space at relatively affordable rates compared to previous cycles.
The affordability factor remains crucial, with incentives still elevated at 40-50%, enabling tenants to secure superior premises with minimal effective rental increases. This favourable leasing environment is expected to continue supporting positive absorption through 2025 as the flight to quality trend persists.
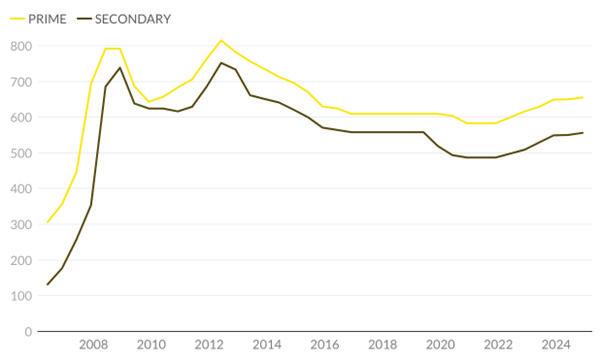
Face rents continue to move upwards inprovements in effective rates
$/sqm net
Source:
Ray White Commercial
Perth CBD office rents have maintained a consistent upward trajectory since mid-2022, with prime rates now reaching $655/sqm and secondary at $556/sqm as of December 2024. This represents the strongest rental growth in over a decade, with prime rents gaining approximately 12.3% since their 2022 low of $583/sqm.
This rental growth is particularly significant given the context of relatively high vacancy rates and persistent incentives in the 40-50% range. The seemingly contradictory trend reflects several market dynamics: rising construction costs establishing new economic rent thresholds, fixed increases in existing leases, and improved tenant enquiry targeting quality assets.
The rental curve shows Perth remains well below previous market peaks of $815/sqm for prime in 2012 and $752/sqm for secondary, indicating substantial room for further growth as market fundamentals continue to improve. The gap between prime and secondary has widened to approximately $100/sqm, reflecting the premium occupiers are willing to pay for superior quality assets with modern amenities and strong ESG credentials.
While effective rental growth remains moderate due to elevated incentives, the positive face rent trajectory provides a clear signal of improving market sentiment and a potential transition toward a more balanced market as absorption continues in positive territory.
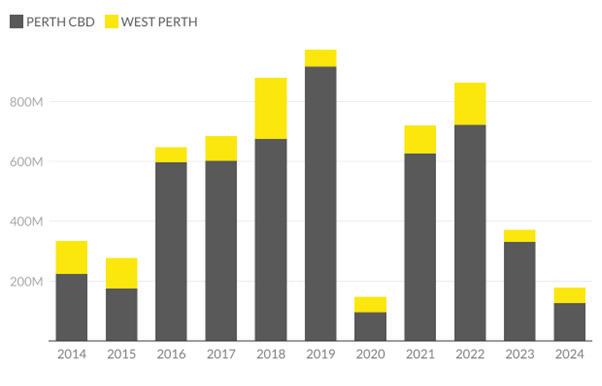
Investment activity across Perth’s office markets has remained subdued through 2024, with total transaction volumes falling to just $177.4 million - the lowest level since COVID-impacted 2020. Perth CBD recorded a mere $125.6 million in sales, while West Perth contributed $51.7 million, continuing the downward trend from $371.9 million in 2023.
This stark decline from the peak of $975 million in 2019 reflects broader market uncertainty, with owners reluctant to crystallise potential losses amid higher interest rates and expanded yields. The lack of transactions is particularly evident in the institutional segment, with private investors dominating activity in the sub-$20 million bracket.
Notable transactions have been limited, with no major institutional-grade assets changing hands in 2024. The market continues to feel the impact of the 2023 half-share sale of Nine The Esplanade ($240 million) to Cbus Property, which accounted for the bulk of that year’s volume.
The transaction drought comes despite improving leasing fundamentals, highlighting the disconnect between operational performance and investment sentiment. As Perth’s rental growth continues and absorption maintains positive territory, this pattern suggests a potential opportunity for counter-cyclical investors willing to move ahead of broader market recovery.
Average yields by quality grade/location (%)
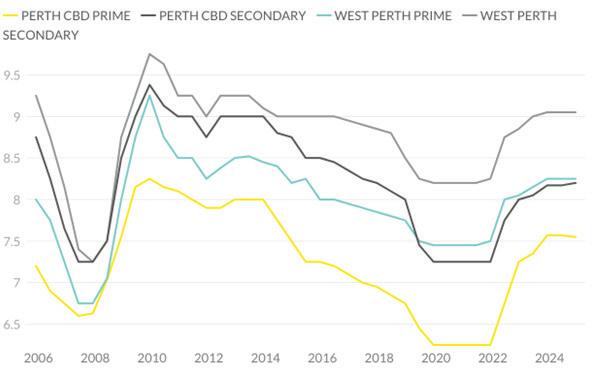
The yield trend data provides compelling evidence that Perth’s office market may be approaching an inflection point in the property cycle. After two years of consistent expansion, Perth CBD prime yields have stabilised at 7.50% in December 2024 with limited evidence to support major movement.
The broader market context reveals a classic cyclical pattern, with the current yield trajectory closely resembling previous cycle transitions, particularly the 2009-10 period following the GFC. Secondary grade assets across both CBD (8.20%) and West Perth (9.05%) have maintained stable yields over the past six months, suggesting the market may have reached equilibrium after the significant expansion from their 2021 troughs.
The stabilisation of yields, combined with the positive absorption and rental growth evident in other metrics, strongly indicates Perth is transitioning from trough to early recovery phase. While yields remain well above their 2020-21 lows of 6.25%, the recent stabilisation suggests investor sentiment may be improving ahead of broader market fundamentals.
This early cycle positioning potentially offers counter-cyclical opportunities for investors willing to move ahead of clearer recovery signals, particularly in prime assets where the positive leasing momentum is strongest.
West Perth Vacancy
Sub-lease vacancy 0.6%
Face Rents
Net absorption (2024) 2,572m² | Net supply 1,363m²
“Annual take up in positive territory the past four years”
Source: Property Council of Australia, Ray White Commercial
Average Incentives range up to 50%
West Perth one of the better non - CBD markets
Total vacancy
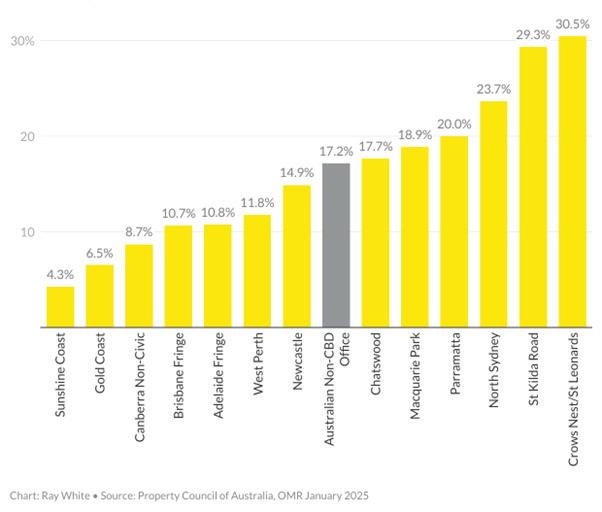
West Perth continues to outperform the majority of non-CBD office markets nationally, maintaining a competitive vacancy rate of 11.8% as of January 2025. This positions it significantly below the Australian nonCBD average of 17.2% and substantially ahead of struggling markets such as Crows Nest/St Leonards (30.5%) and St Kilda Road (29.3%).
West Perth’s relative strength is particularly evident when compared against traditionally prominent non-CBD markets like North Sydney (23.7%), Parramatta (20.0%), and Macquarie Park (18.9%). Only leisure-lifestyle oriented coastal markets including Sunshine Coast (4.3%), Gold Coast (6.5%), and Canberra Non-Civic (8.7%) demonstrate significantly stronger occupancy levels.
This favourable positioning reflects West Perth’s loyal tenant base, many of whom value its proximity to the CBD, superior parking ratios, and relative affordability. The precinct continues to attract professional services firms and resource sector support businesses seeking quality space without CBD rental premiums.
West Perth’s consistent performance amid challenging national conditions highlights its resilience and established position within Perth’s broader office hierarchy. As hybrid working practices stabilise and occupiers increasingly consider office locations based on staff preferences, West Perth’s balanced offering continues to resonate with a significant segment of the market.
Mixed results across West Perth
Total vacancy by quality grade (%)
West Perth vacancy data reveals divergent performance across quality grades as the market maintains overall stability at 11.8% in January 2025. The most notable shift has occurred in A-grade, where vacancy has doubled from 5.0% to 10.0% over the past year, though still performing strongly compared to historical averages.
B-grade has shown improvement, decreasing from 15.6% to 11.8%, while C-grade has increased modestly to 13.8%. D-grade demonstrates the strongest performance at just 9.4%, though this smaller segment typically experiences greater volatility.
The long-term trend shows West Perth’s remarkable recovery from peak vacancy of 24.2% for A-grade in July 2020 and 22.1% overall. The current pattern of mixed performance by grade suggests a market recalibration rather than deterioration, with West Perth maintaining substantially better occupancy than comparable nonCBD markets nationally.
This volatility across grades reflects tenant movement within the precinct as occupiers reposition and reconsider space requirements. Despite these fluctuations, West Perth’s total vacancy has remained relatively stable between 11-12% over the past two years, demonstrating underlying market resilience even as individual grade performance varies quarter to quarter.
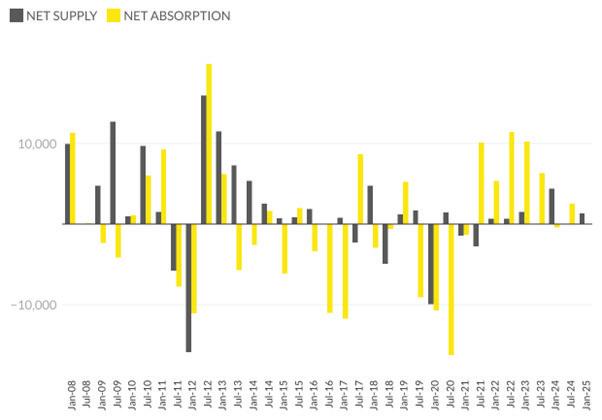
West Perth’s supply and absorption dynamics reveal a market in delicate balance. The latest data shows minimal absorption of just 18sqm in January 2025, essentially a break-even position following modest positive absorption of 2,553sqm in the previous period. This stability comes alongside modest net supply additions of 1,363sqm.
Looking at the longer-term pattern, West Perth has demonstrated resilience with generally positive absorption since mid-2021, following a challenging period during 2019-20 when the market experienced significant negative take-up. The strong positive absorption results of 2022-23 (reaching 11,499sqm in July 2022 and 10,239sqm in January 2023) have moderated but remained generally positive.
Supply additions have been measured, with the most significant recent change being the 4,402sqm added in January 2024, likely representing the completion of refurbished assets. This controlled supply pipeline has helped maintain market equilibrium despite fluctuating demand.
The data suggests West Perth is primarily a refurbishment market rather than one driven by new development, with periodic withdrawals for upgrading helping to manage overall stock levels. This approach has contributed to the market’s relative stability compared to other non-CBD locations nationally.
The Perth office market enters 2025 demonstrating clear signs of recovery ahead of east coast counterparts. Perth CBD’s strong absorption of 25,186sqm positions it as the second-strongest market nationally, while total returns have turned positive, marking the market’s transition from trough to early recovery phase.
Face rents continue their upward trajectory with CBD prime rates reaching $655/sqm, representing 12.3% growth since 2022 lows. While incentives remain elevated at 40-50%, this rental growth combined with stabilising yields at 7.50% for prime CBD assets suggests improving market sentiment despite persistently high vacancy rates.
The polarization between quality grades continues, with premium and A-grade assets commanding stronger demand, yet unlike the peak of the flight to quality trend, B and C-grade vacancies are stabilising rather than deteriorating further. This broader market improvement reflects Perth’s more limited exposure to hybrid working challenges compared to east coast cities.
West Perth maintains its position as one of Australia’s better-performing non-CBD markets with 11.8% vacancy compared to the non-CBD average of 17.2%. Its mixed performance across grades - with A-grade increasing to 10.0% while B-grade improves to 11.8% - suggests tenant movement within the precinct rather than market deterioration.
Investment activity remains subdued with 2024 volumes at just $177.4 million across both markets, a reflection of broader uncertainty rather than deteriorating fundamentals. This disconnect between improving operational metrics and cautious investment sentiment potentially creates counter-cyclical opportunities.
Looking ahead, Perth appears positioned ahead of east coast markets in the recovery cycle. With continued positive absorption, moderating vacancy rates and sustained rental growth, 2025 may mark the beginning of a genuine recovery phase. The primary challenges will be the pace of incentive reduction and the impact of new supply, with approximately 45,000sqm of new stock scheduled for completion, potentially limiting the speed of vacancy compression despite the positive absorption trajectory.
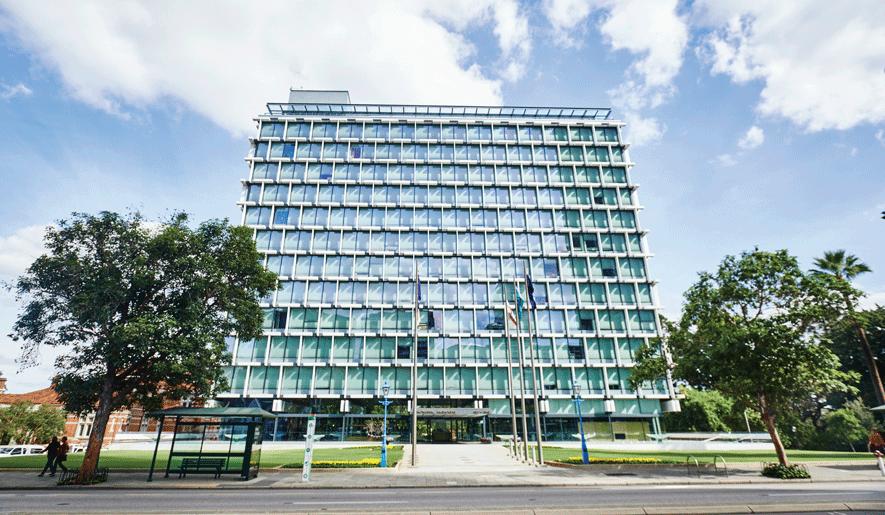
Council House, Level 3, 27 St Georges Terrace, Perth - Whole floor 750m2*
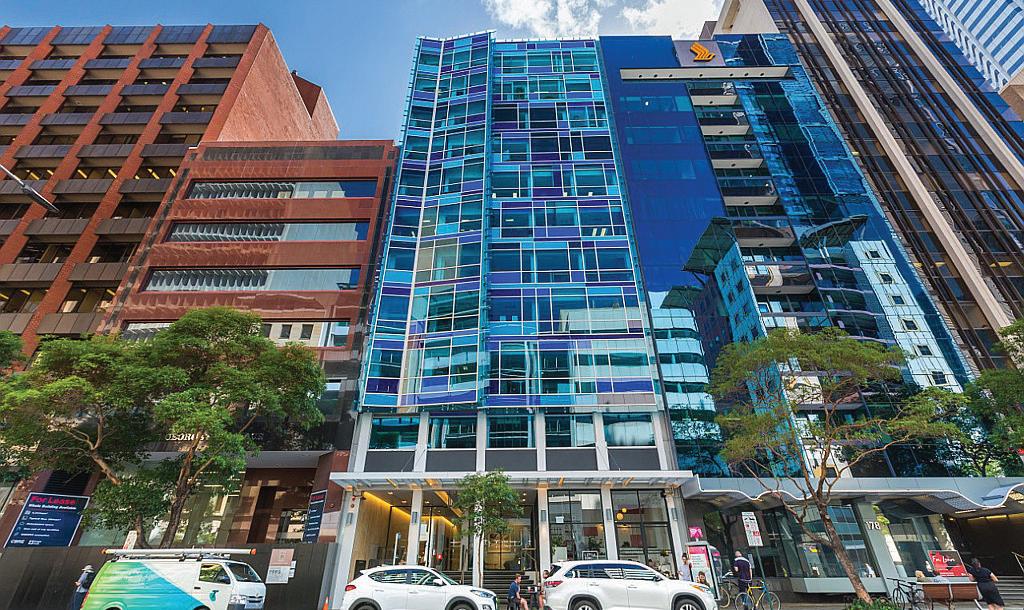
182
Various areas from 120m2*
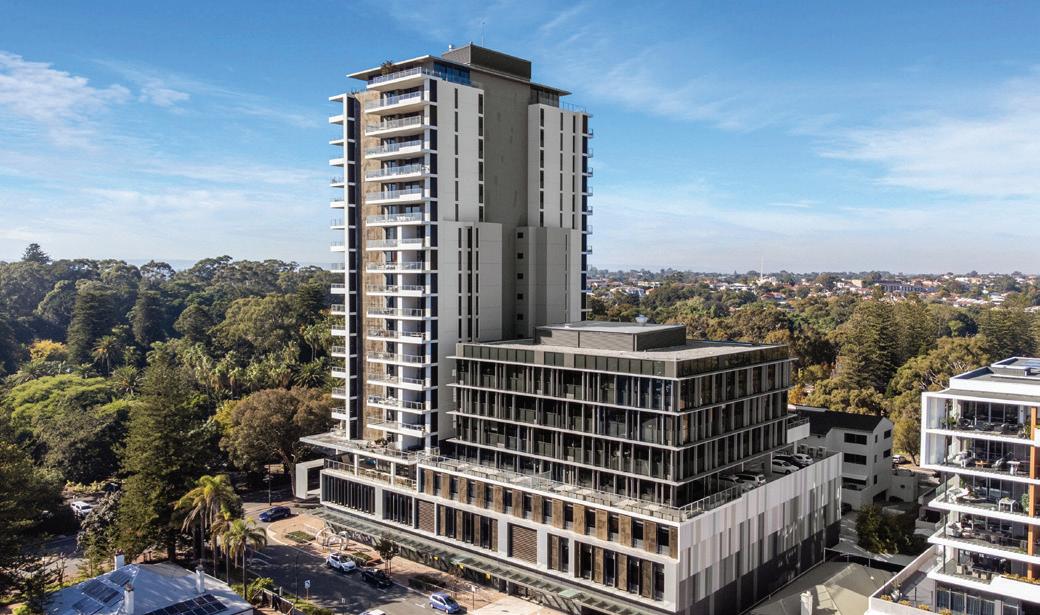
30 - 34 Charles Street, South Perth
Various areas from 120m2*
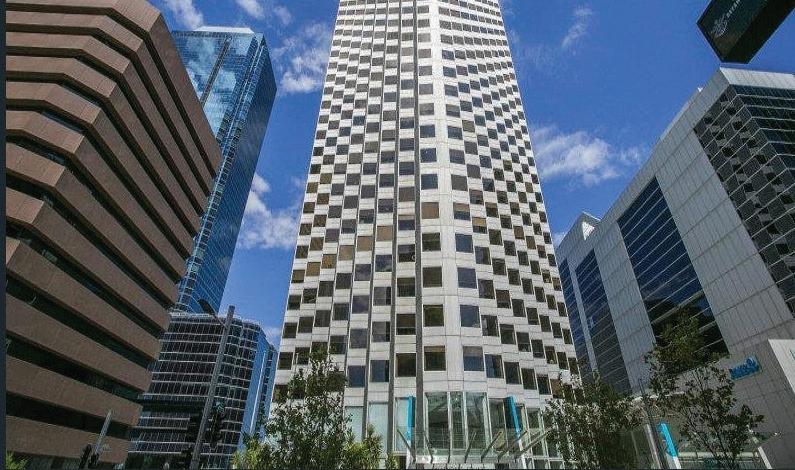
Level 20, 77 St Georges
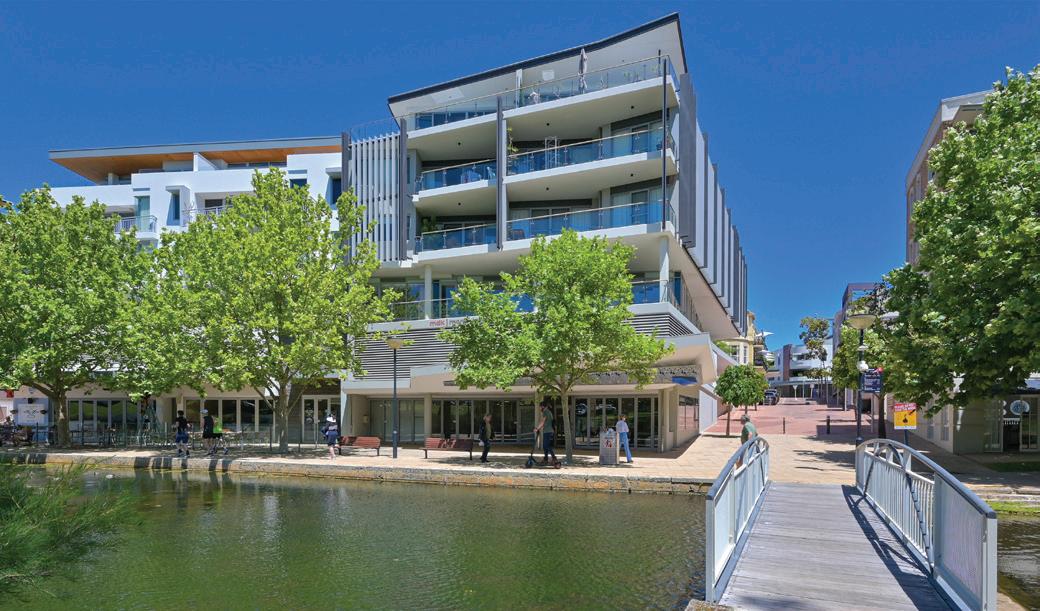
Level 1, 26 Eastbrook Terrace, East Perth

Luke Pavlos
Director | Commercial Services 0408 823 823 luke.pavlos@raywhite.com
Brett Wilkins
Director of Capital Markets 0478 611 168 brett.wilkins@raywhite.com

Stephen Harrison Joint Managing Director 0421 622 777 stephen.harrison@raywhite.com
Andrew Woodley-Page Capital Markets 0438 939 869 andrew.woodley-page@raywhite.com