In recent years, the global community has witnessed a significant upsurge in the frequency and intensity of wildfires. Driven by a combination of climate change, urban expansion, and land-use practices, these fires have not only devastated vast natural landscapes but have also encroached upon urban environments, posing unprecedented threats to infrastructure, economies, and human lives. The confluence of increasing temperatures, prolonged droughts, and anthropogenic factors has rendered traditional fire fighting techniques and prediction models less effective, necessitating innovative approaches to address this burgeoning crisis.
Beyond the major costs in lives, property, and the economy there’s also a big carbon impact to wildfires. As an example, the additional carbon from California’s 2020 wildfires was greater than the carbon that Californians worked to save over the previous two decades (Whitesides, 2023).
In many regions, particularly in data-poor cities, the absence of comprehensive and timely information exacerbates the challenges faced during wildfire outbreaks. These cities often lack the infrastructure or resources to collect and process vast amounts of data required for effective wildfire prediction and management. The proposed methods, utilizing drones and artificial intelligence (AI), offers a transformative solution to this gap. By leveraging the agility of drones and the predictive power of AI, this system can provide near-real-time analytics, even for areas previously constrained by data limitations. As a result, these data-poor cities can benefit from enhanced wildfire prediction and response capabilities, ensuring more timely interventions.
Through a series of proposed data analytics and simulations this research underscores the potential of integrating modern technology into wildfire management. By offering tools that cater to both well-resourced and datapoor environments, this approach paves the way for more resilient urban landscapes in the face of increasing fire threats.
This research seeks to harness the power of drone-based photogrammetry and artificial intelligence to create a low-cost urban wildfire diagnostic tool. By interpreting this data with AI, we aim to identify, categorize, and diagnose urban structural and environmental issues effectively, ultimately promoting sustainable urban development.
Chapter 2, "Workflow," introduces the structured process of integrating drone and AI technologies, laying the foundation for subsequent analytical chapters. Chapter 3, "Vegetative Pathways: Analysing Fire Propagation," delves into the intricate relationships between vegetation and their role in fire spread, while Chapter 4, "Slope and Aspect Analysis, Terrain's Role in Wildfire" investigates the topographical influences on wildfire direction and intensity. As urban interfaces become more prevalent in fire-prone regions, Chapter 5, "Building Density in Fire Spread," examines how urban structures and their density can exacerbate or mitigate fire progression. "Categorized Combustion" in Chapter 6 classifies different combustion types and their behaviour, essential for refining predictive models. Lastly, Chapter 7, "Proximity Patterns and Fire Propagation," explores the spatial dynamics of fire spread, emphasizing the patterns of proximity between urban and wild landscapes.
This research serves not merely as an academic exercise but as the foundation for a proof of concept with tangible, real-world applications. The methodologies and findings presented offer a blueprint for the development of a commercial-grade product, aiming to revolutionize wildfire management. As urban-wild interfaces grow and the threat of wildfires intensifies, the commercial adaptation of this research can provide invaluable tools for both data-rich and data-poor regions, ushering in a new era of proactive and informed wildfire response.
RAY HARLI
EUGENIA RAIGADA
Eugenia + Ray Founders of FIreFly
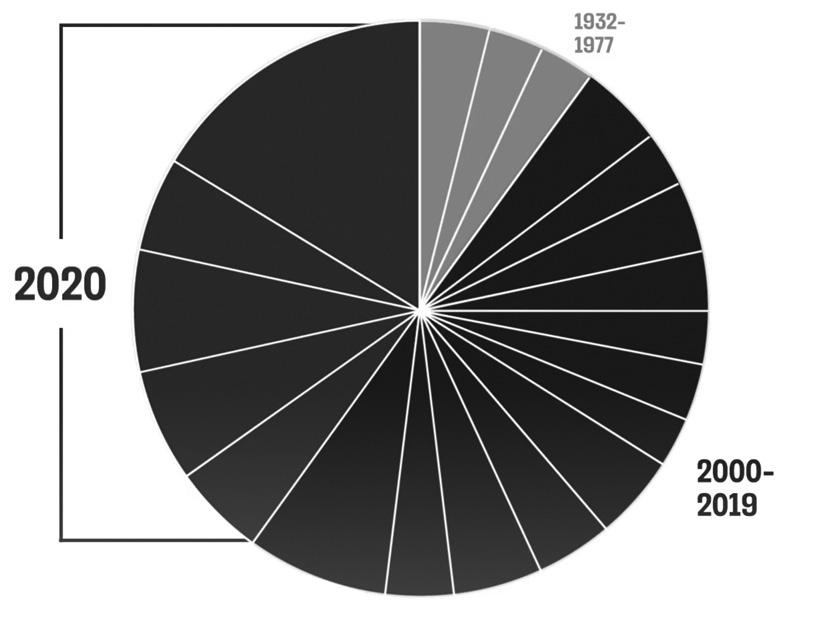
California’s Largest Wildfires
(Whitesides, 2023)
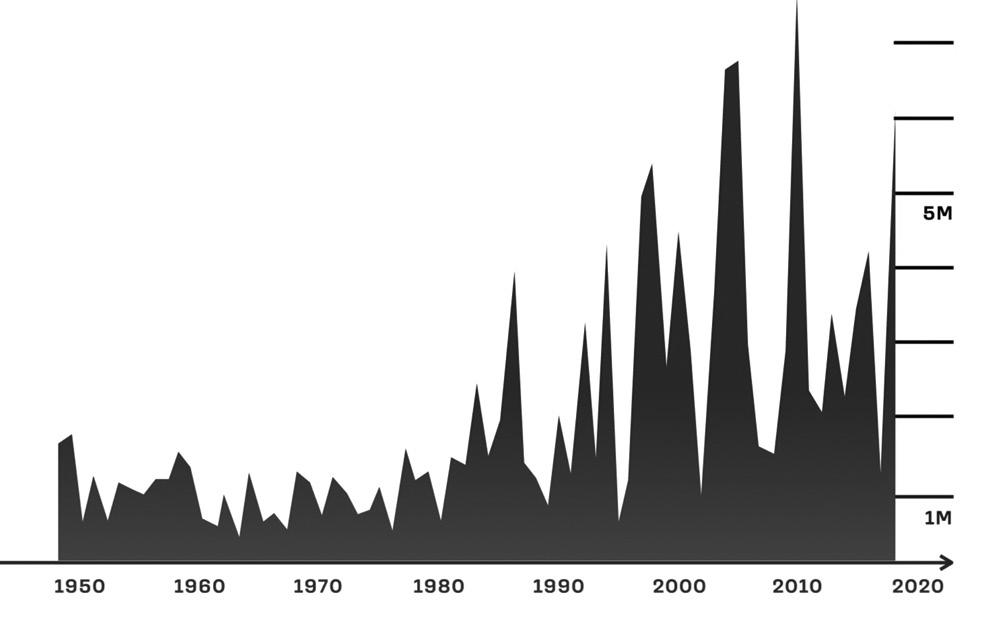
Annual U.S. Acreage burned by wildfires
Eight of the ten largest megafires in California's history have happened in just the last five years.
(Whitesides, 2023)
ESTIMATED INCREASE BY 2100 +30% +50%
ESTIMATED INCREASE BY 2050
(Whitesides, 2023)
The escalating ferocity and frequency of wildfires, particularly in regions like California, have sounded global alarm bells, underscoring a critical need for novel, advanced solutions. A testament to this unprecedented surge is the fact that eight of the ten largest megafires in California's recorded history have been witnessed in the fleeting span of the last five years (Whitesides, 2023). This heightened occurrence is not an isolated metric of concern. The economic ramifications of these wildfires are profound; in 2020 alone, the damages inflicted reached a staggering estimate of over $10 billion (Whitesides, 2023)..
Yet, the repercussions of these wildfires are multifaceted, extending far beyond the immediate tangible loss. The plumes of smoke emanating from these blazes have a far-reaching impact, deteriorating air quality across vast territories, sometimes even thousands of miles away from the fire's epicentre. Such conditions in 2020 led to hazardous air quality levels in areas far removed from the immediate fire zones, heightening health risks for populations—especially vulnerable groups like children, the elderly, and those with preexisting health conditions.
The environmental consequences are equally dire. Wildfires, in their wake, leave a trail of ecological destruction—obliterating habitats, endangering myriad species of wildlife, and causing soil erosion. This erosion subsequently imperils water quality in rivers and streams, disrupting
aquatic ecosystems. Moreover, these blazes contribute significantly to carbon emissions. In some instances, the CO2 emissions from wildfires have surpassed the state's entire annual emissions from fossil fuels.
An additional layer of complexity arises with the expansion of communities into wildland areas. This urban-wildland interface has become a nexus of increased fire-related risks. As houses and infrastructure edge closer to traditionally fireprone regions, the challenges of fire prevention, management, and containment multiply. Furthermore, the shadow of climate change looms large, with many experts positing a linkage between changing global temperatures and the exacerbation of fire-prone conditions.
Amidst this intricate and ominous backdrop, the research presented herein seeks to harness the capabilities of artificial intelligence and photogrammetry. By crafting a diagnostic tool to analyse and predict potential fire spread patterns, this study aims to offer a proactive, technologically-driven approach to mitigate the sprawling challenges posed by wildfires.
Current Technologies
A synopsis of current fire risk related applications
The domain of fire risk assessment has seen a surge in technological advancements, with a plethora of tools and software emerging to cater to diverse needs. These tools can be broadly categorized based on their target audience, technological sophistication, and pricing models. Here is a synopsis of the current landscape:
Professional-Grade Tools
These are the heavyweights in the fire risk assessment arena, primarily designed for professionals, businesses, and organizations that require detailed and comprehensive insights.
Compliance-Centric Platforms: Tools such as SafetyCulture Fire Risk Assessment Software and Vision Pro Fire Risk Assessment Software fall under this category. They emphasize ensuring regulatory compliance, offering features that help businesses remain aligned with fire safety regulations. Customizable templates, audit trails, and dashboards are common features, allowing for a tailored approach to risk assessment.
Spatial Analysis Tools: Aurora Fire Risk Assessment Software is a prime example.
It offers unique features like tagging fire risk assessment findings to a floorplan, providing a spatial understanding of potential hazards. This category focuses on visual representation and spatial understanding of risks.
Real-time Monitoring Tools
These tools prioritize providing users with realtime data, often leveraging advanced technologies like satellite sensors.
Satellite-Driven Platforms: The Defensible App is emblematic of this category. It sources data from satellite sensors to detect heat signatures and active fire perimeters, offering users real-time insights into active fire situations.
Location-Based Alerts: Some tools, while offering real-time data, also provide location-specific alerts to users. They might inform users about fire bans, active fires, and other relevant data based on their current location.
Consumer-Oriented Apps
Designed for the general public, these apps aim to democratize fire risk assessment, making it accessible to everyone.
Informative Apps: The Brandrisk Ute app, for instance, not only provides real-time updates on fire risks but also educates users about fire safety. Such apps include features like safety tips, fire bans, and colour-coded fire danger levels.
Interactive Platforms: Some consumer-oriented apps offer interactive features, allowing users to engage with the data. This includes sharing fire danger forecasts, viewing detailed fire safety information, and participating in community-driven data collection.
FireFly
Against this backdrop, our application seeks to bridge the gap between professional-grade tools and consumer-oriented apps. By harnessing the power of AI, it offers detailed insights akin to professional tools while maintaining a userfriendly interface that makes fire risk assessment accessible to all. The goal is to empower users with actionable insights based on a combination of weather data, in-depth risk analysis, and AI-driven predictions, ensuring that everyone, regardless of their technical expertise, can benefit from advanced fire risk assessment.
A comparative list of existing technologies
Workflow
High Level Processes Explained
This chapter explains the overall workflow that has been utilised to create the final summary fire risk analysis. When selecting which tools or libraries to use the decision was always driven by prioritising open-source, existing off-the-shelf technologies. The intention was to combine these technologies in unique and novel ways to produce a low cost easily accessible fire risk analysis tool. The efficiency of these processes is boosted using AI and machine learning and are enriched by new methodologies that are being used for the first time. Our focus for this thesis has been on the back-end data processing side, the details of which are expanded upon in the chapters that follow. The decision on which metrics to analyse was based on research conducted by several groups whose papers summarised the most influential factors determining the spread of fire (see figure 1). We are also focusing on the urban scale. Future research may potentially use similar methodologies for a micro scale analysis (see figure 2).
which will be predominantly done through entry level drones that will strategically capture aerial photographs to be used for 3D reconstruction through photogrammetry1. There are numerous applications such as Drone Deploy that can easily create autonomous drone missions that automate the asset capturing process. We are intentionally avoiding the use of lidar which would necessitate UAVs capable of carrying heavier payloads. ‘Offthe-shelf’ drones such as the DJI Mavic or DJI Air could easily accomplish this initial task.
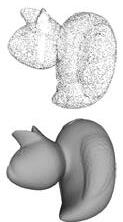
For the 3D reconstruction we made use of Meshroom by AliceVision. AliceVision is an open-source project that is supported by the ALICEVISION association, a non-profit organization whose ambition is to democratize 3D digitization technologies from photographs. The photogrammetry pipeline that is used by AliceVision includes: feature extraction, image matching, feature matching, depth map estimation, meshing, texturing and finally localisation.
Once the 3D mesh has been created it is then converted into a point cloud. To do this we use the
Open3D python library and make use of surface sub-sampling. This method is used to generate a subset of points from the surface of a 3D mesh, rather than just using the vertices. The idea is to create a more detailed and representative point cloud by sampling points across the entire surface of the mesh, including its faces and edges. This method is especially useful when the mesh has a large number of faces. We also incorporate attributes like colour and normals from the mesh into the point cloud, the resulting point cloud captures the visual characteristics of the original mesh, providing a richer and more informative representation.
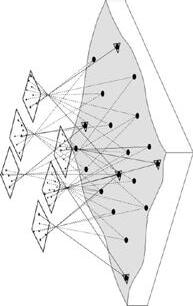
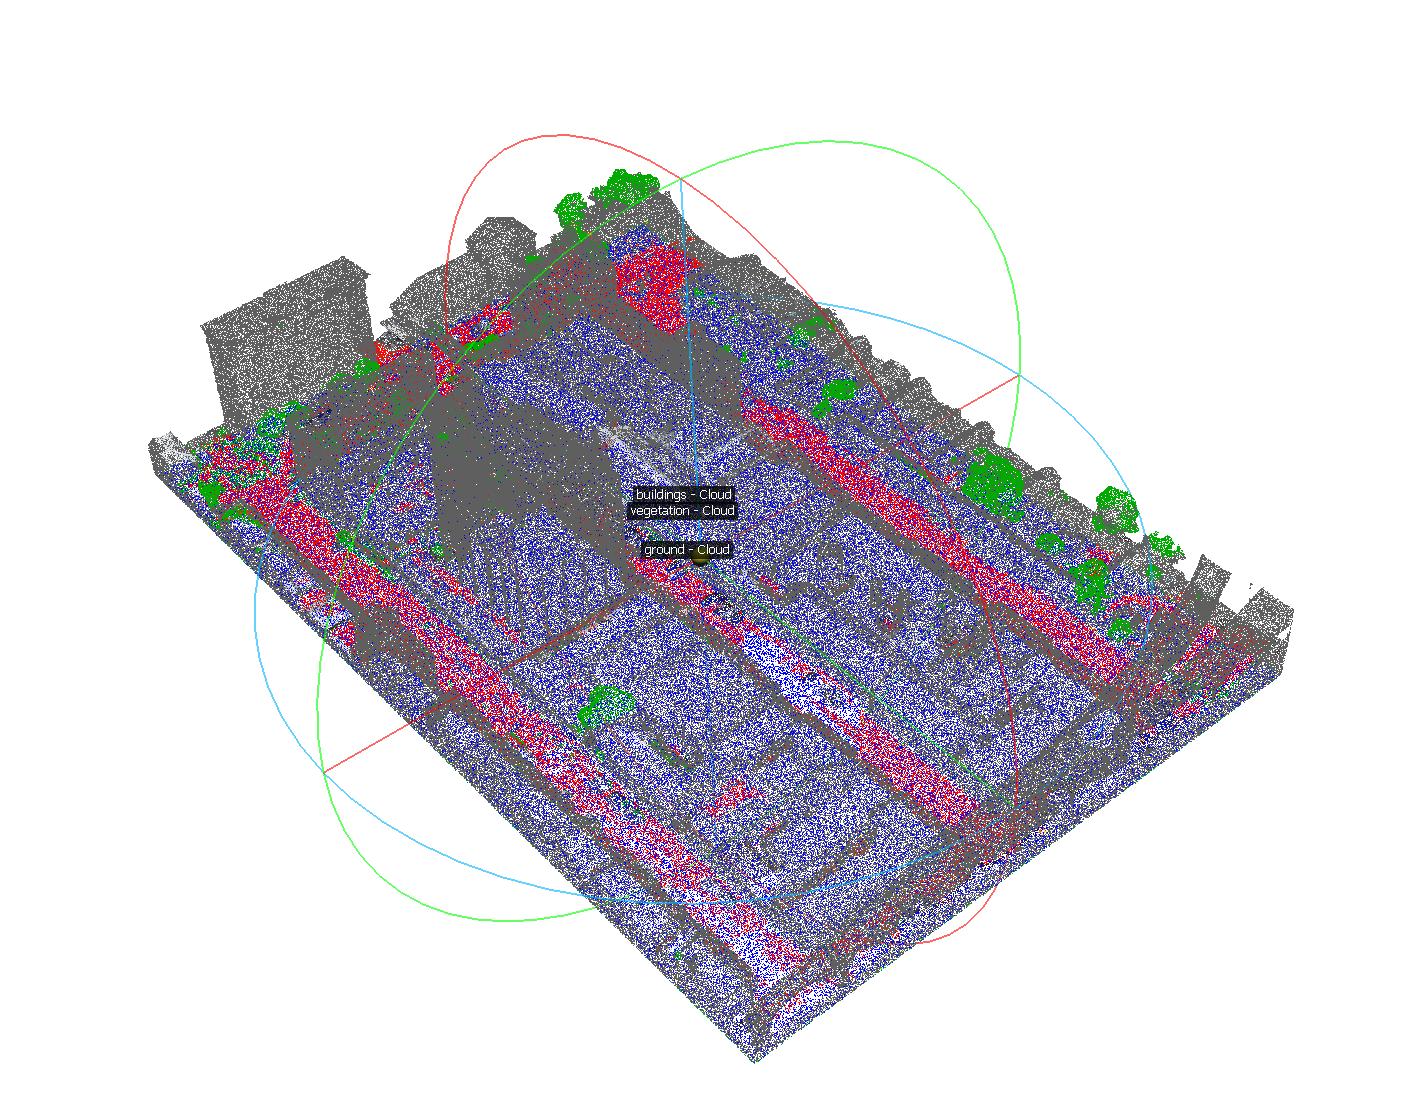
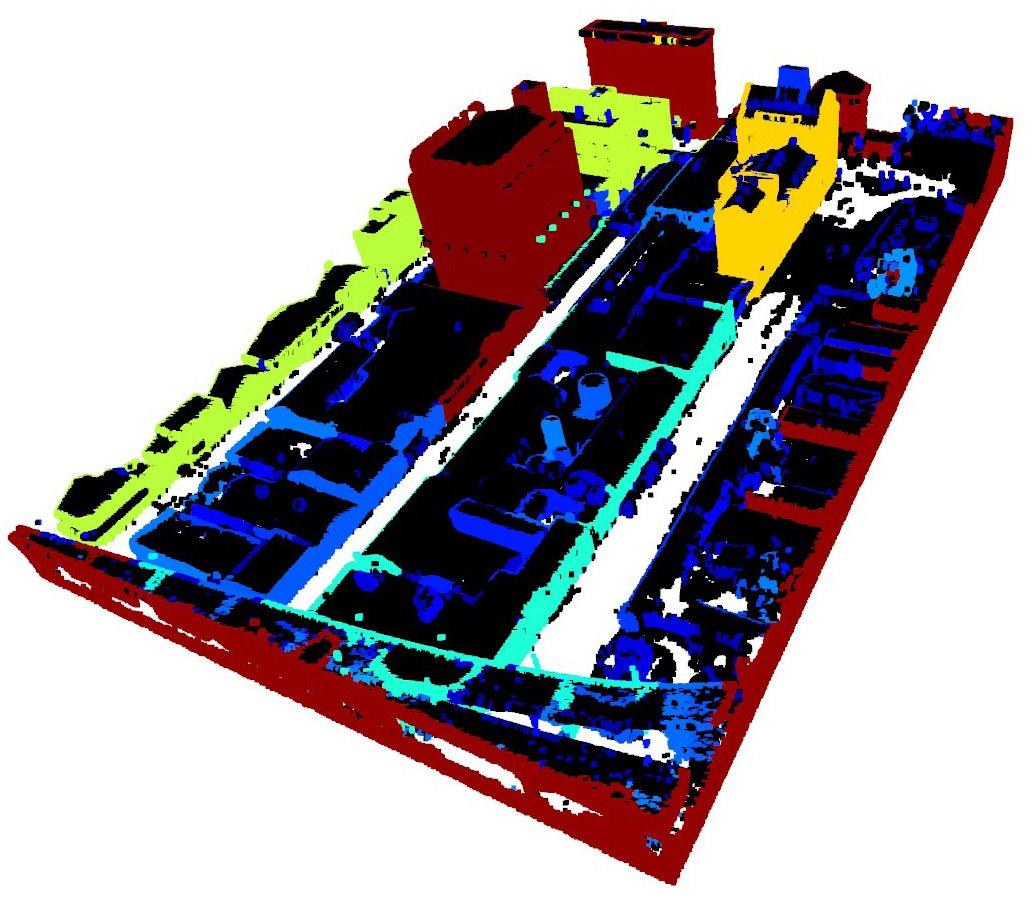
The next step involves the automatic segmentation of the point cloud into three main classes. Namely vegetation, buildings, and ground points. To do this we make use of PointNet ++ (Qi et al., 2017) . PointNet++ is an extension of the original PointNet architecture, both of which are neural network models designed specifically for processing point cloud data. Point cloud data can be a challenge for traditional convolutional neural
The workflow begins with data capturing 1 In future iterations we would propose investigating the use of Neural radiance fields (NeRFs) in place of photogrammetry. NeRFs are a machine-learning technique that uses the power of AI to create 3D models. Unlike photogrammetry, which relies on hundreds of photographs to accurately map an environment, NeRFs can be used with far fewer images than classic techniques.
Vegetation Cover
Elevation
Aspect
Slope
Residential Point
Inhabitant Place Road Railway
Average Vapour Pressure
Precipitation
Min Daily Relative Humidity
Max Daily Wind Speed
Max Daily Air Temperate
Max Surface Temperature
Min Daily Air Temperate
Min Surface Temperature
Ave Daily Relative Humidity
Ave. Air Temperature
networks due to its irregular and unordered nature. PointNet and PointNet++ address these challenges. While the original PointNet was a pioneering architecture for point cloud processing, PointNet++ improves upon it by introducing a hierarchical neural network structure that can better capture local features and details in point cloud data. The advancements in PointNet++ make it more suitable for tasks that require a deeper understanding of the spatial relationships between points, such as object part segmentation.
The segmented point cloud is then used to carry out analysis on three key metrics including the spread of fire through vegetation, the slope and aspect of the terrain in question, building densities and their distances to vegetation. These processes are expanded upon in detail in the next few chapters.
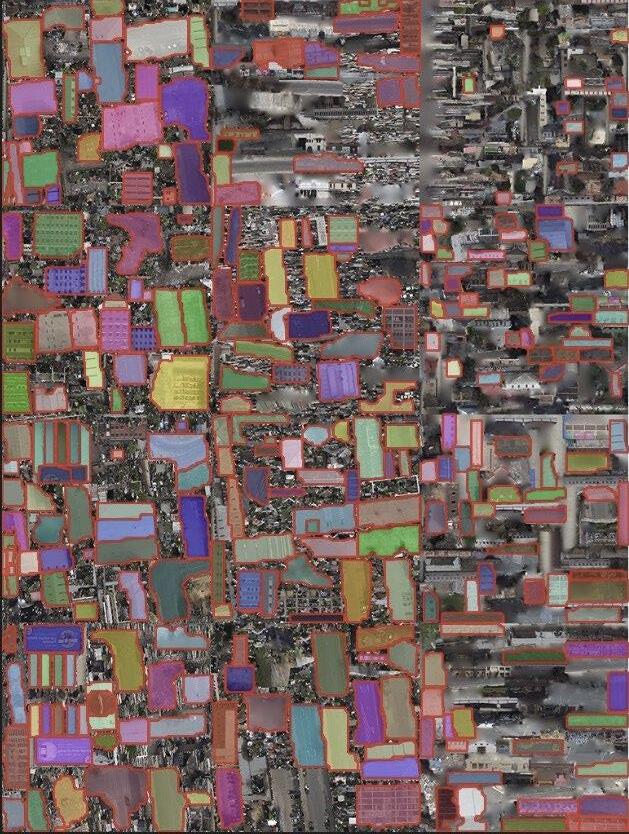
The mesh itself is used to carry out a materials analysis of the built environment. This is accomplished by using the unwrapped UV textures of the model. The unwrapped texture is segmented using the Segment Anything Model by Meta (Kirillov et al., 2023) and materials detection is made using DINO (Oquab et al., 2023).
DINO (Deeper Into Neural Networks), a new self-supervised system which is able to learn representations from unlabelled data. The model can automatically learn class-specific features leading to accurate unsupervised object segmentation. It was first introduced in their paper “Emerging Properties in Self-Supervised Vision Transformers” (Oquab et al., 2023).
These metrics together with the most significant weather data points are weighted and combined to create the final summary risk report. The data is graphically represented on a html interface.
Figure 2: Micro scale variable importance on fire spread Firemaps (2023)
Macro Scale Variable Importance for Forest Fires
Figure 1: Macro scale variable importance on fire spread (WU et al, 2021)
I n p u t l o c a t i o n : The user inputs a specific urban location they're interested in assessing. Generate drone route: Based on the provided location, our system generates an optimized route for drone flight. D r o n e f l i g h t & d a t a c a p t u r e : The user uses their drone to fly the generated route, capturing point cloud data of the urban area. U p l o
c
P r
t
: The user uploads the captured photographs to our cloud platform. D
s i n g : Our algorithms analyse and process the mesh and points clouds. Providing a basis for the indepth analytics
a s u r e s a s s e s s m e n t Based on the analysis, our system proposes a set of preventive measures to mitigate the risk of fire spread. O u t p u t : The user receives an indepth report on potential fire spread zones and suggested preventive actions.
Figure 3: Overall back and front end workflow
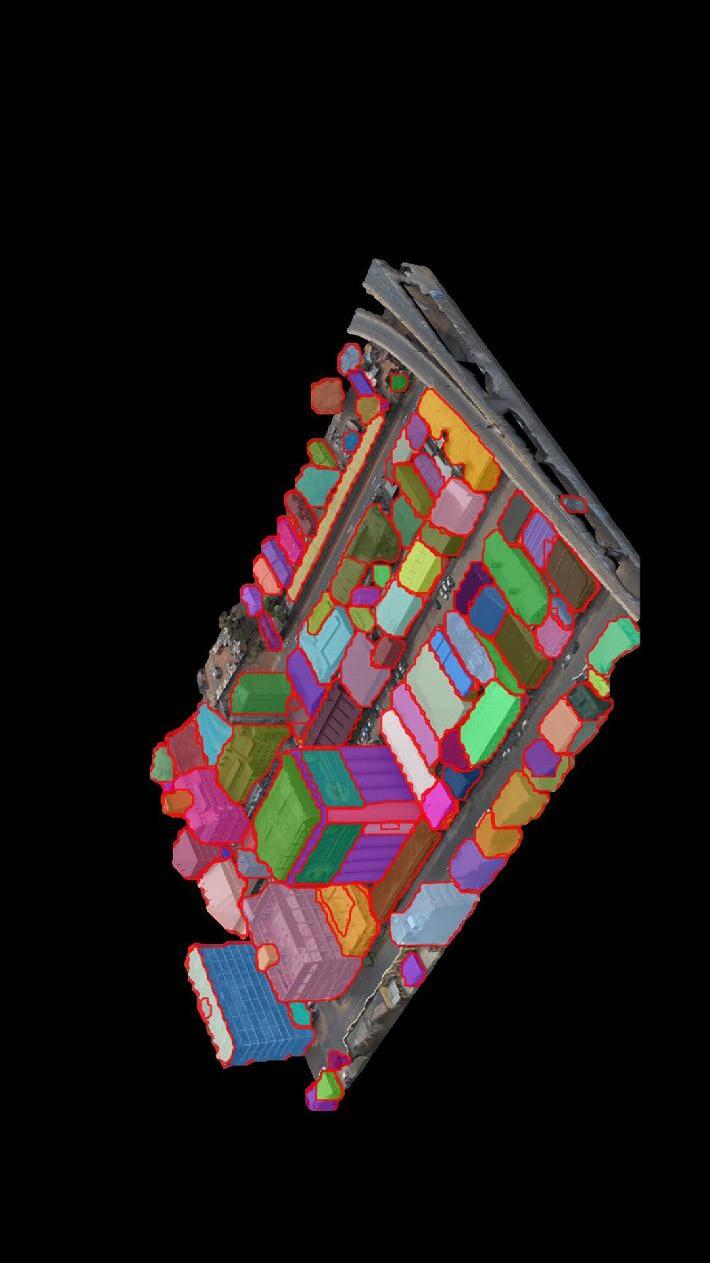
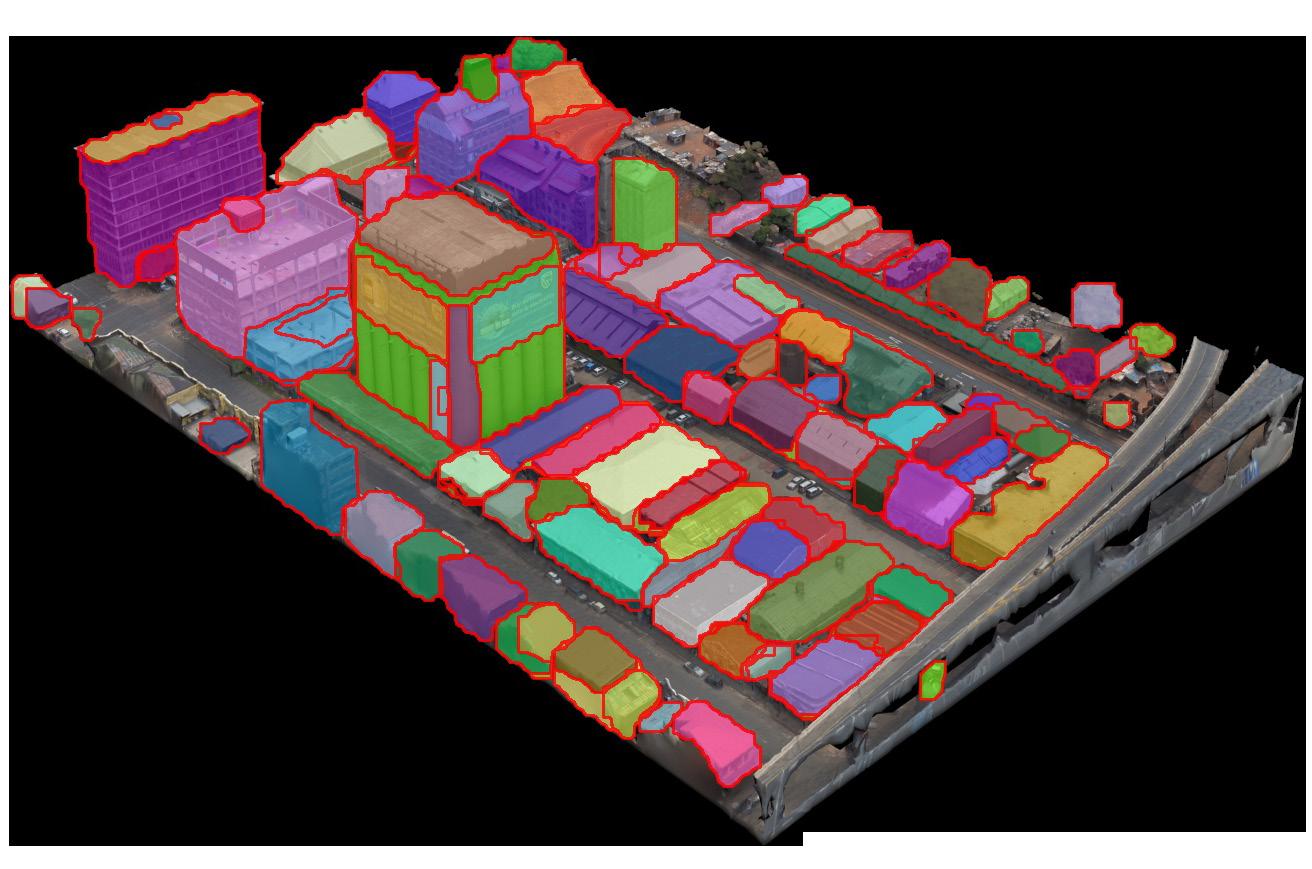
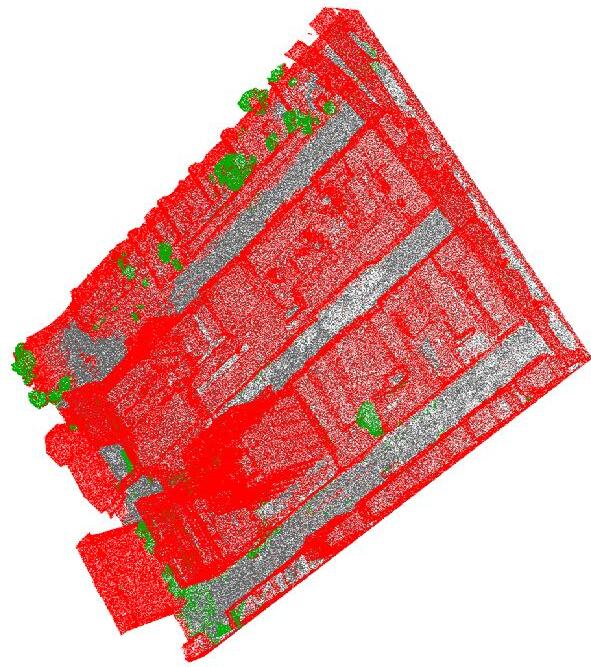
5: Segmented point cloud, automatically segmented into buildings, vegetation and ground points.
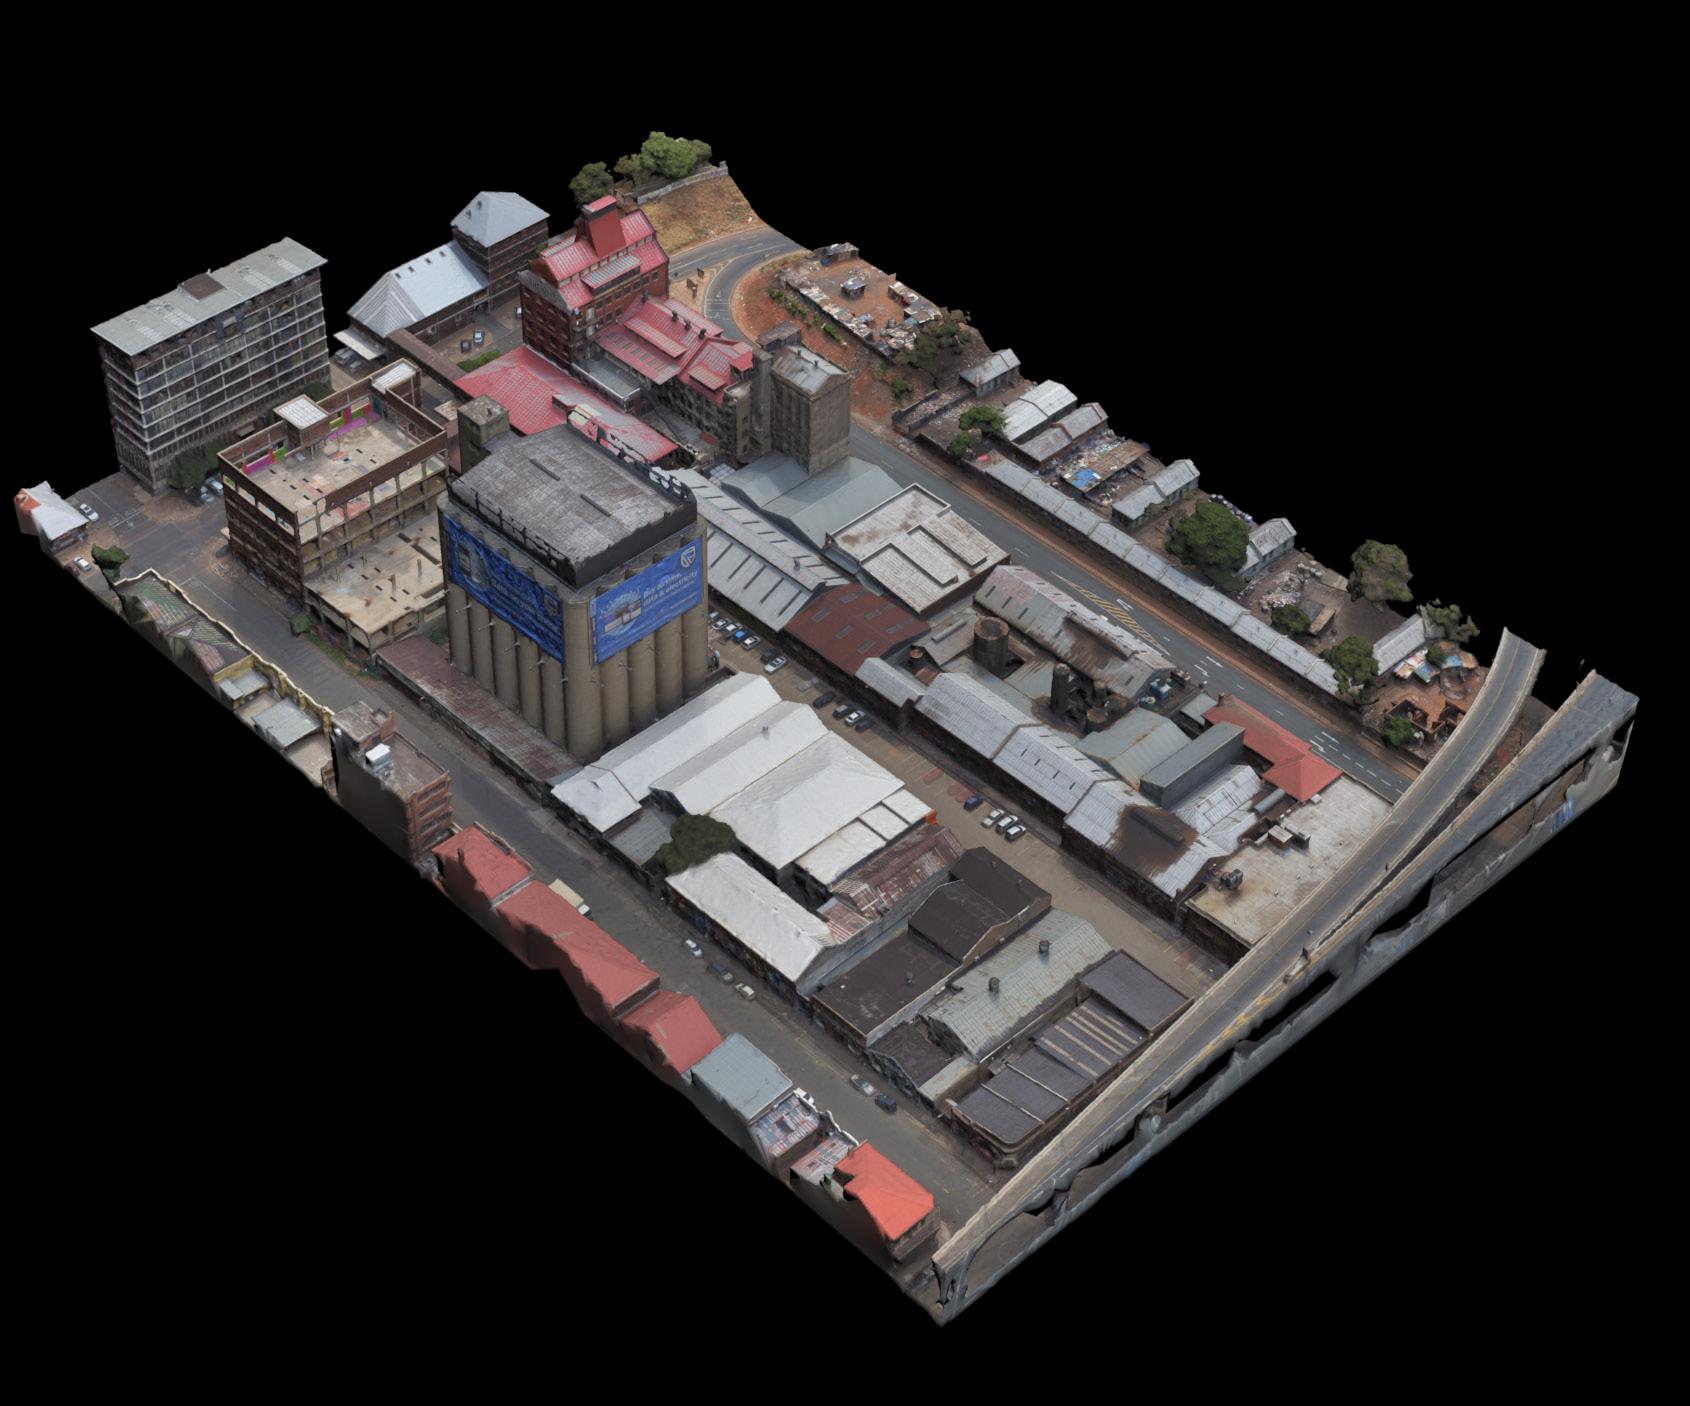
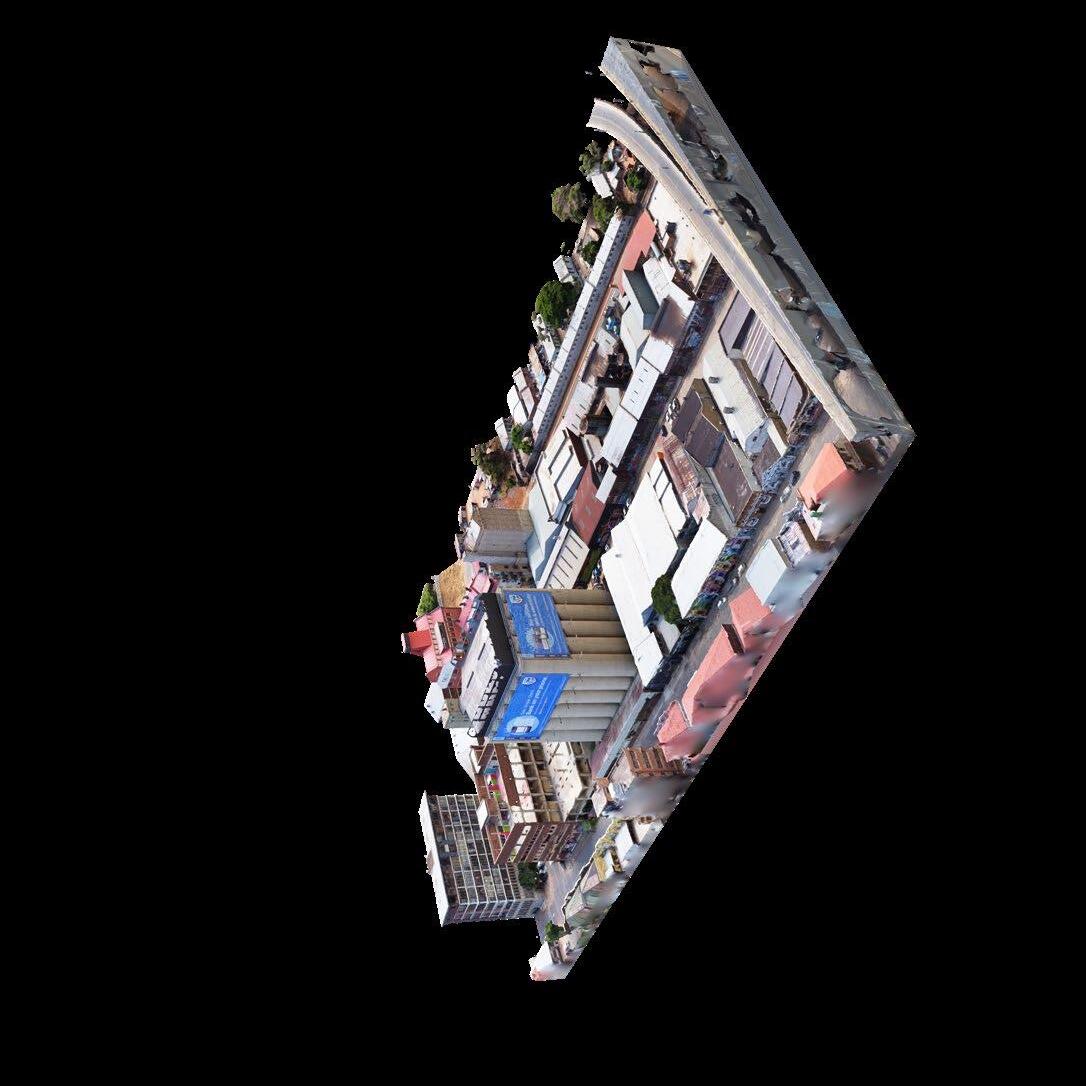
Figure 4: Original reconstructed photogrammetry 3d mesh. The mesh has been extracted from an area in Newtown, Johannesburg, South Africa.
Figure
create a data structure that can be processed
Vegetative Pathways
Analysing Fire Propagation in vegetation
Point cloud data offers a dense and detailed representation of physical environments. In areas prone to wildfires or fire hazards, understanding the spatial distribution and clustering of vegetation becomes critical. This understanding helps in proactive planning and fire risk mitigation. The provided workflow comprehensively analyses the point cloud data, focusing on vegetation, to decipher potential fire spread pathways. It proposes a novel method, which to the writers knowledge, has not previously been undertaken.
Step
1: Conversion to a Structured Format
The process begins by converting the detailed point cloud data into a Pandas DataFrame. This process is not merely about data transformation but lays the foundation for the entire analysis. Raw point cloud data, while rich in spatial intricacies, lacks the structure required for advanced computational methods. By translating each point in the cloud into a row within the DataFrame, and its spatial coordinates (X, Y, Z) into individual columns, the data is primed for systematic exploration and processing, setting the stage for the subsequent analytical steps.
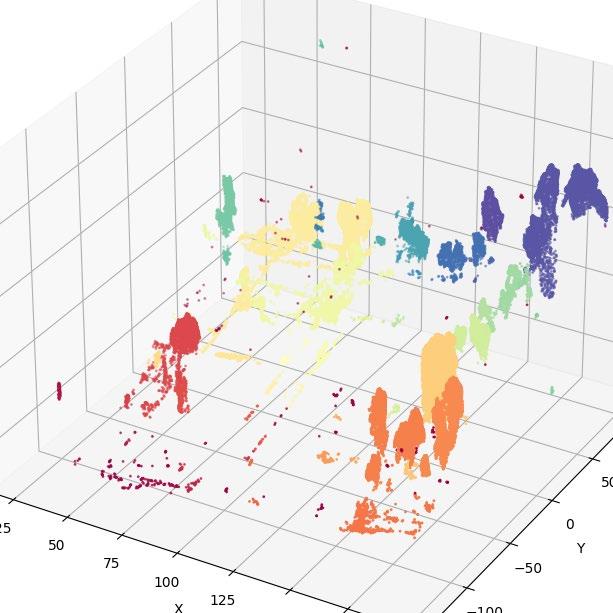
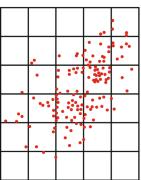
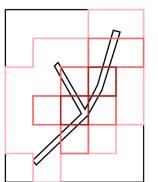
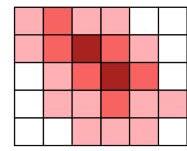
Step 2: Clustering Using DBSCAN
The next phase involves segmenting the vegetation into distinct clusters using the DBSCAN algorithm (Ester et al., 1996). Unlike traditional clustering algorithms that often require prior knowledge of cluster count, DBSCAN operates organically, identifying clusters based on density. By using parameters like eps, which defines the maximum distance between samples, and min_ samples, which outlines the minimum points
With clusters delineated, the logical next step is to identify a representative point for each cluster: the centroid. These centroids, calculated as the arithmetic mean of all points within a cluster, serve a dual purpose. They not only symbolize the heart of each vegetation patch but also streamline subsequent analyses by reducing the complexity of dense clusters into singular, representative points.
Step 4: Spatial Indexing with KDTrees
Handling large spatial datasets requires efficient querying mechanisms, and this is where KDTree (Bentley, 1975) shines. This space-partitioning data structure segments the multi-dimensional dataset into distinct, manageable regions, facilitating rapid spatial queries. Whether assessing distances between centroids or identifying clusters within a specified radius, KDTree ensures these operations are swift and efficient, thereby streamlining the computational workflow.
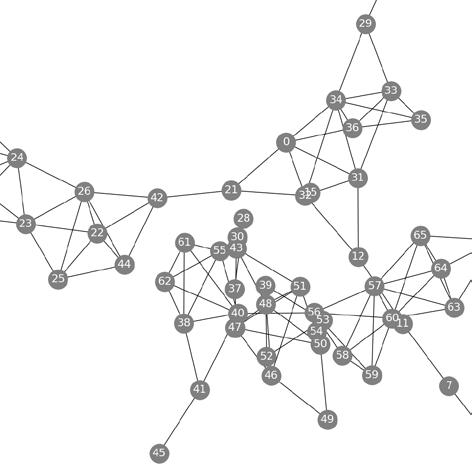
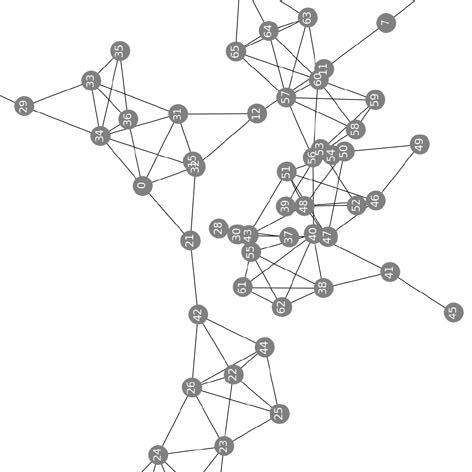
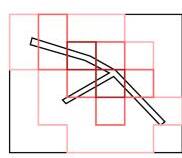
Step 5: Graph Construction
To map the potential pathways for fire spread across the vegetation clusters, a graph is constructed. In this graphical representation, nodes symbolize the centroids of vegetation clusters, encapsulating the essence of each
Density-Based Spatial C l u s t e r i n g
Density-Based Spatial C l u s t e r i n g
Density-Based Spatial C l u s t e r i n g
perform clustering using DBSCAN algorithm (SKlearn)
structure perform clustering using DBSCAN algorithm (SKlearn)
perform clustering using DBSCAN algorithm (SKlearn)
group by cluster and calculate mean coordinates efficiently query distances between clusters 3
Calculate cluster c e n t r o i d s
Calculate cluster c e n t r o i d s
Calculate cluster c e n t r o i d s
Analysis
Step 2
Clustering Using DBSCAN.
group by cluster and calculate mean coordinates efficiently query distances between clusters
group by cluster and calculate mean coordinates efficiently query distances between clusters
create s p a t i a l i n d e x of centroids using KDTree construct a graph each node represents cluster, and each possible path
create s p a t i a l i n d e x of centroids using KDTree construct a each node represents cluster, and each possible
create s p a t i a l i n d e x of centroids using KDTree construct a each node represents cluster, and possible
With clusters delineated, the logical next step is to identify a representative point for each
Step 4
This workflow provides a fusion of geospatial analytics, machine learning, and graph theory, carefully tailored to dissect and interpret
s e back to original point cloud
s u a l i s e back to original point cloud
7 label problematic clusters (red) and overlay to original point cloud visual m e
construct a graph
s u a l i s e back to original point cloud
Spatial Indexing with KDTrees: Handling large spatial datasets requires efficient querying mechanisms.
each node represents a vegetation cluster, and each edge represents a possible path for fire spread
label problematic clusters (red) and overlay to original point cloud visual
label problematic clusters (red) and overlay to original point cloud visual
dense vegetation patch. Edges, on the other hand, represent the spatial interplay between these clusters, offering insights into how closely or distantly they are positioned. This graphical abstraction serves as a blueprint for understanding potential fire spread pathways across the landscape.
Step 6: Node Degree Analysis
u a l i s e back to original point cloud
label problematic clusters (red) and overlay to original point cloud visual
each node represents a vegetation cluster, and each edge represents a possible path for fire spread
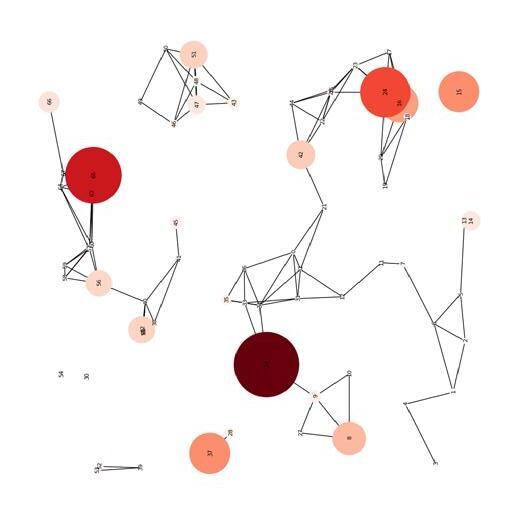
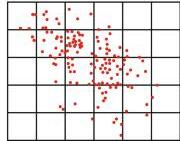
Within the constructed graph lies an array of insights, waiting to be unravelled. One such insight is the degree of each node, indicating its interconnectedness within the graph. High-degree nodes, by virtue of their numerous connections, emerge as potential hotspots. They suggest regions where multiple vegetation clusters are in close proximity, thereby amplifying the potential risk of rapid fire spread. Such nodes become focal points for strategic interventions and proactive fire management.
Step 5
analyse no. of d e g r e e s p e r n o d e
Graph Construction: To map the potential pathways for fire spread across the vegetation clusters, a graph is constructed.
analyse no. of d e g r e e s p e r n o d e v i s u a l i s e back to original point cloud
label problematic clusters (red) and overlay to original point cloud visual
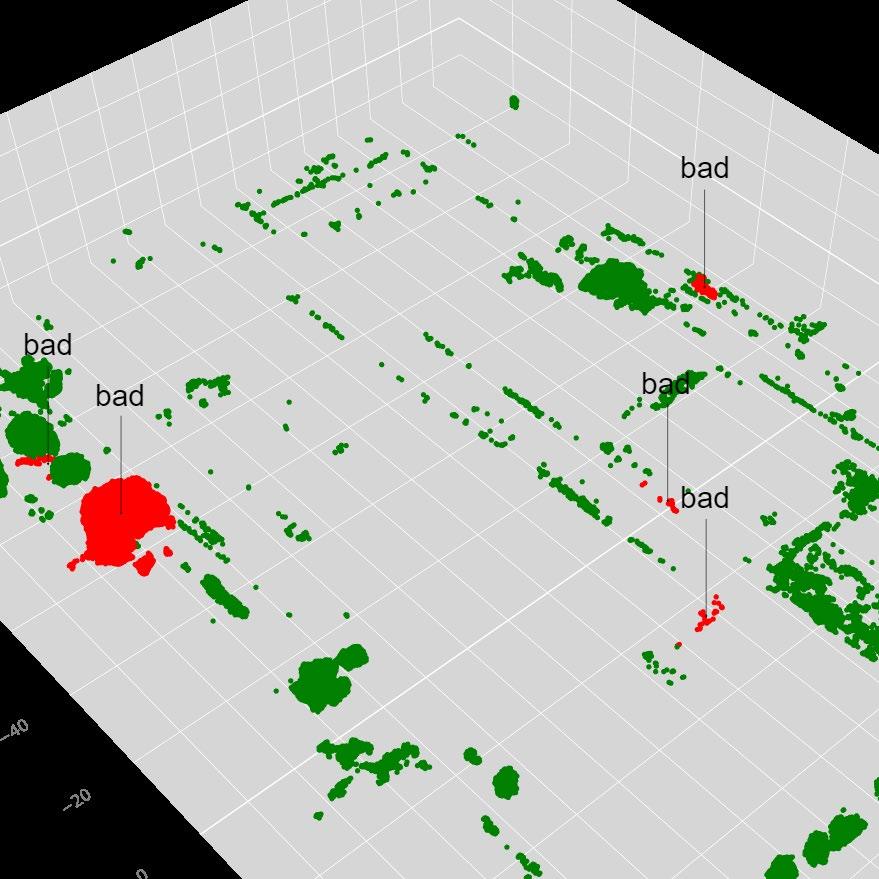
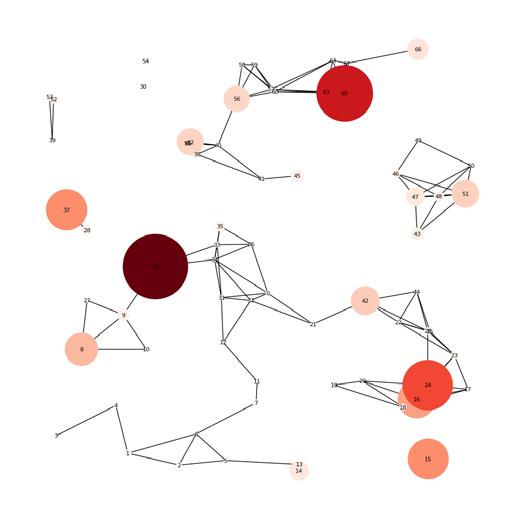
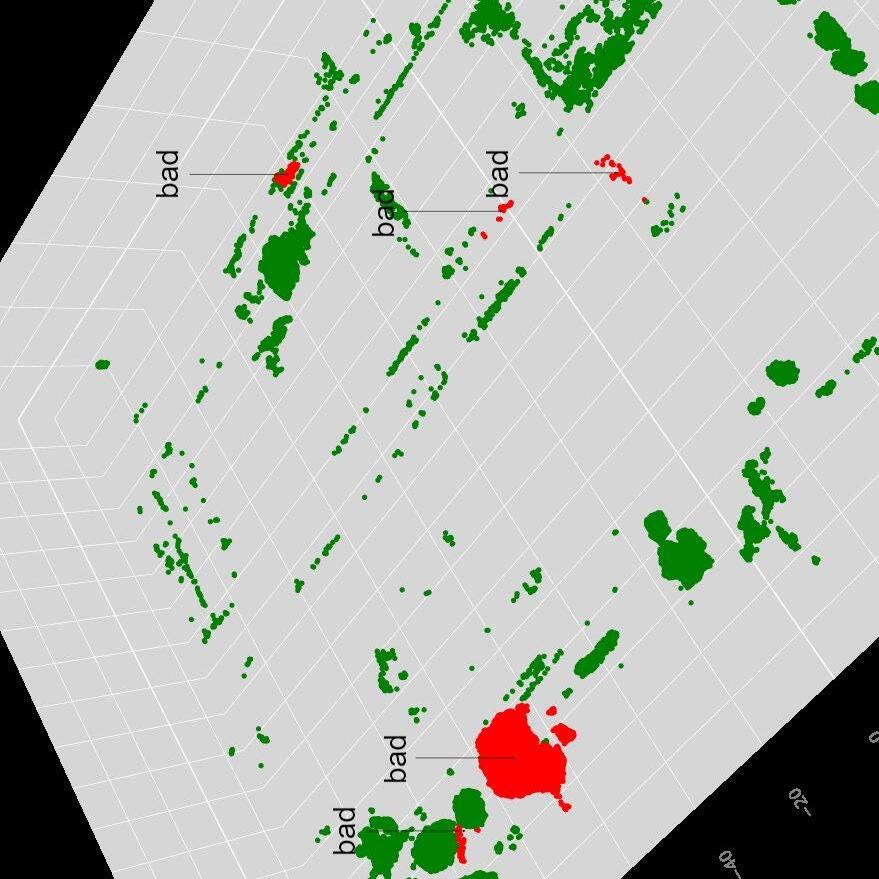
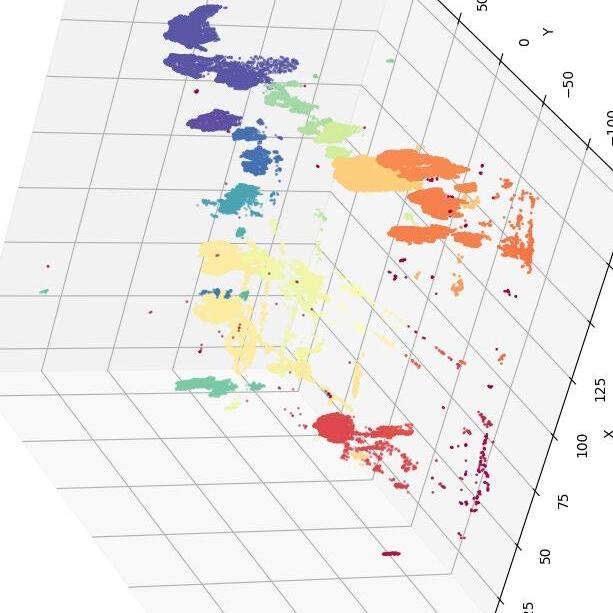
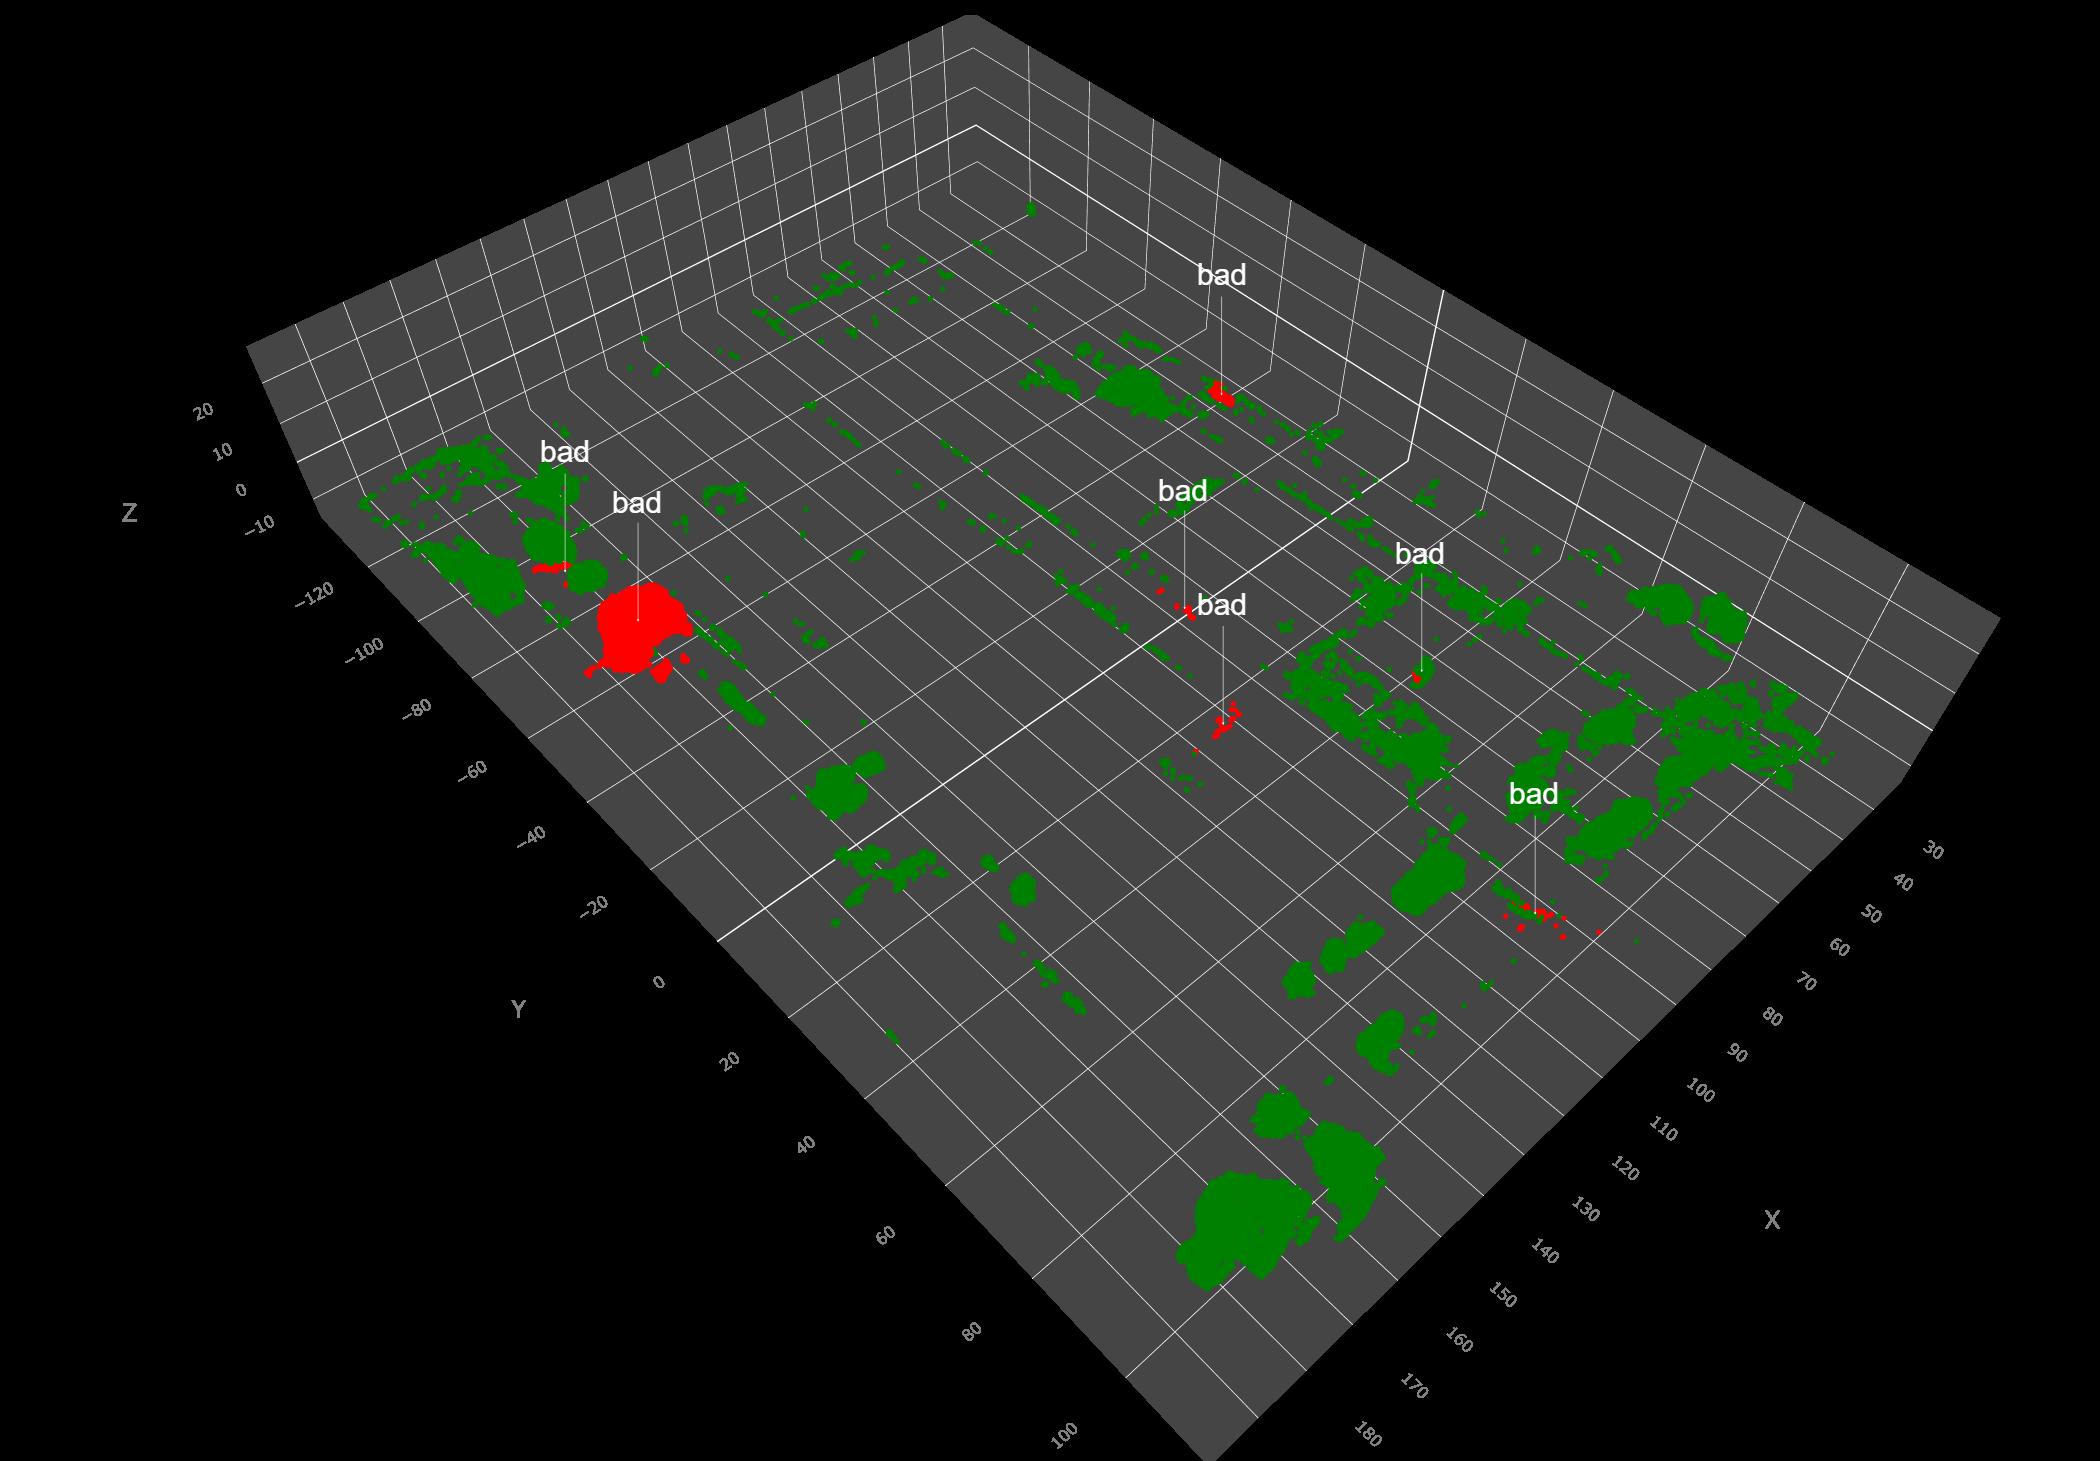
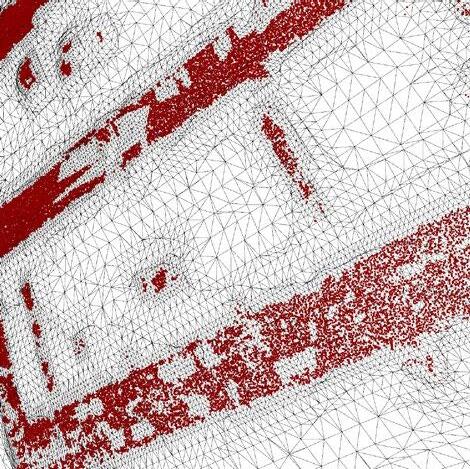
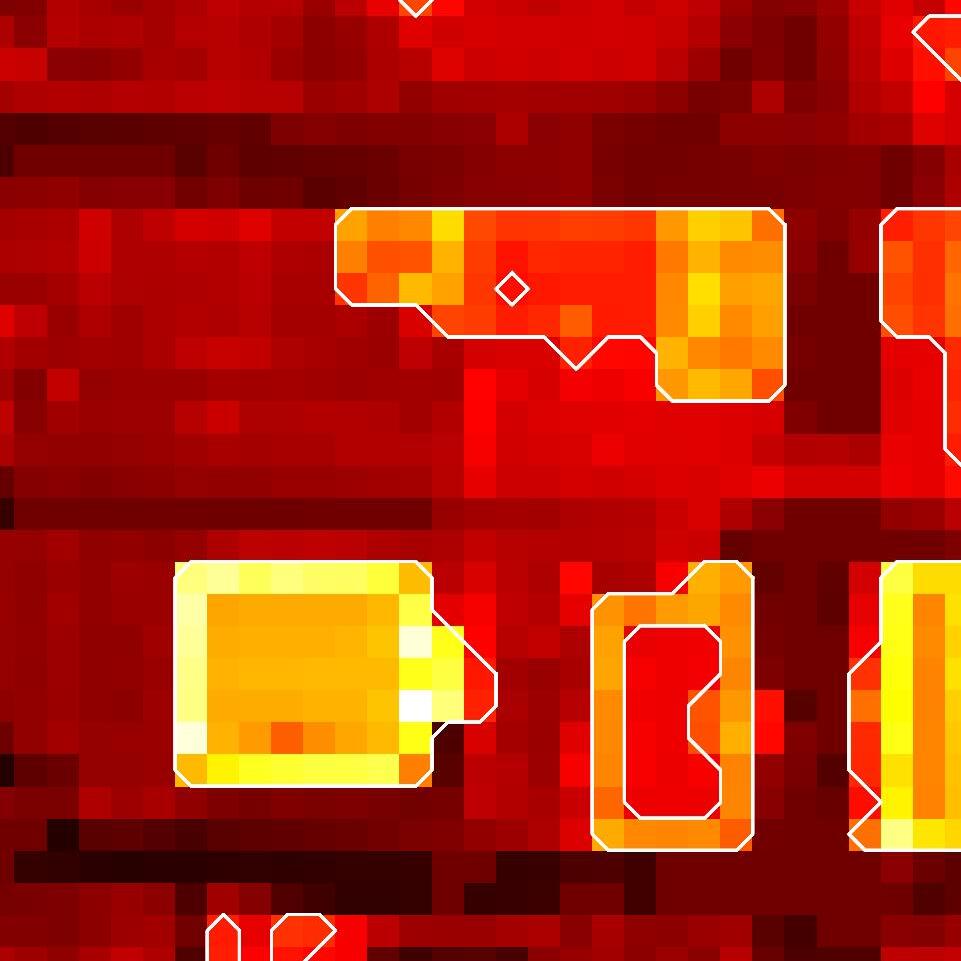
Step 7: Visualisation on Original Point Cloud
The final leg of this analytical marathon is visualizing the insights on the original point cloud. This visualization isn't just a graphical representation but a synthesis of the entire analysis. By overlaying the risk areas, represented by distinct colours on the original point cloud, the analysis comes full circle, translating complex computational insights into an intuitive, visual format. Such a representation not only facilitates understanding but also aids in decision-making, ensuring stakeholders can act promptly and effectively.
Step 6
Node Degree Analysis: Within the constructed graph lies an array of insights. One such insight is the degree of each node, indicating its interconnectedness within the graph.
clusters that have many connections marked as "hotspots" for fire spread, the darker the red the more connections or 'degrees' that it has
construct a graph each node represents a vegetation cluster, and each edge represents a possible path for fire spread analyse no. of d e g r e e s p e r n o d e
create a data structure that can be processed perform clustering using DBSCAN algorithm (SKlearn) group by cluster and calculate mean coordinates efficiently query distances between clusters 3 4 5
create s p a t i a l i n d e x of centroids using KDTree
v i s u a l i s e back to original point cloud
Calculate cluster c e n t r o i d s
DensityBased Spatial C l u s t e r i n g
convert point cloud to d a t a f r a m e
clusters that have many connections marked as "hotspots" for fire spread, the darker the red the more connections or 'degrees' that it has
label problematic clusters (red) and overlay to original point cloud visual
Figure 6: Workflow outlining the fire spread analysis for vegetation
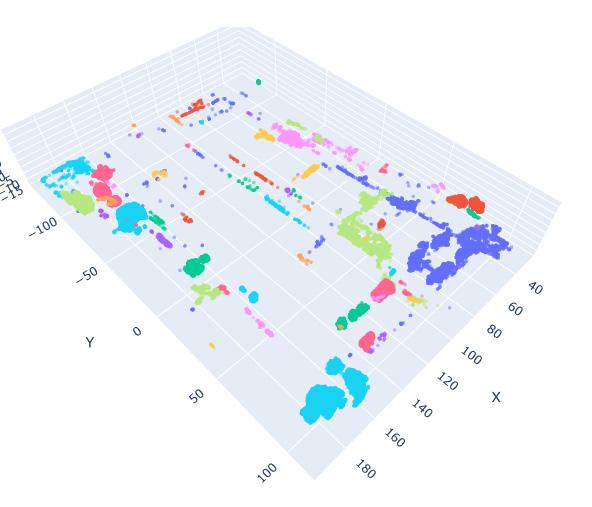
Figure 7: Semantic segmentation and clustering of vegetation points.
Figure 8: Risk classification based on the degree of nodes, connectedness and density.
Slope & Aspect 5
A detailed analysis of terrain data
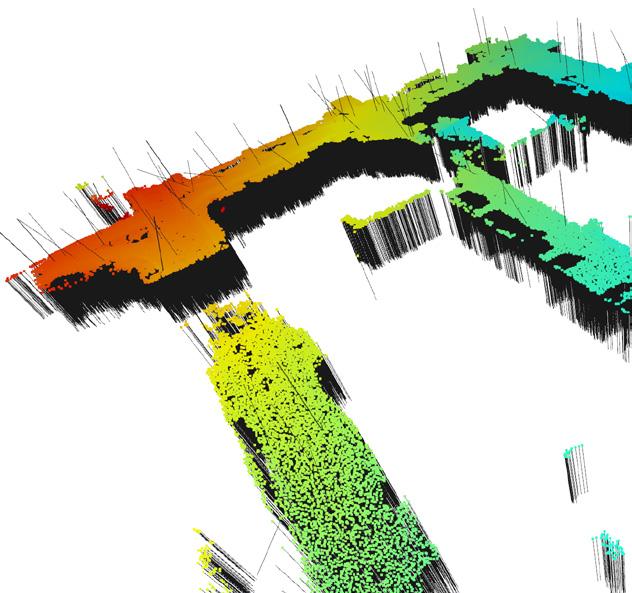
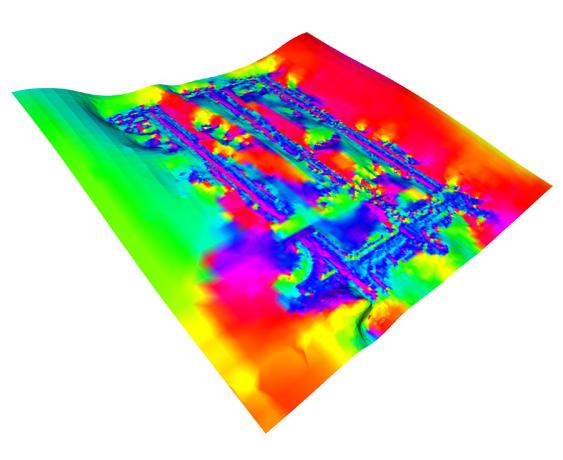
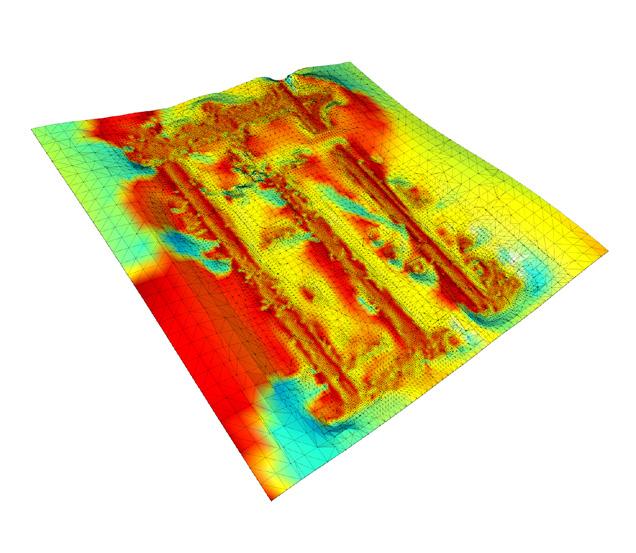
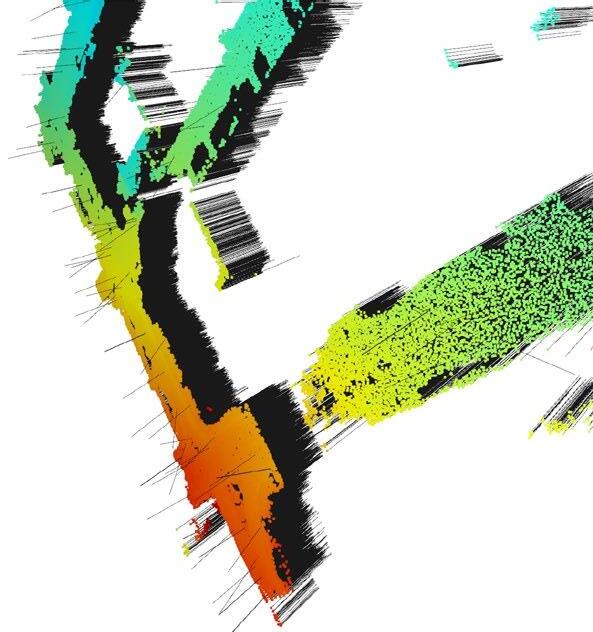
Terrain data is processed to understand its potential influence on fire spread. This workflow begins by estimating the orientation of each point in a 3D point cloud. Using this orientation, the slope of the terrain is computed to gauge steepness. A detailed mesh of the terrain is then generated, providing a tangible representation of the landscape. The direction each slope faces (aspect) is determined, revealing its orientation relative to cardinal directions.
The slope and aspect of the terrain play crucial roles in influencing fire spread: Slope: Fires tend to spread faster uphill because the flames can preheat the vegetation above them, making it more combustible. The steeper the slope, the faster the fire can climb. Aso the steeper the slope the greater the water run off which results in a drier ground. Aspect: The direction a slope faces (its aspect) affects its exposure to the sun. South-facing slopes in the Northern Hemisphere (and north-facing in the Southern Hemisphere) typically receive more sunlight, making them drier and more prone to rapid fire spread than shaded slopes.
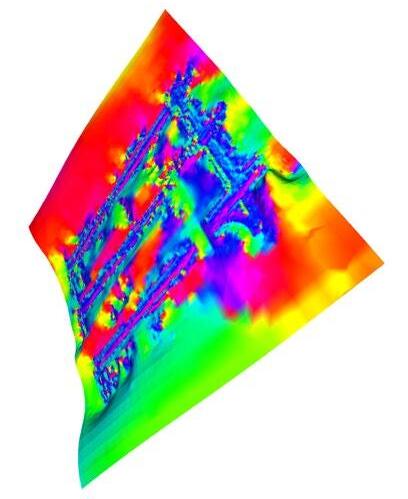
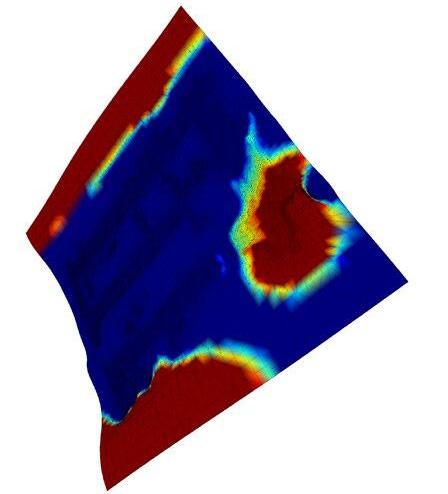
Finally, the insights from both slope and aspect are combined, resulting in a comprehensive visualization that highlights areas of the terrain potentially more susceptible to fire spread.
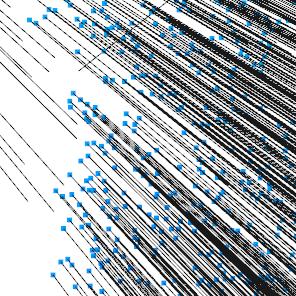
Step 1: Estimate Normals Using Neighbouring Points
For estimating normals, the algorithm leverages the KDTree structure, a space-partitioning data structure that aids in organizing points in k-dimensional space. This facilitates the efficient querying of neighbouring points within a specified radius. By fitting a plane to these neighbours, the
Step 1
The algorithm identifies neighbouring points in the point cloud, fits a plane to these neighbours', and assigns the perpendicular to this plane as the normal for each point.
algorithm can compute the normal at each point, determining the direction in which that point is oriented.
Step 2: Calculate Slope from the Normals
To compute the slope, the dot product between the normal vector of each point and the 'up' vector is calculated. The 'up' vector serves as a benchmark for vertical orientation. The dot product gives the cosine of the angle between the two vectors, which, after an arc cosine transformation, provides the actual angle. The slope is then derived as the complement of this angle.
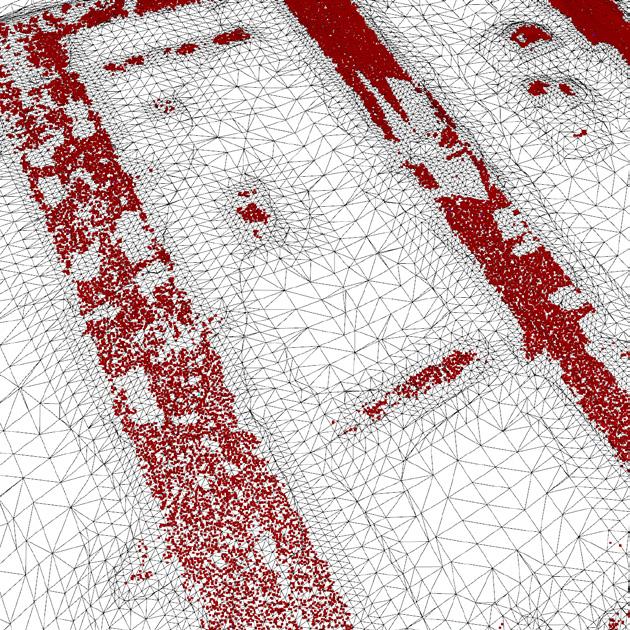
Step 3: Recreate Mesh from Points and Normals
Creating a mesh from a point cloud is a non-trivial task, and the Poisson Surface Reconstruction (PSR) method (Kazhdan et al., 2006) is a widely used technique for this purpose. The PSR algorithm works by fitting a smooth surface to the point cloud, considering both the points and their estimated normals. After the mesh is generated, any unreferenced vertices that don't belong to any triangle—are removed. This pruning step ensures that the mesh is concise and representative of the underlying terrain. Subsequently, the algorithm extracts the mesh edges, which are then visualised along with the original point cloud. Visualising these edges accentuates the structure and topography of the meshed terrain, providing a clearer perspective of its intricacies.
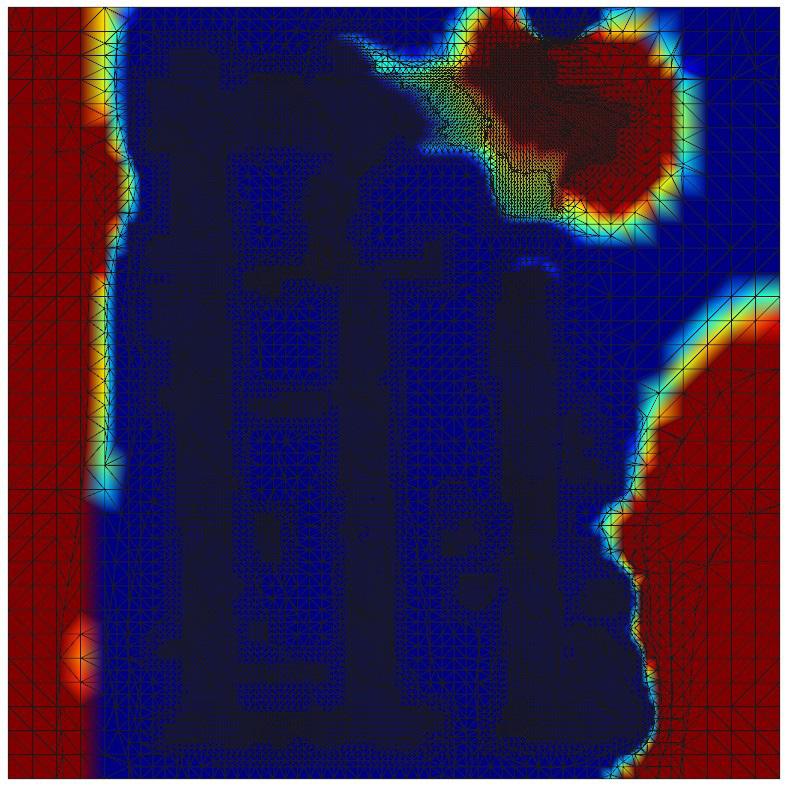
Step 4: Visualise Slope
The slope values, once computed, are normalized to lie between 0 and 1. These normalised values are then mapped to a colour map, which translates
Step 2
The slope is essentially the angle between the normal vector and the 'up' vector.
Step 3
Use Poisson Surface Reconstruction (PSR) method to create a smooth 3D surface from scattered points.
Step 4
Compute slopes, normalise, map to colours and set vertex colours, then finally extract mesh.
This algorithm delves into a detailed analysis of terrain data, highlighting areas more susceptible to fire spread based on slope and orientation insights.
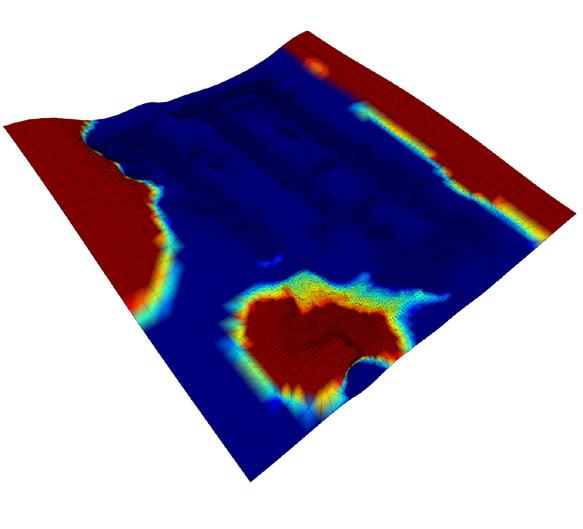
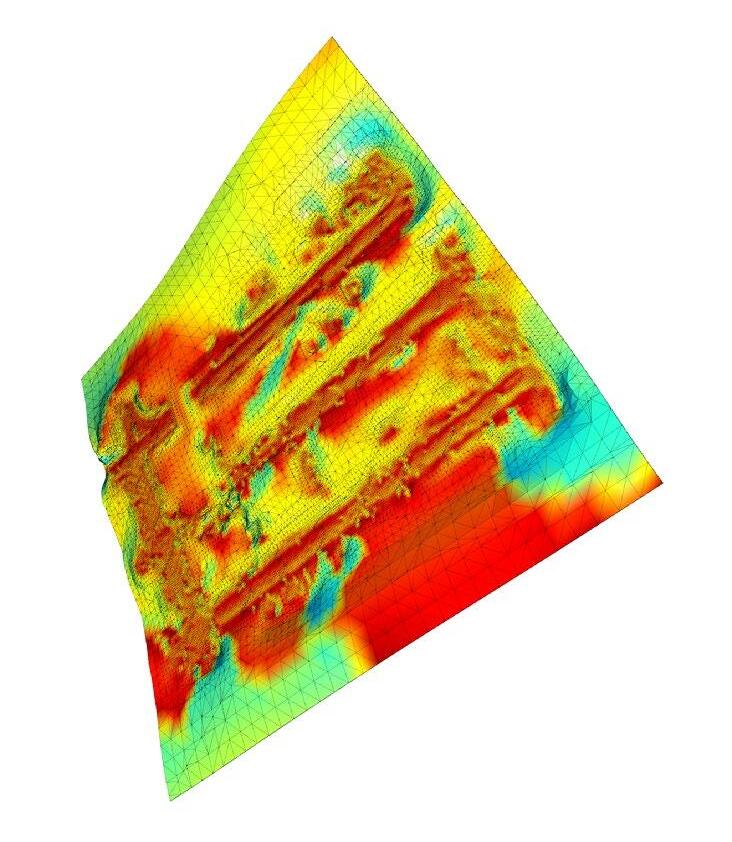
scalar values into colours. The choice of the 'jet' colour map ensures that variations in slope are distinctly visualized with a gradient of colours. This visualization makes it easy to distinguish between flat and steep regions in the mesh. Additionally, a gradient image for a colour-bar is generated, serving as a reference to interpret the colours and the range of slope values they represent.
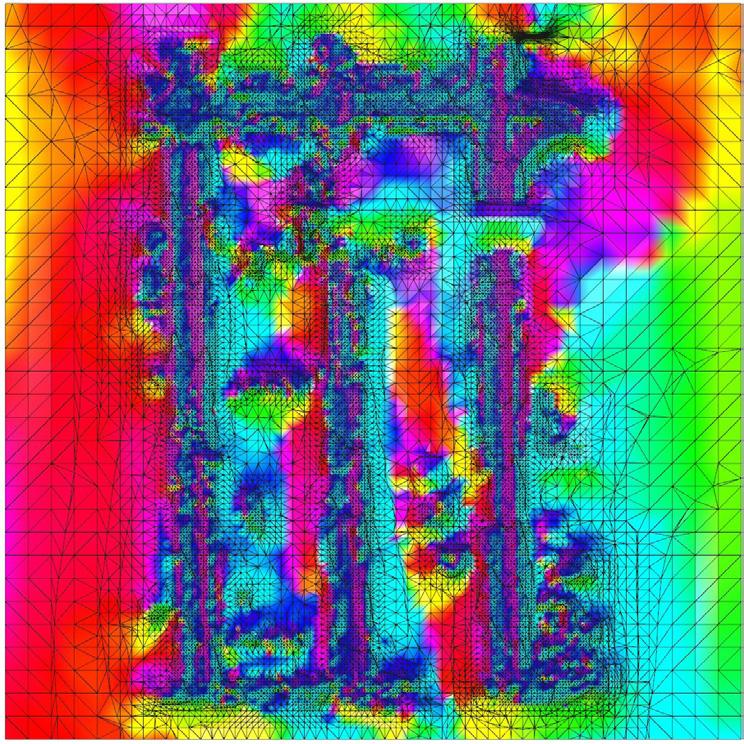
Step 5: Calculate Terrain Aspect
Aspect calculation is based on the face normals of the mesh. The direction of these normals is verified and adjusted. This ensures that calculations based on these normals, like slope and aspect, are accurate. The aspect is computed by projecting these normals onto the x-y plane and then determining the angle they make with the positive y-axis. This provides the orientation of each triangle face relative to the north direction. The aspect values are wrapped to ensure they lie within an acceptable range, making them consistent and interpretable.
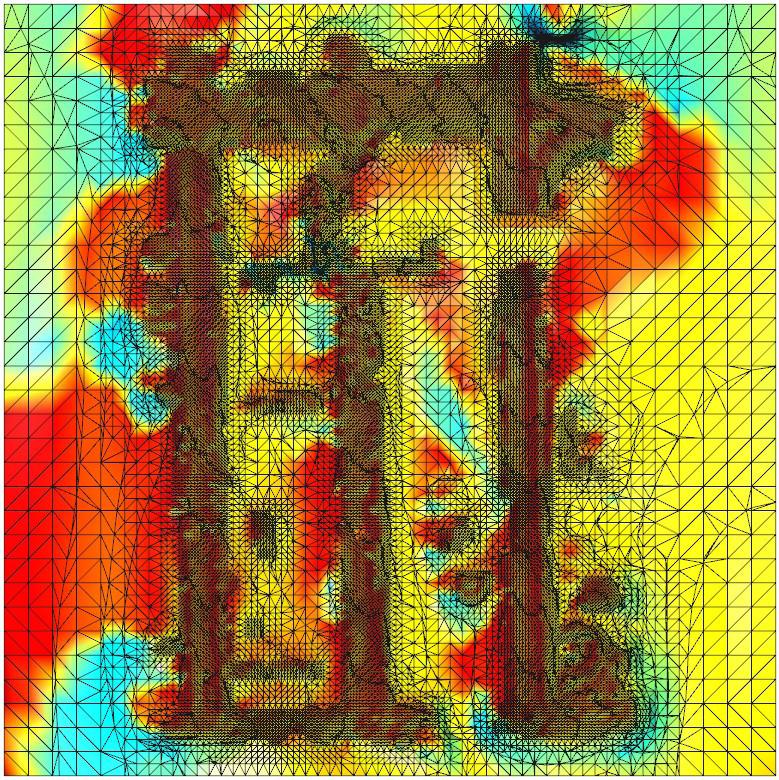
Step 6: Combine both Slope and Aspect
The final step combined the insights from both slope and aspect. A weighted average approach is used, where specific weights are assigned to both slope and aspect. These weights determine their influence in the final combined score. By computing a combined score as a weighted average of the normalized slope and aspect, the resultant visualization paints a comprehensive picture of the terrain, revealing regions that might be more susceptible to fire spread due to their topographical attributes.
Step 5
Using the face normals compute, the aspect.
Step 6
Colour the terrain mesh based on a mix of its slope and aspect, then visualise the coloured mesh.
calculate terrain aspect using the face normals compute, the aspect
v i s u a l i s e slope
Fire Spread Analysis
Slope and Aspect
compute slopes, normalize, map to colours and set vertex colours, then finally extract mesh 3 4 5
recreate mesh from p o i n t s a n d n o r m a l s
Combine both s l o p e a n d a s p e c t 1 2
next, we colour the terrain mesh based on a mix of its slope and aspect, then visualizes the coloured mesh 6
estimate n o r m a l s using neighbouring points calculate s l o p e from the normals
The algorithm identifies neighbouring points in the point cloud, fits a plane to these neighbours', and assigns the perpendicular to this plane as the normal for each point The slope is essentially the angle between the normal vector and the 'up' vector use Poisson Surface Reconstruction ( PSR ) method to create a smooth 3D surface from scattered points.
Figure 9: Workflow outlining the fire spread analysis for slope and aspect
Figure 10: Aspect
Figure 11: Slope
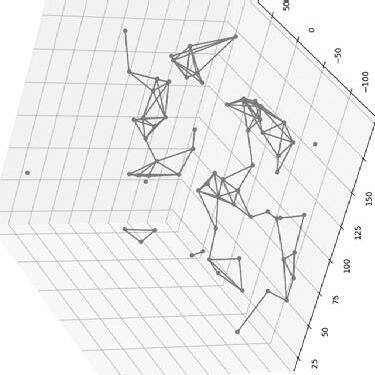
Figure 12: Aspect + Slope Combined
Figure 13: Aspect + Slope Combined (3D)
Step 1
Define the grid size and spacing + define the outer extents of the grid.
Building Density
Building Density Analysis in Fire Spread
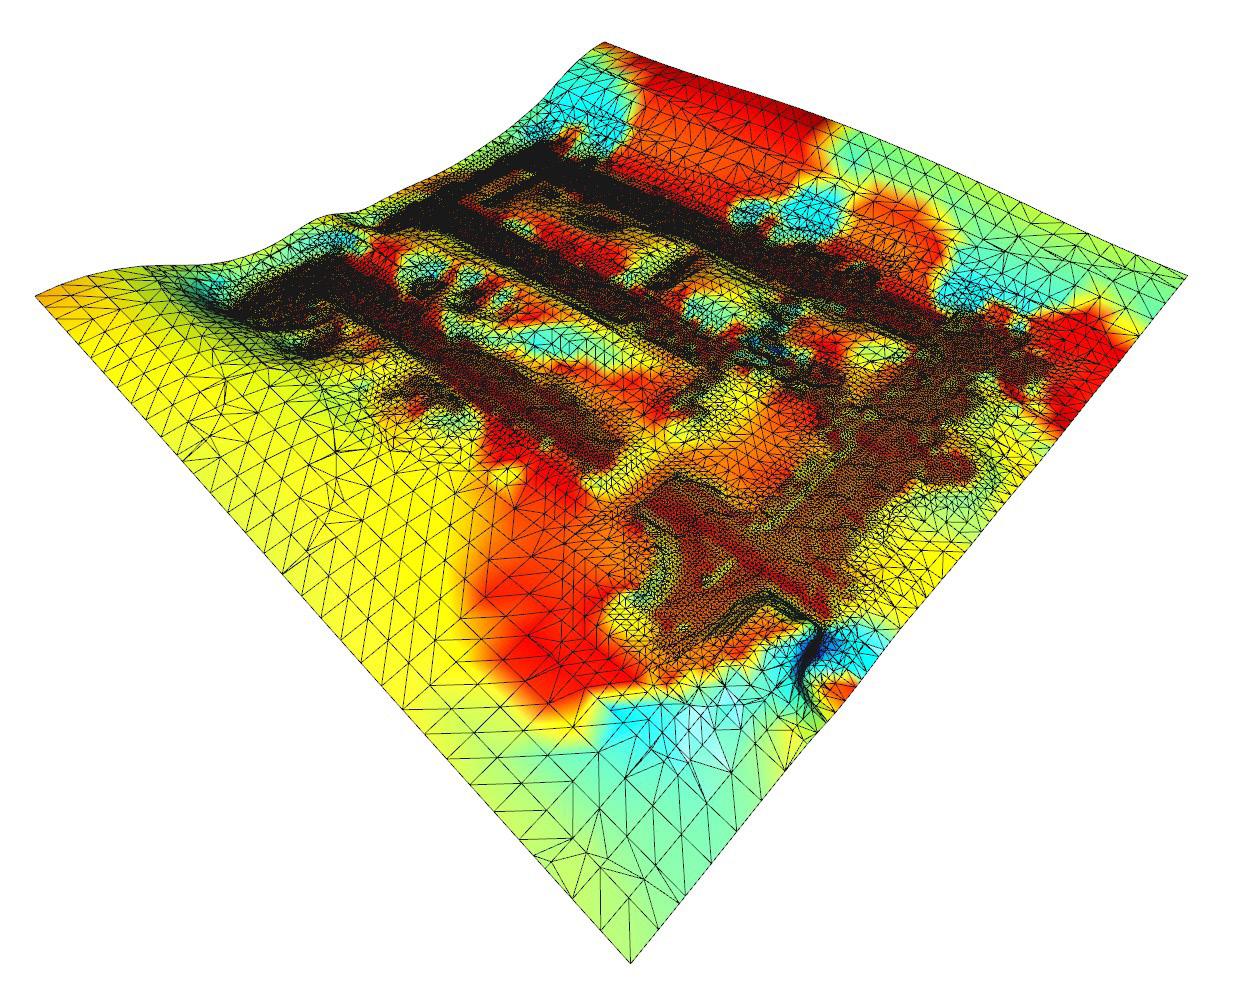
Building density and the physical attributes of structures, such as height, play a crucial role in the potential spread of fire and the associated risks. The objective of this workflow is to analyse the density of buildings using point cloud data and to visually represent this information in a comprehensive format. This chapter details the methodology used to derive insights from the data.
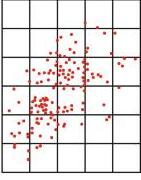
Step 1: Define grid & count points in each grid
We start by defining the grid size, spacing, and set the outer extents of the grid. The main objective is to determine the density of buildings within a specific area. To achieve this, a point cloud dataset containing 3D coordinates that represent the spatial structure of the buildings is loaded using the load_point_cloud function. The subsequent function, calculate_density, computes the density by dividing the total number of points in the point cloud by the given area. This gives insight into how densely buildings are placed within each grid cell of the defined area.
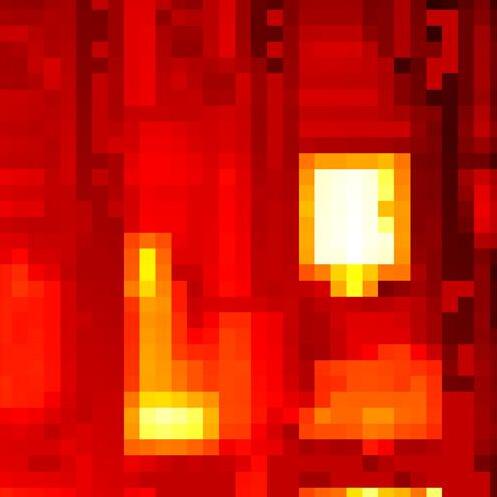
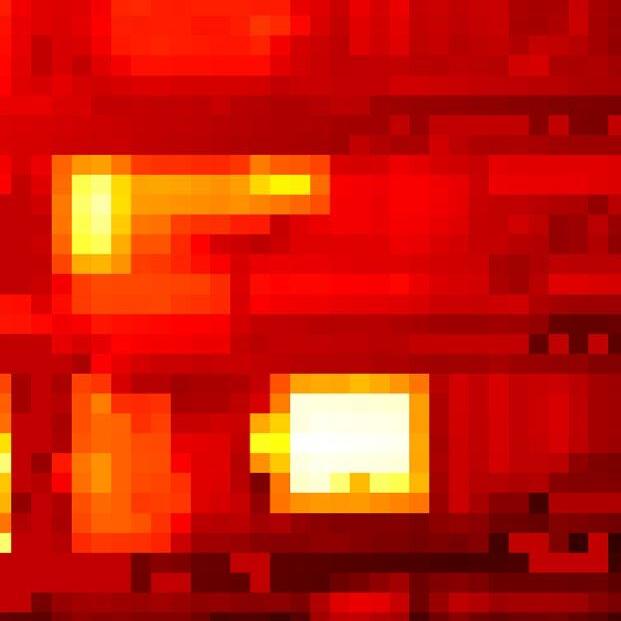
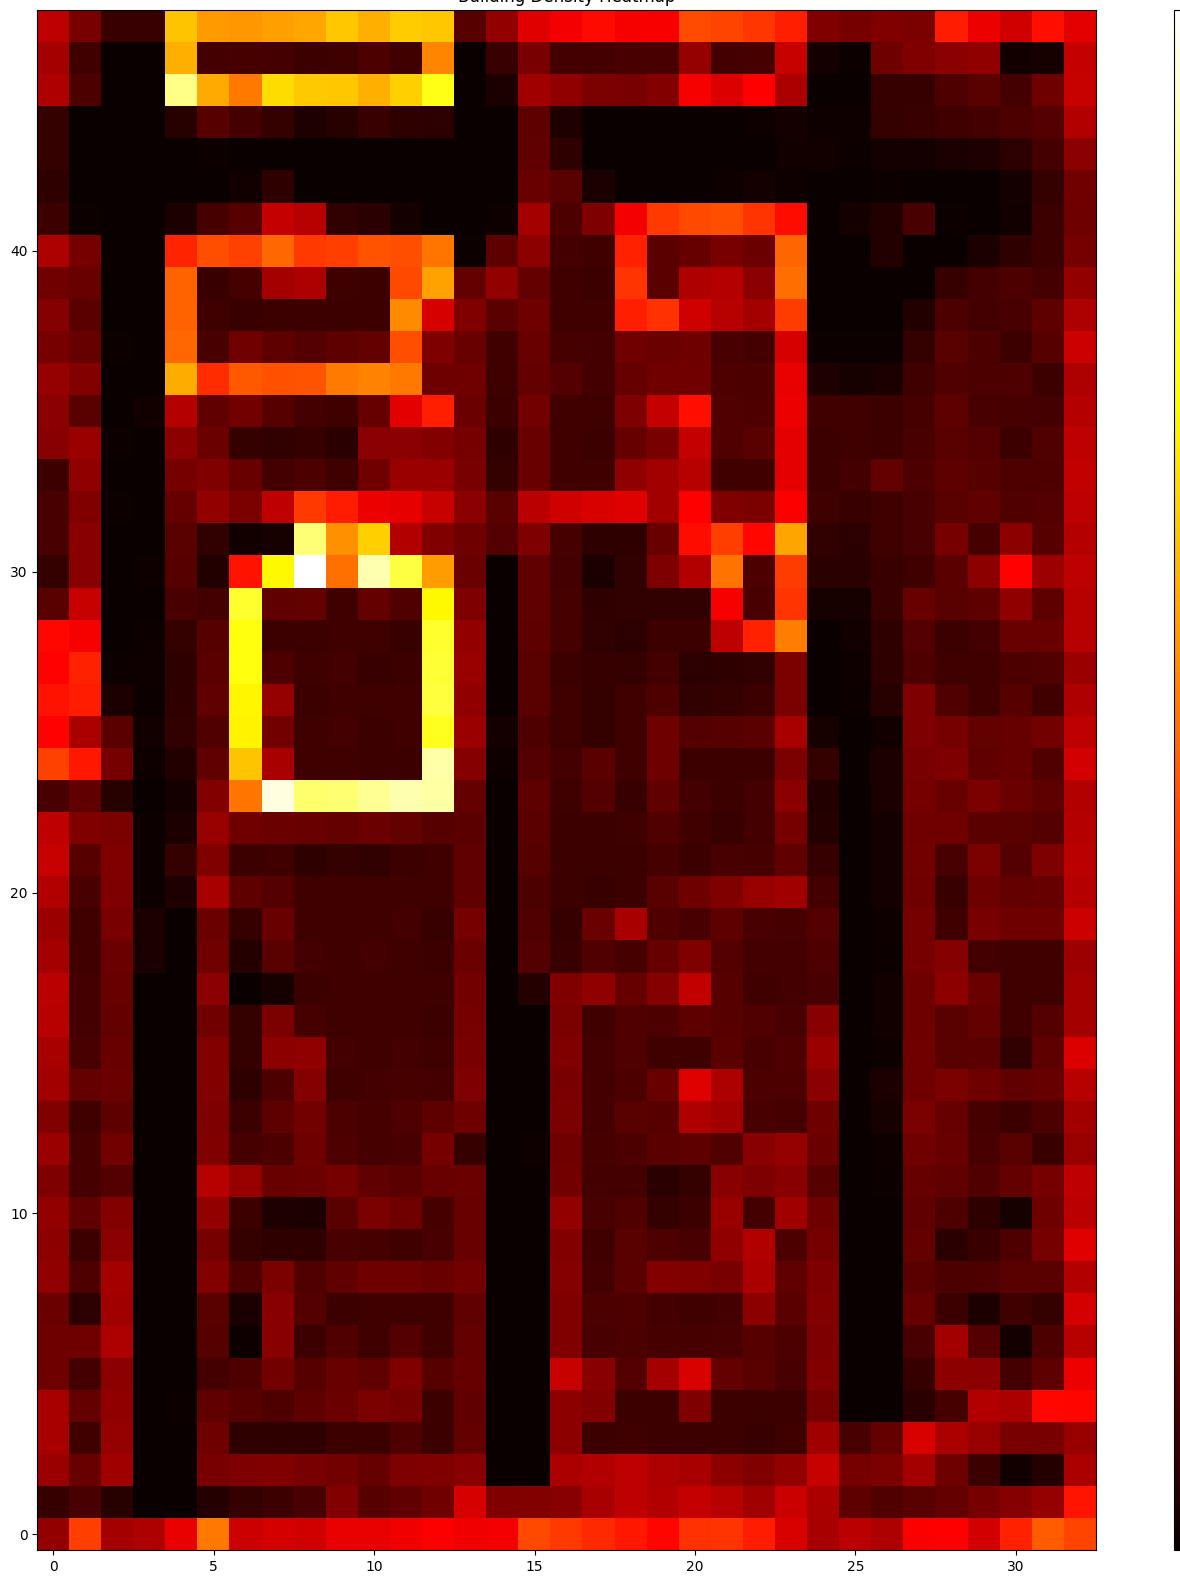
Step 2: Create a heat map to visualise count
After defining the grid and ensuring that no points lie directly on its boundaries we then visualize. Visualization is crucial for understanding building density more intuitively. By leveraging KDTree, a space-partitioning data structure, the compute_ local_density function calculates the local density of points within a specific radius in the point cloud. The colorise_point_cloud function then colourizes the point cloud based on these local densities using the 'jet' colour map, providing a
vibrant visualization of point densities in the form of a heat map.
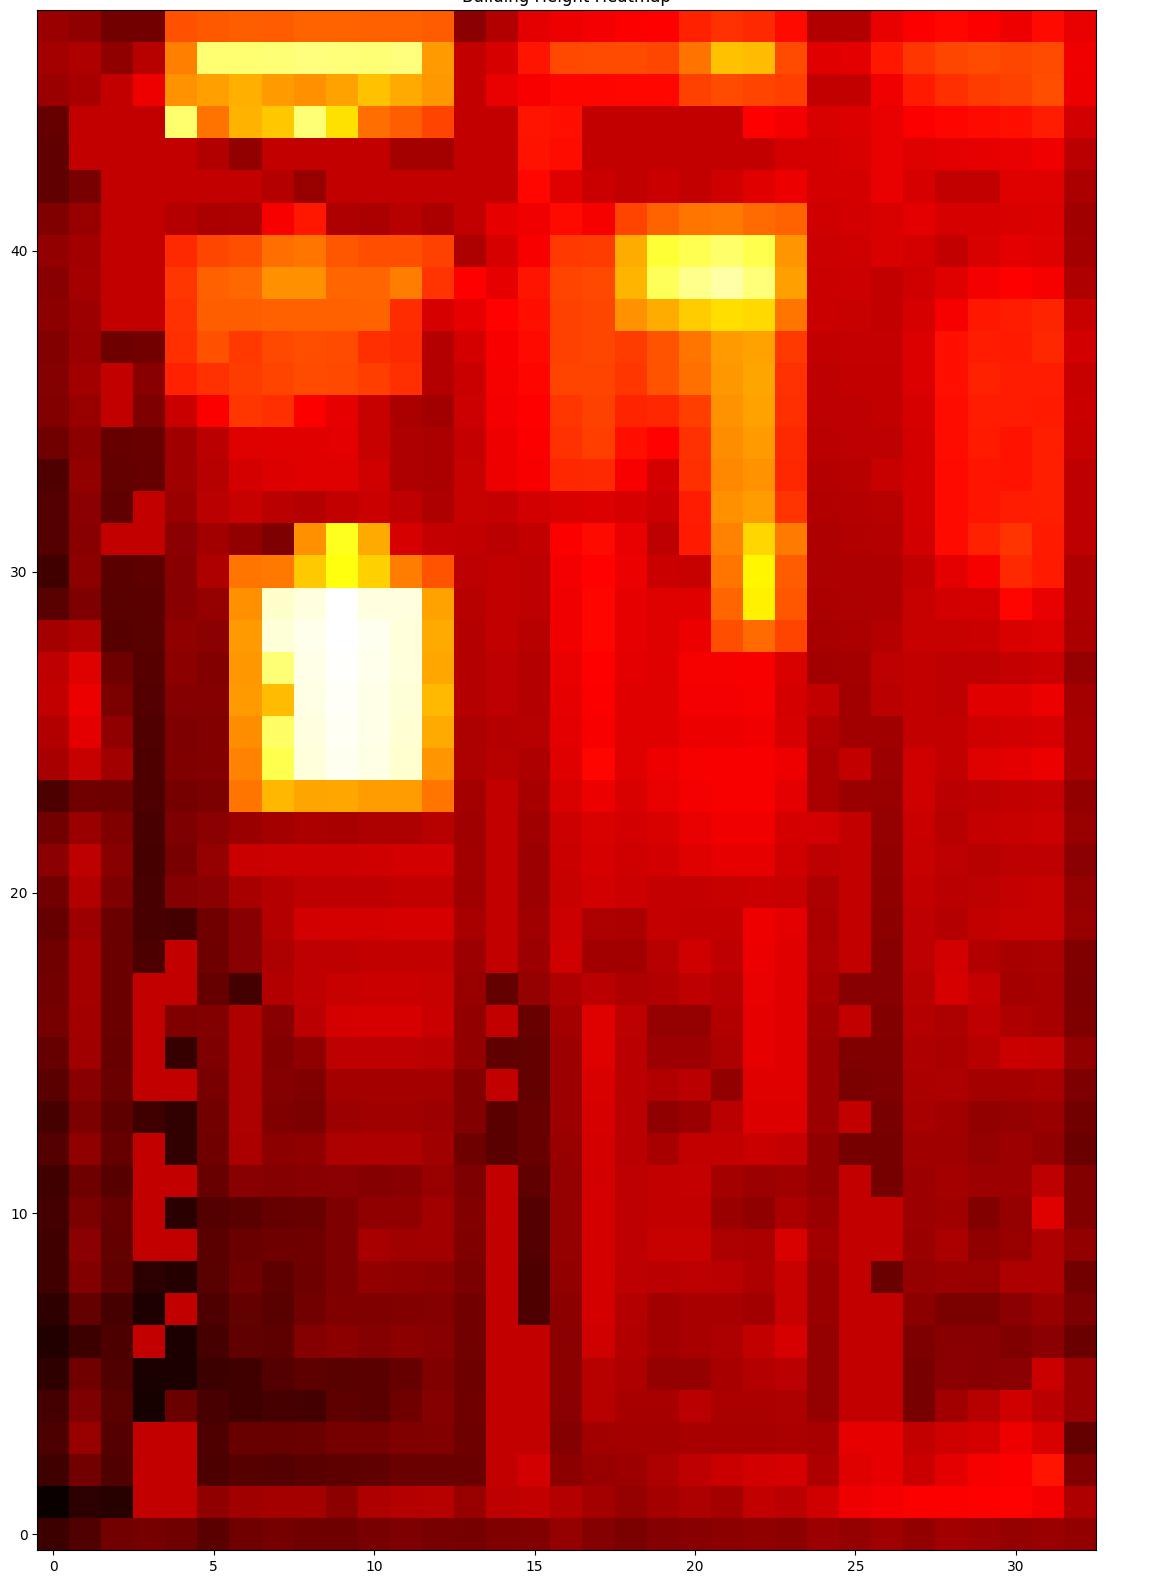
Step 3: Compute the average height of each grid cell
Start by initializing grids to store the sum of heights. The focus here is to estimate the height of buildings within each grid cell. By creating a 2D projection of the point cloud, you obtain a bird's-eye view of the area, neglecting the height (Z-axis) information. Clustering algorithms, such as DBSCAN, are then applied to this 2D projection. Each cluster corresponds to a separate building. For each identified cluster, the difference between the maximum and minimum Z values gives an estimate of the building's height. The average height for each grid cell can then be computed based on the heights of all buildings within that cell.
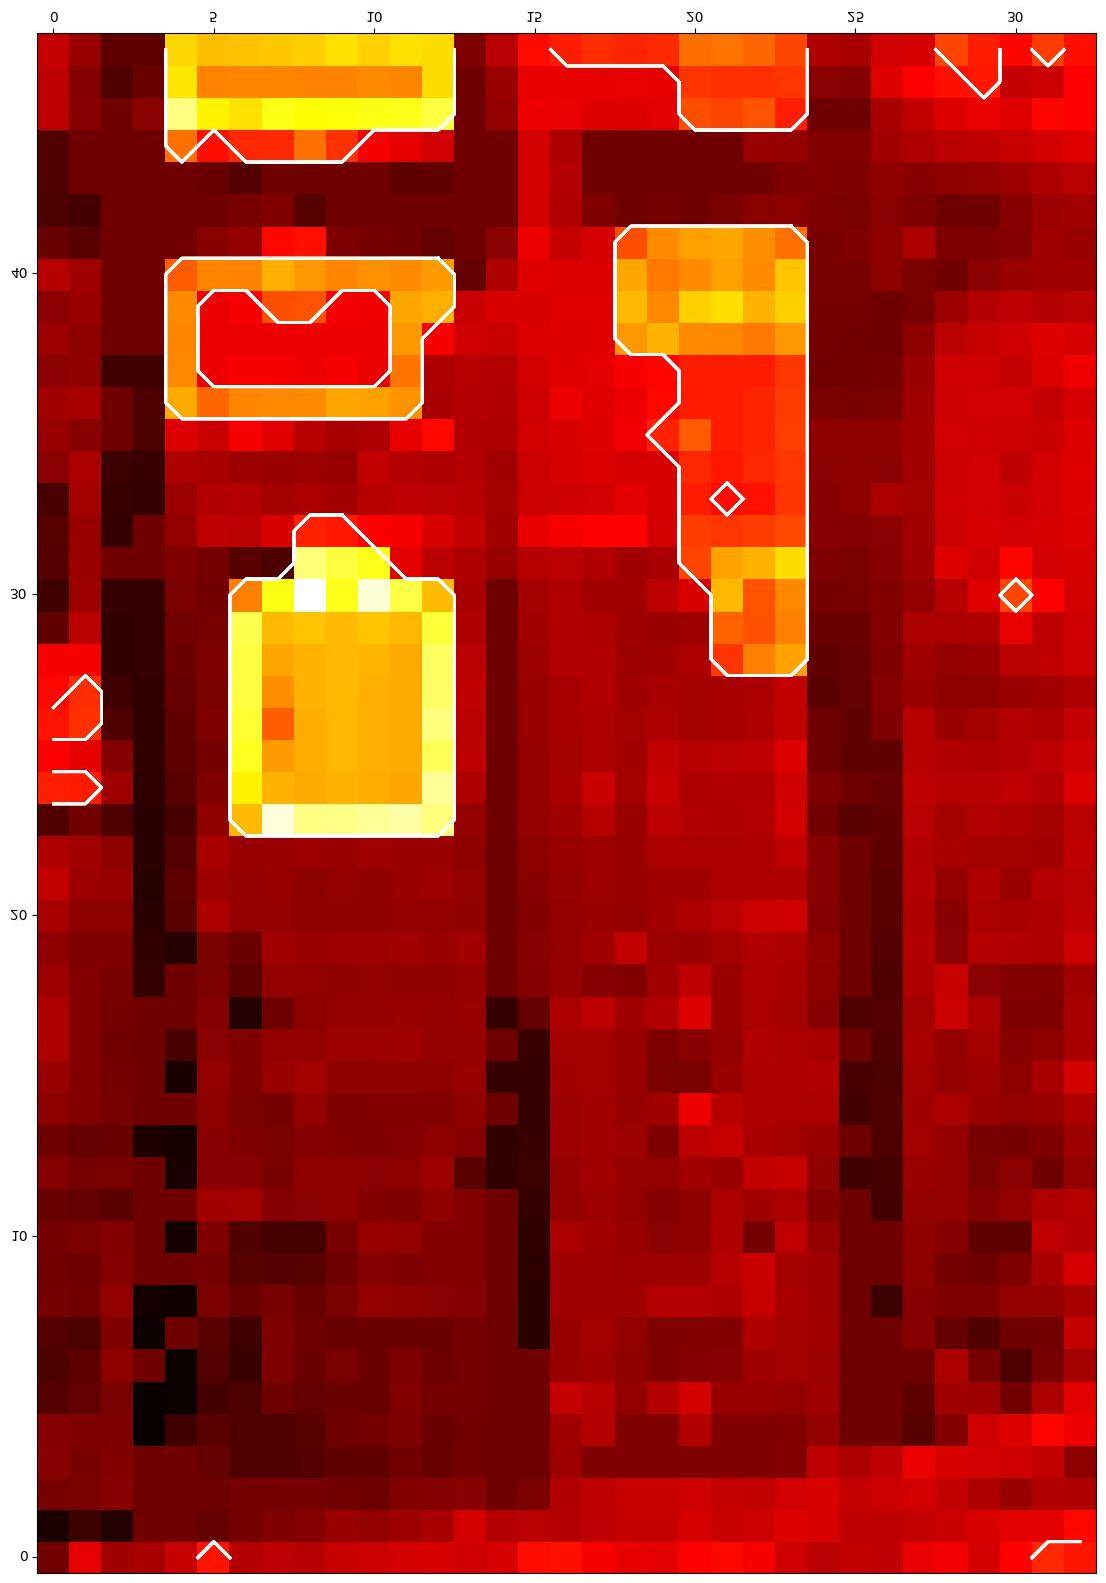
Step 4: Combine both point count and height maps
Having obtained the heatmap and height data, the next step involves integrating both datasets. The colorize_point_cloud function is used once more, but this time it combines both the point count and the height information. The sum of heights and the count of points are updated for each point in the point cloud. This combined data provides a richer, more detailed representation, allowing for a better understanding of building density in relation to height.
Step 2
Create a heat map to visualise counts.
Step 3
Initialize grids to store the sum of heights.
Step 4
Update the sum of heights and point counts for each point in the point cloud
Building density can significantly influence fire spread in urban settings. When structures are closely packed, fires can easily transfer between them due to proximity, radiant heat, and shared infrastructure.
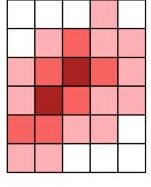
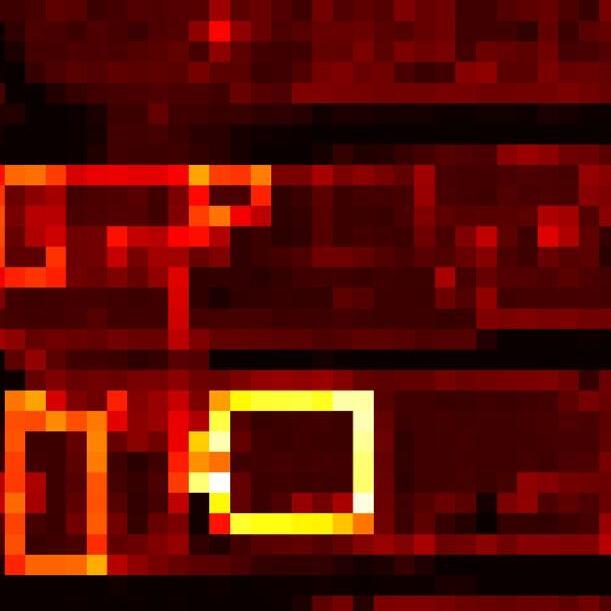
Step 5: Create contours of high density
Using the combined heatmap, regions of high building density are extracted by thresholding the map to identify high-valued regions. The outcome is a contour map that highlights areas with the highest building density. This is particularly useful for identifying zones that might be at a higher risk of rapid fire spread due to the proximity and height of the buildings.
Step 5
Thresholding the heatmap to get high-valued regions
Fire Spread Analysis
Compute the a v e r a g e h e i g h t of each grid cell c o m b i n e both point count and height maps create contours of high density Thresholding the heatmap to get highvalued regions
Update the sum of heights and count of points for each point in the point cloud
define a grid and c o u n t p o i n t s in each grid create a h e a t m a p to visualise count
Define the grid size and spacing + define the outer extents of the grid ensure that no points lie directly on the grid Initialize grids to store the sum of heights
Figure 14: Workflow outlining the fire spread analysis for building density
Figure 15: Point Heights
Figure 16: Point Densities
Figure 17: Point Heights + Densities
Figure 18: Buildings with similar densities
Categorised Combustion
Analysis of building façades materials
This workflow explores a novel approach of combining two AI ground breaking models: the Segment Anything Model (SAM) (Kirillov et al., 2023) and DINO (Deeper Into Neural Networks) (Oquab et al., 2023). Together, they offer a holistic analysis of building façades to generate a comprehensive fire risk heatmap, revealing the transformative potential of AI in urban fire safety.
Step 1: Unwrapping the Textures on the Mesh
Our analytical approach starts with the technique of UV unwrapping. This method allows us to map 2D textures onto 3D objects by translating UV coordinates. Think of it as unfolding an orange peel to lay it flat. By unwrapping the textures on building façades, we achieve correctly scaled measurements, setting the foundation for precise subsequent analyses.
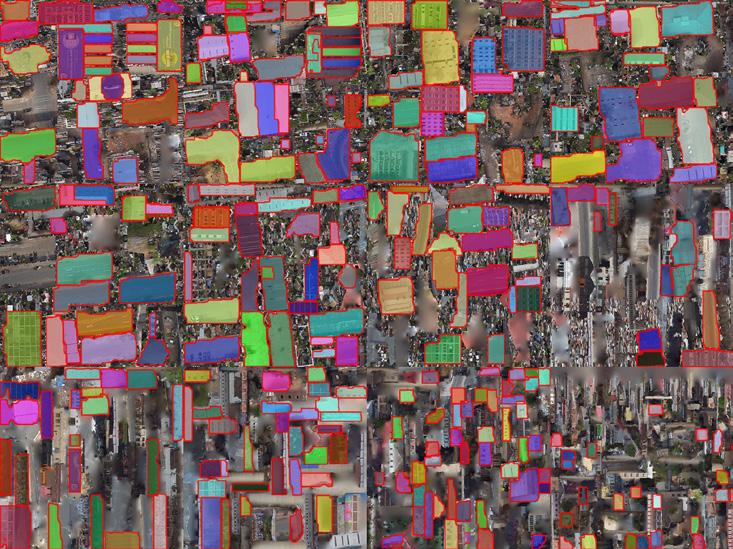
Step 2: Segment Anything Model (SAM)
SAM is very efficient for use in for semantic segmentation tasks, where the goal is to classify individual pixels in an image into distinct categories. SAM's ability to create so called ZeroShot Generalization is very useful for our case. It can recognise and segment unfamiliar objects without any prior training on those specific objects. This feature is crucial as building façades come in diverse designs and materials, and a one-sizefits-all model would not suffice.
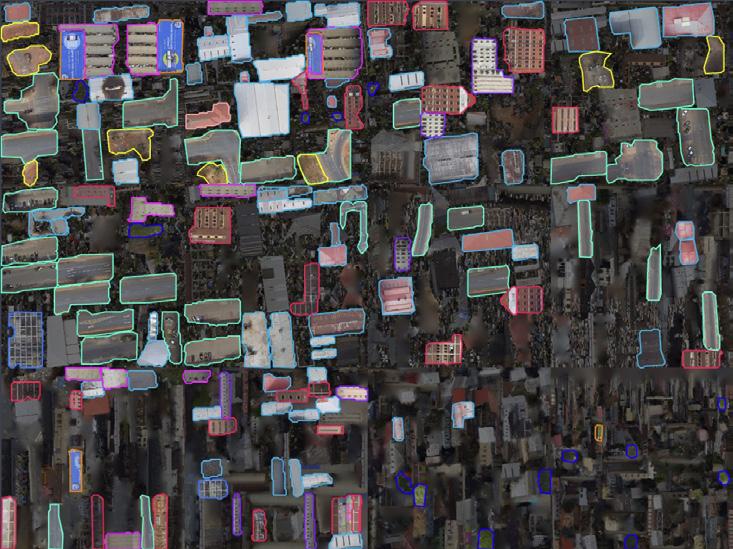
Step 3: DINO for Object Detection
DINO is another brainchild of Meta's research. This model is a game-changer in self-supervised learning, being trained without any labelled data. Its strength lies in visual representation tasks, capturing intricate details in images.
DINO's Zero-Shot Detection allows it to identify any object in an image, even if it hasn't been explicitly trained on that object. This feature, combined with SAM's segmentation, offers an unparalleled advantage in detecting various materials on building façades, regardless of their novelty.
Step
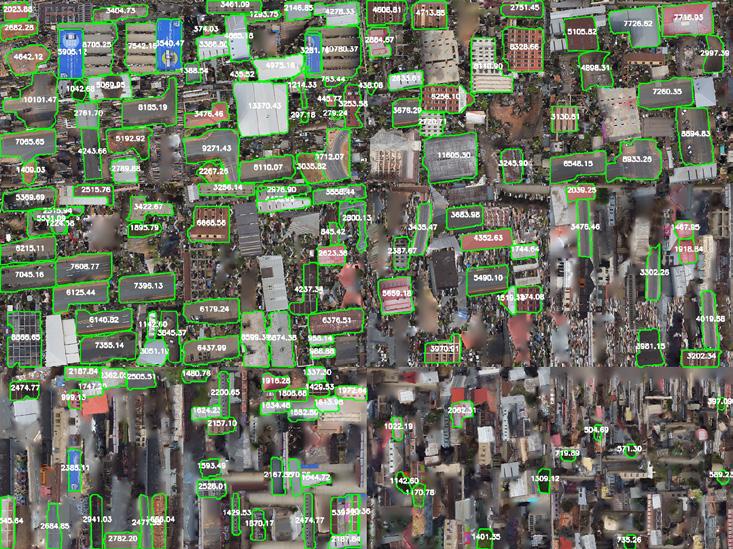
4: Measure Areas of Different Materials
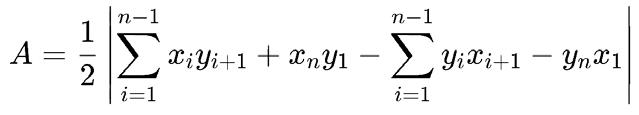
With the materials identified, we transition to measuring their areas. Calculating the area of a non-uniform (irregular) polygon can be achieved using the "Shoelace formula" (also known as Gauss's Area formula). This formula is particularly useful for polygons defined by a set of vertex coordinates. The vertex coordinates are obtained from the DINO output.
Apply Dino for Object Detection
By integrating the strengths of SAM and DINO, we've devised a novel approach to evaluate fire risks on building façades.
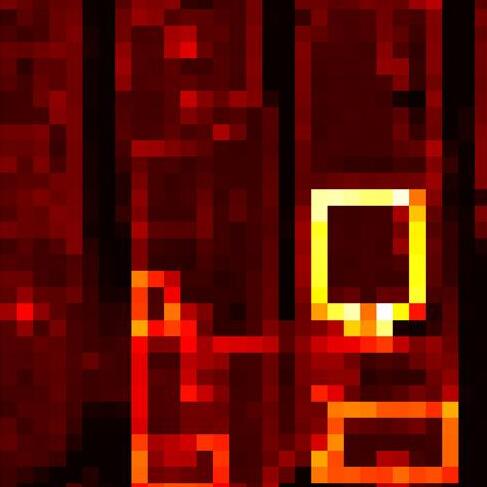
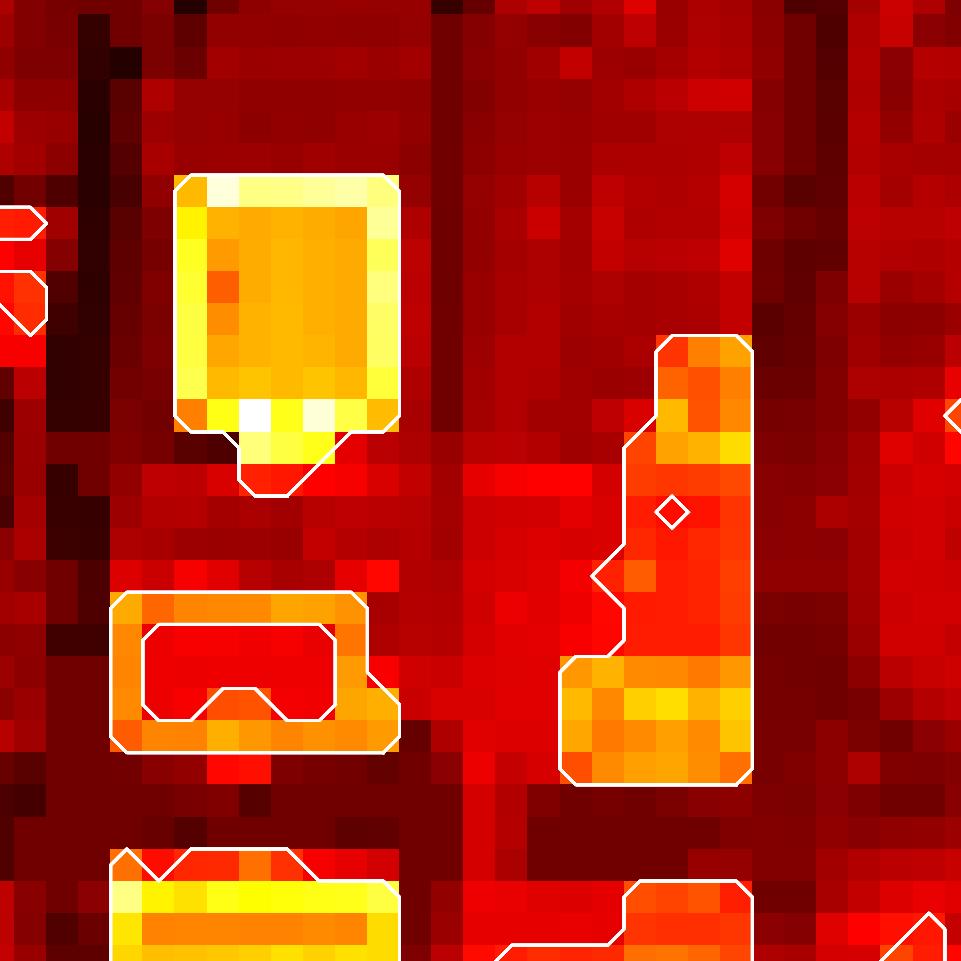
Step 5: Risk Heatmap of Materials
The culmination of our process is the creation of a risk heatmap. Materials differ in their flammability; for instance, timber and plastics present higher fire risks. The heatmap visually communicates these potential hazards, offering stakeholders a clear view of areas demanding attention.
In summary, by the fusing of SAM and DINO's capabilities we have created a new method of assessing fire risks on building façades. By methodically unwrapping textures, segmenting them, detecting materials, quantifying their areas, and visualizing risks, we've proved a new concept that could be used in measuring fire safety in urban infrastructure. This methodology not only highlights the significance of AI in enhancing urban safety but also illustrates the transformative potential of AI in real-world applications.
Step 3
Step 4
UV unwrap the textures on the mesh
Step 1
Measure areas of different materials
Step 2
Apply Segment Anything Model (SAM)
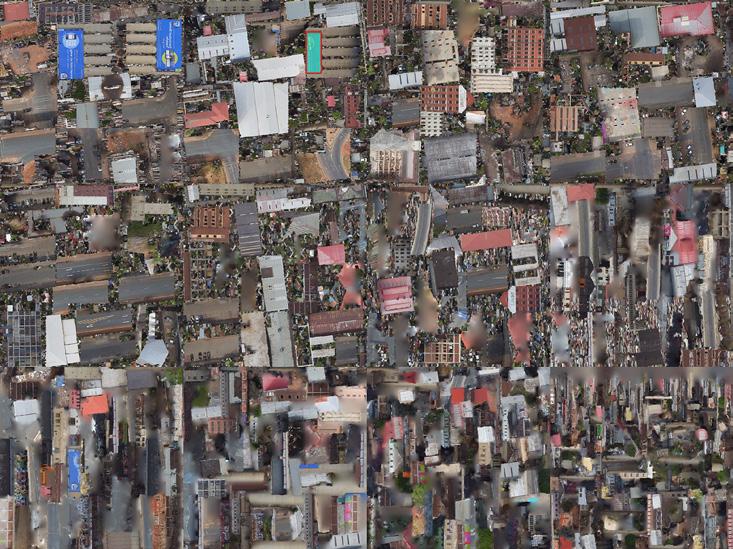
Figure 20: Facade Segmentation using the SAM model
Figure 21: Measuring materials from object detection done by using the DINO model
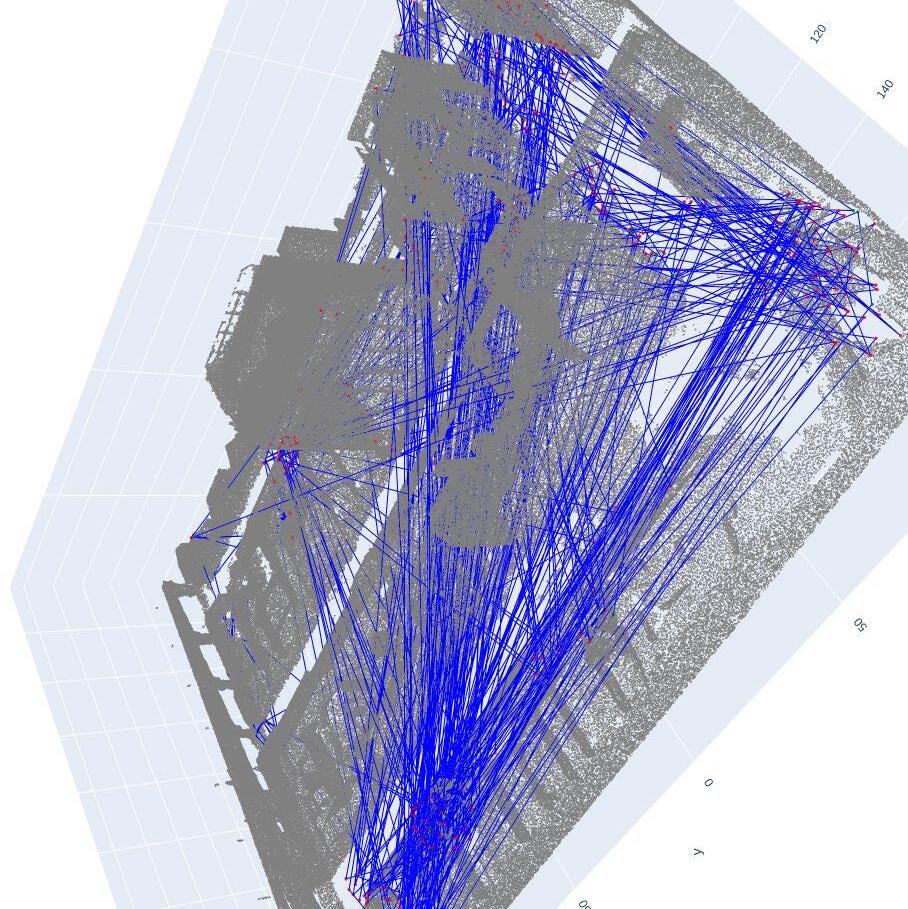
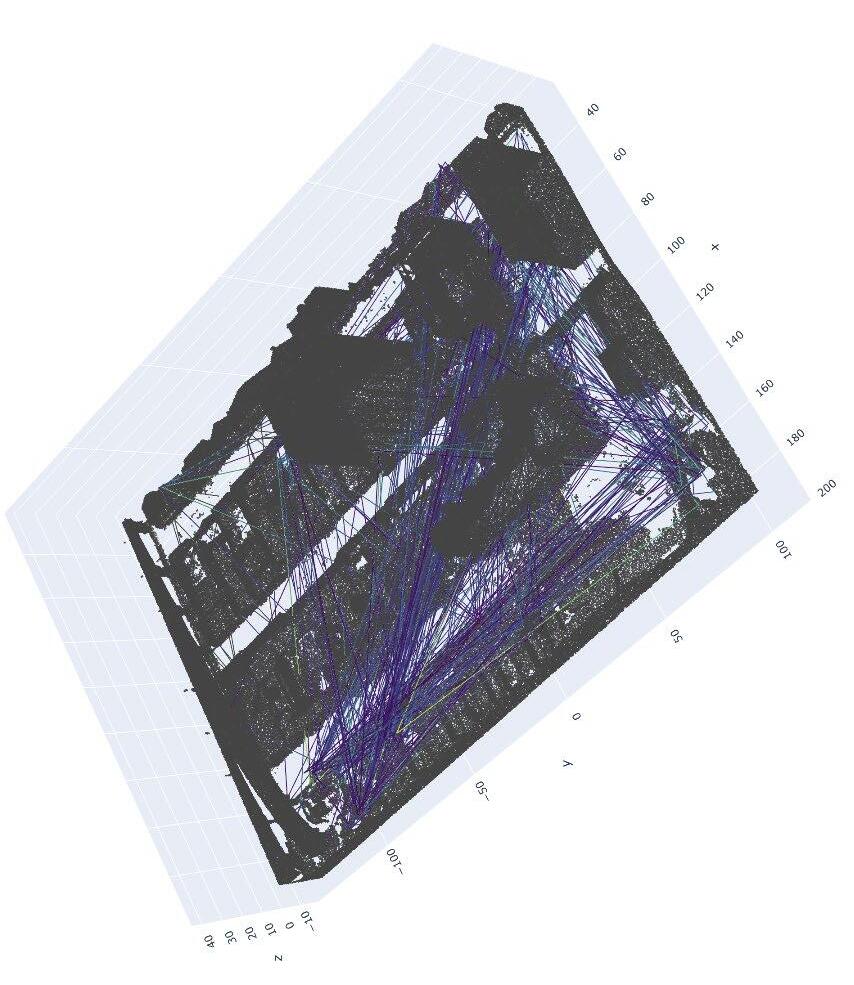
Proximity Patterns
Analysis of distances between buildings and vegetation
This workflow combines the power of neural networks, efficient data structures like KDTree, and intuitive visualisation techniques.
The intricacies of urban and environmental landscapes can be comprehensively represented using point clouds, collections of data points in three-dimensional space. While LiDAR is a common source of such data, a less resource intensive and often underutilized approach is the extraction of point clouds from three-dimensional meshes. In this research, we embraced this technique, leveraging mesh-derived point clouds to assess the proximity between buildings and vegetation – a critical determinant in urban fire risk assessment.
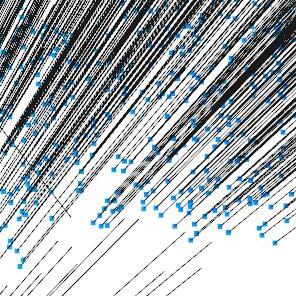
Step 1: Segmentation
Given the diverse nature of urban landscapes, it's essential to categorize each point within the cloud to its corresponding real-world entity. Utilising the PointNet++ model, a neural network architecture designed for point cloud data, we segmented the data into distinct categories: buildings, vegetation, roads, and ground. This precise categorisation ensured that subsequent analyses were based solely on pertinent data points, bolstering the accuracy and relevance of our findings.
Step 2: Determining the spatial relationships
between vegetation and buildings.
Direct computation of distances between every pair of points from two extensive datasets is not only impractical but also computationally prohibitive. Once again we made use of a KDTree, a specialized space-partitioning data structure tailor-made for such scenarios. By constructing a KDTree with building points, we instituted
a framework that could swiftly determine the nearest building counterpart for each vegetation point. This not only streamlined the process but also ensured computational efficiency without sacrificing precision.
The raw distances thus obtained, while informative, can sometimes be overwhelming in their granularity. Normalisation offered a solution. By scaling these distances between their lowest and highest values, we transformed them into a continuum ranging from 0 to 1. This normalized spectrum was then mapped onto the 'viridis' colour map, known for its perceptual uniformity. Such a visual representation rendered the data more interpretable, allowing for immediate discernment of proximity levels.
Step 3: Risk identification
Establishing mere proximities is only half the battle; the real value lies in leveraging this information to pinpoint potential hazards. To this end, points on buildings and vegetation that were below a predefined threshold, were classified as highrisk. These are the points that represent areas where the interplay between man-made structures and nature treads dangerously close, potentially escalating fire hazards.
Weather Analysis
Weather
Insights: Decoding Fire Risks
Understanding the link between meteorological conditions and wildfires is vital, turning weather insights into proactive strategies to safeguard ecosystems and communities.
The intricate dance of environmental variables shapes the world we live in. Among the myriad of challenges posed by changing climatic patterns, wildfires stand out as a particularly menacing threat. These uncontrolled blazes not only devastate ecosystems but also imperil human lives and property. To address this challenge, it’s imperative to understand the precursors to wildfires and devise predictive models for early warnings. This chapter delves deep into the nexus between weather parameters and fire risk, harnessing the power of technology and analytical methodologies.
Wildfires
Wildfires have become a recurrent phenomenon. The aftermath of these fires is often catastrophic, leading to loss of life, property, and long-lasting environmental damage. While several factors contribute to the onset and spread of wildfires, meteorological conditions remain a dominant influence. Recognising this, our study seeks to establish a robust model that correlates specific weather parameters with the potential risk of fire.
Resource: API
The decision to employ an API, specifically from Visual Crossing Weather (Visual Crossing, 2023), is rooted in the following reasons:
Data Accuracy and Reliability: APIs, especially those from established sources, offer data that is both current and reliable. This ensures our analysis is grounded in the most recent and dependable information.
Efficiency: Manual data retrieval can be tedious
and error-prone. APIs streamline this, ensuring consistent data while conserving time.
Scalability: APIs are inherently scalable. As our research scope expands or if we opt to encompass more geographical regions, the API can accommodate these needs with minimal adjustments to our existing framework.
Methodology
Our approach to understanding and predicting fire risk based on weather parameters is systematic and can be broken down into the following steps:
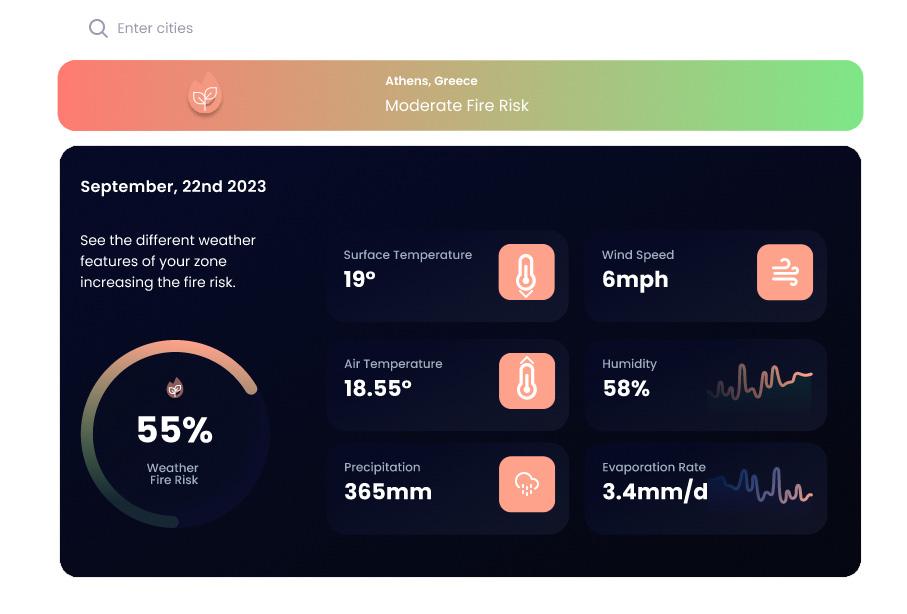
Step 1: Data Retrieval: Using the API, we fetch weather data for a specified location. This data encompasses various parameters, including but not limited to, surface temperature, wind speed, air temperature, humidity, and precipitation.
Step 2: Data Parsing: Once retrieved, the data, which is in CSV format, is parsed into a dictionary for easier manipulation and analysis.
Step 3: Risk Calculation: With the parsed data at our disposal, we employ a predefined formula to calculate a fire risk score. This formula integrates various weather parameters, assigning different weights to each based on their significance in influencing fire risk.
Step 4: Risk Categorization: The calculated risk score is then normalized and categorized into different risk levels: High, Medium, or Low. This categorization aids in providing clear, actionable insights.
Significance of Weather Parameters in Fire Risk Assessment
Weather is a predominant factor in determining the likelihood and severity of wildfires:
Temperature: Elevated temperatures desiccate vegetation, rendering it more combustible.
Wind Speed: Winds, especially when strong, can propagate fires at alarming rates, complicating containment efforts.
Humidity: A lower humidity level signifies drier conditions, which are conducive to fire initiation and spread.
Precipitation: An absence or scarcity of rainfall results in parched soil and vegetation, heightening fire susceptibility.
Our risk assessment formula is meticulously crafted to reflect the importance of each parameter. For instance, parameters like maximum surface temperature and wind speed are accorded higher weights due to their pronounced impact on fire propagation.
Technology
In an era marked by climatic uncertainties, understanding the interplay between weather and fire risk is more crucial than ever. By harnessing technologies like APIs and crafting predictive models, we can preemptively address and mitigate the ravages of wildfires. This research is a stride towards that goal, offering a comprehensive,
data-centric approach to fire risk assessment. As we move forward, refining this model with realtime data and expanding its geographical scope will be pivotal in enhancing its predictive accuracy and utility.
Average daily air temperature
Average daily relative humidity
Minimum daily surface temperature
Minimum daily air temperature
Maximum daily surface temperature
Maximum daily wind speed
Minimum daily relative humidity
Daily precipitation
Maximum daily air temperature
Daily average vapor-pressure
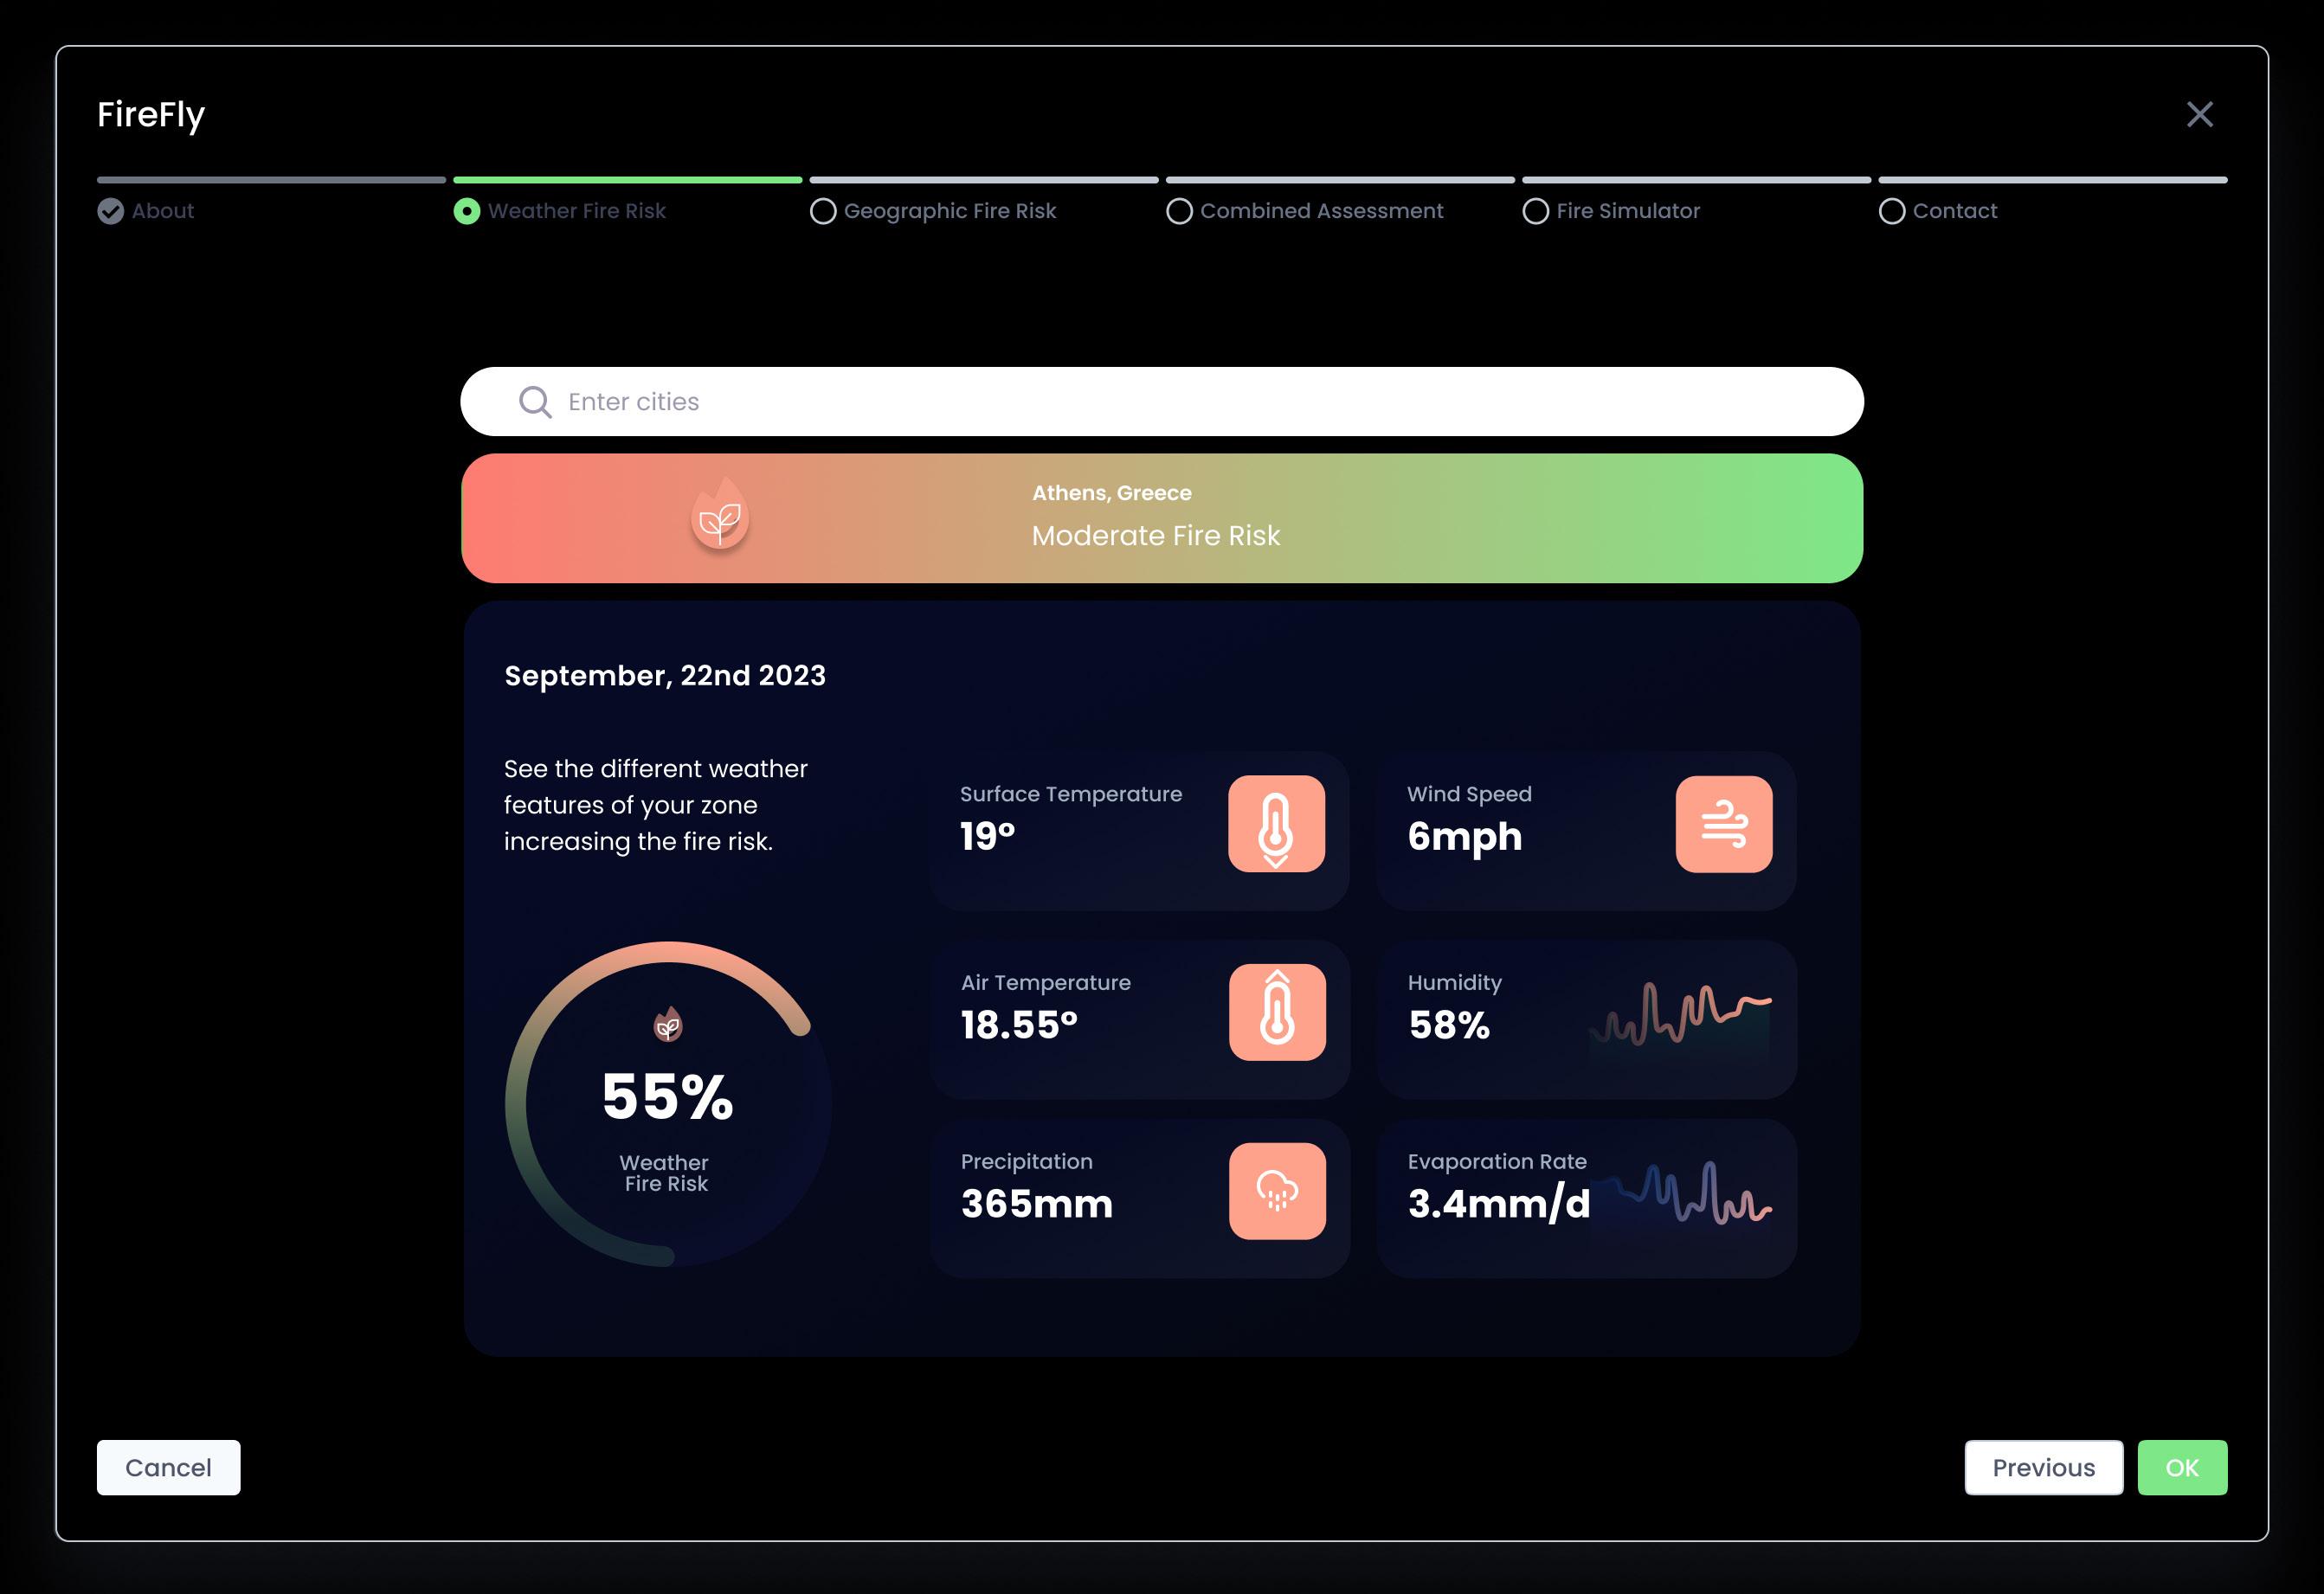
An extracted screenshot of our proposed User Interface providing weather related fire risk information
Fire Spread Simulation
Predictive wildfire modeling and mitigation
Leveraging heatmaps and a cellular automata to model, we can visualise and mitigate wildfire progression across an urban landscape.
The fire spread simulation is a computational representation of how fire propagates through a landscape. It is designed to visualise and predict fire spread based on various factors, such as terrain, vegetation, and atmospheric conditions. The process of simulating fire spread that we have adopted uses a combination of summary heatmaps and cellular automata rules1
Heatmap Generation
The foundation of the simulation relies on generating heatmaps that represent different conditions across the landscape. These heatmaps provide a normalised visual of the various fire spread analytics. The maps represent all the variables previously described including vegetation spread analysis, slope and aspect, building density, facade materials and distances from vegetation to buildings.
Combining Multiple Heatmaps
Multiple heatmaps are combined to account for various influencing factors. The combineMaps function achieves this by:
Retrieving weights associated with each heatmap from sliders (slider1 to slider5).
Calculating the average intensity from all the heatmaps, weighted by their respective weights. Generating a combined greyscale heatmap (map6) and a copy for the simulation (map7). To ensure a uniform distribution of greyscale values across the heatmap, histogram equalization is applied using
the histogramEqualization function. This process enhances the contrast of the heatmap, making the varying conditions more distinguishable.
Cellular Automata for Fire Spread
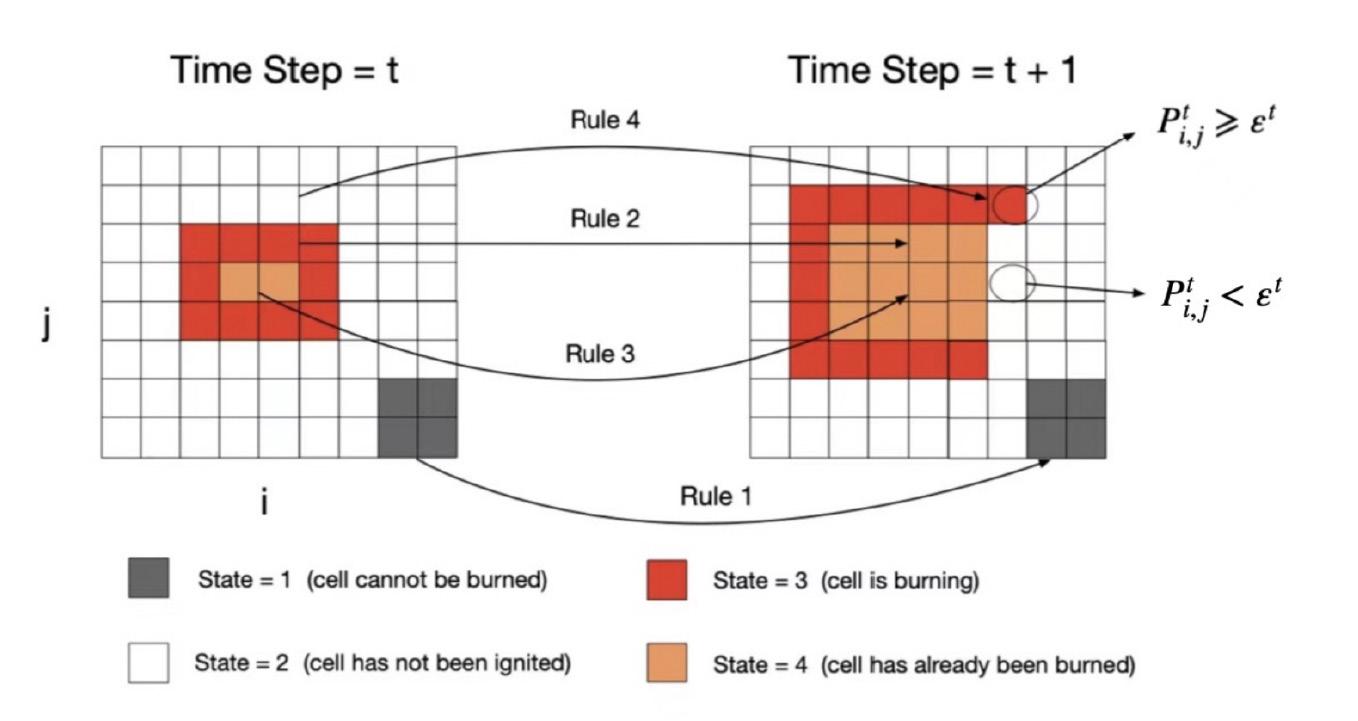
The fire spread is simulated using a cellular automata model, where each cell represents a portion of the landscape and can be in one of the following states:
Can not be burned: Areas that are not flammable. Not Ignited: Flammable areas yet to be ignited. Burning: Areas currently burning. Burned: Areas that have burned out.
The simulation's progression is governed by the ComputeNextState function, which determines the next state of each cell based on its current state and the states of its neighbours. Specifically:
If the cell cannot be burned due to lack of fuel, then it remains in the same state at the next discrete time step. If the cell is burning, its state is updated to burned at the next discrete time step.
• If the cell is burned, then it remains in the same state at the next discrete time step.
• If the cell has not been ignited and at least one its neighbouring cells is burning and if the state transition likelihood of the cell is higher than a random probability threshold et, then its state is updated to burning at the next discrete time step.
1 The CA method that our workflow deployed is based on the paper by Yiqing Xu , Dianjing Li, Hao Ma, Rong Lin and Fuquan Zhang in their 2022 paper entitled: Modeling Forest Fire Spread Using Machine Learning-Based Cellular Automata in a GIS Environment
Proactive Fire-break Creation around High-Risk Areas
To enhance the efficacy of fire containment efforts, the workflow introduces a strategic approach using the createFirebreakAroundHighRisk function. This function focuses on identifying high-risk areas in the landscape and establishing fire-breaks around them. Fire-breaks are barriers, often devoid of vegetation, designed to halt or slow the spread of a wildfire.
Identifying High-Risk Areas
The identifyHighRiskAreas function is crucial. It fetches the image data from map6 (which represents the combined heatmap) and calculates the intensity of each grid square based on its colour. The function then sets a threshold to identify the top 10% of the most intense (and hence potentially high-risk) regions. Any grid square with an intensity above this threshold is flagged as a high-risk area.
Creating Fire-breaks
Automatically:
The createFirebreakAroundHighRisk function, upon identifying high-risk coordinates, inspects the surrounding grid cells (both adjacent and diagonal). For each of these cells within the landscape's bounds, the addFirebreak function is invoked to establish a fire-break.
Manually:
Additionally, users can create fire-breaks manually by clicking on map6. Each click triggers the addFirebreak function for the clicked location.
The Add Fire-break Mechanism: The addFirebreak function determines the grid coordinates from the clicked or passed canvas coordinates. If the selected grid square isn't already marked as a fire-break (represented by FIRE_BREAK), it is then designated as a fire-break. A counter, blueGridCounter, tracks the number of grid squares marked as fire-breaks, and this count is displayed on the interface. Visually, the grid square is coloured blue on map6 to indicate its status as a fire-break.
By proactively establishing fire-breaks around vulnerable regions, the simulation anticipates potential fire pathways and introduces preventive measures to counteract rapid fire spread in critical areas. This ability to both automatically identify risk areas and allow manual intervention offers a flexible and strategic approach that mirrors real-world strategies, where fire-breaks are often created to protect assets or particularly vulnerable parts of a landscape.
Visualisation
The drawGrid function visualizes the grid, colouring each cell based on its state. The initializeFire function sets a few random cells to the BURNING state as the initial ignition points. The simulation can be advanced step-by-step using the stepSimulation button, which repeatedly computes the next state and updates the visualization until no changes are observed.
User Interaction
Users can adjust the weights of individual heatmaps using sliders. These weights influence
the combined heatmap and, subsequently, the fire spread simulation. As weights are adjusted, the combined heatmap updates in real-time.
The fire spread simulation workflow provides a comprehensive method to model and visualize the propagation of fire across a landscape. By combining heatmaps and cellular automata, it offers a dynamic representation of fire behaviour, influenced by various conditions and factors.
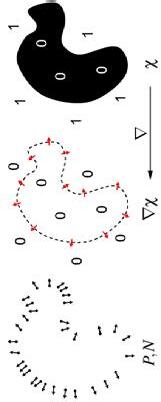
Figure 23: The principle of cellular automata state transition. Based on a 2022 paper by Yiqing Xu , Dianjing Li, Hao Ma, Rong Lin and Fuquan Zhang entitled: Modeling Forest Fire Spread Using ML-Based CA
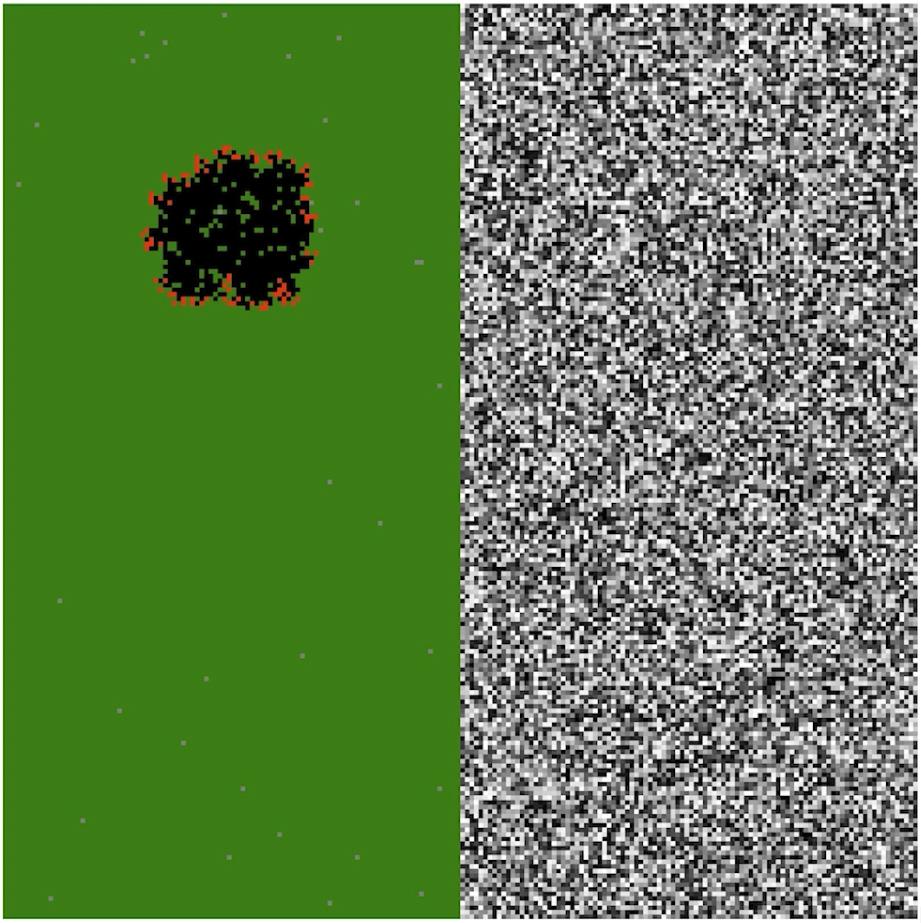
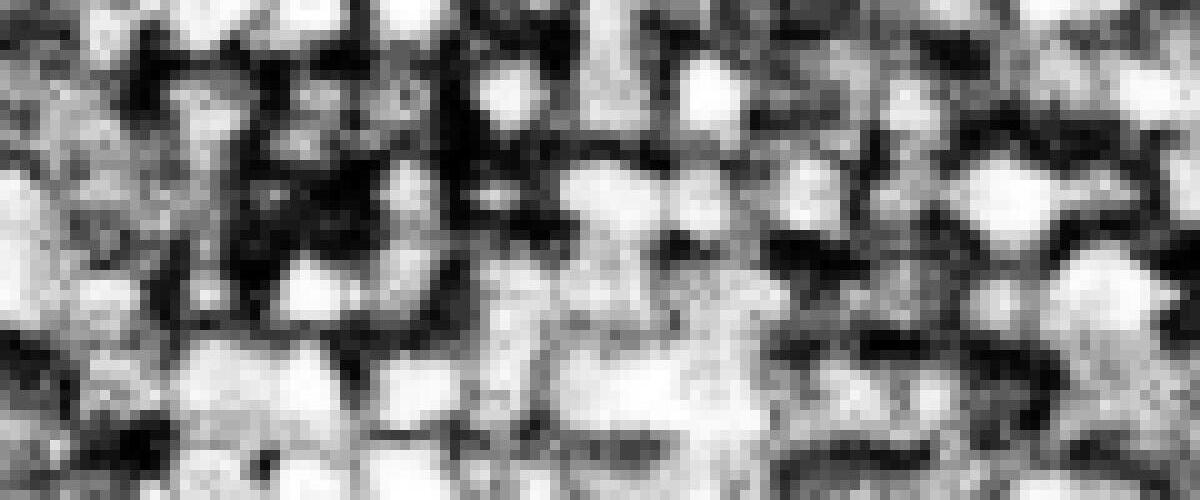
Figure 24: A snapshot of a CA fire spread simulation underway. We first tested the CA on a randomly generated grey scale map.
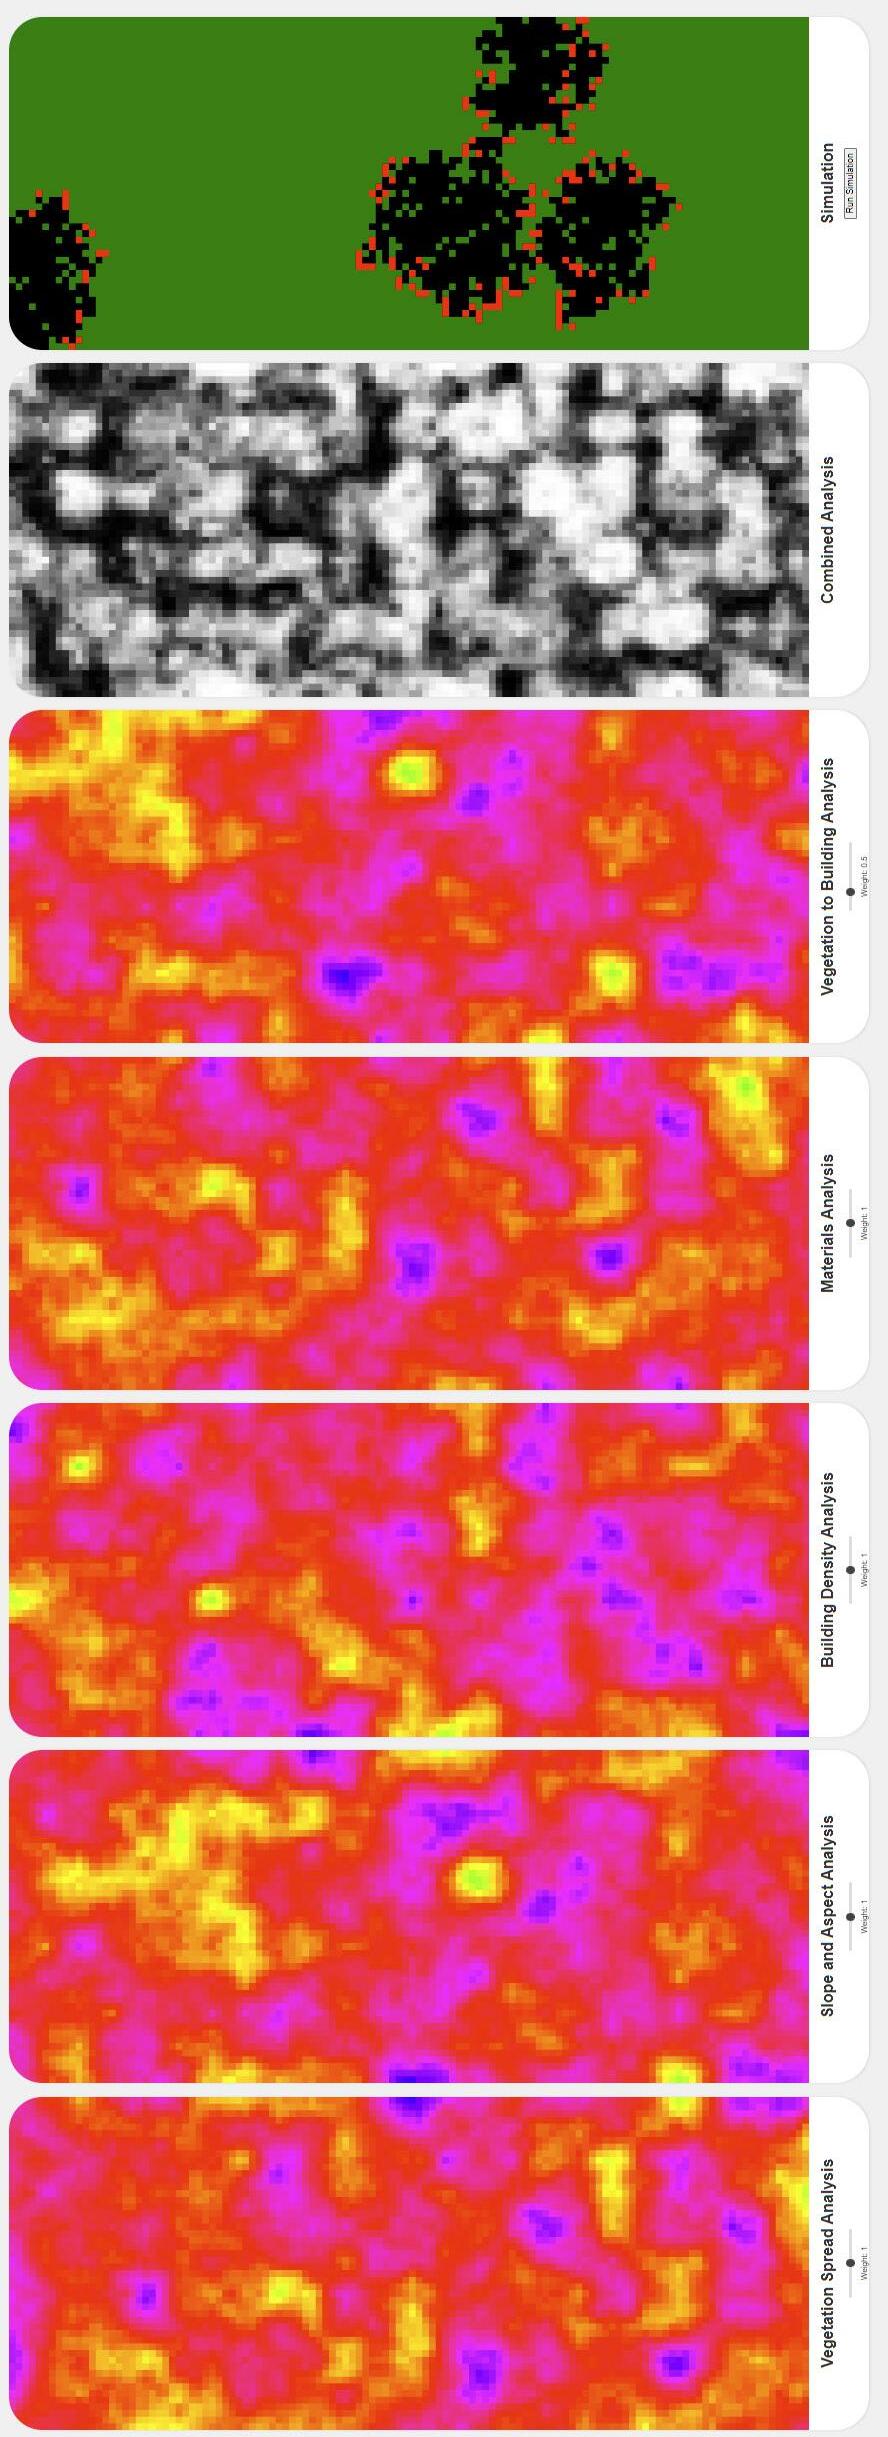
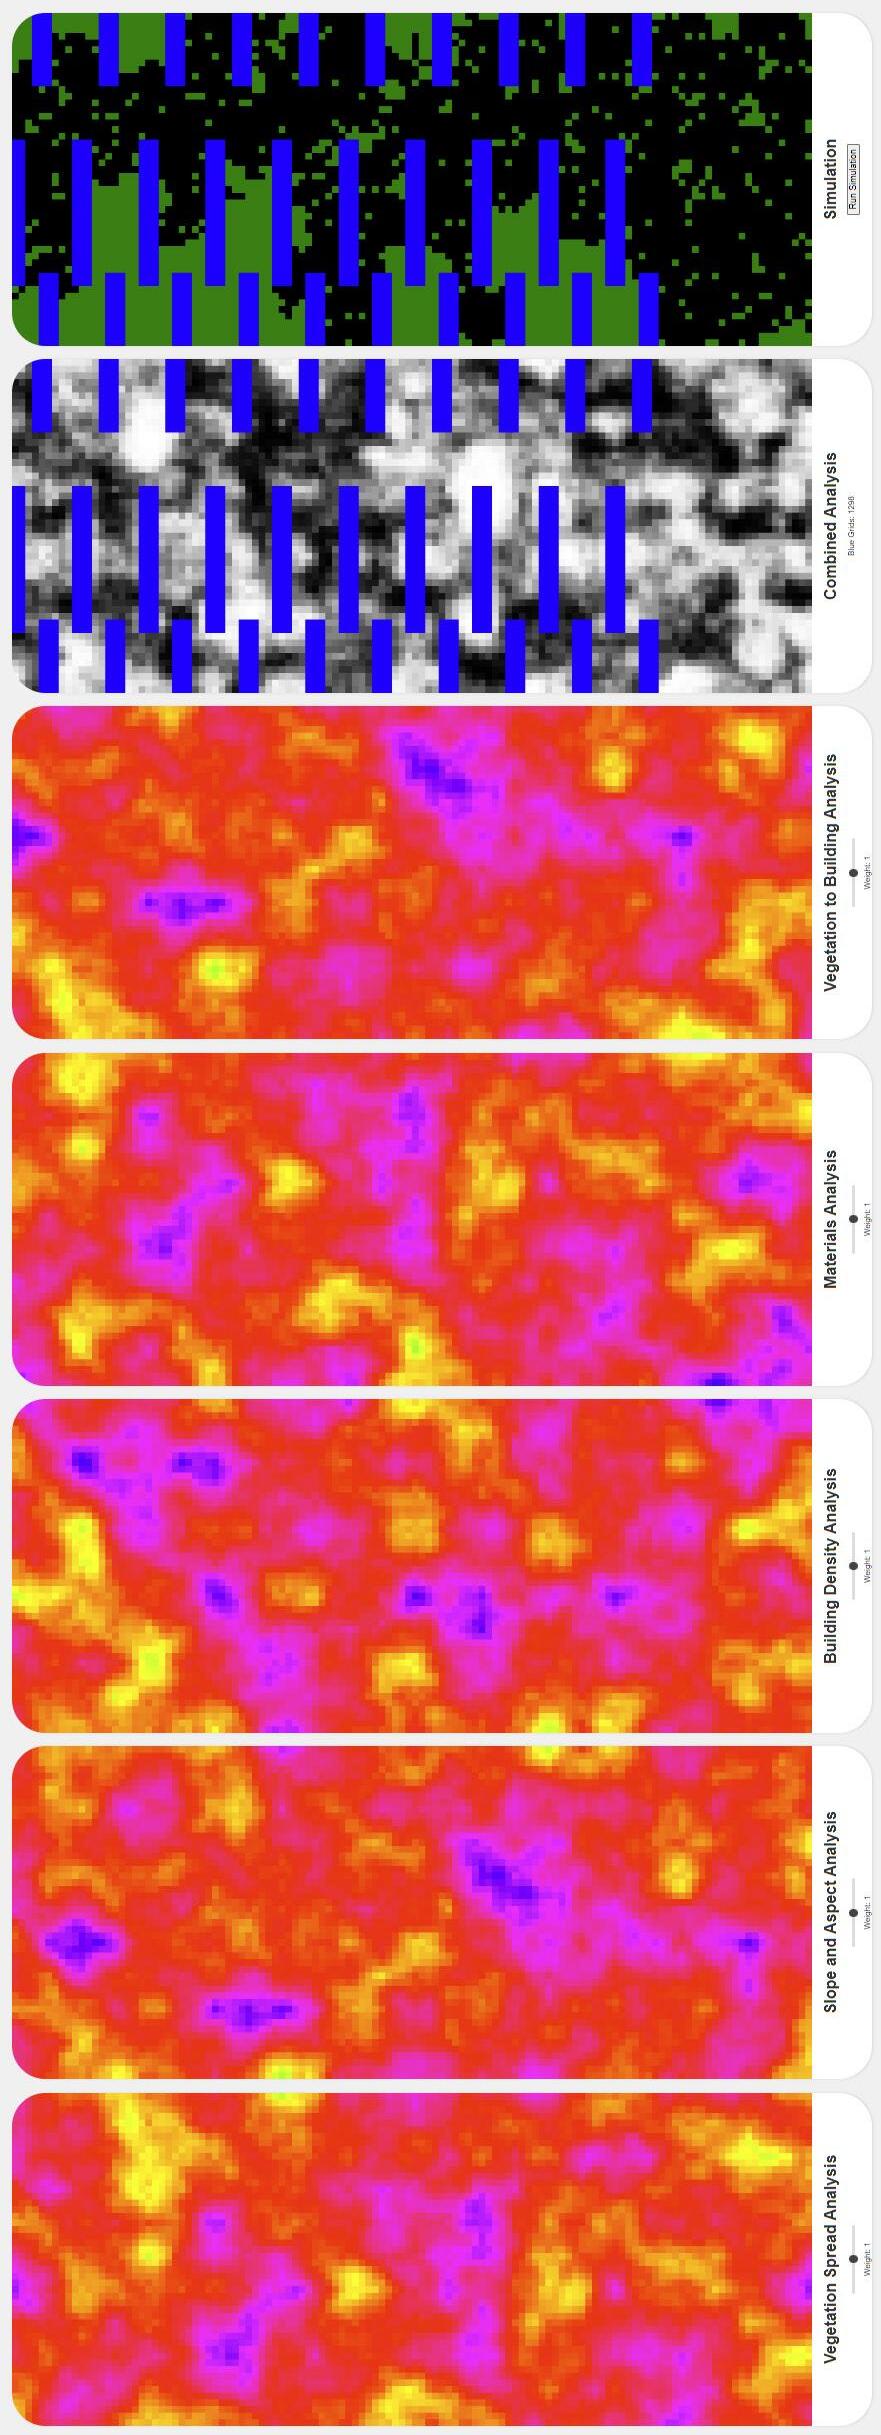
Figure 25: A screenshot showing part of the summary UI. Each of the maps have a slider that weights the variable. The greyscale map is a combined summary map and the map of the far right runs the final simulation. The bottom row of maps shows the fire breaks and their a ffect on the spread of fire.
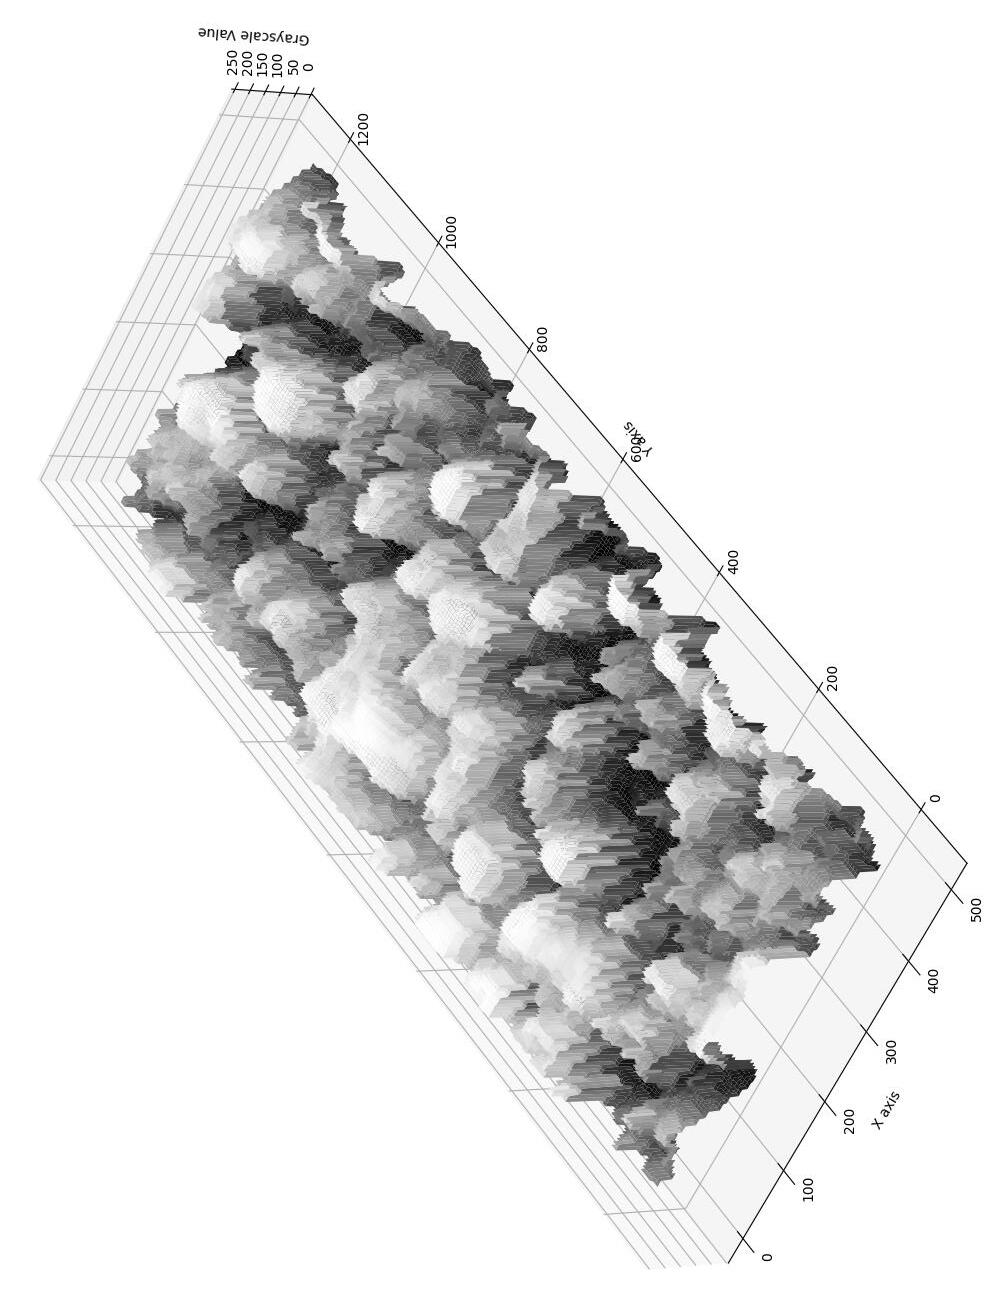
Figure 26: This visual takes the summary greyscale map and creates a ‘bump’ map that results in a voxelated model where the height of the voxels are based on the greyscale values.
A
Guided User Experience User Interface
Through an intuitive user interface, the app democratizes access to advanced fire risk assessments, ensuring everyone, regardless of technical expertise, can safeguard their communities.
In the realm of fire risk assessment, the user interface (UI) plays a pivotal role in ensuring that users can seamlessly access, interpret, and act upon the data presented. FireFly, with its intuitive stepped design, ensures that users are guided through the process, from gathering initial information to receiving a comprehensive fire risk assessment.
Stepped Approach
FireFly adopts a stepped approach, breaking down the complex process of fire risk assessment into manageable stages. This design ensures that users are not overwhelmed with information and can focus on one aspect of the assessment at a time.
Step 1: Get Informed: This step serves as an introduction, acquainting users with the project’s objectives, the team behind it, the offerings, and a step-by-step guide on how the system works.
Step 2: Get Weather Fire Risk: By simply inputting their location, users can fetch real-time weather data pertinent to fire risks. This data, sourced from reliable APIs, provides insights into various weather parameters that influence fire risks.
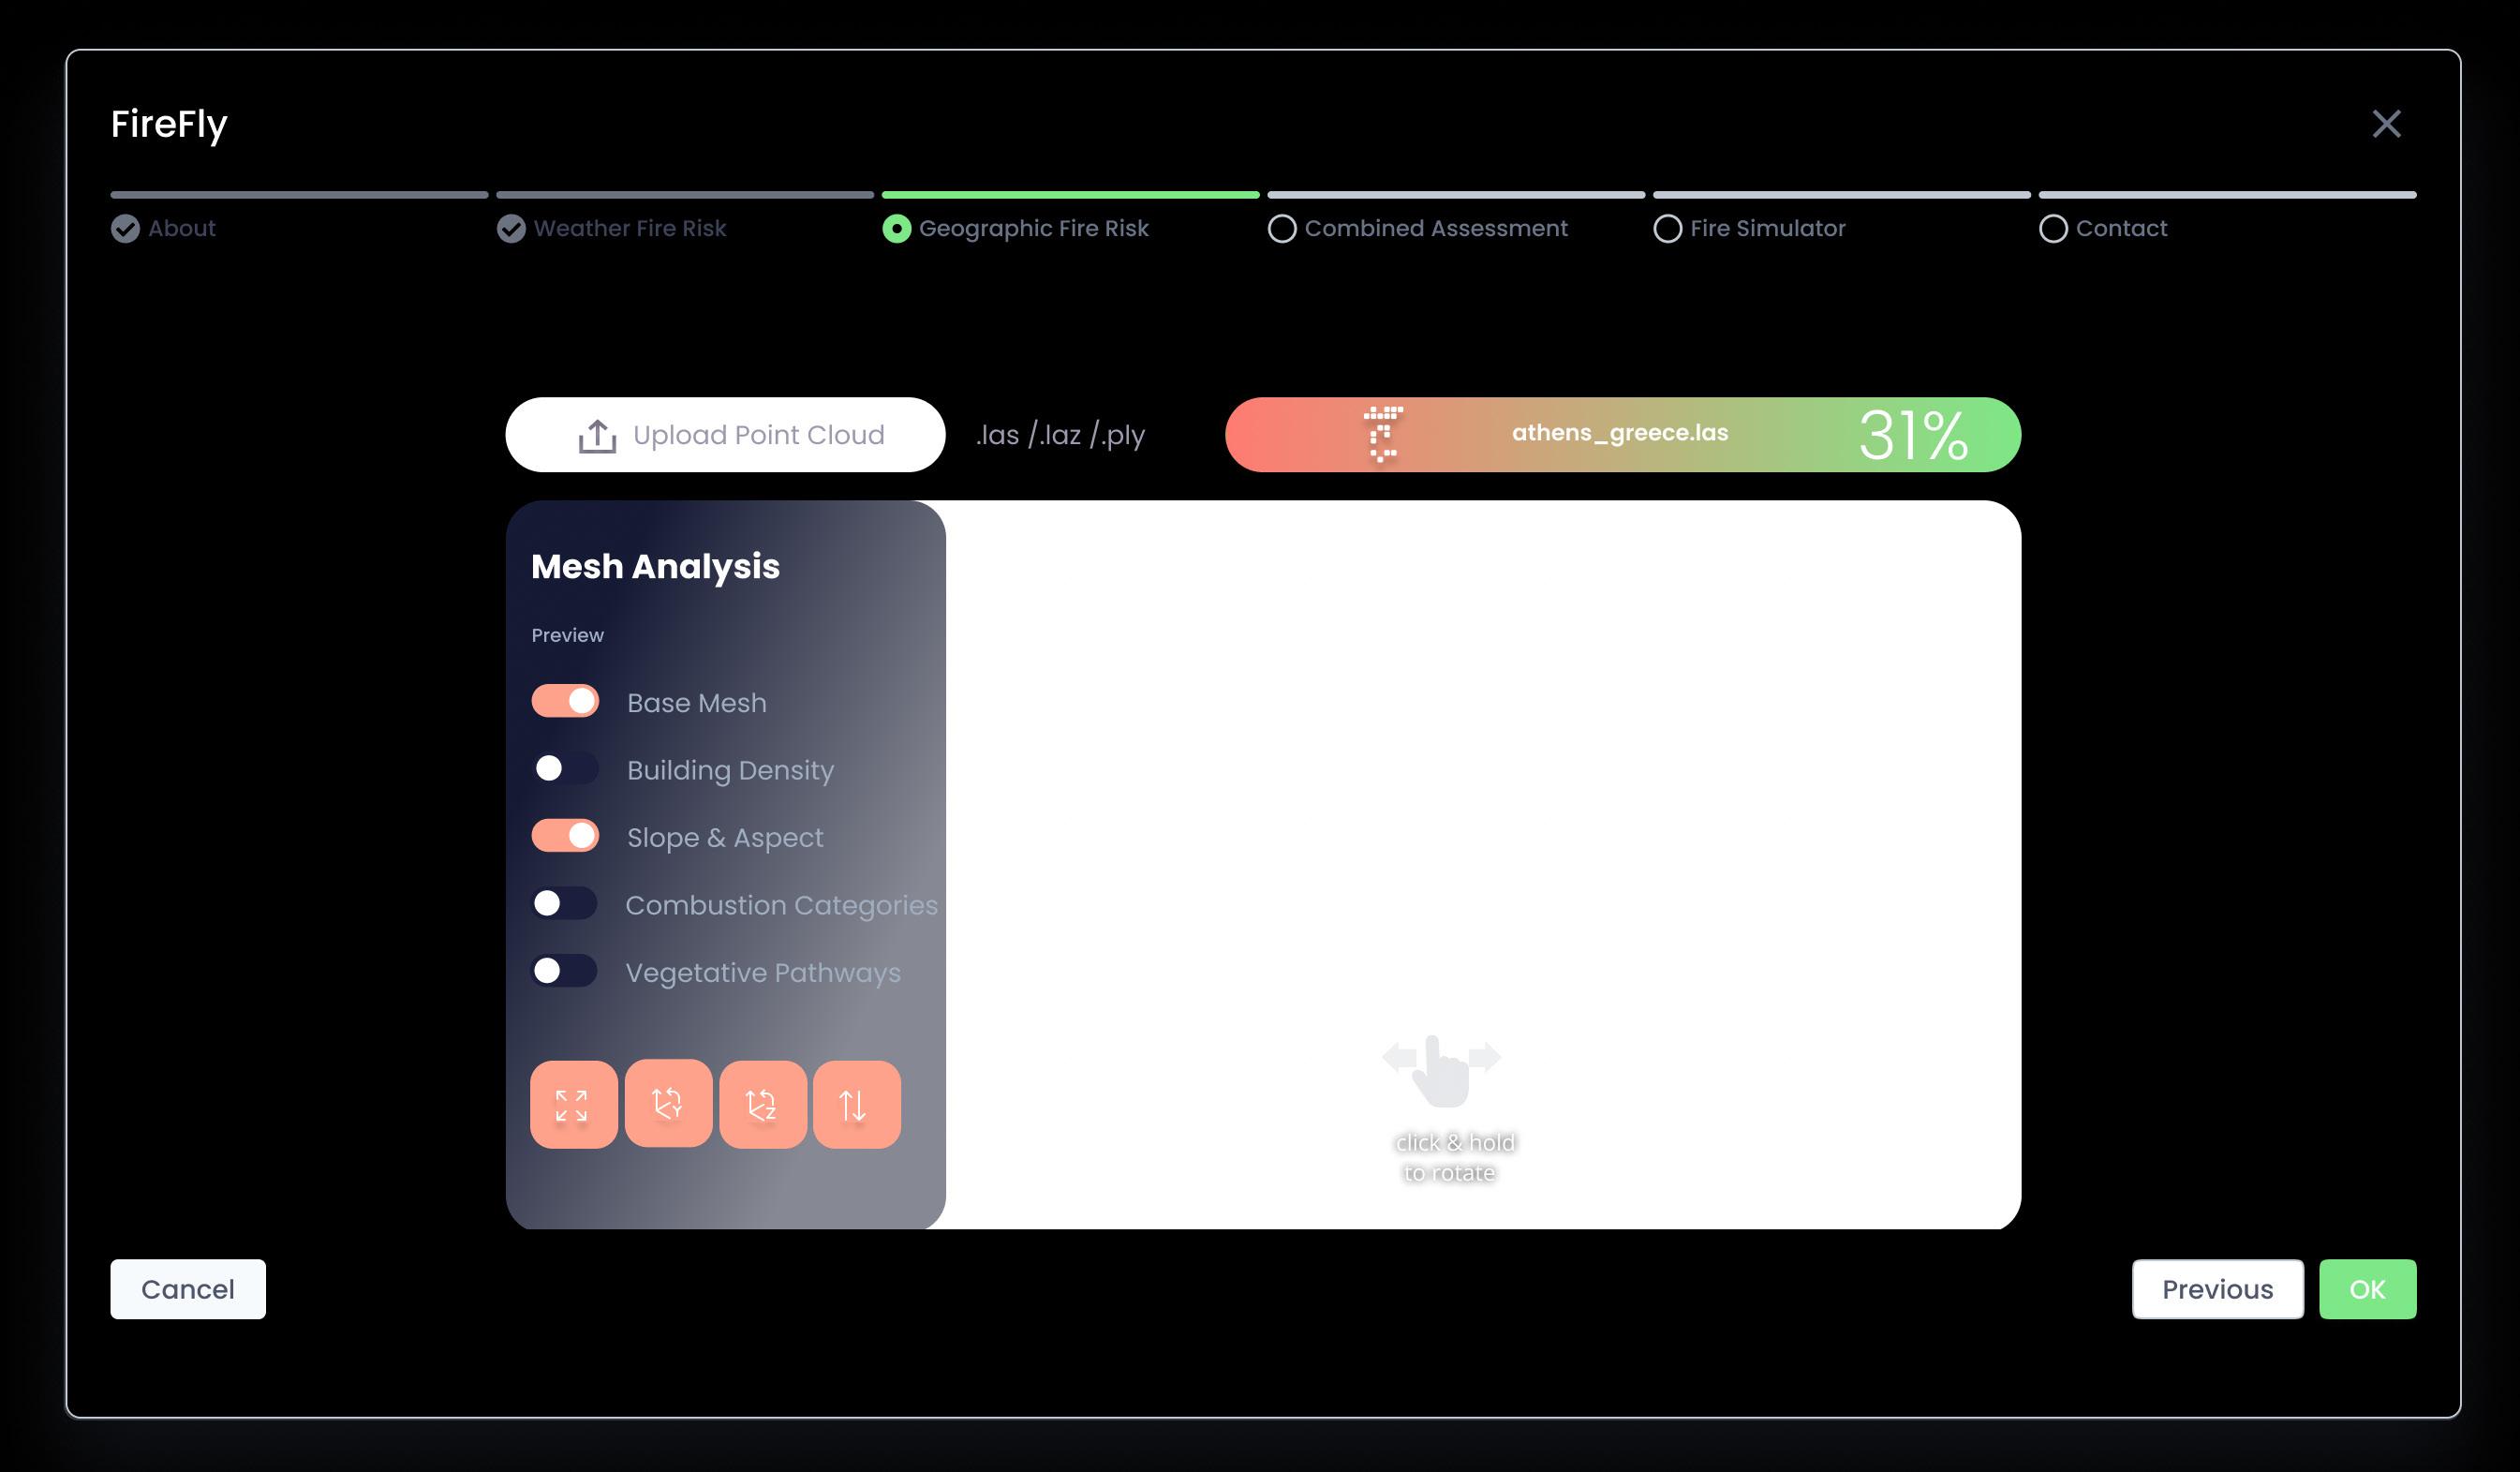
Step 3: Indepth Fire Risk Analysis This step consists on running in pararell the point cloud analysis from previous chapters. Users can upload their point cloud data, which is then visualized in a 3D format within an iframe. This visualization encompasses various layers, including base mesh, building density analysis, slope and aspect, combustion categories, and vegetative pathways. The 3D representation allows users to interact with the data, offering a spatial understanding of potential fire risks in their vicinity.
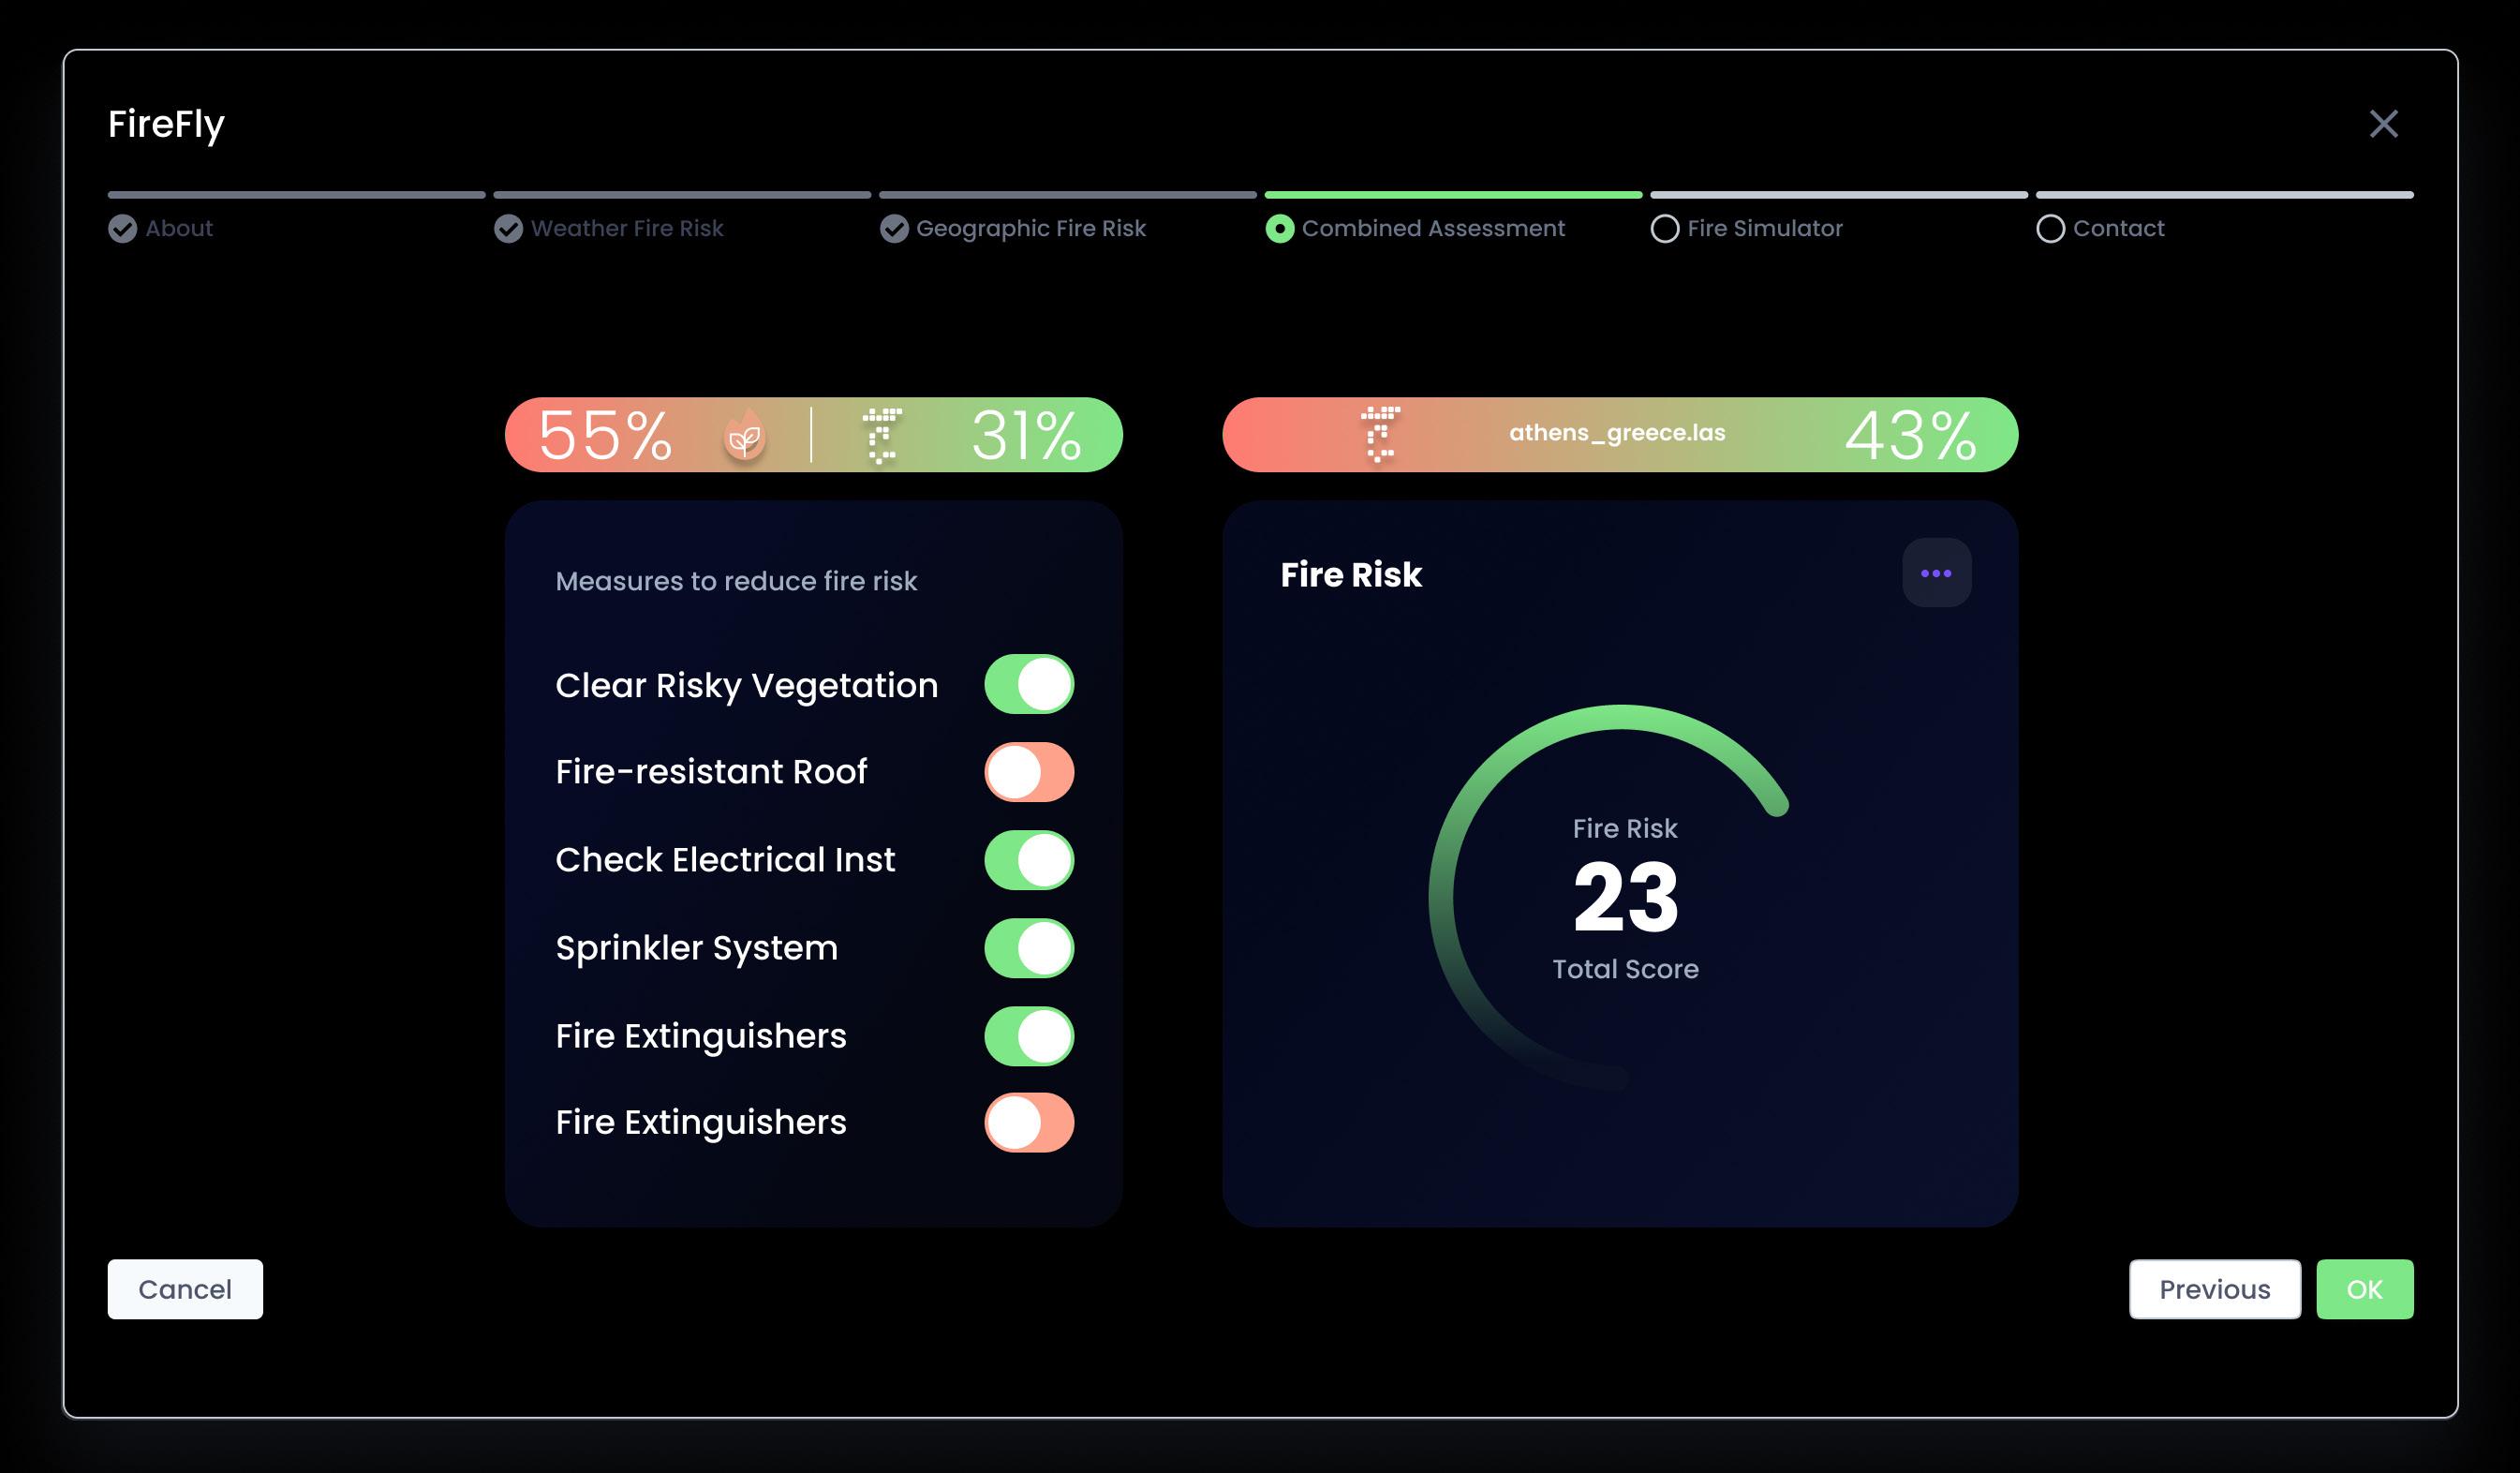
Step 4: Get Assessment: Based on the weather data and the indepth risk analysis, the application
calculates an overall fire risk score. This score is then presented alongside potential measures that users can adopt to mitigate the identified risks.
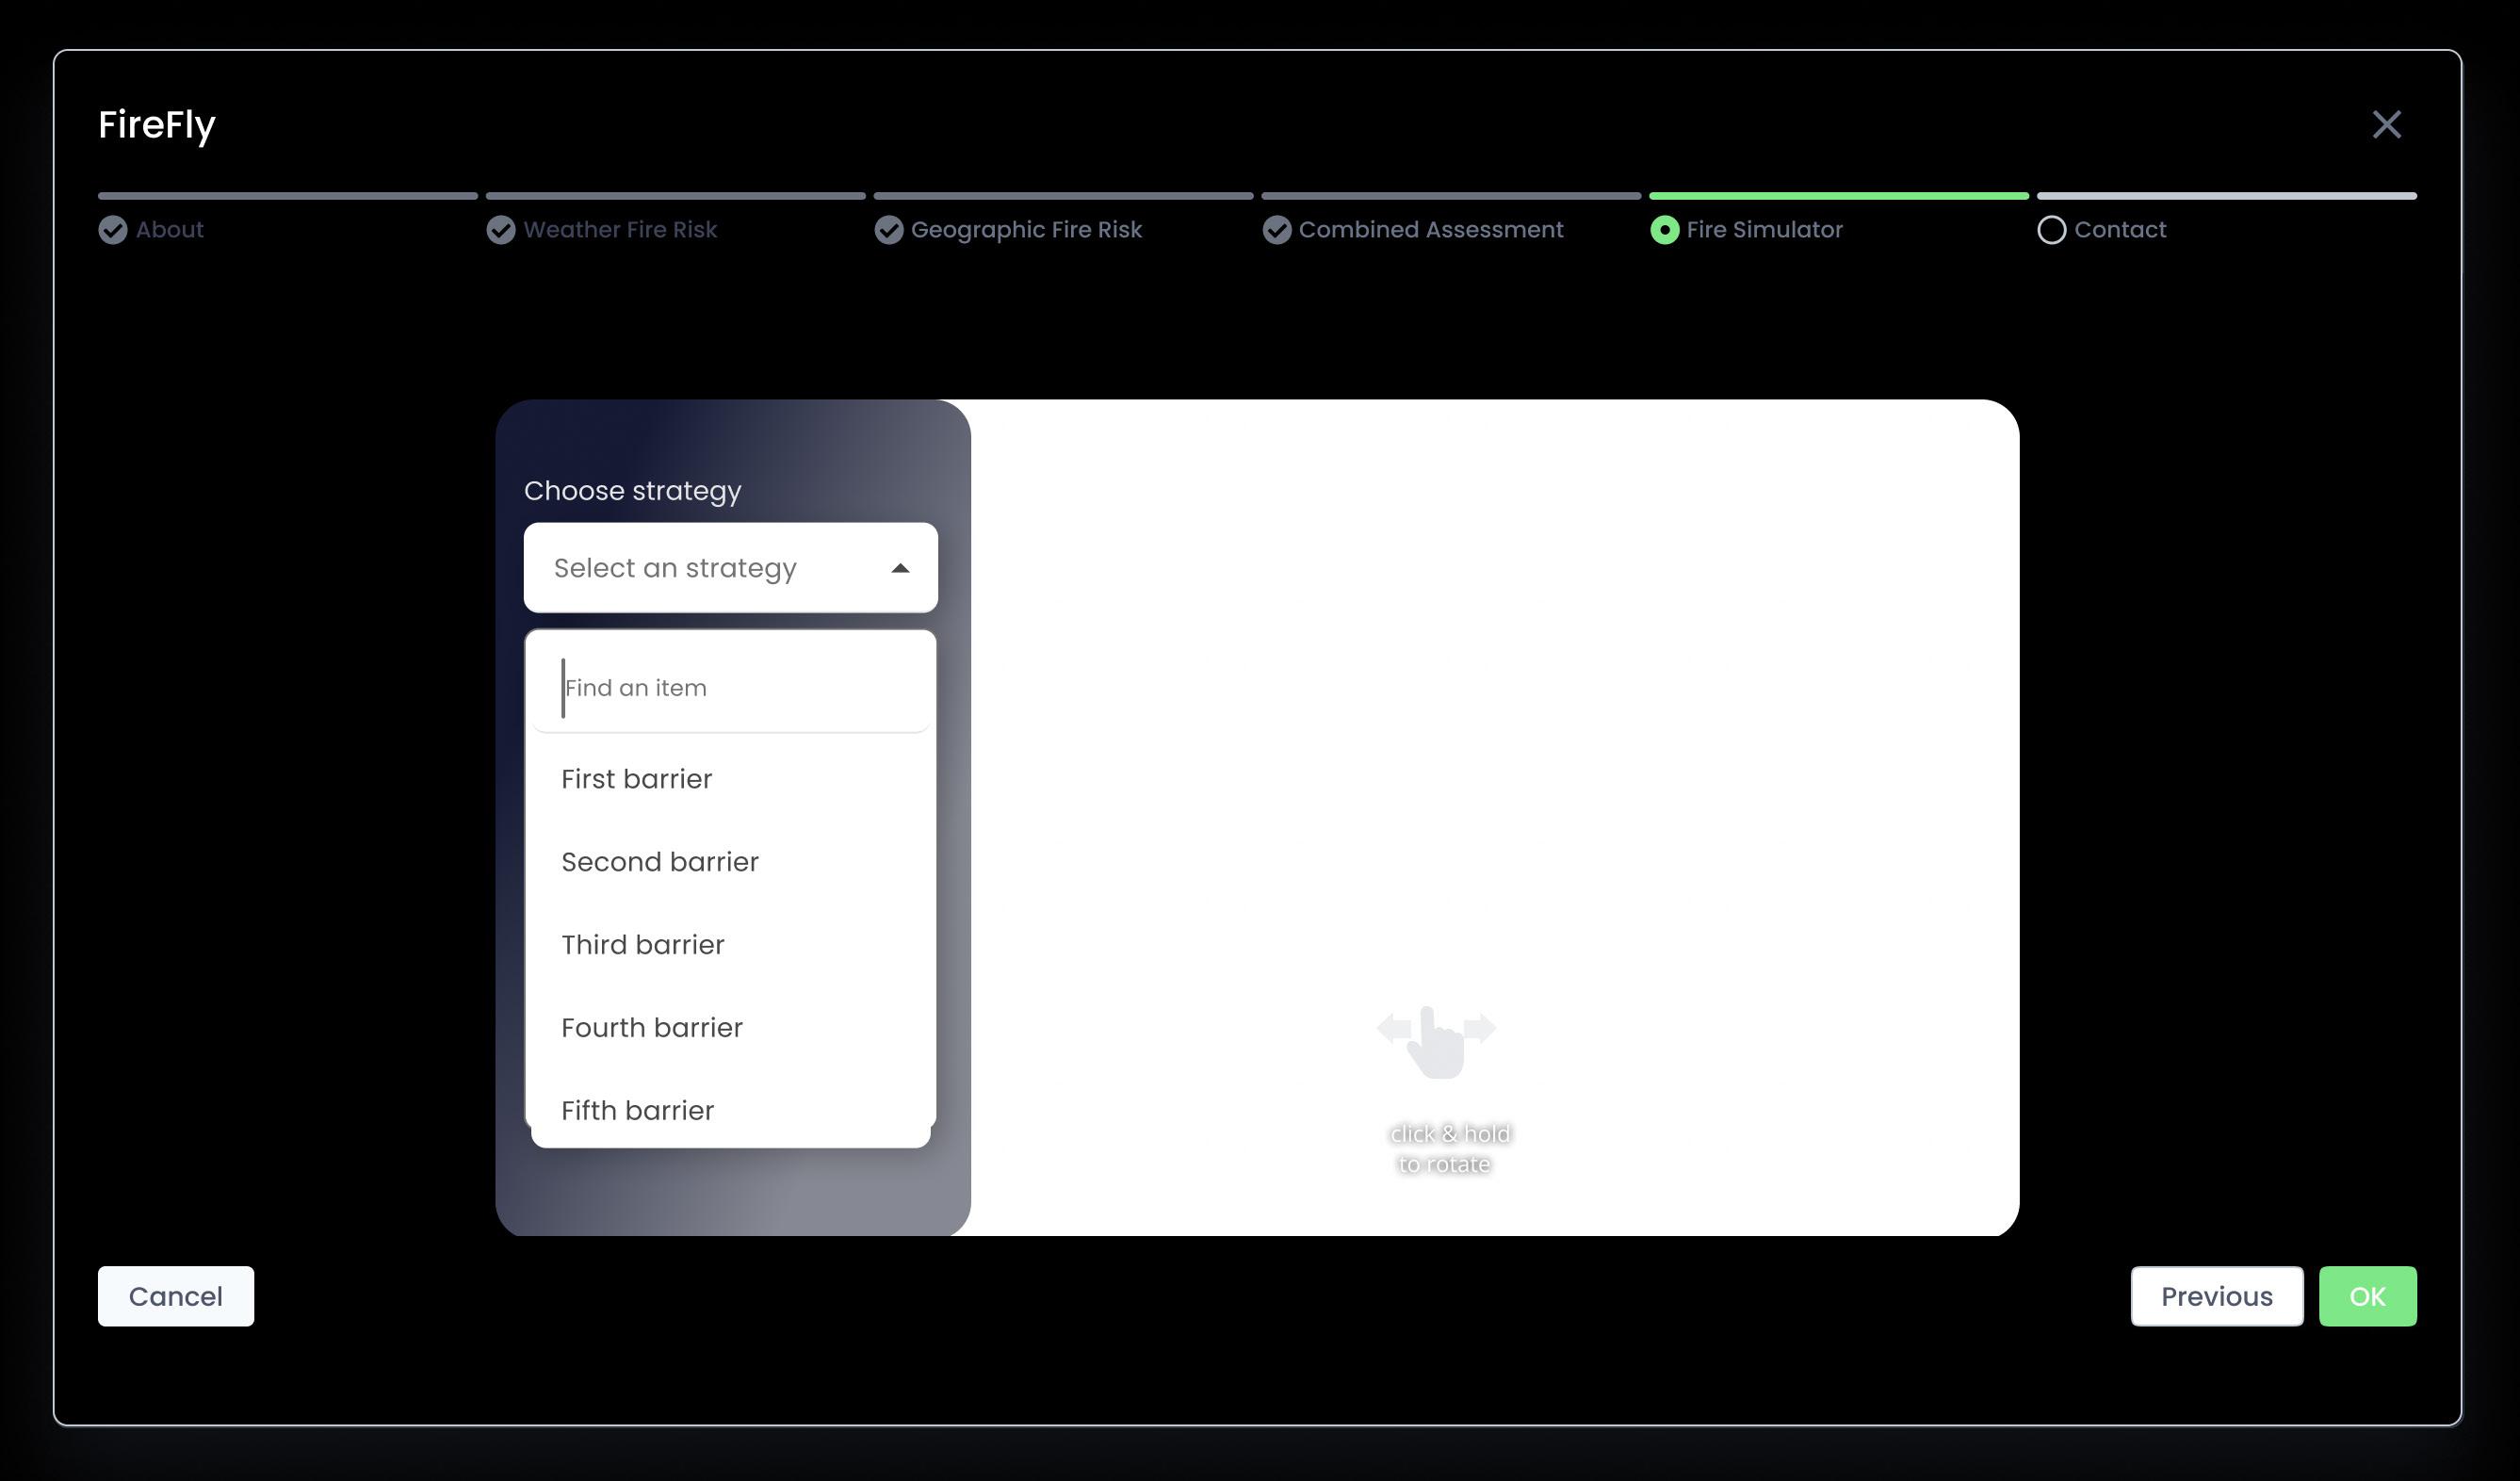
Step 5: Simulations
In this step, users can interactively visualize the potential spread of fire within their specified territory. Leveraging advanced algorithms and realworld data, the simulation showcases fire behavior under various conditions. Users can strategically place barriers, such as firebreaks or water bodies, within the simulation to observe their impact on the fire’s trajectory. This dynamic feature not only provides a realistic representation of fire spread but also empowers users to experiment with different mitigation strategies, offering invaluable insights for proactive fire management.
Interactive Risk Mitigation
One of the standout features of the FireSafe application is its interactive risk mitigation section. Once users receive their fire risk assessment, they are presented with a list of potential measures to reduce the identified risks. As users select these measures, they can visually see the impact on their overall risk score, empowering them to make informed decisions.
The FireSafe application’s user interface is meticulously designed to offer a blend of simplicity and depth. By breaking down the complex process of fire risk assessment into a stepped approach, it ensures a user-friendly experience. The inclusion of interactive elements, such as the 3D visualization of point cloud data and the dynamic risk mitigation section, further enhances its utility, making it a valuable tool in the realm of fire safety.
Conclusion
Summary thoughts and future potential
Our research has culminated in the development of a pioneering proof of concept, illustrating the potential for a cost-effective, easily accessible strategy to analyse fire risk spread at an urban scale.
In the era of ever-increasing urban expansion and exacerbated wildfire incidents, our thesis stands as a pivotal endeavour to address this pressing concern. The research embarked on a journey to harness the potential of open-source technologies, converging them in novel ways to offer a low-cost yet efficient fire risk assessment tool.
Central to this project was the significant leverage of artificial intelligence and machine learning. These technologies not only enhanced the efficiency of data processing but also equipped the tool with predictive capabilities. The choices of metrics and parameters for the analytics were meticulously based on prior research, ensuring the tool's accuracy and relevance in predicting fire spread.
This thesis underscores the significance of robust back-end algorithms and data processes, which form the bedrock of any analytical tool. Furthermore, the research delves deep into factors influencing fire spread. The "Categorised Combustion" section, for instance, delves into building façades and materials, while "Proximity Patterns" elucidates the interplay between building and vegetation proximities.
The urban scale of the study is particularly pertinent, given the increasing urban-rural interface and the vulnerability of urban regions to wildfires.
Our research has culminated in the development of a pioneering proof of concept, illustrating the potential for a cost-effective, easily accessible
strategy to analyse fire risk spread at an urban scale. Through the incorporation of advanced AI techniques, we have introduced innovative work flows, heralding new paradigms in fire risk analysis.
The integration of the Segment Anything Model and DINO - a state-of-the-art self-supervised system by Meta. This combination harnesses the power of AI to decipher and utilize vast amounts of unlabelled data relatively effectively.
The rapid evolution of AI technologies has consistently presented fresh avenues of exploration. Remarkably, even during the course of our research, breakthrough methodologies emerged. One such advancement is Neural Radiance Fields (NeRFs), which has revolutionized the generation of 3D representations from 2D images. This technique, backed by sophisticated machine learning algorithms, offers a potential alternative to our proposed photogrammetry method. Notably, NeRFs streamline the process, necessitating fewer photographs for 3D model reconstruction compared to traditional photogrammetry.
Looking ahead, future iterations of our work could delve into eliminating the dependency on drone deployment, further streamlining the process. Technological advances, such as Google's 3D Tile Map API, hold promise. As these technologies mature and offer more frequent updates, especially in outlining regions, they might obviate the need for drones.
Expanding the horizons of our research, we believe that deeper exploration into machine learning processes could yield promising results. A potential avenue is the development of algorithms predicting fire spread based on the summary maps we've generated. While the creation of an appropriate dataset might demand significant effort, the potential outcomes could be ground breaking.
While our material façade classification has shown promise, it demands further refinement. The current accuracy levels hover around 62%, indicating a scope for enhancement. A practical next step would be to juxtapose our predictive models against real-world fire scenarios. Such an endeavour would not only validate our methodologies but also facilitate fine-tuning, ensuring that our work flows are robust and reliable.
By marrying advanced computational methodologies with practical, on-ground metrics, it offers a beacon of hope in the relentless battle against wildfires. The insights gleaned from this research will undoubtedly serve as invaluable assets for urban planners, policymakers, and environmentalists in the years to come.
Bibliography + References
1. Mathilde Caron, Hugo Touvron, Ishan Misra, Hervé Jegou, Julien Mairal, Piotr Bojanowski, & Armand Joulin. (2021). Emerging Properties in SelfSupervised Vision Transformers. Facebook AI Research, Inria, Sorbonne University.
2. Alexander Kirillov, Eric Mintun, Nikhila Ravi, Hanzi Mao, Chloe Rolland, Laura Gustafson, Tete Xiao, Spencer Whitehead, Alexander C. Berg, Wan-Yen Lo, Piotr Dollár, & Ross Girshick. (2023). Segment Anything. Meta AI Research, FAIR.
3. Darij Grinberg. (2023). An introduction to graph theory (Text for Math 530 in Spring 2022 at Drexel University).
4. Geethanjali Anjanappa. Deep learning on point clouds for safety-related asset management in buildings.
5. Ives Rey-Otero, & Mauricio Delbracio. Anatomy of the SIFT Method.
7. Maria Mahamed (Polinova), Lea Wittenberg, Haim Kutiel, & Anna Brook. (2022). Fire Risk Assessment on Wildland–Urban Interface and Adjoined Urban Areas: Estimation Vegetation Ignitability by Artificial Neural Network.
8. Mohammad Tavakol Sadrabadi, & Mauro Sebastián Innocente. (2022). Vegetation Cover Type Classification Using Cartographic Data for Prediction of Wildfire Behaviour.
9. Yiqing Xu, Dianjing Li, Hao Ma, Rong Lin, & Fuquan Zhang. (2022). Modeling Forest Fire Spread Using Machine Learning-Based Cellular Automata in a GIS Environment. Forests.
10. E. Özdemir, & F. Remondino. Segmentation of 3d photogrammetric point cloud for 3d building modeling. 3D Optical Metrology, Bruno Kessler Foundation (FBK), Trento, Italy. (2018)
11. Hysa, A. (2019). Identifying the forest surfaces prone to fire ignition and wildfire spread in metropolitan areas; a comparative case from Western Balkans. Faculty of Architecture and Engineering, Epoka University, Rr. Tiranë-Rinas, Km. 12, 1032 Vorë, Tirana, Albania.
12. Carpenter, J., Jung, J., Oh, S., Hardiman, B., & Fei, S. (2022). An unsupervised canopy-to-root pathing (UCRP) tree segmentation algorithm for automatic forest mapping.
13. Fernández-Guisuraga, J. M., & Fernandes, P. M. (2023). Using pre-fire high point cloud density LiDAR data to predict fire severity in Central Portugal.
14. Himoto, K., Akimoto, Y., Hokugo, A., & Tanaka, T. Risk and behaviour of fire spread in a densely-built urban area. Disaster Prevention Research Institute, Kyoto University, Gokasho, Uji, Kyoto 611-0011, Japan; Graduate School of Engineering, Kobe University, Rokkodai 1-1, Nada, Kobe 657-8501, Japan.
15. Whitesides, G. T. (2023). The growing megafire crisis -- and how to contain it [Video]. TED Conferences. https://www.youtube.com/ watch?v=M66jkJMH3DI&t=344s
16. Weixiao GAO. PSSNet: Planarity-sensible semantic segmentation of largescale urban meshes. ISPRS Journal of Photogrammetry and Remote Sensing, 196 (2023) 32-44, doi:10.1016/j.isprsjprs.2022.12.020.
17. Florent POUX. Extraction et gestion automatique de la sémantique dans les nuages de points [Course Syllabus].
18. Meida Chen, Andrew Feng, Kyle McCullough, Pratusha Bhuvana Prasad, Ryan McAlinden, Lucio Soibelman, & Mike Enloe. Fully automated photogrammetric data segmentation and object information extraction approach for creating simulation terrain. USC Institute for Creative Technologies, Los Angeles, California; USC Department of Civil and Environmental Engineering, Los Angeles, California; Synthetic Training Environment Cross Functional Team, Orlando, Florida.
19. Qingyong Hu, Bo Yang, Sheikh Khalid, Wen Xiao, Niki Trigoni, & Andrew Markham. Towards semantic segmentation of urban-scale 3D point clouds: A dataset, benchmarks and challenges. University of Oxford; The Hong Kong Polytechnic University; Sensat Ltd; Newcastle University.
20. Nicolas Brodu, & Dimitri Lague. 3D Terrestrial lidar data classification of complex natural scenes using a multi-scale dimensionality criterion: applications in geomorphology. Geosciences Rennes, Université Rennes 1, CNRS, Rennes, France; Department of Geological Sciences, University of Canterbury, Christchurch, New-Zealand.
21. Uwe Stilla. Change detection of urban objects using 3D point clouds: A review. ISPRS Journal of Photogrammetry and Remote Sensing, 197 (2023) 228-255, doi:10.1016/j.isprsjprs.2023.01.010.
22. Maarten Bassier, Maarten Vergauwen, & Florent Poux. Point Cloud vs. Mesh Features for Building Interior Classification. Department of Civil Engineering, TC ConstructionŠGeomatics, KU LeuvenŠFaculty of Engineering Technology, 9000 Ghent, Belgium; Geomatics Unit, University of Liège, 4000 Liège, Belgium.
23. Jibril Muhammad Adam. Deep learning-based semantic segmentation of urban-scale 3D meshes in remote sensing: A survey. International Journal of Applied Earth Observation and Geoinformation, 121 (2023) 103365, doi:10.1016/j.jag.2023.103365.
24. WeatherSpark. (2023). WeatherSpark. Retrieved 20 September 2023, from https://weatherspark.com/.
25. National Fire Protection Association. (2023). Preparing homes for wildfire. Retrieved 20 September 2023, from https://www.nfpa.org/Public-Education/ Fire-causes-and-risks/Wildfire/Preparing-homes-for-wildfire.
26. RedZone. (2023). RZRisk Wildfire Underwriting. Retrieved 20 September 2023, from https://www.redzone.co/rzrisk-wildfire-underwriting/.
27. ISPRS Annals. (2016). FAST SEMANTIC SEGMENTATION OF 3D POINT CLOUDS WITH STRONGLY VARYING DENSITY. Retrieved 20 September 2023, from https://isprs-annals.copernicus.org/articles/III-3/177/2016/ isprs-annals-III-3-177-2016.pdf.
28. Qi, Xuxiang et al. (2018). Deep Learning Based Semantic Labelling of 3D Point Cloud in Visual SLAM. IOP Conf. Ser.: Mater. Sci. Eng. 428 012023. Retrieved 20 September 2023, from https://iopscience.iop.org/ article/10.1088/1757-899X/428/1/012023/pdf.
29. Engelmann, F., et al. (2017). Exploring Spatial Context for 3D Semantic Segmentation of Point Clouds. ICCV Workshops. Retrieved 20 September 2023, from https://openaccess.thecvf.com/content_ICCV_2017_workshops/ papers/w13/Engelmann_Exploring_Spatial_Context_ICCV_2017_paper.pdf.
30. Lin, Junqin et al. (2020). Research on SLAM Drift Reduction Mechanism Based on Point Cloud Segmentation Semantic Information. Journal of Physics: Conference Series, Volume 1570. Retrieved 20 September 2023, from https://iopscience.iop.org/article/10.1088/1742-6596/1570/1/012095.
31. Xia, Linlin et al. (2022). A point-line-plane primitives fused localization and object-oriented semantic mapping in structural indoor scenes. Measurement Science and Technology, Volume 33, Number 9. Retrieved 20 September 2023, from https://iopscience.iop.org/article/10.1088/1361-6501/ ac784c.
32. Zhang, Guangyi et al. (2022). Accurate real-time SLAM based on two-step registration and multimodal loop detection. Measurement Science and Technology, Volume 34, Number 2. Retrieved 20 September 2023, from https://iopscience.iop.org/article/10.1088/1361-6501/ac99f2.
33. IASKS. (2022). Fire Risk Prediction Using Cloud-based Weather Data Services. Journal of Ubiquitous Systems & Pervasive Networks, Volume 3, No. 1 (2011). Retrieved 20 September 2023, from https://web.archive.org/ web/20220110114555id_/https://iasks.org/articles/juspn-v16-i1-pp-37-47.pdf.
34. Morais, J.C.M., et al. (2011). Findings and implications from a coarse-scale global assessment of recent selected mega-fires. Proceedings of the Vth International Wildland Fire Conference. Sun City, South Africa.
35. Cary, G.J., et al. (2006). Comparison of the sensitivity of landscape-firesuccession models to variation in terrain, fuel pattern, climate and weather. Landscape ecology, 21(1):121–137.
36. Eskandari, S., et al. (2020). The temporal and spatial relationships between climatic parameters and fire occurrence in northeastern Iran. Ecological Indicators, 118:106720.
37. SafetyCulture. (2023). Fire Risk Assessment. Retrieved 20 September 2023, from https://safetyculture.com/checklists/fire-risk-assessment/.
38. VisionPro Software. (2023). Fire Risk Module. Retrieved 20 September
2023, from https://www.visionprosoftware.com/software/fire-risk-module/.
39. Aurora Data Ltd. (2023). Aurora Data Ltd. Retrieved 20 September 2023, from https://auroradataltd.co.uk/.
40. DefensibleApp. (2023). DefensibleApp. Retrieved 20 September 2023, from https://www.defensibleapp.com/#14/38.46319/-122.69985.
41. MSB. (2023). Brandrisk Ute - Fire Danger Outdoors. Retrieved 20 September 2023, from https://www.msb.se/en/about-msb/websites-and-social-media/ appar/brandrisk-ute-fire-danger-outdoors/.
42. WeatherSpark. (2023). WeatherSpark. Retrieved 20 September 2023, from https://weatherspark.com/.
43. National Fire Protection Association. (2023). Preparing homes for wildfire. Retrieved 20 September 2023, from https://www.nfpa.org/Public-Education/ Fire-causes-and-risks/Wildfire/Preparing-homes-for-wildfire
44. Arif, M., Alghamdi, K.K., Sahel, S.A., et al. (2021) 'Role of Machine Learning Algorithms in Forest Fire Management: A Literature Review', J Robotics Autom, 5(1), pp. 212-211.
45. Wu, Z., Li, M., Wang, B., Quan, Y., & Liu, J. (2021) 'Using Artificial Intelligence to Estimate the Probability of Forest Fires in Heilongjiang, Northeast China', Remote Sensing, 13, pp. 1813
46. AliceVision. (2022). Photogrammetry. Available at: https://alicevision. org/#photogrammetry (Accessed: 8 September 2023)
47. Open3D. (2022). Open3D: A Modern Library for 3D Data Processing. Available at: https://open3d.org (Accessed: 5 September 2023).
48. Qi, C.R., Yi, L., Su, H., & Guibas, L.J. (2017) 'PointNet++: Deep Hierarchical Feature Learning on Point Sets in a Metric Space', arXiv preprint arXiv:1706.02413.
49. Kirillov, A., Mintun, E., Ravi, N., Mao, H., Rolland, C., Gustafson, L., Xiao, T., Whitehead, S., Berg, A.C., Lo, W.-Y., Dollár, P., & Girshick, R. (2023) 'Segment Anything', arXiv:2304.02643.
50. Oquab, M., Darcet, T., Moutakanni, T., Vo, H.V., Szafraniec, M., Khalidov, V., Fernandez, P., Haziza, D., Massa, F., El-Nouby, A., Howes, R., Huang, P.-Y., Xu, H., Sharma, V., Li, S.-W., Galuba, W., Rabbat, M., Assran, M., Ballas, N., Synnaeve, G., Misra, I., Jegou, H., Mairal, J., Labatut, P., Joulin, A., & Bojanowski, P. (2023) 'DINOv2: Learning Robust Visual Features without Supervision', arXiv:2304.07193.
51. Bentley, J.L. (1975) 'Multidimensional Binary Search Trees Used for Associative Searching', Communications of the ACM, 18(9), pp. 509–517
52. Ester, M., Kriegel, H.-P., Sander, J., & Xu, X. (1996) 'A Density-Based Algorithm for Discovering Clusters in Large Spatial Databases with Noise', Proceedings of the Second International Conference on Knowledge Discovery and Data Mining (KDD-96), pp. 226–231.
53. Kazhdan, M., Bolitho, M., & Hoppe, H. (2006) 'Poisson Surface Reconstruction', Proceedings of the Fourth Eurographics Symposium on Geometry Processing, pp. 61–70
54. Visual Crossing. (2023). Visual Crossing. Available at: https://www. visualcrossing.com/ (Accessed: 1 September 2023).