


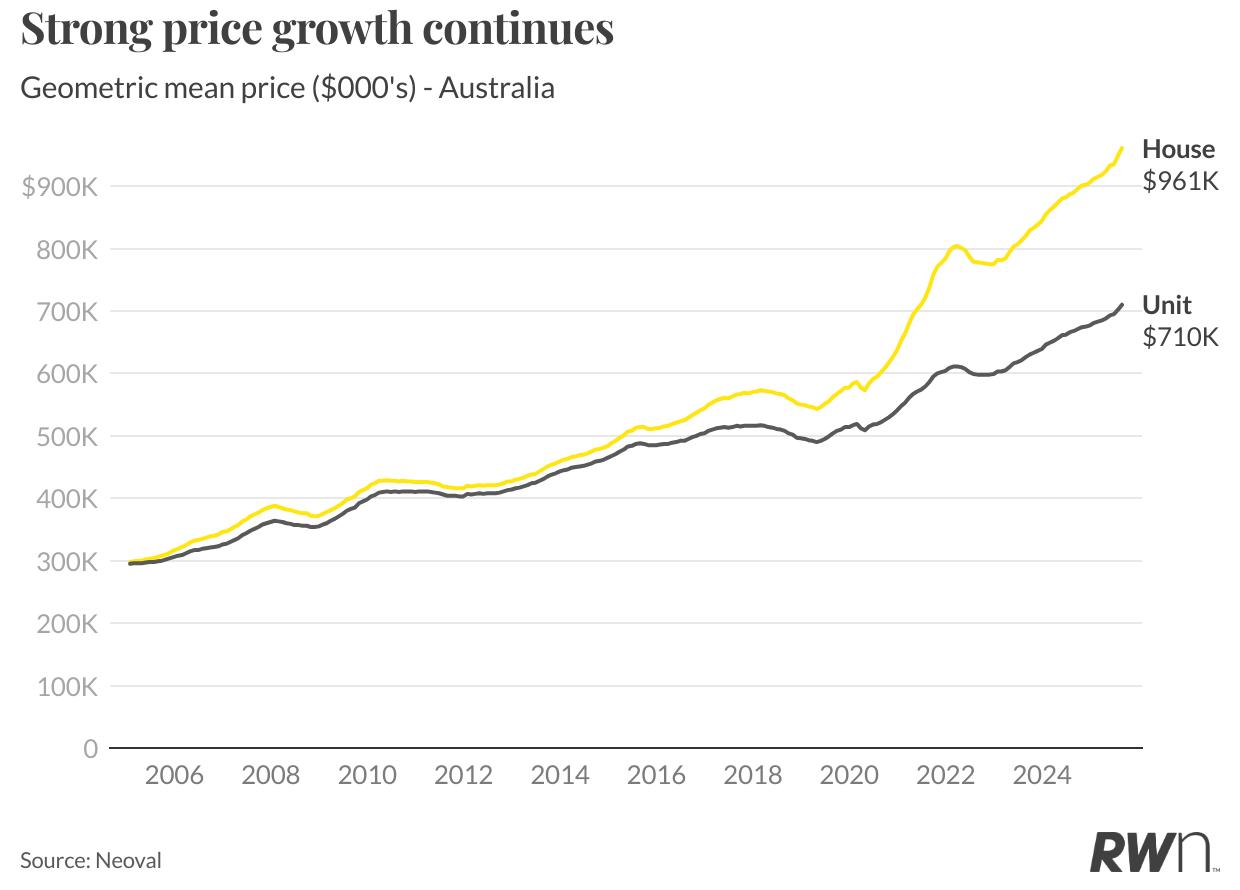
Australia’s property market continues responding to the interest rate cutting cycle, with August showing sustained momentum following the initial rate reduction. National house prices reached $961,000, while units achieved $710,000, reflecting robust annual growth of 7.9 per cent and 6.4 per cent respectively.
The month’s standout development is the government’s acceleration of the expanded five per cent deposit scheme to 1 October. This initiative, removing previous income and location restrictions, represents the most significant first home buyer intervention in decades and is expected to intensify already competitive market conditions.
National listing volumes remain constrained at 36,433 properties in August, down 17.8 per cent annually, creating the supply shortage that has underpinned price growth. With auction clearance rates maintaining strength above 74 per cent and bidder activity steady at 4.4 registered bidders per property, market fundamentals continue favouring sellers as spring approaches.
Metropolitan house prices maintained strong momentum in August, with the national average reaching $1.15 million, up 1.4 per cent monthly and 7.7 per cent annually. Perth continues leading performance with 1.7 per cent monthly growth to $970,000 and exceptional 12.4 per cent annual appreciation.
Brisbane and Adelaide demonstrated robust monthly gains of 1.6 per cent and 1.4 per cent respectively, reaching $1.09 million and $954,000. Sydney showed renewed strength with 1.5 per cent monthly growth to $1.68 million, while Melbourne recorded 1.1 per cent growth to $1.06 million. Gold Coast and Sunshine Coast both achieved 1.7 per cent monthly increases, reaching $1.31 million and $1.24 million respectively, reflecting continued strength in Queensland’s lifestyle markets.

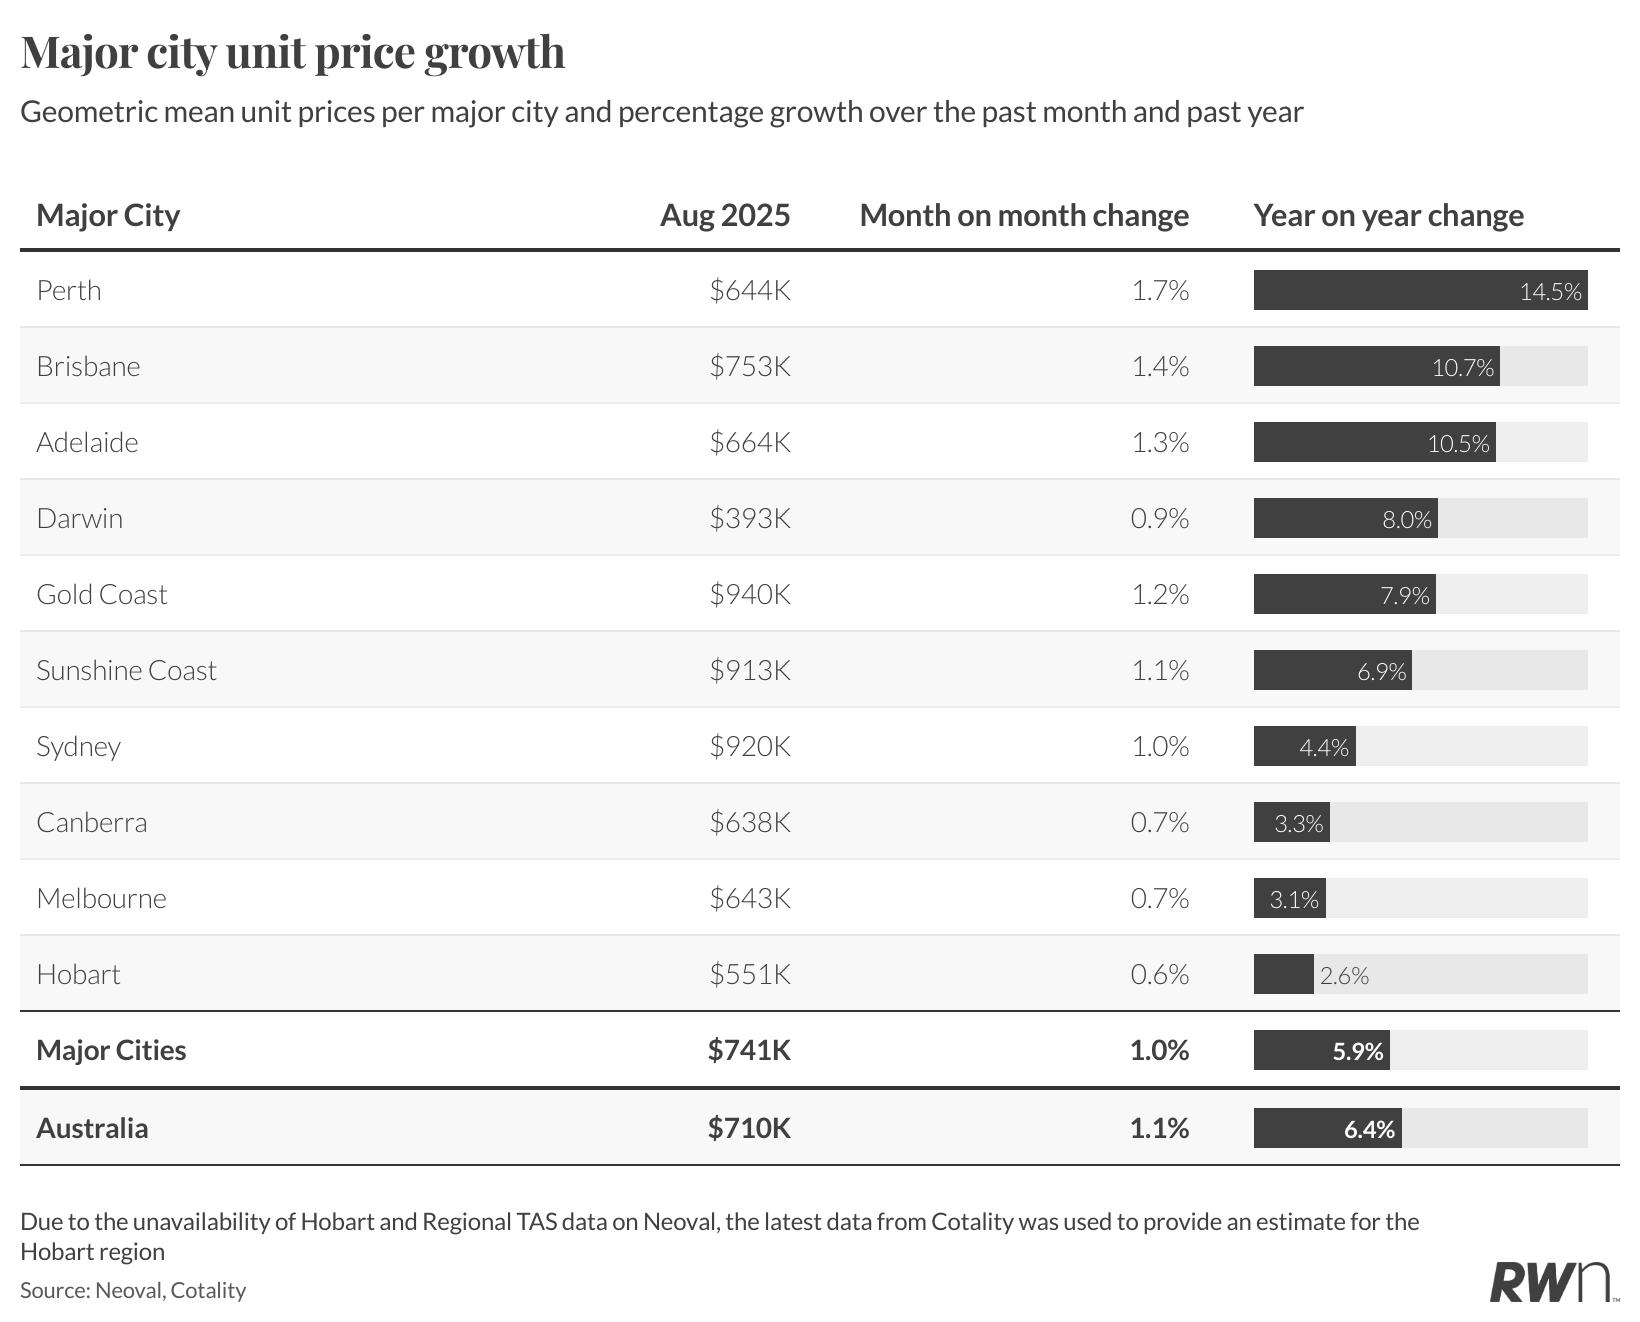
The metropolitan unit sector recorded strong performance in August, with the national average reaching $741,000, up 1.0 per cent monthly and 5.9 per cent annually. Perth units led growth with 1.7 per cent monthly appreciation to $644,000 and exceptional 14.5 per cent annual growth, demonstrating the broad-based strength of Western Australia’s market.
Brisbane and Adelaide units recorded solid monthly gains of 1.4 per cent and 1.3 per cent to $753,000 and $664,000 respectively. Sydney units maintained momentum with 1.0 per cent monthly growth to $920,000. The approaching five per cent deposit scheme implementation is particularly significant for this segment, given first home buyers’ traditional preference for units and the reduced deposit barriers this will create.
Regional housing markets maintained robust performance in August, with the national average reaching $696,000, up 1.3 per cent monthly and 8.6 per cent annually. Regional Western Australia continues leading growth metrics with 1.6 per cent monthly appreciation to $573,000 and outstanding 13.7 per cent annual growth, supported by mining sector activity and limited supply.
Regional Queensland recorded strong 1.7 per cent monthly growth to $783,000 with 11.6 per cent annual appreciation, while regional South Australia achieved 1.3 per cent monthly growth to $492,000 with 11.9 per cent annual gains.
Regional New South Wales showed a more measured 1.1 per cent monthly growth to $782,000, reflecting ongoing demand pressures from metropolitan spillover effects, despite more conservative 6.7 per cent annual growth.

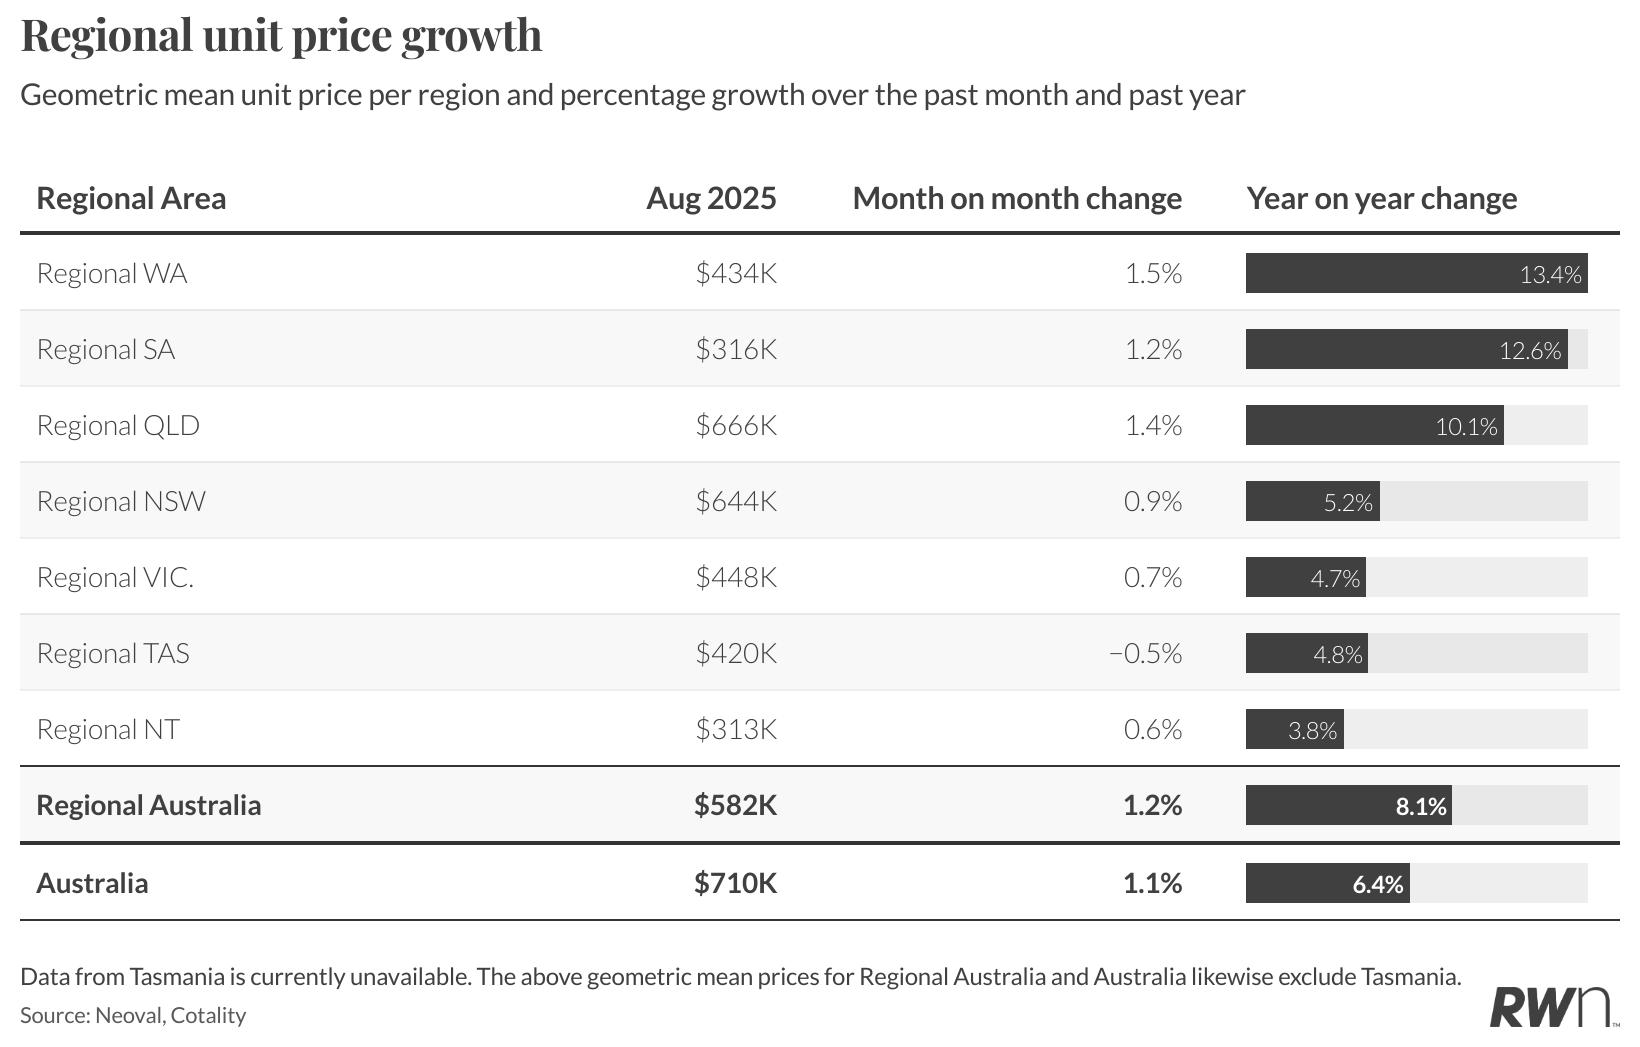
The regional unit sector maintained strong performance in August, with the national average reaching $582,000, up 1.2 per cent monthly and 8.1 per cent annually. Regional Western Australia led growth with 1.5 per cent monthly appreciation to $434,000 and exceptional 13.4 per cent annual gains, demonstrating the broad-based strength of Western Australia’s property market.
Regional Queensland and South Australia recorded solid monthly growth of 1.4 per cent and 1.2 per cent to $666,000 and $316,000 respectively. Regional New South Wales showed 0.9 per cent monthly growth to $644K. The combination of lifestyle migration trends, limited supply relative to demand, and more accessible entry points continues supporting this market segment, with the expanded five per cent deposit scheme expected to bring additional first home buyer interest to regional markets.
MAJOR CITY HOUSE PRICES (%CHANGE) | SINCE LAST MONTH
$ GEOMETRIC MEAN PRICE % CHANGE IN PRICE
Source: Neoval
as of
REGIONAL HOUSE PRICES (%CHANGE) | SINCE LAST MONTH
REGIONAL AUSTRALIA $696,000 1.3%
Source: Neoval

LISTINGS ACTIVITY
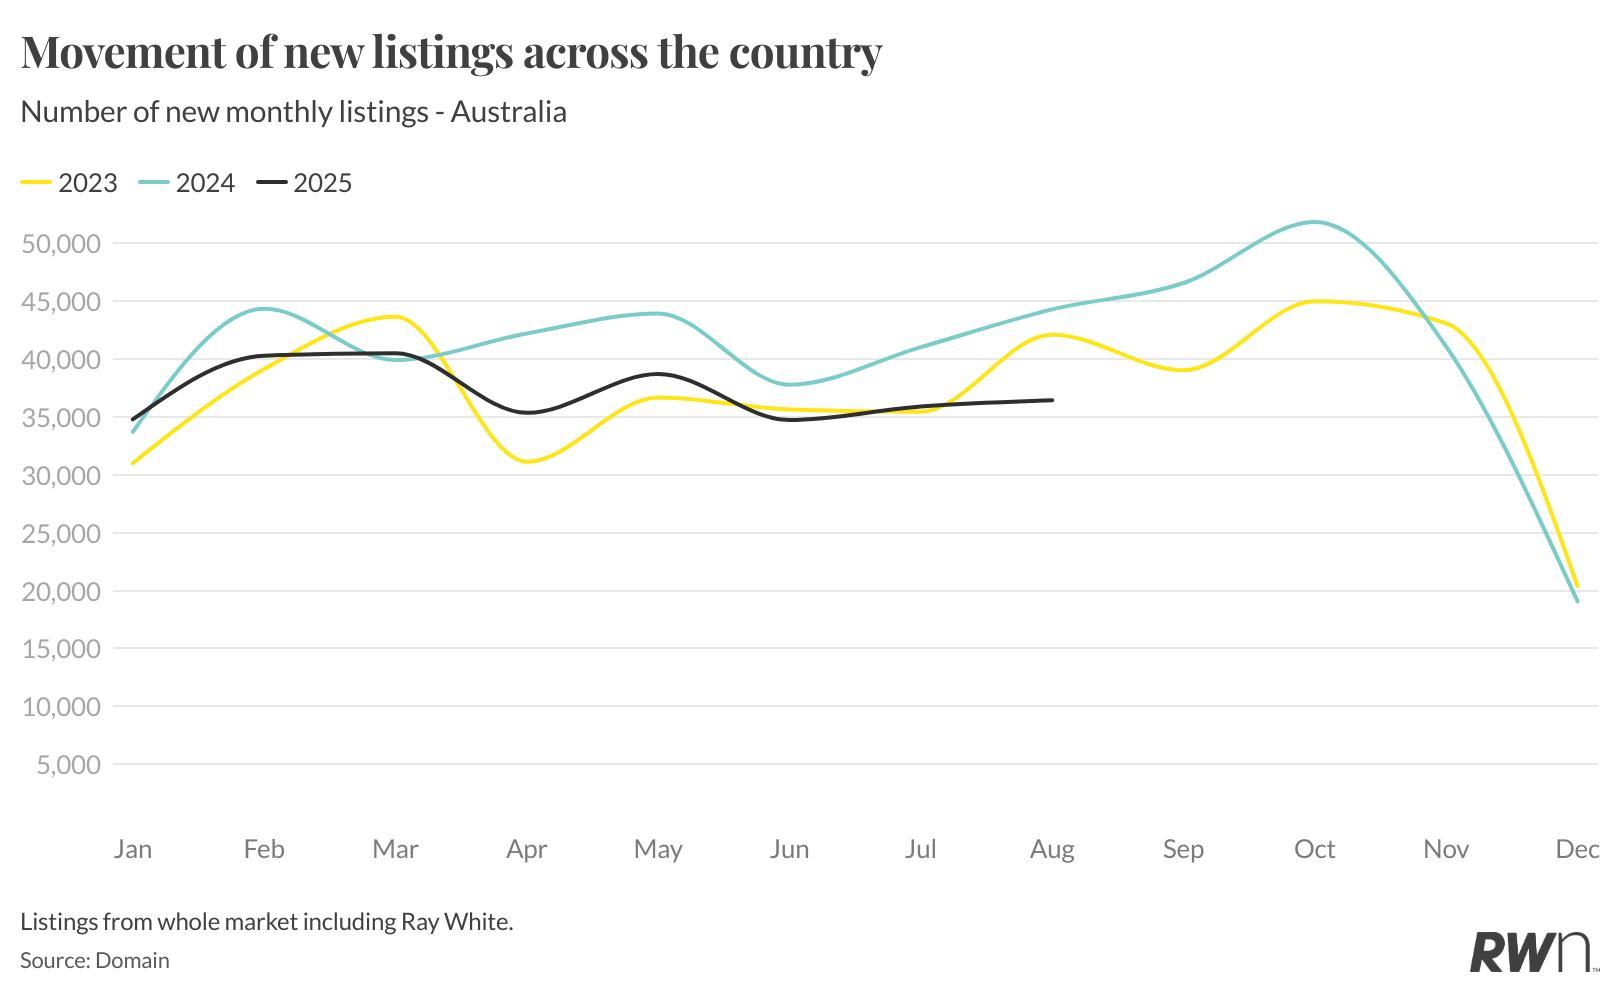
August’s national listing volumes totalled 36,433 properties, down 9.8 per cent from July and representing a significant 17.8 per cent decline compared to August 2024. This ongoing constraint in supply continues to create the competitive conditions that have characterised the market throughout the interest rate cutting cycle.
The annual comparison reveals the persistent nature of the listing shortage, with volumes tracking substantially below historical norms. This supply constraint provides fundamental support for both price growth and the competitive auction environment observed across metropolitan and regional markets, reinforcing vendor confidence in a rising market.
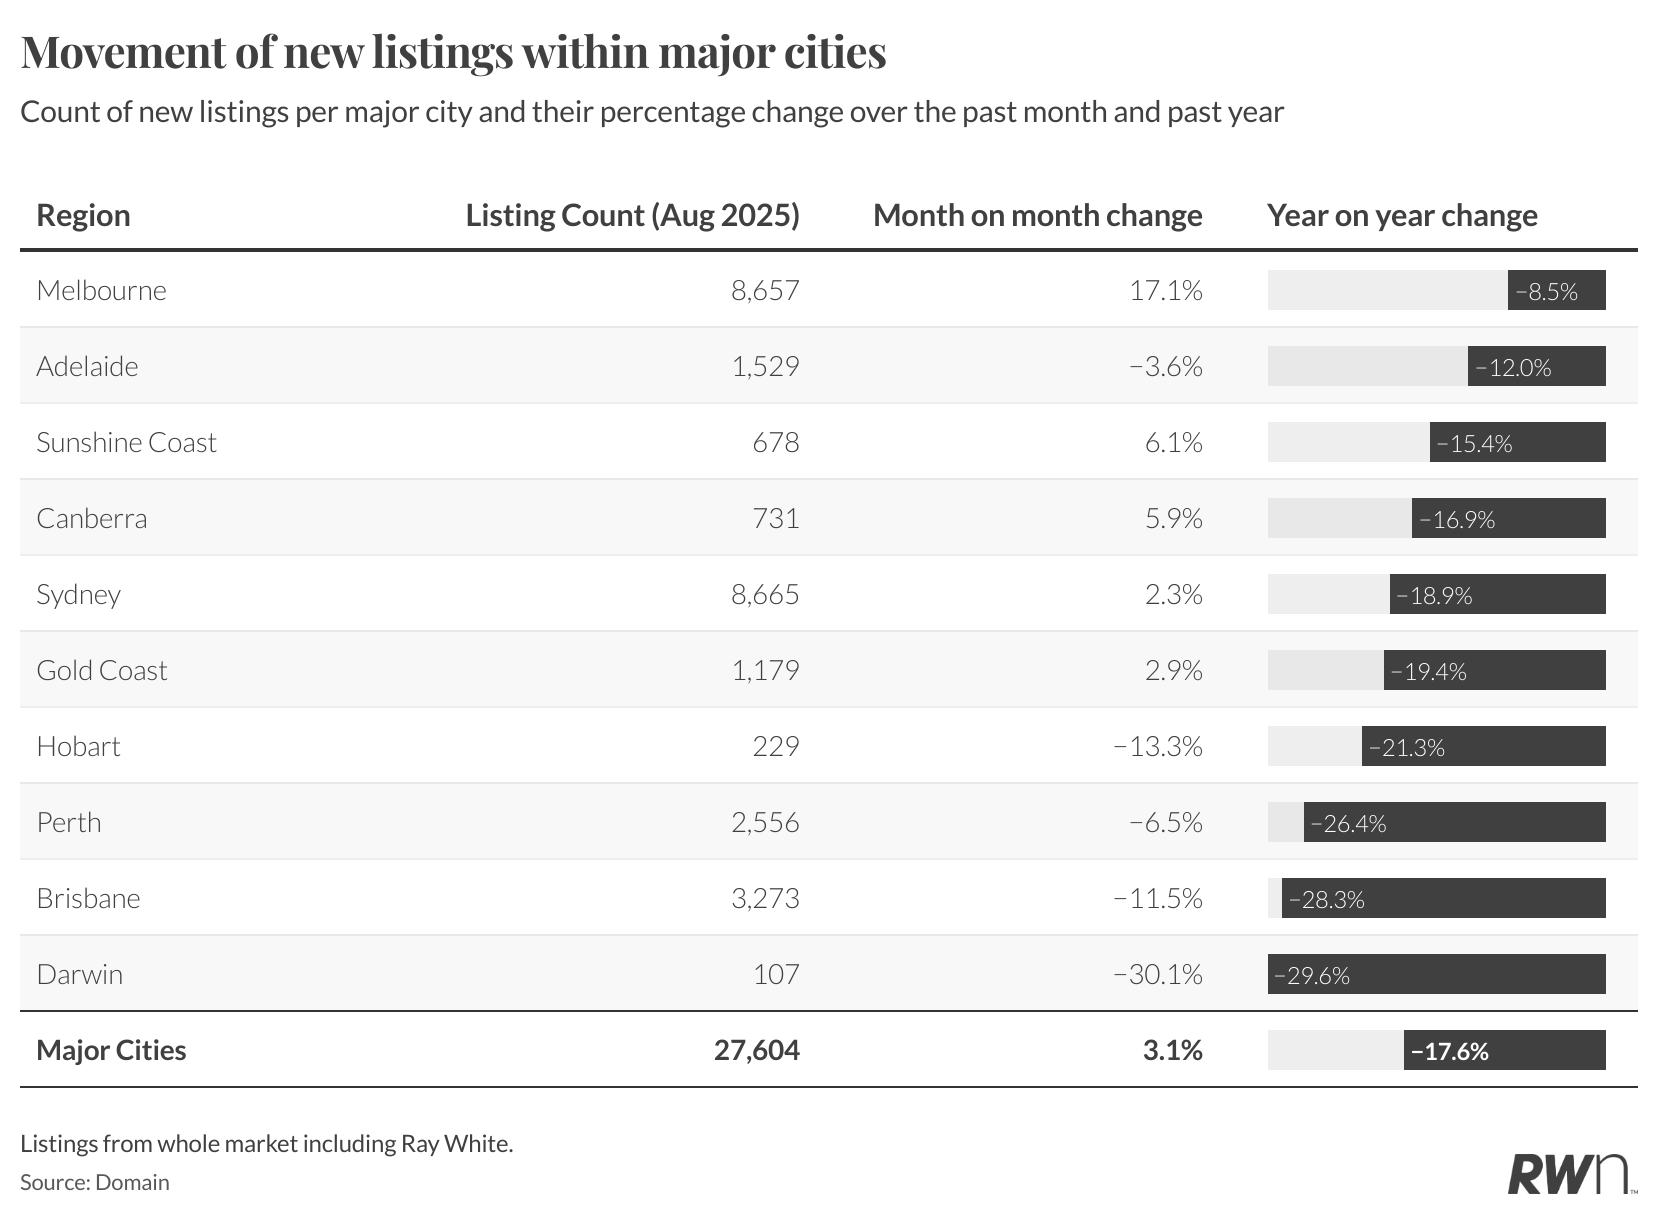
Metropolitan markets recorded 27,604 listings in August, up 3.1 per cent from July but down 17.6 per cent annually. Melbourne led monthly increases with 17.1 per cent growth to 8,657 listings, while Brisbane experienced the most significant monthly decline at 11.5 per cent to 3,273 properties.
The supply constraint remains most evident in Perth (2,556 listings) and Brisbane, showing annual declines of 26.4 per cent and 28.3 per cent respectively. Sydney recorded 8,665 listings with modest 2.3 per cent monthly growth but remains down 18.9 per cent annually. Adelaide shows strong supply constraint with 1,529 listings down 3.6 per cent monthly and 12.0 per cent annually, reflecting ongoing vendor hesitancy in appreciating markets.

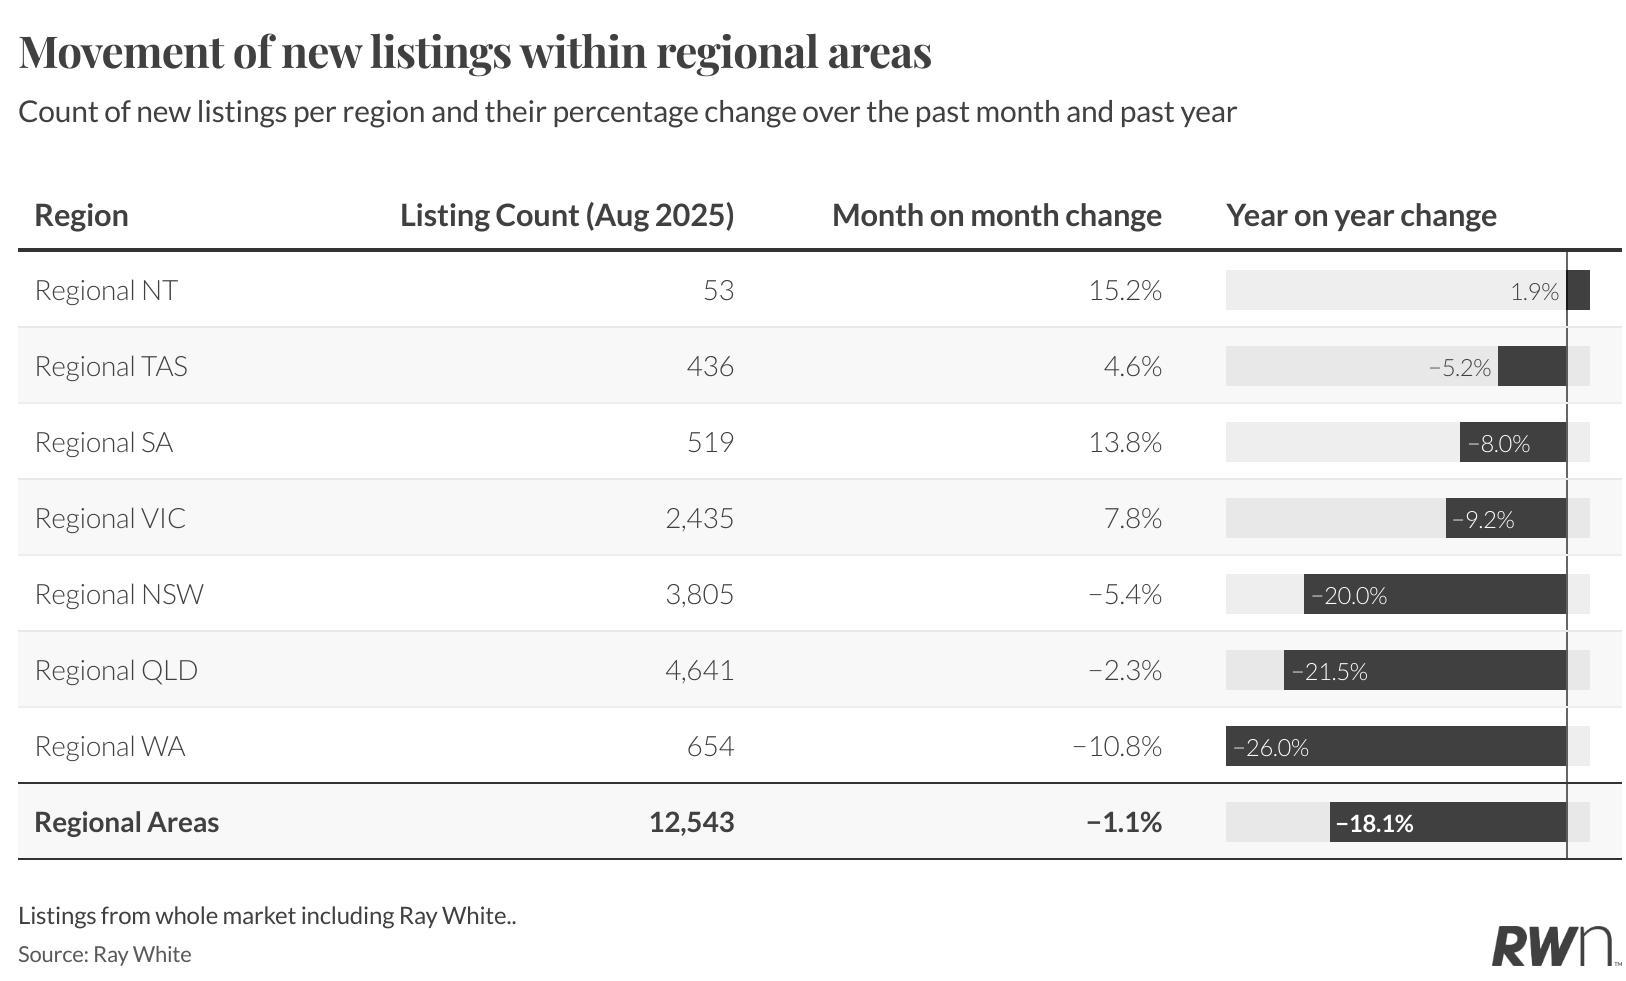
Regional markets totalled 12,543 listings in August, declining 1.1 per cent monthly and 18.1 per cent annually. Regional Queensland remains the largest market with 4,641 properties despite a 2.3 per cent monthly decline and 21.5 per cent annual decrease.
The most constrained regional market is Western Australia, down 10.8 per cent monthly and 26.0 per cent annually to just 654 listings. Regional New South Wales shows the steepest annual decline at 20.0 per cent to 3,805 properties. Only regional Northern Territory and South Australia recorded monthly increases, rising 15.2 per cent and 13.8 per cent respectively, though both remain well below previous year levels.

AUCTION INSIGHTS
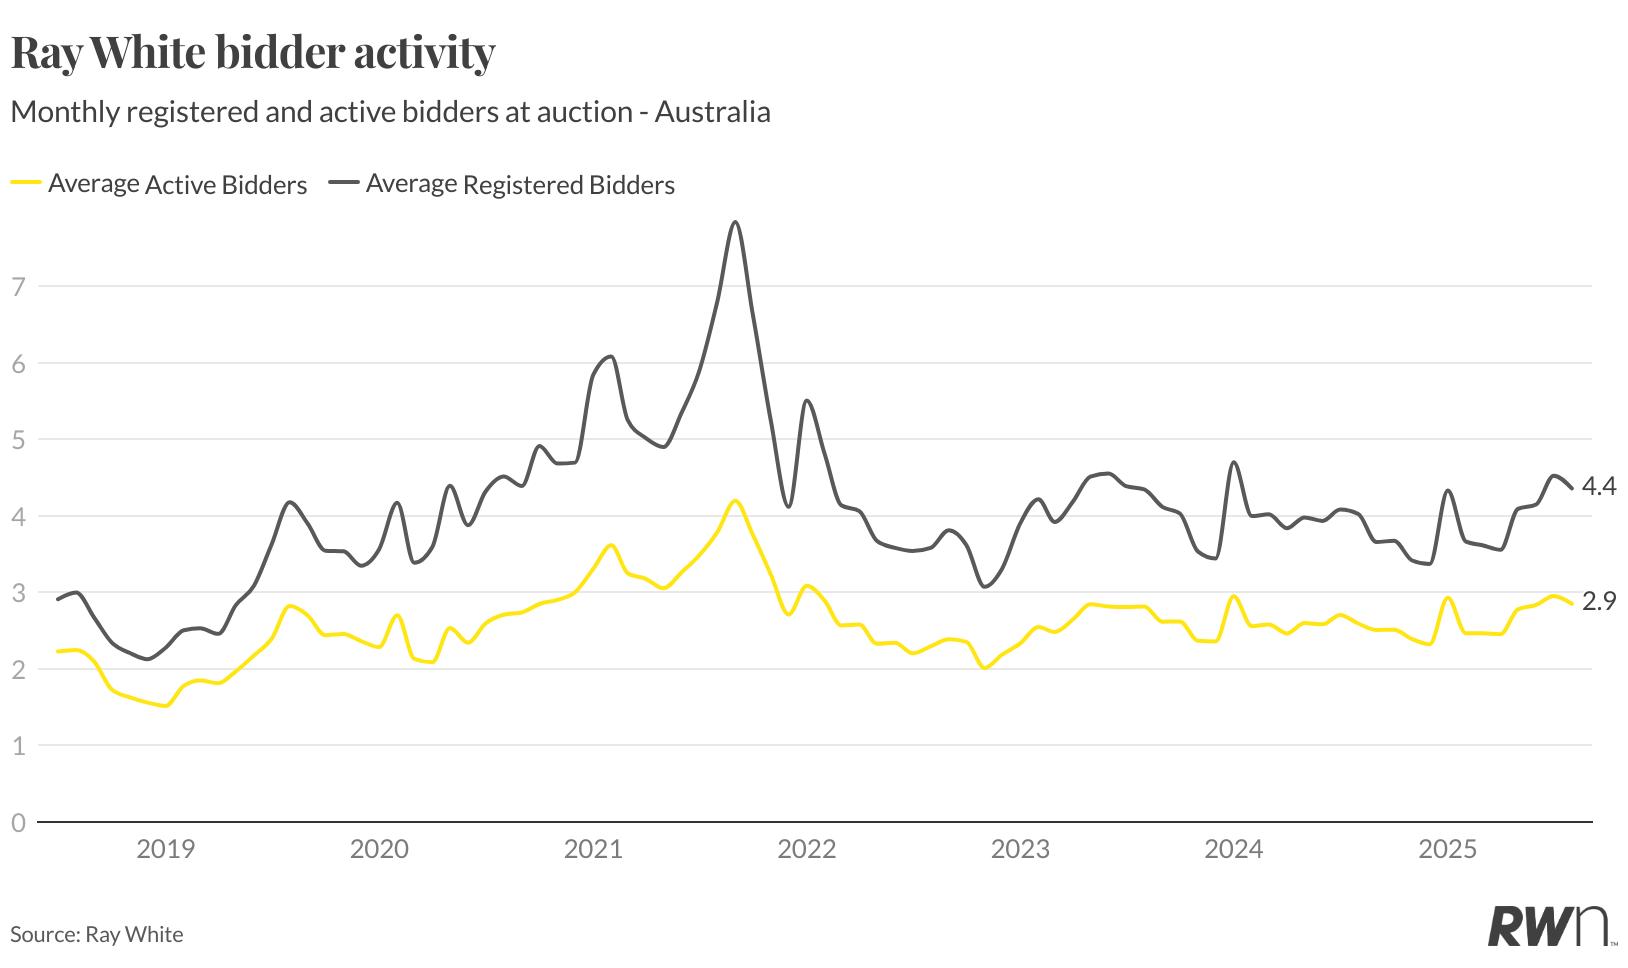
Bidder participation levels remained steady in August with an average of 4.4 registered bidders per property and 2.9 active bidders per auction. This represents stable engagement despite the ongoing supply constraints, with approximately 66 per cent of registered participants actively bidding, indicating serious buyer intent.
The consistency in participation levels reflects the market’s adaptation to constrained supply conditions. With the imminent implementation of the expanded five per cent deposit scheme removing previous restrictions for first home buyers, these bidder metrics provide a foundation for potentially intensifying auction competition. The scheme’s removal of income caps and geographic limitations is expected to bring additional participants into an already competitive market environment.

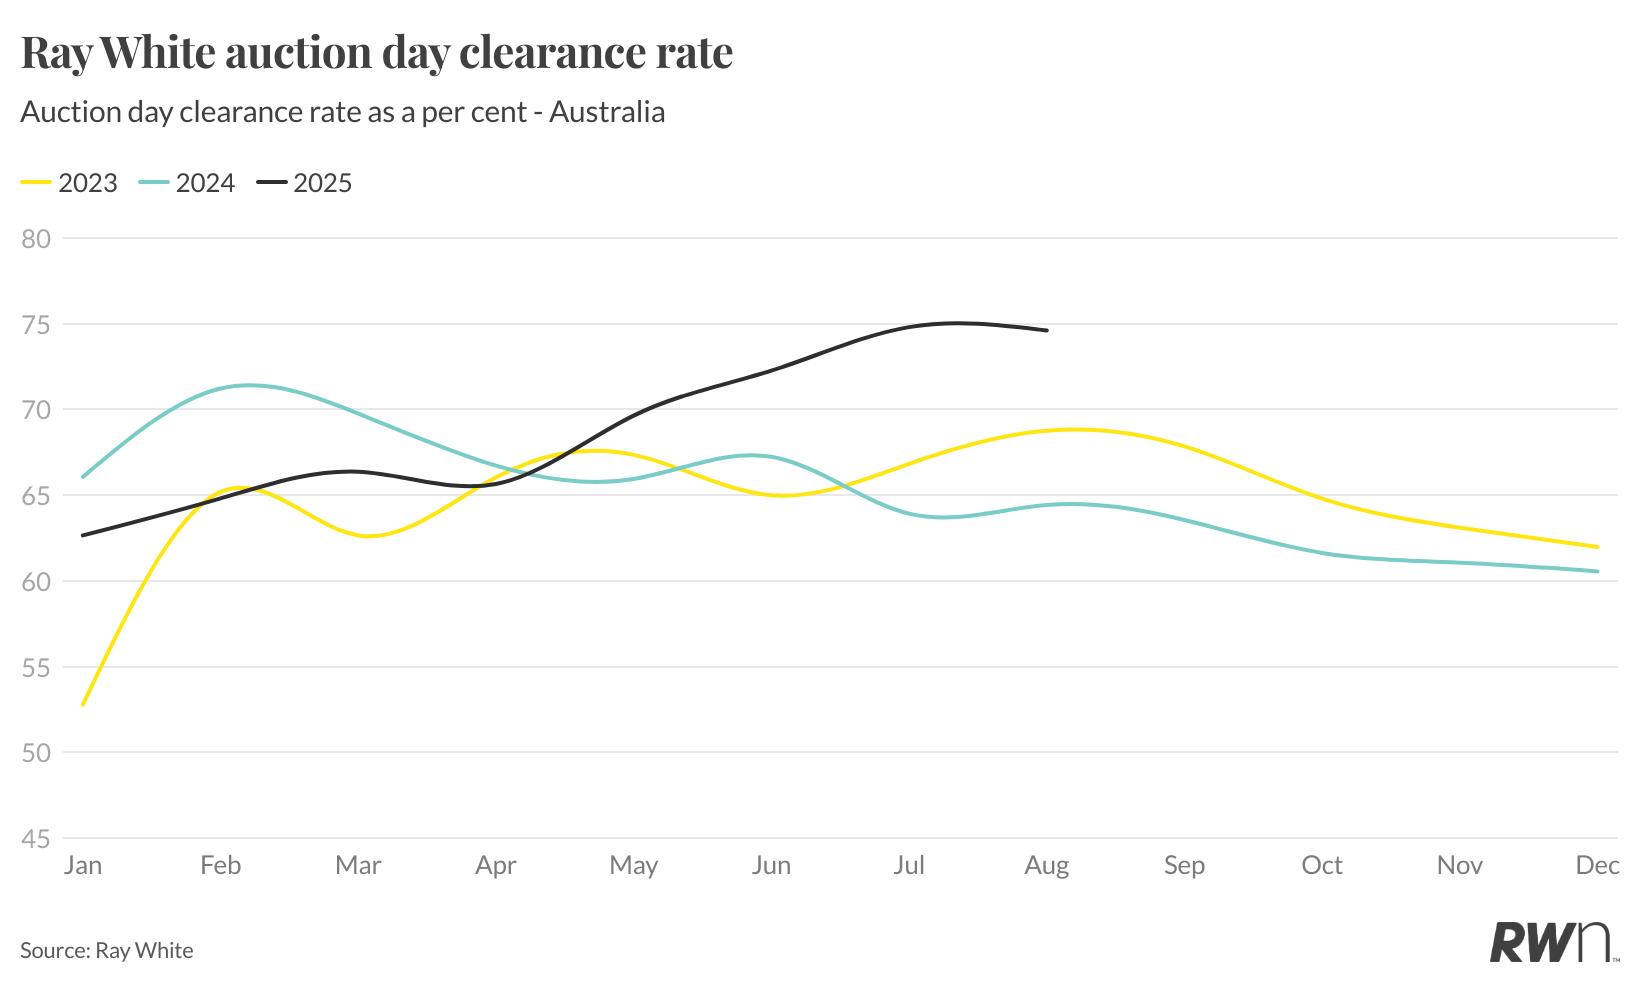
Ray White auction clearance rates maintained exceptional strength, reaching 74.6 per cent in August, demonstrating the sustained competitive intensity created by limited property availability. This performance significantly outpaces both 2023 and 2024 results for the corresponding period, with 2025’s trajectory continuing well above historical averages.
The elevated clearance rates reflect the combination of supply constraints and improved buyer confidence following the interest rate cutting cycle. With the expanded five per cent deposit scheme implementation imminent, these already competitive auction conditions are positioned to intensify further as additional first home buyers enter the market with reduced deposit barriers, potentially driving clearance rates even higher through the spring period.

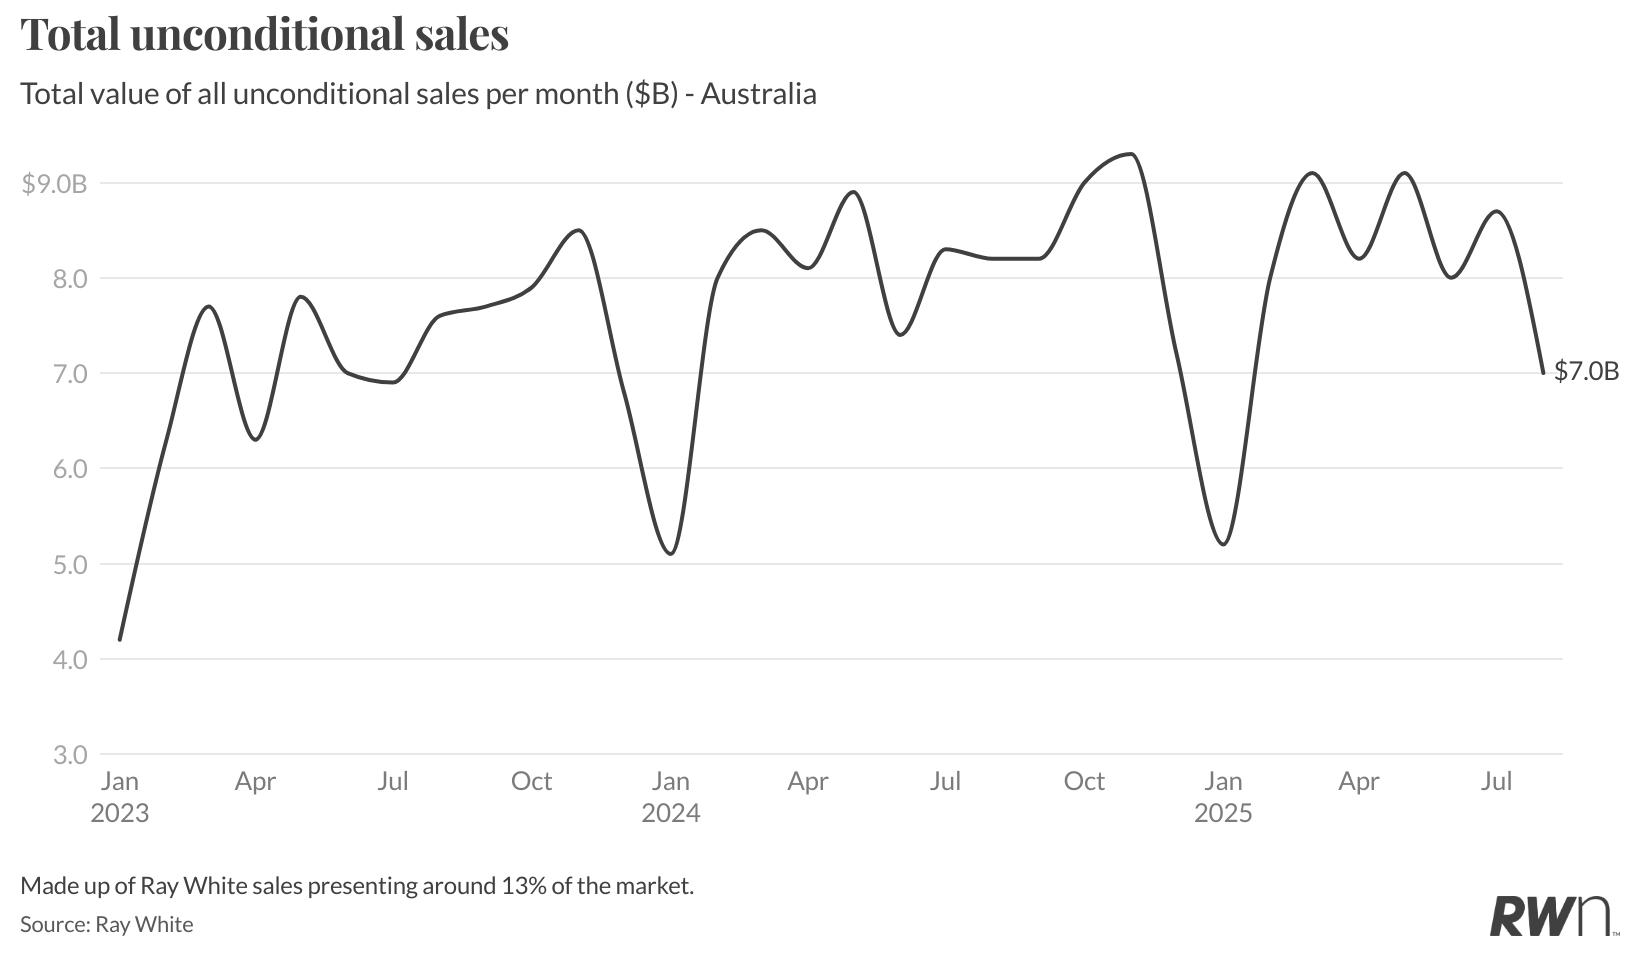
Ray White Group’s unconditional sales reached $7.0 billion in August, maintaining the resilient performance levels established throughout 2025 despite typical seasonal moderation patterns. This result demonstrates continued market strength and reflects the group’s sustained transaction volumes alongside ongoing price appreciation across most market segments. The August figure aligns with seasonal expectations while preserving the elevated baseline established through 2025’s strong performance. With interest rate cuts now implemented and the expanded five per cent deposit scheme approaching, this sales foundation positions the group well for anticipated market acceleration through the traditionally active spring selling period. Ray White’s consistent performance throughout the rate cutting cycle reflects underlying market fundamentals and sustained buyer engagement across the network.

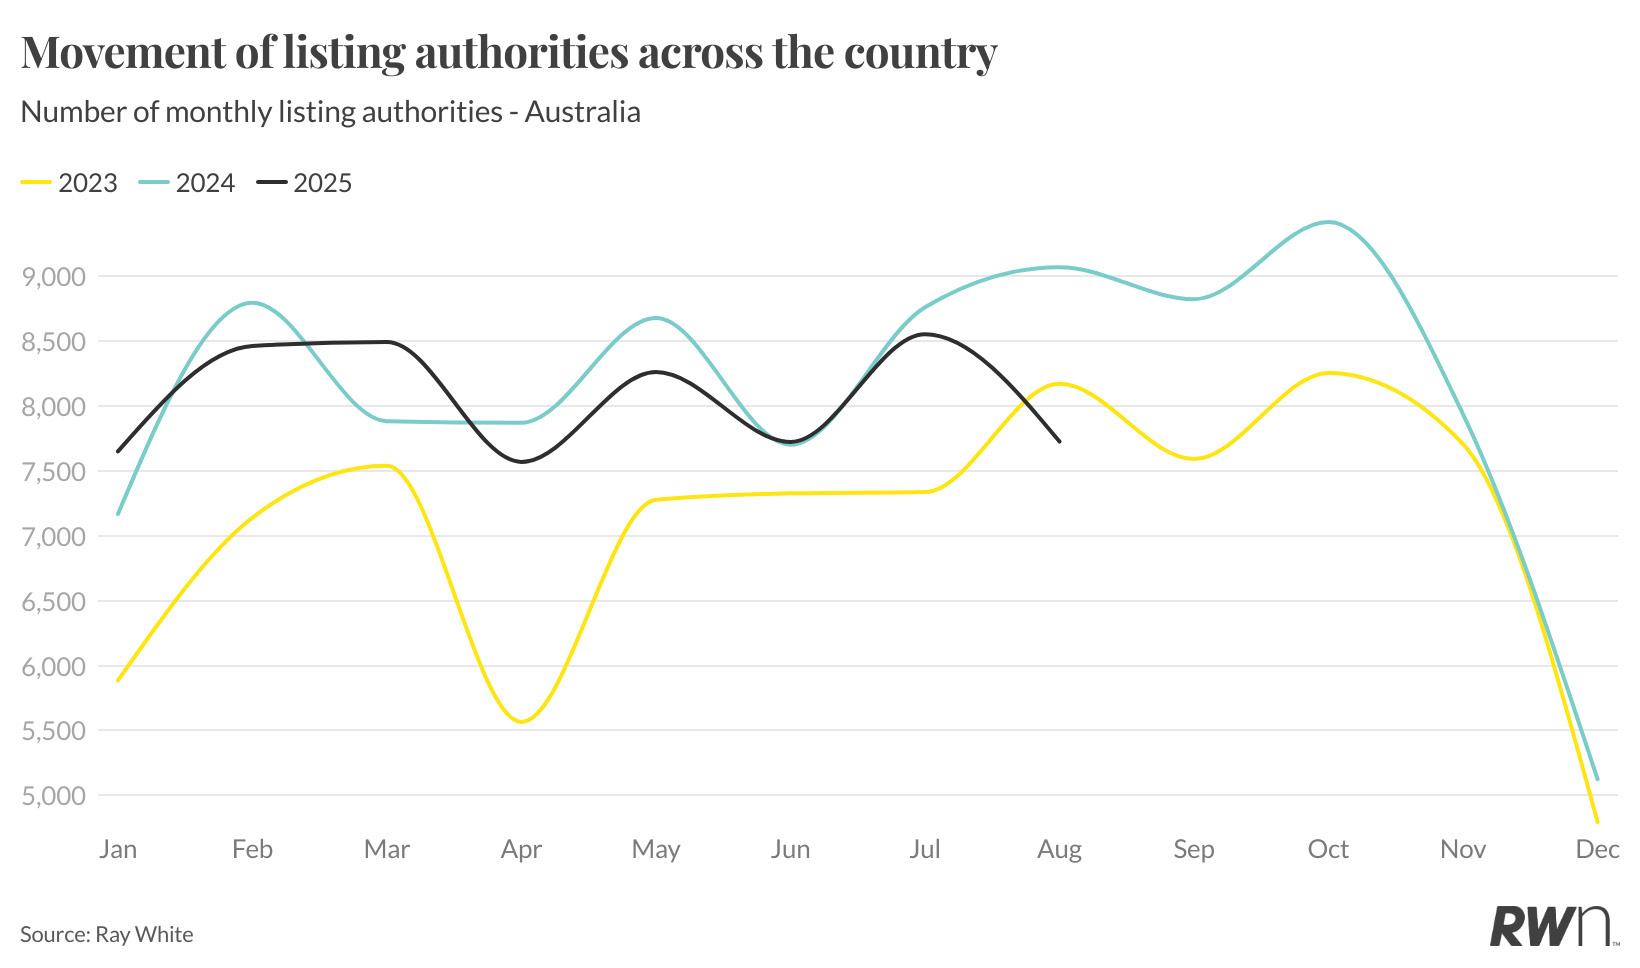
Ray White’s listing authorities data shows a continued decline through August, falling to approximately 7,700 from the peak of around 8,500 reached earlier in 2025. This downward trajectory reflects ongoing vendor hesitancy despite improved market conditions following the interest rate cut.
The persistent decline in listing authorities suggests the supply constraints evident in current listing volumes are likely to continue through the spring selling period. This forward-looking metric, which tracks properties where vendors have signed agreements but marketing has not yet commenced, indicates that the tight supply conditions supporting current price growth and auction competition may persist longer than typical seasonal patterns would suggest, maintaining the competitive market environment into the traditionally more active spring period.