9 minute read
4. Results


Identifier Pre-onset duration (samples) Post-onset duration (samples)
Post-onset duration (ms) @44.1kHz
Advertisement
Control/Baseline 2048 2048 23 Real-time – Low Latency 512 256 5.8 Real-time – Ultra Low Latency 256 128 2.9 Table II. Audio Duration Inputs for Hyperparameter Tuning
The following results demonstrate the feasibility of the unsupervised classification of vocal percussion for real-time audio durations. The best performing model achieved cluster purity of 100% for the control audio duration, >94% for real-time low latency and >93% for real-time ultra-low latency. Complete results with best performing parameters are given in table III. The conversion between accuracy and samples correctly classified for best performing results are presented in table IV.
three_perc five_perc six_perc accuracy parameters accuracy parameters accuracy parameters
Baseline Kmeans 100%
RealTime –Low Latency GMM 100%
Kmeans 100%
GMM 100%
feature1: �������� feature2: ��������∆ feature3:��������∆∆ n_mfcc: 12 scaling: standard dimensions: 5 feature1: �������� n_mfcc: 12 scaling: standard dimensions: 5
Kmeans 100%
GMM 100%
Kmeans 97%
GMM 97%
feature1: �������� feature2: ��������∆ feature3:��������∆∆ n_mfcc: 12 scaling: standard dimensions: 5 feature1: �������� feature2: sc n_mfcc: 12 scaling: standard dimensions: 5
Kmeans 100%
GMM 100%
Kmeans 94%
GMM 94%
feature1: �������� feature2: ��������∆ feature3:��������∆∆ n_mfcc: 12 scaling: standard dimensions: 5 feature1: �������� feature2: sc feature2: zcr n_mfcc: 12 scaling: standard dimensions: 5
RealTime –Ultra Low Latency Kmeans 98%
GMM 100%
feature1: �������� feature2: zcr feature3: sc n_mfcc: 15 scaling: standard dimensions: 5
Kmeans 98%
GMM 97%
feature1: mfcc feature2: ������ feature3: sc n_mfcc: 15 scaling: standard dimensions: 5
Kmeans 92%
GMM 93%
feature1: mfcc feature2: sc n_mfcc: 15 scaling: standard n_dims: 5
Table III. Overall best performing results across three datasets and audio durations
three_perc five_perc six_perc
Control/Baseline 108 of 108 samples correctly classified 180 of 180 samples correctly classified 216 of 216 samples correctly classified
Low Latency
108 of 108 samples correctly classified 175 of 180 samples correctly classified 203 of 216 samples correctly classified
Ultra-Low Latency 108 of 108 samples correctly classified 177 of 180 samples correctly classified
201 of 216 Samples correctly classified Table IV. Conversion from Accuracy scores to Number of Samples Correctly Classified
A combination of Mel Frequency Cepstral Coefficients (MFCC), Spectral Centroid (SC) and ZeroCrossing Rate (ZCR) have shown overwhelming success, particularly for the real-time audio durations. For longer audio durations, delta accelerated features that model the trajectories of the MFCC over frames have performed highly. This can be attributed to the higher number of samples and therefore
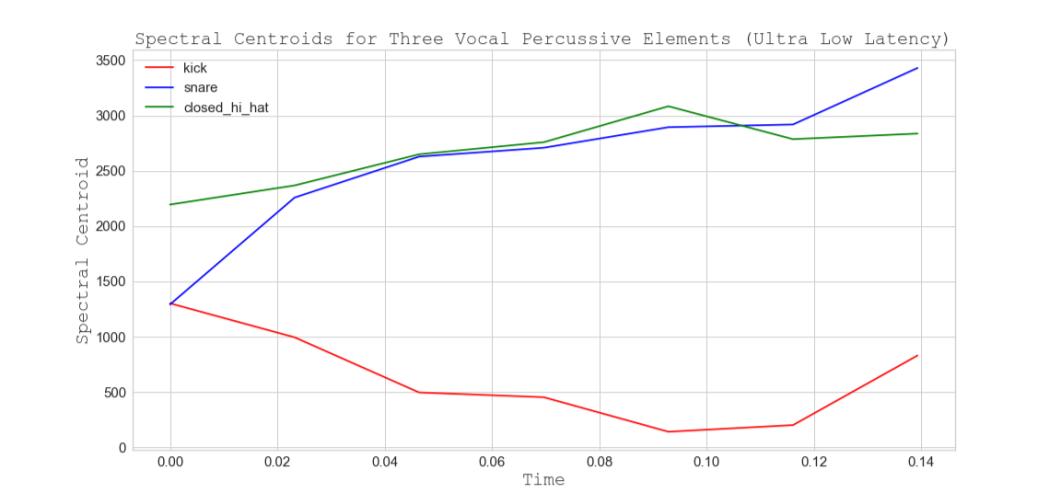
frames gathered from a longer audio duration. The audio features that perform well for the real-time durations appear to do so owing to the silence/zeroed samples that are discarded in the process of obtaining a shorter audio duration. Variations of low-level noise or silence can greatly affect the correctness of ZCR and SC calculations. For ultra-low latency, figures 11, 14, and 16 demonstrate the ability of SC features to separate vocal percussive elements. Good separation is exhibited across all elements, except for the snare and closed hi-hat, whose spectral centroids are closely related and show less of a partition. The addition of the ZCR features gives an observable separation for the snare and closed hi-hat (fig 12).
Figure 11. Spectral Centroids for Three Vocal Percussive Elements (Ultra-low Latency)
Figure 12. Zero-Crossing Rate for Three Vocal Percussive Elements (Ultra-low Latency)
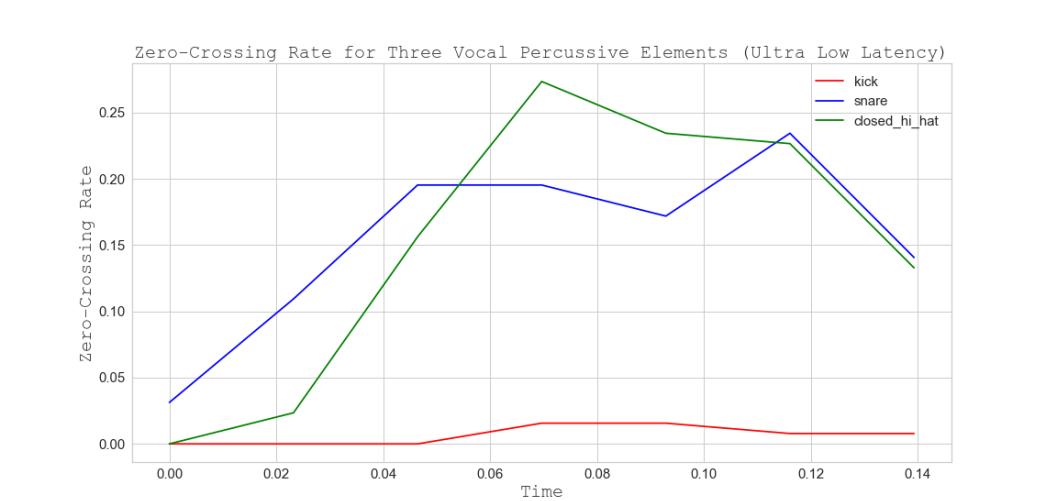
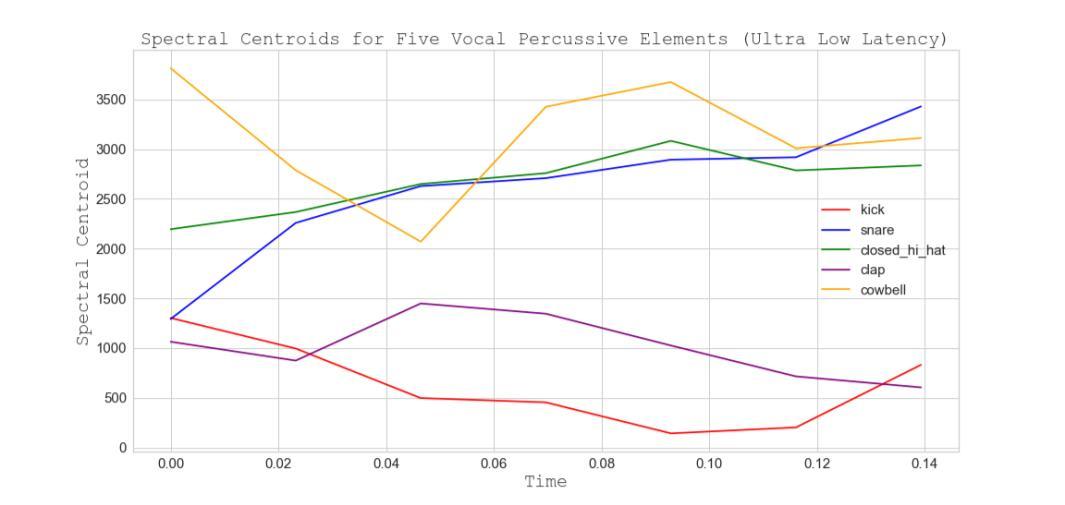
Figure 13. Spectral Centroids for Five Vocal Percussive Elements (Ultra-low Latency)
Figure 14. Zero-Crossing Rate for Five Vocal Percussive Elements (Ultra-low Latency)
Figure 15. Spectral Centroids for Six Vocal Percussive Elements (Ultra-low Latency)
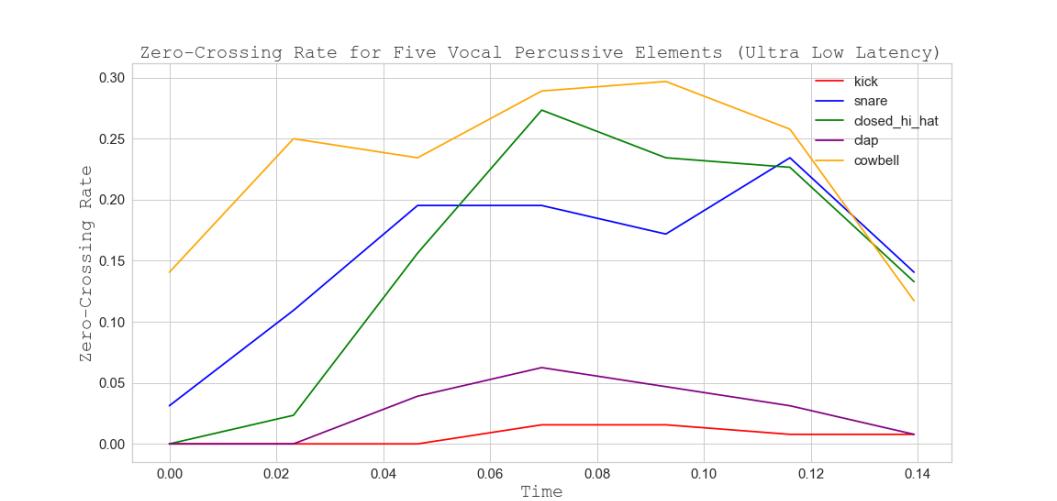
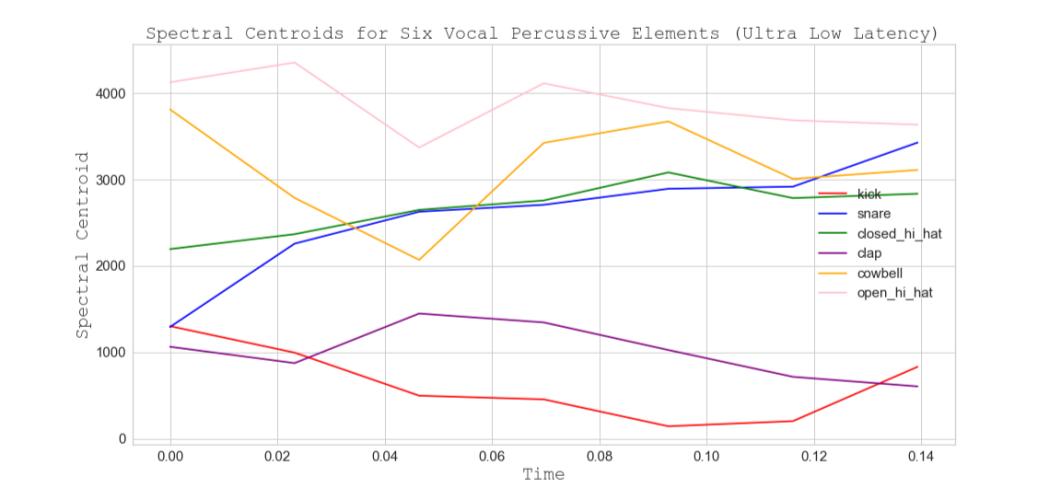
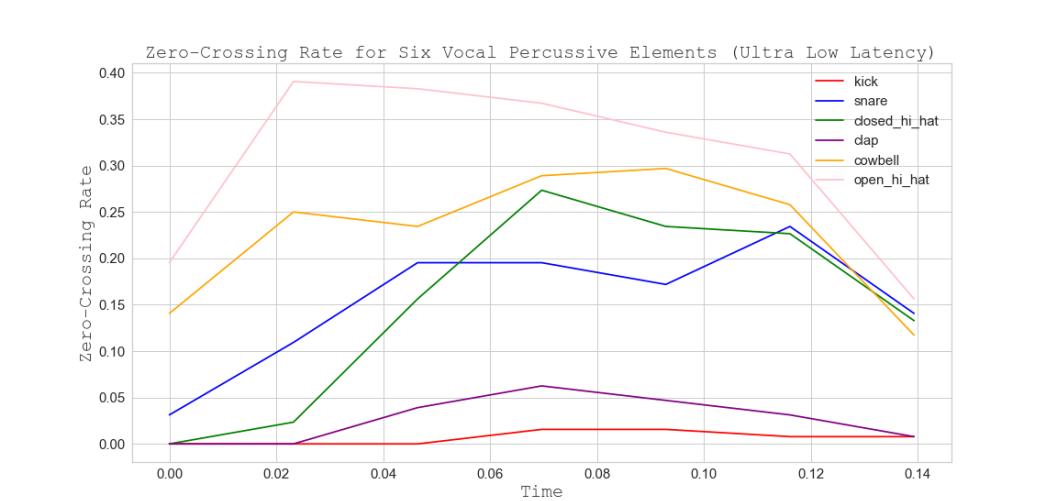
Fig 16. Zero-Crossing Rate for Six Vocal Percussive Elements (Ultra-low Latency)
Hyperparameter Tuning for K-Means Clustering
This round of trials determines the best performing hyperparameters for the k-means clustering model. The audio durations in table II were investigated for each vocal percussive dataset. Having already performed thorough manual hyperparameter testing prior to the implementation of Optuna, and having found PCA to produce consistently optimal results, the decision was made to hard code the reduction type category but tune the number of dimensions. Additionally, the SOM implementation performed inconsistently throughout the project, especially for real-time durations. For this reason, the hyperparameter tuning stage focuses on optimising only k-means and GMM. Previously, a metric upon which to measure the objective function was introduced. For this work, success is measured by a RandIndex score. The objective function is therefore set up to find the combination of hyperparameters that maximise the Rand-Index score. A full overview of best performing hyperparameters for k-means clustering and the corresponding Rand-Index scores can be found in table V.
RandIndex Score hyperparameter Settings accuracy hyperparameter Settings accuracy hyperparameter settings
three_perc five_perc
Baseline 1.0 feature1: mfcc feature2: ∆mfcc feature3: ∆∆mfcc n_mfcc: 24 scaling: standard dimensions: 5 1.0 feature1: mfcc feature2:∆∆mfcc feature3: sc n_mfcc: 21 scaling: standard dimensions: 5 1.0 feature1: mfcc feature2: ∆mfcc feature2: zcr n_mfcc: 16 scaling: standard dimensions: 8
Real-Time – Low Latency
1.0 feature1: mfcc feature2:∆∆mfcc n_mfcc:18 scaling: standard dimensions: 5 0.96 feature1: mfcc feature2:∆∆mfcc feature3: sc n_mfcc: 33 scaling: standard dimensions: 5 0.94 feature1: mfcc feature2: zcr n_mfcc: 32 scaling: standard dimensions: 5
Real-Time – Ultra Low Latency
1.0 feature1: mfcc feature2: zcr feature3: sc n_mfcc: 15 scaling: standard dimensions: 4 0.97 feature1: mfcc feature2: zcr feature3: sc n_mfcc: 15 scaling: standard dimensions: 5 0.92 feature1: mfcc feature2: zcr n_mfcc: 14 scaling: standard dimensions: 5
six_perc
Table V. Hyperparameter Tuning Results for Singular Features
This round of trials determines the best performing Optuna hyperparameters for Gaussian Mixture Modelling (GMM). Once again, the audio durations in table II where investigated for each vocal percussive dataset. Several of the feature sets introduced in chapter 3.4 consist of the aggregation of multiple features. For this reason it is useful to assess whether Optuna can derive an optimal combination of features that have not yet been considered.
RandIndex Score hyperparameter Settings accuracy hyperparameter Settings accuracy hyperparameter settings
three_perc five_perc
Baseline 1.0 feature1: mfcc feature2: ∆mfcc feature3: ���� n_mfcc: 19 scaling: standard dimensions: 5 1.0 feature1: mfcc feature2: ∆mfcc feature3:∆∆mfcc n_mfcc: 14 scaling: standard dimensions: 2 1.0 feature1: mfcc feature2: ∆∆mfcc feature3: sc n_mfcc: 15 scaling: standard dimensions: 5
six_perc
Real-Time – Low Latency
1.0 feature1: mfcc n_mfcc: 25 scaling: standard dimensions: 5 0.97 feature1: mfcc feature3: sc n_mfcc: 23 scaling: normal dimensions: 5 0.94 feature1: mfcc feature2: ∆∆mfcc feature3: zcr n_mfcc: 33 scaling: standard dimensions: 5
Real-Time – Ultra Low Latency
1.0 feature1: mfcc feature2: zcr feature3: sc n_mfcc: 15 scaling: standard dimensions: 4 0.97 feature1: mfcc feature2: zcr n_mfcc: 15 scaling: standard dimensions: 5
0.93 feature1: mfcc feature2: zcr feature3: sc n_mfcc: 18 scaling: standard dimensions: 5 Table VI. Hyperparameter Tuning Results for Gaussian Mixture Modelling
The perceptually motivated MFCC features have consistently produced the most accurate results across the three datasets and audio durations. A further insight gleaned from the hyperparameter optimisation results is that, in most cases, the MFCC features performance is increased by the aggregation of cherry picked spectral and temporal features or MFCC delta coefficients.
Interpreting the Results
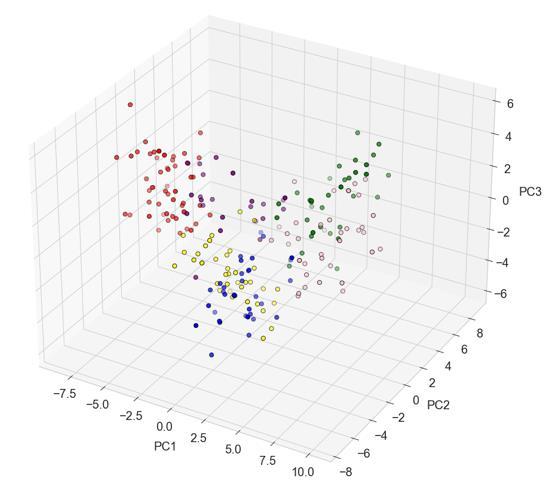
The clustering accuracy achieved in this work on real-time audio durations gives an impression of how reliably an implementation of this pipeline would perform in a real-world application. The Rand-Index scoring metric ranges between 0 – 1.0, with a score of 1.0 translating to 100% cluster purity. Comparing the rand index scores presented in table VI and table V to the accuracy results in table III, it can be concluded that the hyperparameter tuning results were able to be successfully replicated as manual trials, without loss of accuracy. Standardising the features to have mean 0 and unit variance has drastically outperformed its alternative of normalisation between 0 – 1. Five dimensions of principle components have proved adequate throughout to achieve data separation conducive with k-elbow and clustering accuracy. Though it is not possible to visualise the principle subspace in five dimensions, the clustering results can be visualised in both two and three dimensions to give an impression of inter-dimensional separation. Complete clustering visualisations for all models are given in appendix I, II & III.
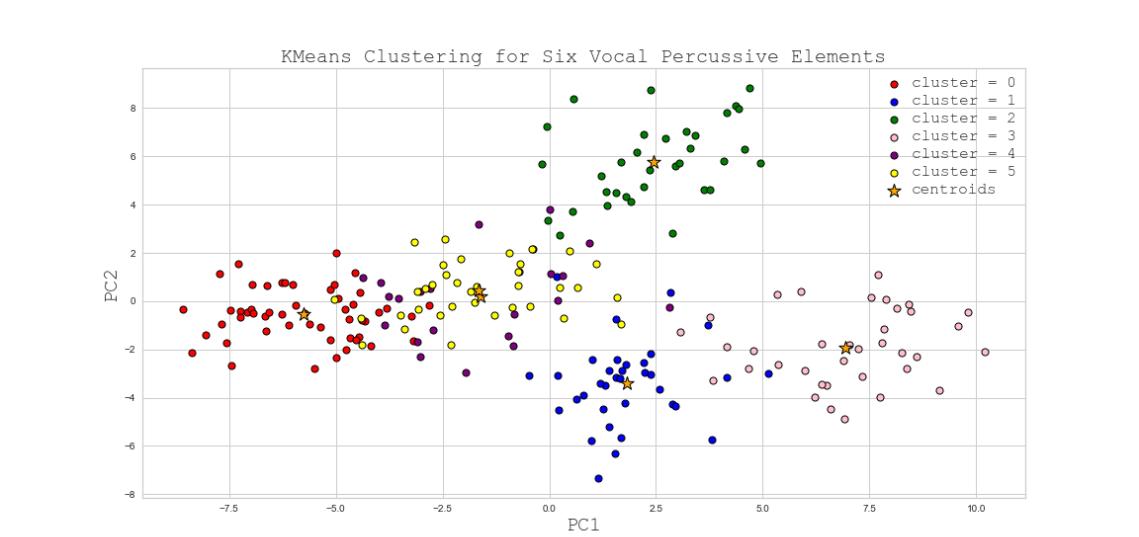
Figure 17. k-means Clustering for Six Vocal Percussive Elements in Two-Dimensional Principle Subspace (Ultra-Low Latency)
Figure 18. k-means Clustering for Six Vocal Percussive Elements in Three-Dimensional Principle Subspace (Ultra-Low Latency)
Feature Performance
PSTC
This work saw the implementation of PSTC audio features. These were found not to perform as consistently well when applied to the task of segmenting vocal percussive data. This is due in part to their inability to well represent the vocal percussive datasets across all classes, resulting in poor separation in the principle subspace (separation in the feature space being a key indicator that the outcome of the clustering stage will yield reliable results). For this reason, the introduction of the PSTC
features appeared to confuse the k-elbow metric which had previously been working reliably for MFCC and MFCC+ feature sets.
K-Elbow Method
The k-elbow method, coupled with the Calinski Harabasz metric, correctly predicted a value for k for all best performing parameters detailed in table III, aside from the case of ultra-low latency for six percussive elements.
The case at which the k-elbow method was unable to identify the correct value for k (six elements, ultralow latency) is designed to challenge the limits of the capability of the clustering pipeline. Here the model is required to successfully classify six classes on a dataset comprised of a significantly reduced (when compared with the control) number of audio samples. When quantifying the trade-off between classification accuracy and latency reduction, it can be observed in table IV that for a dataset of six vocal percussive elements, the reduction of samples upon which to classify the data from 2048 (23ms after onset) to 128 (2.9ms after onset) results in 15 fewer correctly classified samples, a reduction in clustering accuracy of 7%. This is a 7% reduction in classification accuracy for an 87% decrease in latency. For five vocal percussive elements this translates to a 2% reduction in accuracy for an 87% decrease in latency. Both trade-offs appear highly advantageous in pursuit to lower latency but striking a balance between the two ultimately depends on the application and size of the dataset i.e., 7% reduction in accuracy on a 1000 element dataset results in 70 misclassified data points.
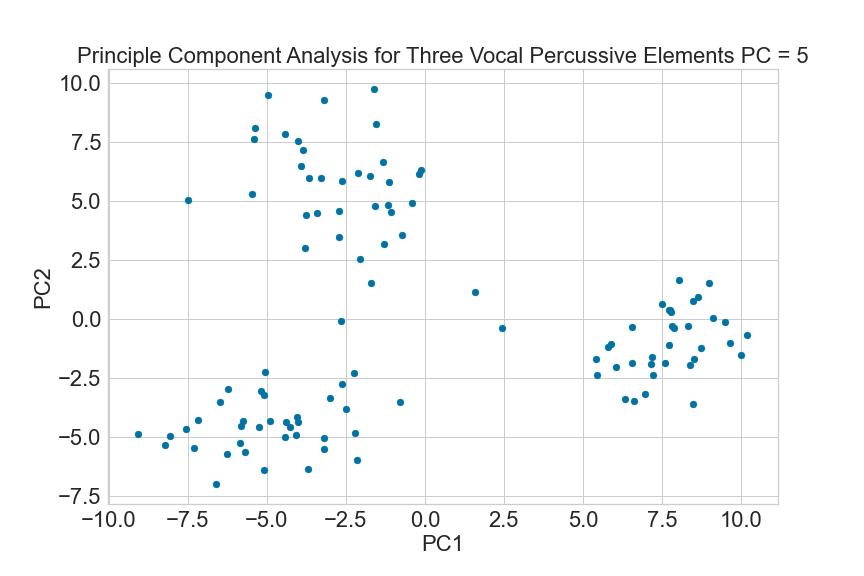
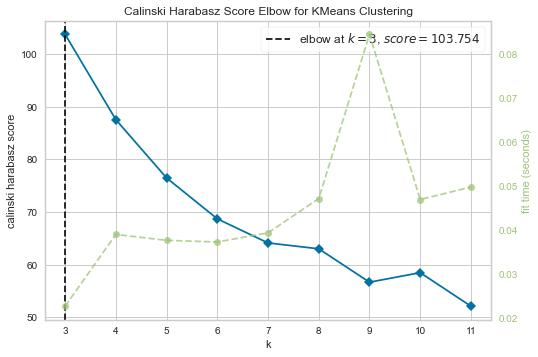
Figure 19. Example of Distinct Cluster Formations (top) Upon Which the k-elbow Metric Performs Well (bottom)


