

C9 ResearchProject
Benchmarking customer priorities and trust in the energy sector
FinalReport


Final report
RACE for Change
Research Theme C9: Incorporating end users in whole-ofsystem design
ISBN: 978-1-922746-52-8
Industry Report
Benchmarking customer priorities and trust in the energy sector
May 2024
Citations
Russell-Bennett, R., Gordon, R., Letheren, K., McAndrew, R., Mathmann, F., Van Hummel, A., and Bowring, N. (2023).
Benchmarking Customer Priorities and Trust: Report Queensland University of Technology, Australia
Prepared for RACE for 2030 CRC.
Project partners

Acknowledgements

Project team QUT
• Prof. Rebekah Russell-Bennett
• Prof. Ross Gordon
• Dr. Kate Letheren
• Dr. Ryan McAndrew
• Assoc. Prof. Frank Mathmann
• Ms. Aleksandra van Hummel
• Mrs. Natalie Bowring


We would like to thank all the stakeholders that contributed their time to this report. Our Industry Reference Group consisted of Ausgrid, Synergy, Western Power, St Vincent de Paul, WA Expert Consumers Advisory Panel, DEPW (QLD), EnergyOS, Ergon Energy, Essential Energy, NSW DCCEEW, Essential Energy and AER. Whilst their input is very much appreciated, any views expressed here are the responsibility of the authors alone
Acknowledgement of Country
The authors of this report would like to respectfully acknowledge the Traditional Owners of the ancestral lands throughout Australia and their connection to land, sea and community. We recognise their continuing connection to the land, waters, and culture and pay our respects to them, their cultures and to their Elders past, present, and emerging.
What is RACE for 2030?
Reliable, Affordable Clean Energy for 2030 (RACE for 2030) is an innovative cooperative research centre for energy and carbon transition. We were funded with $68.5 million of Commonwealth funds and commitments of $280 million of cash and in-kind contributions from our partners. Our aim is to deliver $3.8 billion of cumulative energy productivity benefits and 20 megatons of cumulative carbon emission savings by 2030. racefor2030.com.au
Disclaimer
The authors have used all due care and skill to ensure the material is accurate as at the date of this report. The authors do not accept any responsibility for any loss that may arise by anyone relying upon its contents.
|
pg. 3 LIST OF TABLES 4 LIST OF FIGURES 5 GLOSSARY 6 EXECUTIVE SUMMARY 8 Purpose and Research Questions 8 Method 8 Project Contributions 8 BACKGROUND AND OVERVIEW 13 Method 13 Sample Characteristics 14 Data Analysis Techniques 14 BENCHMARKING CUSTOMER TRUST IN THE ENERGY SYSTEM (RQ1) 15 What are Trust Levels in the Energy Sector? 15 What are Distrust Levels in the Energy Sector? 16 Does Trust and Distrust in the Energy Sector Differ Across Jurisdictions? 17 What Factors Influence Trust and Distrust? 18 What do Facebook Emoji Reactions Say About Factors Influencing Trust and Distrust? 20 Does Trust and Distrust in the Energy Sector Differ for Customers Experiencing Vulnerability? 21 How do Customers Feel about Retailers? 22 Which Actors in the Energy Sector are the Most Trusted and Distrusted? 23 UNDERSTANDING CUSTOMER PRIORITIES FOR THE ENERGY SYSTEM (RQ2) 29 What Themes Emerge in the Literature on Customer Priorities for the Energy System? 29 How do Customers Rank Priorities for the Energy System? 30 How do the trust/distrust factors from the social media analysis compare with customer priorities? 32 MAPPING TRUST IN THE ENERGY SYSTEM – ACTORS AND FACTORS (RQ3) 35 'Understanding the Australian Electricity Sector from a Systems Perspective'? 35 Developing the Systems map of trust in the Australian Electricity Sector 36 Energy Supply Subsystem 38 The Political Subsystem 40 Information Source Subsystem 40 Regulation Subsystem 40 Consumer Subsystem 40 SYSTEM LEVERAGE POINTS FOR BUILDING TRUST AND REDUCING DISTRUST (RQ4) 43 A Framework for System Leverage Points for Trust and Distrust 43 What Leverage Points Do Customers Want Actioned? 44 Improving the System - Findings 45 Who Should Lead Energy Sector Changes? 47 CONCLUSION AND NEXT STEPS 50 REFERENCES 52 APPENDICES 60 Appendix A– Method 60 Appendix B – Workshop Participants Trust and Distrust in Energy Actors 67 Appendix C – Correlation between Trust and Distrust 69 Appendix D – Trust and Distrust Scores by Vulnerability Indicator 70 Appendix E – Themes Emerging from the Literature on Energy Priorities 71 Appendix F – Customer Ranking of Energy Priorities (Workshop) 73 Appendix G – Industry Ranking of Energy Priorities (Workshop) 74 Appendix H - Emoji Reactions on Energy Organisations Facebook Posts for each of the 9 Factors 75 Appendix I – List of Energy System Actors from the Literature 77 Appendix J – Actors and Factors Associated with Trust in the Australian Energy System 82 Appendix K – Verbal and Workbook Quotes For Regulation Change 84 Contents
pg. 4
Tables Table 1: Method Alignment with the Research Questions 14 Table 2: Customer Ranking of Factors Associated with Trust and Distrust in the Survey 19 Table 3: Trust and Distrust for Different Vulnerability Indicators 21 Table 4: Correlations of Customer Trust for Different Energy Actors 24 Table 5: Summary of Trust Building Solutions at Each Leverage Point 45 Table 6: Key Concepts and Search Terms 60 Table 7: Wordlists for Key Drivers for Trust and Distrust 61 Table 8: Overview of Social Media Posts by Retailer 62 Table 9: Characteristics of Customer Workshop Participants (N = 29) 63 Table 10: Characteristics of Industry Workshop Participants 64 Table 11: Work Fields of Industry Workshop Participants 64 Table 12: Characteristics of Customer Survey Participants (N = 1,029) 65 Table 13: Characteristics of Industry Survey Participants (n = 15) 66
List of
pg. 5
Figure 1: Overview of Method 13 Figure 2: Customer Trust and Industry Perception of Customer Trust in The Energy System 15 Figure 3: Trust and Distrust as Two Distinct Neural Locations 16 Figure 4: Customer Distrust and Industry Perception of Customer Distrust in the Energy System 16 Figure 5: Customer Trust and Distrust Scores Across Jurisdictions 17 Figure 6: Frequency of Social Media Post Themes 20 Figure 7: Average Percentage of Emojis on Energy Actors Facebook Posts 22 Figure 8: Trust in Energy Actors (Survey) 23 Figure 9: Customer Priorities Emerging from the Energy Literature 29 Figure 10: Customer and Industry/Policy Perspective on Customer Priorities in the Energy Sector 30 Figure 11: From the Energy Trilemma to the Customer Energy Trust Bundle 31 Figure 12: Relative Importance of Subsystems for Trust and Distrust by Workshop Participants 36 Figure 13: A Bicycle Metaphor for Systems 37 Figure 14: Systems Map of Trust in the Energy Sector 39 Figure 15: Places to Intervene in a System 43 Figure 16: Customer Preference for Leverage Point Change to Build Trust 44 Figure 17: Customer Views of the Importance of Having a National Energy Strategy 47 Figure 18: Who Should be Responsible for a National Energy Strategy 47 Figure 19: Five Recommended Program Themes from RACE E1 Opportunity Assessment Roadmap 50 Figure 20: Four Customer Priority Themes in the Literature 72
List of Figures
Glossary
Authenticity
Co-Design Workshop
Competence
A dimension of trust that represents perceptions of reliability, sincerity and honesty of an individual or organisation
A collaborative and participatory session where diverse stakeholders work together to creatively develop and shape projects or solutions that prioritise innovative and user-centred outcomes
A dimension of trust that represents perceptions of how institutions or individuals are knowledgeable, competent or experts in a defined area
Design A category of leverage points that refers to the structure of information flows, rules, power and self-organisation
Distrust
Energy system
Feedback
Distrust is “one party’s level of suspicion and fear about the other party’s conduct and the willingness to close oneself off from the other party.” (Moon & Rhe, 2013, p. 695). There are three dimensions of distrust (Moody et al., 2017):
1. Malevolence (refers to selfishness, pretence, and a dislike to help)
2. Incompetence (relates to lack of knowledge, haphazardness, and low expertise)
3. Deceit (relates to lying, lack of honesty and cheating).
This report adopts a holistic definition of the energy system, including not only generation, transmission, distribution and retail, but also actors such as consumer groups, governments and consumers themselves. The energy system also consists of sub-systems, smaller systems of actors that have rules and information flows within that impact on the broader system.
A category of leverage point that refers to the interactions between elements within a system that drive internal dynamics (e.g. dampening or reinforcing feedback loops) or provide information regarding desired outcomes (e.g. the effectiveness of a given incentive scheme)
pg. 6
Intent
Leverage Points
Openness
Parameters
Responsibility
Systems Map
Trust
A category of leverage point that refers to the norms, values and goals embodied within a system and the underpinning paradigms out of which they arise
Places within a complex system where a small intervention or change can lead to significant and lasting transformation
A dimension of trust that represents how service oriented, approachable, accessible and customer-oriented an individual or organisation is
A category of leverage point that refers to the mechanistic characteristics of a system such as taxes, incentives and standards, or physical elements of a system, such as sizes of stocks or rates of material flows.
A dimension of trust that represents how green, ecologically worthwhile, environmentally responsible and sustainable an individual or organisation is
Visual mental model of the energy systems as a map that is useful for making sense of and depicting system boundaries
Trust is the energy sector is defined as “the confidence that energy organisations, actors and systems will meet positive expectations for a specific task under conditions of unknown outcomes” (Russell-Bennett et al., 2021, p.19). Energy research on trust has identified four key expectations for energy sector actors, which are considered the dimensions of trust for the energy sector (Mezger et al., 2020; Robbins, 2016; Chen, 2010). These are:
1. Competence
2. Responsibility
3. Openness
4. Authenticity
pg. 7
Executive Summary
Purpose and Research Questions
A key determinant of the success of energy transition over the next decade will be the degree of confidence that customers have that this transition will serve and protect their interests. This requires a clear appreciation of both what customers see as their interests in this context, and the extent to which customers trust the energy sector and government to serve these interests. The Australian energy system is at the broadest level inclusive of both electricity and gas. However, in this report the systems map does not map the gas system as this was outside the project scope. Gas is a distinct system of its own that would require additional resources, data collection and analysis, and a distinct system map. This project incorporates a systems-perspective and a consumerled focus to addressing these needs, and answers four research questions:
1. What are customers’ current trust and distrust levels in the energy system?
2. What are customers’ priorities for their energy system?
3. What are the relationships between key actors in the energy system that play a fundamental role in building trust?
4. Where are the leverage points in the energy system that can build trust (and reduce distrust)?
Method
The four research questions were addressed through a mixed-method approach consisting of:
• A desktop review of 47 papers that explore trust, distrust, or customer priorities in the energy sector, in addition to relevant conceptual literature (for example, on trust, distrust, systems thinking)
• Social media analysis of 31,000 Facebook posts from Australian energy companies
• Qualitative workshops: Energy customers (n = 29) and industry experts (n = 14) in four locations (Brisbane, Port Macquarie, Sydney and Perth)
• Two national surveys: energy customers (n = 1,029) and industry experts (n = 15)
• Systems map of the Australian electricity system, drawing data from the desktop review, extant literature on systems thinking and on the Australian energy sector, social media data, workshops and surveys.
Project Contributions
The current project contributes to a priority identified in the RACE E1 Opportunity Assessment Roadmap Report led by QUT and part-funded by the RACE for 2030 Energy CRC. Specifically, it addresses program theme 4, Alignment in the Energy System, by providing a systems map of the Australian electricity system. It also contributes to theme 1, Trust Measurement, by providing an initial indication of trust levels in the energy system. In addition, this project has resulted in four unique contributions aligned with the four research questions:
1. This project is the first to measure trust and distrust in the Australian energy sector for specific actors and across different jurisdictions (RQ1).
2. This project is the first to directly examine the relative importance of customer energy system priorities: providing an ordered list and an updated energy trilemma, the Customer Energy Trust Bundle, for use by policymakers and industry representatives (RQ2).
3. This project is the first to map the energy system inclusive of human actors and going beyond the supply chain (RQ3).
4. This project introduces the concept of leverage points from the systems literature to the energy sector (RQ4).
pg. 8
RQ1: What are customers’ current trust and distrust levels in the energy system?
Methods: Survey, Workshops, Social Media Analysis
Findings
• The survey (n = 1,029) revealed that customers score in the mid-range for both overall trust and overall distrust in the energy system, scoring 3.39 and 3.42 out of 5 respectively. Trust and distrust scores are similar, reflecting that these concepts are not two sides of the same coin.
• The overall trust score is made up of four dimensions (competence, openness, authenticity, responsibility), with competence as the highest scoring (3.67/5) and responsibility as the lowest scoring dimension (3.19/5).
• The overall distrust score is made up of three dimensions (malevolence, incompetence, deceit), with malevolence and deceit both scoring higher at 3.52/5 and incompetence lower at 3.22/5.
• Analysis revealed no significant differences in trust or distrust levels between jurisdictions, NEM v WEM, regional and metropolitan areas nor by remoteness level.
• For customers experiencing vulnerability, being worried about the bill was a significant predictor of higher distrust scores (M=3.72). Income was not a significant predictor, indicating that worry about the bill is a stronger potential predictor of distrust than income levels. Solar PV installation was related to low trust levels.
• Social media analysis examined whether emoji sentiment could potentially be used as a proxy for trust and distrust.
• The dominant emoji used on energy sector posts (49.9 % of sample) was the indicating positive sentiment for retailers, which corresponds with the moderate trust score of 3.98/7 for retailers in the survey. This indicates that social media sentiment analysis is a useful proxy for trust, albeit it may over-represent trust.
• Fewer incidences of negative emojis �� and �� – despite a moderate survey distrust score of 3.42/7 – mean social media emoji sentiment analysis is not a useful proxy for distrust, though levels may be underrepresented.
The survey built on similar findings from the customer workshops and found the top five most trusted actors in the energy sector were:
1. Electricians
2. CSIRO
3. Universities
4. The ACCC
5. Energy Transmission
The five least trusted actors were:
1. Social Media
2. News Media
3. Government – Federal
4. Government – State
5. Energy retailers
Notably, customers have low trust in social media and news compared with higher trust in non-market actors such as electricians, CSIRO, universities and regulators like the ACCC. Customer trust in social media has a weak relationship with almost all actors in the system.
Insights
• Trust and distrust are different concepts and therefore require different strategies to address.
• Perceived energy sector deceit and malevolence are the two distrust dimensions with the most room for improvement in the eyes of customers.
• Functionality is an associated factor for both trust and distrust.
• Trust and distrust levels are consistent across the country regardless of geographic location, climate, regulatory system or social density.
• It appears that installing rooftop solar PV is partly motivated by low trust levels in the energy system, but not by distrust, per se.
• Social media data revealed that customers do not perceive differences between retailers – they trust, or distrust, them equally. This means there is low disparity amongst retailers from a customer perspective.
• The survey data indicates that trust-building efforts are likely to have a positive spillover effect to other actors in the energy system when they are focused on non-market actors of electricians, CSIRO, universities, regulators such as ACCC and AEMO, and energy transmission and generators.
• The trust relationship between government actors is only strong with other government actors, so building trust in government is unlikely to have a spillover effect to other actors.
• Industry views of customer perceptions compared with customer perceptions of energy generation differ. This highlights that what industry ‘see’ due to their inside experiences of working in the sector is starkly different from what customers ‘see’ or know about the supply change. This suggests that customer-led strategies and policies are likely to resonate better with customers in future.
• Both trust and distrust were moderate for retailers suggesting customers trust some aspects of retailer service provision and distrust other aspects.
Recommendations
1.1 Develop a national trust-building program to increase trust and reduce distrust in the energy system.
1.2 Provide guidelines around avoiding perceived malevolent/deceitful strategies and tactics to reduce customer distrust.
1.3 Leverage trusted sources of non-traditional energy actors such as electricians, CSIRO, universities.
1.4 Embed a customer lens in all strategic decisions, as industry insights do not always reflect customer insights and preferences.
pg. 9
RQ2: What are customers’ priorities for their energy system?
Methods: Desktop Review, Survey, Workshops, Social Media Analysis
Findings
• According to the survey (n = 1,029), the top customer priorities for the energy system are:
1. Affordable energy
2. Reliable energy
3. Fast resolutions/clear communications during outages
4. Assistance for customers experiencing vulnerability
5. Clear energy tariffs and plans
6. Green, clean, socially responsible energy
7. A longer-term vision from government
8. Simpler energy plan comparison
9. Single point of contact
10. Contingency plan for unforeseen transition consequences
11. Energy Independence
12. Smaller, more frequent energy bills
• These priorities were narrowed down during the two customer workshops (n = 29) from the 20 original priorities uncovered in the desktop review.
• These findings are mirrored by the social media analysis, which found customers tend to respond most positively to posts about pricing, which aligns with affordability as the most important customer priority identified in the survey.
Insights
• Customer priorities are broader than the industry-based energy trilemma (affordability, sustainability and reliability) and include communication, hardship assistance, clarity in energy plans and a long-term national vision. However, both customers and industry are aligned in placing affordability as the top priority so pricing strategies are important for trust.
• The customer energy trust bundle (CETB) offers an extension to the original energy trilemma, by incorporating key customer priorities.
• Communication is a key element of the CETB, and is very important to establishing and maintaining customer trust. Communication is most important when customers are required to take action (i.e., manage an outage, select an energy plan)
• Service provision impacts the customer experience for both trust and distrust.
Recommendations
2.1 Transform current pricing approaches to increase energy affordability for all households, with particular and added attention to those in hardship or experiencing heightened vulnerability.
2.2 Integrate the Customer Energy Trust Bundle into energy regulatory frameworks and energy communications. This will ensure that customer priorities and elements that build trust inform energy strategies, policies and communications.
2.3 Set a minimum service standard for actors interfacing with customers to ensure the customer experience is positive. This will result in increased customer confidence, favourable reputation, and positive word-ofmouth: all factors associated with trust.
RQ3: What are the relationships between key actors in the energy system that play a fundamental role in building trust?
Methods: Desktop Review, Survey, Workshops
Findings
• This project utilised data from a desktop review, discussions/workshops with industry experts, and customer workshops to identify 63 actors and 38 factors in the Australian energy system that affect trust and distrust. These 63 actors and 38 factors fit 5 subsystems:
• Consumer (the actors and factors that are within the personal sphere of a consumer)
• Energy supply (the organisations that are in the supply chain of the provision of energy and the bill)
• Regulation (regulatory bodies such as AEMO and AER, energy ombudsman and consumer advocates who provide advice to regulators such as ECA)
• Political (local, state and federal government and political parties)
• Information source (media outlets such as news and social media and scientific organisations such as CSIRO and universities).
• Of these five sub-systems, customer workshop participants indicated that the research and education actors of the information source subsystem had the highest trust while the political system had the highest distrust. Visual inspection of the map reveals that some subsystems have clearer interactions with the consumer subsystem than others. Electricians were the most trusted individual actor, potentially due to closeness to the customer and perceived objectivity. Correlations also exist between some sub-systems.
• The consumer subsystem consists of key actors including third parties, residential services such as electricians, family and friends and consumer advocacy organisations, and suppliers of consumer energy goods and services. Workshop data indicates that customers feel that the consumer subsystem is complex and include unfamiliar actors.
• Evidence from the review of energy and systems literature reveals that trust and distrust in the consumer subsystem are associated with trust in all the other subsystems including: regulation (Field, 2013), political (Holum, 2023), energy (Zywiołek, J., Rosak-Szyrocka, J., Khan, & Sharif, 2022) and information source subsystems (Tranter, 2023).
• The emotional sentiment towards retailers is moderately positive with 49% of the emojis used on social media posts about retailers being ♥ . However, this finding should be considered with a caveat: the posts analysed were from retailer-hosted social media pages, which may influence the types of posts, the audience, and thereby the reactions.
pg. 10
•The systems map illustrates the considerable complexity of the electricity sector in Australia, with numerous different actors, processes, and interactions across the system.
•Given the complexity of the system, the numerous actors, and different jurisdictions and areas of responsibility, the systems map highlights that there could be challenges in understanding who in the system does or should have oversight and be responsible for addressing problems with customer trust, or processes and issues that influence trust. Further research could help investigate this and expand our understanding.
•The five subsystems are tight and appear to be somewhat siloed. This suggests that actors within each subsystem may not be aware of other subsystems or how they operate.
•Not all subsystems interact sufficiently with the consumer subsystem. This suggests that a customer-centric approach is not adopted by all.
•The key actors included the expected actors (e.g., customers, actors responsible for energy generation, transmission, distribution and retail, government, regulation, media) as well as some unexpected actors, such as electricians and third-parties like universities and CSIRO.
•The map also demonstrates that regulation of the electricity sector is complex with numerous actors and a range of responsibilities across different areas of jurisdiction within that subsystem. This could potentially lead to a lack of clarity over regulatory responsibility, especially for non-experts, and for problems for customers in understanding who they should approach with issues pertinent to a regulator.
•Generally, customers appreciate simplicity and clear lines of responsibility in the market. From a customer perspective the significant complexity of the electricity system could create challenges for them in navigating aspects of the system, for example, in knowing which actors to engage with for support when experiencing hardship, problems with supply, or issues relating to energy policy.
Recommendations
3.1 Undertake further research to identify how the complexity of the system impacts customers, and the effect on trust and distrust.
3.2 Investigate the utility of introducing an overarching consumer body responsible for providing a single place for customers to access support, information and relief.
3.3 Increase engagement across all key actors in the energy system in building customer trust to ensure diversity of perspectives and inclusion of customerfacing actors.
3.4 Identify how the energy system could be simplified, for example, by unifying certain functions and responsibilities under the auspices of fewer actors –especially those that are more customer-facing.
3.5 Encourage all actors in the energy system to adopt a customer-centric focus to their strategies and approaches to customer engagement.
RQ4: Where are the leverage points in the energy system that can build trust (and reduce distrust)?
Methods: Desktop Review, Survey, Workshops
Findings
•The survey (n = 1,029) indicated that the leverage points where customers most wish to see change in the energy system are (in priority order):
1. Have adequate supply of energy for everyone, including in storage to be used when needed [Parameters - Buffer/Stock]
2. Make sure energy and resources move efficiently in the system to ensure everyone gets what they need [Parameters - Structure/ Flows]
3. Be open to completely new ways of thinking about and changing the energy system [Intent - Transcend Paradigms]
4. Ensure the energy system is able to evolve and adapt to new changes [Design - Evolution]
5. Ensure the right people have access to understandable information to help keep the energy system accountable [Design - Structure of Info Flows]
6. Change our thinking about what is important, valuable or true in the energy system [Intent - Mindset]
7. Consider what the energy system should be achieving for us, and make sure we’re monitoring it [Intent - System Goal]
8. Re-think the rules associated with energy, and make sure they’re serving us [Design - Rules]
9. Re-think who gets to control the energy supply and what methods we have for using more/less energy [Parameters - Parameters]
10. Monitor the energy system, to quickly spot and fix issues [Feedbacks - Negative Feedback Loop]
11. Ensure energy supply and rules governing it are provided in a timely way [Feedbacks - Delays]
12. Make sure no energy system organisation can have “unchecked’ growth [Feedbacks - Positive Feedback Loops]
•These leverage points were sourced from existing evidence on system intervention points, and were coded for in the customer (n=29) and industry (n = 14) workshops and then were written in customer-facing language and quantified in the survey.
pg. 11
Insights
•Parameter level changes were most preferred, which relate to ensuring access to energy which aligns with top customer priorities in the survey (affordability, reliability, fast resolution of outages, assistance for customers experiencing vulnerability). These types of changes involve minor changes to the industry and are unlikely to produce the transformative outcomes needed alone
•Intent and Design level changes, which deal with deep change, were also high priorities, indicating that customers may be seeking innovation in the sector. These types of changes involve significant changes to the design and operation of the industry and are thus likely to produce the most improved outcomes.
•The need for change in the energy system is supported by the survey, where a substantial majority (88.2%) of customers indicated that a longterm national energy strategy was important for Australia, with most (61.9%) indicating that Government should be responsible (either Federal, State or Local) for this strategy.
•Change in the regulatory structure and role of government of the system is evidenced by workshop dissatisfaction and the survey result of 61.9% wanting government to be responsible for the long-term vision.
•“They need to look at the long term. Look what happened to the banks in 2008, they are too short-sighted” (Customer)
•“Bringing everything under federal control helps with over-investment and efficiency” (Industry)
Insights
•With leverage point findings indicating customer desire for redesign of the industry to better meet customer needs, broad oversight and a focus on customer experiences is important.
•The findings indicate that customers are seeking deeper changes to the energy system at the ‘design’ and ‘intent’ levels of the system.
• Customers believe Australia needs a longer-term vision and that this should be led by government, who they believe should take a more significant role in the sector.
• Customers and industry indicated in the workshops that they were not satisfied with the current role of regulation and government. Some customers wanted government to ‘buy back’ privatised assets. However, the lack of difference in trust and distrust between the NEM and WEM indicates that the regulatory structure of the WEM may not be a useful model for the NEM for building trust.
Recommendations
4.1 Create a consumer-facing organisation that is a one-stop shop offering oversight and advocacy and relief support to build trust and improve customer experiences.
4.2 Co-design a long-term national vision for the energy system, with this process led by Government and the resulting vision implemented/owned by government.
4.3 Explore alternative regulatory models and structures, and identify the role governments should adopt in the system that will build trust.
pg. 12
Background and Overview
The transition to clean energy is a critical policy objective for Australia (Australian Government, 2022). Domestic energy consumption and promoting energy efficiency among household customers is an important pillar of this policy imperative. However, research suggests that trust in the Australian energy market has eroded in recent years (Savage, 2022), with the risk that customers will disengage, or be left behind in the transition to clean energy (Finkel, 2017; Australian Energy Regulator, 2022). For Australian household customers, energy is a basic human need that enables cooking, heating and cooling, care, leisure, and various other everyday and productive activities that are essential for human health and well-being (Gordon et al., 2022). Using energy for these activities helps ensure that people can stay warm or cool, be fed, remain hydrated, and can maintain their health and wellbeing. As such, energy consumption is important for preventing ill-health and mortality, managing physical illness or disease, supporting positive mental health, allowing comfort, and sustaining social relations (Maller and Strengers, 2011; Smolander, 2002).
A key determinant of the success of energy transition over the next decade will be the degree of confidence that customers have that this transition will serve and protect their interests. This requires a clear appreciation of both what customers see as their interests in this context, and the extent to which customers trust the energy sector and government to serve these interests. This project takes a systems-informed and customer-led perspective to addressing these needs, via the following questions:
1. What are customers’ current trust and distrust levels in the energy system?
2. What are customers’ priorities for their energy system?
3. What are the relationships between key actors in the energy system that play a fundamental role in building trust?
4. Where are the leverage points in the energy system that can build trust (and reduce distrust)?
Method
This project employs five complementary methods to address the four research questions. A (1) desktop review, (2) social media analysis, (3) qualitative workshops, (4) online surveys, and (5) systems mapping (which draws from all previous phases) (see Figure 1). The method for each phase is provided in Table 1. In each section of the findings, the limitations of the method are outlined. Full details of the Method are available in Appendix A– Method.
pg. 13
Desktop Research (RQ 2,3,4) Systems Map (RQ 1,3,4) Social Media Analysis (RQ 1,2) Consultative Workshops (RQ 1,2,3,4) Survey (RQ 1,2,3,4)
Figure 1: Overview of Method
Method
Desktop Review
Table
RQ2 – Customer priorities
RQ3 – Actor relationships
RQ4 – Leverage points
Social media analysis
Qualitative workshops
RQ1 – Trust levels
RQ2 – Customer priorities
RQ1 – Trust levels
RQ2 – Customer priorities
RQ3 – Actor relationships
RQ4 – Leverage points
Online surveys
RQ1 – Trust levels
RQ2 – Customer priorities
RQ3 – Actor relationships
RQ4 – Leverage points
Systems mapping RQ1 – Trust levels
RQ3 – Actor relationships
RQ4 – Leverage points
Sample Characteristics
• Identify definitions of trust and distrust
• Identify customer priorities in evidence-base
• Identify key actors and factors that influence trust in the energy system
• Identify non-surveyed relationships between actors in systems map
• Identify emojis used by customers as potential proxies for trust and distrust
• Gauge customer reactions to retailer social media posts
• Identify frequency of key factors/priorities mentioned in posts
• Confirm and extend customer priorities beyond the literature
• Refine and reduce number of actors and factors for use in survey
• Classify actors into energy sub-systems
• Ideate suggestions for change in the energy system to build trust (leverage points)
•Identify current trust and distrust levels in Australia and by geographic location
•Identify most important customer priorities
•Rank order customer priorities
•Compare perceptions of customer priorities with industry perceptions of customer priorities
•Measure relationships between key actors and overall trust
•Rank order leverage points for building trust in the energy system
•Identify the placement of different actors and factors in the system
•Confirm relationships between the actors and factors
•Establish trust levels for sub-systems where available
•Indicate positions of leverage points.
Sample
47 papers of which some were journal articles or industry papers
31,084 publicly-available posts on 30 retailer Facebook pages between 2/1/2004 and 14/11/2022.
29 customers in Brisbane, Port Macquarie and Perth 14 industry experts in Sydney and Perth
Online survey of energy customers (n = 1,029) and industry experts (n = 15)
Desktop review, Workshop and survey data
•The desktop review data consisted of articles from applied energy and environmental sciences; topics included: energy, actors, trust, distrust, and customer priorities.
•The social media sample consisted of 31,084 posts with an average of 52.67 words. The average emoji per post was 2.14 (Love), .81 (Wow), .50 (Haha), .26 (Sad), .33 (Angry), .28 (Care).
•The customer workshops consisted of 68% female respondents, with half of the sample aged under age 55, 50% having household income of < $100,000 p.a, 45% renting and 31% with solar.
•Industry workshops consisted of 57% male and 43% female experts with > 10 years experience in the role. Roles varied from regulatory affairs, to research and customer insights.
•Customer survey sample consisted of 50.2% male and 49.4% female respondents, with most aged 55 or under, 55% having household income <$100,000 p.a, residing across all States/Territories (nationally representative).
•Industry survey sample consisted of 60% male and 13.3% female experts (26.7% did not disclose gender) with representation from NSW, VIC, QLD, SA and WA. Roles included retail, distribution, policy, social service, advocacy, technology and academia.
Data Analysis Techniques
•The desktop review data were analysed using manual thematic analysis (Nowell et al., 2017).
•Social media data were analysed using SPSS and Excel
•Workshop data were analysed using thematic analysis (Fereday & Muir-Cochrane, 2006).
•Survey data were analysed using correlation analysis, t-tests, one-way analysis of variance (ANOVA) and exploratory factor analysis (EFA).
pg. 14
Research question Aim
1: Method Alignment with the Research Questions
Benchmarking Customer Trust in the Energy System (RQ1)
This section answers RQ1: What are customers’ current trust and distrust levels in the energy system? Customer trust and distrust in actors across the energy system were measured during customer and industry workshops as well as on a larger scale via a national survey. This section first outlines the scores for trust and distrust in the energy sector for customers and industry (what industry thinks customers think), then compares the trust and distrust scores across geographic regions. Social media analysis of emojis on posts from retailers and relevant partners is then presented as potential proxies for trust and distrust. The remainder of this section investigates the level of trust in 14 key actors identified in the workshops as important influencers of trust and distrust in the energy system (details of the actors in the energy sector are fully discussed in the section on research question three) and the key factors associated with trust and distrust.
This project is the first to measure trust and distrust in the Australian energy sector for specific actors and across different jurisdictions.
What are Trust Levels in the Energy Sector?
Trust in the energy sector is defined as “the confidence that energy organisations, actors and systems will meet positive expectations for a specific task under conditions of unknown outcomes” (Russell-Bennett et al., 2021, p. 19). Energy research on trust has identified four key expectations for energy sector actors, which are considered the dimensions of trust for the energy sector (Mezger et al., 2020; Robbins, 2016; Chen, 2010). These are:
The results for each of these dimensions in the current survey data are provided in Figure 2.
Figure 2: Customer Trust and Industry Perception of Customer Trust in The Energy System
Notes: These dimensions were measured on a 1-5 scale (low to high).
pg. 15
1.Competence 2.Responsibility 3.Openness 4.Authenticy Customer 5.00 4.50 4.00 Competence 3.67 3.51 Openness 3.44 2.50 Authenticity 3.32 3.02 Responsibility 3.19 2.47 3.50 3.00 2.50 2.00 1.50 1.00 Industry
What are Distrust Levels in the Energy Sector?
Distrust is “one party’s level of suspicion and fear about the other party’s conduct and the willingness to close oneself off from the other party” (Moon & Rhee, 2013 , p. 695). There are three dimensions of distrust (Moody et al., 2017):
1. Malevolence (refers to selfishness, pretence, and a disinclination to help)
2. Incompetence (relates to lack of knowledge, haphazardness, and low expertise)
3. Deceit (relates to lying, lack of honesty and cheating)
The dimension of incompetence is similar to the competence dimension in trust. However, the inclusion of malevolence and deceit indicate selfishness or ill-intent, highlighting that distrust is a different concept from trust.
While trust has been described as being “cool and collected”, distrust is seen as “fiery and frenzied” (Lewicki et al., 1998) reflecting a cognitive organised versus emotional impulsive nature. Neuroimaging studies (Dimoka, 2010) have supported these descriptions and shown that trust and distrust occur in distinct locations in the brain (see Figure 3).


Nucleus


Neuroscience has identified that distrust is a more emotional process than trust, which has implications for how information is processed and remembered and therefore what strategies are needed under these distinct conditions (Posten et al., 2017; Mayo, 2015; Mayer & Mussweiler, 2011). Trust and distrust are therefore not opposite ends of the same concept, rather they are two related yet distinct concepts. This also means that building trust is not the same as reducing distrust nor are the drivers or strategies to address each the same (Six & Latusek, 2023; Moody et al., 2017; Lewicki et al., 1998). There is very little research in the energy sector on distrust and its dimensions. Thus, the survey items used to measure distrust are drawn from the psychology and management literature (Moody et al., 2017).
The survey data revealed that the highest scores for distrust were for malevolence and deceit, with incompetence scoring lower. The highest scoring distrust dimensions from the industry perspective were also malevolence and deceit, potentially indicating some alignment between industry and customer perspectives on the relevance of these two dimensions for managing distrust levels (See Figure 4).
Industry workshop participants also identified some specific examples leading to distrust, such as data breaches and misinformation:
“Data breaches lead to massive distrust” – Sydney Industry
“Misinformation causes distrust which causes customers to put up walls and not be receptive to engagement ” – Sydney Industry
pg. 16
Figure 3: Trust and Distrust as Two Distinct Neural Locations
Figure 4: Customer Distrust and Industry Perception of Customer Distrust in the Energy System
Amygdala
Trust Caudate
Trust Anterior ParaCingulate Trust Putamen Distrust
Distrust Insular Cortex
Does Trust and Distrust in the Energy Sector Differ Across Jurisdictions?
The customer survey results were analysed using ANOVA to test for significant differences between States/Territories, NEM v WEM, regional and metropolitan areas and by remoteness level (ABS, 2021). In this sample, there were no significant differences in any of these tests (see Figure 5). Correlation analysis between overall trust and overall distrust was significant and negative (-0.303**, p<0.01; see Appendix C – Correlation between Trust and Distrust).
Figure 5: Customer Trust and Distrust Scores Across Jurisdictions


The lack of difference in trust and distrust scores based on geography was surprising, particularly given comments in the workshop such as “It is so simple working on energy policy in WA in comparison to the NEM. In WA you know who makes decisions, but in the NEM no one knows what’s going on and how decisions are made” (Industry participant). However, this may highlight differences between frontstage experiences (customer perspective) and backstage experiences (industry perspectives ) and raises a warning for industry or policy programs and strategy that does is based on assumptions about what customers want rather than data about what customers want.
pg. 17
NT Trust: 3.27 Distrust: 3.29 QLD Trust: 3.39 Distrust: 3.46 NSW Trust: 3.39 Distrust: 3.45 VIC Trust: 3.37 Distrust: 3.39 TAS Trust: 3.42 Distrust: 3.29 NEM Trust: 3.39 Distrust: 3.43 ACT Trust: 3.27 Distrust: 3.25 SA Trust: 3.39 Distrust: 3.54 WEM (WA) Trust: 3.41 Distrust: 3.31 and metropolitan areas or remoteness level. Trust and distrust were measured on a 1-5 scale (low to high). 3.39 3.42 National trust score National distrust score
What Factors Influence Trust and Distrust?

pg. 18
Participants in the online survey were asked to select which items led to trust and distrust in order of importance. While there may be some relationship between priorities for the energy sector and factors leading to trust and distrust, they are not the same. Priorities can be thought of as goals/needs that are important for customers in the energy sector in general, while the factors that relate specifically to trust and distrust in the energy sector and may represent ways in which priorities are met. The survey collected data on those items and participants ranked them first, second, and third. The percentage of people who selected each option as their primary/most important factor was measured, leading to a customer ranking of the factors associated with trust and distrust (see Table 2).
When considering the top three for trust, the importance of beneficent values and customer empowerment and expectations is clear, followed by reliability of supply. For distrust, factors focus more on pricing and malevolent/deceitful tactics. Hence, shared values and respect are key for trust, while for distrust, key factors focus on avoiding perceived deceit and malevolence tied to pricing strategies. A similarity is that for both trust and distrust, it is important to have the customers' best interests at heart (and to make this clear to customers through actions and meeting expectations).
Table 2: Customer Ranking of Factors Associated with Trust and Distrust in the Survey
Rank order of factors
(A rank of 1 = the option selected by the highest percentage of participants. % indicates percentage of sample that selected each option as their primary factor)

1.Values
(e.g., organisations that have values like
2.Psychological


4.

5.Reputation


Note: Three distrust factors were split into subfactors; functionality, reputation and organisational practices resulting in four additional distrust factors (an increase from 8 to 12). Some factors, such as Reputation – Collaboration, were not applicable for customers and hence were excluded from the survey.
pg. 19
social responsibility, sustainability and mutual respect) 18.80%
(e.g., I feel like I have high knowledge, a sense of empowerment, and my expectations met/exceeded) 17.70%
Reliability (e.g., Reliability of supply) 17.10%
3.Functionality
Functionality - Pricing (e.g., Organisations with cheap price/costs, 12.10%
(e.g., The organisation is sustainable, Reliable, 12.10% 6.Communication (e.g., The organisation has consistent messaging, Clear information, Consumer- friendly language, Relationship focused, Two-way communication) 10.80% 7. Customer experience (e.g., Positive and pleasant customer interac- 4.40% 8.Control (e.g., The organisation shares control with consumers, Trusting the customer to do the right thing) 3.60% 9.Support (e.g., The organisation has support for Hardship customers, and those in Crisis/emergency) 3.50% 1. Functionality - Pricing (e.g., Confusing and misleading pricing, high pricing and bill shock, lack of transparency of pricing, 24.30% 2.Reputation - Greed (e.g., Greedy) 11.40% 3. Organisational practicesMisleading (e.g , Questionable tactics, discounting and incentives, perceived dishonest behaviour) 10.20% 4. Functionality - Reliability (e.g., Unreliable supply & service interruptions) 8.70% 5.Reputation - Sustainability (e.g , Poor environmental record) 8.60% 6. Functionality - Ethics (e.g., Wrongful energy disconnection, signups without consent) 7.80% 7. Customer experience (e.g., Poor customer experience) 7.50%
practicesEmpathy (e.g , Lack of empathy for hardship consumers) 6.60% 9.Word of mouth (e.g., Negative media coverage) 3.90% 10.Psychological (e.g., Lack of awareness, high perceived risk, 4.20% 11.Behavioural (e.g., Lack of familiarity of the organisation) 3.70% 12.Power and choice (e.g., Lack of competition) 3.20%
8.Organisational
What do Facebook Emoji Reactions Say About Factors Influencing Trust and Distrust?
In addition to data from the desktop review, workshops and survey, we analysed social media data of emoji reactions on Facebook as an objective measure of reactions of customers to energy retailer posts on the 9 factors associated with trust that were in the Opportunity Assessment (Russell-Bennett et al., 2021). A bar chart displaying the percentage of posts containing related topics is provided in Figure 6.
Figure 6: Frequency of Social Media Post Themes
The frequency of occurrence of the topics ranged from functionality as the most mentioned to control as the least mentioned. The topics, in order of their frequency, are listed to the right:
There is some misalignment between what is being posted on social media, and what customers have identified as their true priorities for the energy sector. These results will be further discussed under research question two, where the social media analysis is compared with customer priorities.

pg. 20
Does Trust and Distrust in the Energy Sector Differ for Customers Experiencing Vulnerability?
Multiple indicators for energy vulnerability were used including psychological, behavioural and demographic. The indicators that differentiated between high and low trust were SEIFA (based on postcode), income, solar PV, education and worry about the bill. Notably, those from an advantaged area had lower trust scores, as did those with solar PV or postgraduate education. Those who were worried about their bill had significantly higher distrust scores. Being on a hardship plan did not affect trust or distrust (see Table 3). For full analysis see Appendix D –Trust and Distrust Scores by Vulnerability.
Table 3: Trust and Distrust for Different Vulnerability Indicators
for low income = $710p.w. (ABS, 2022).
Notes: Trust and distrust are measured on 1-5 scale (low to high); n.s = non-significant

pg. 21
Vulnerability
Trust mean /5 Distrust mean
SEIFA (socio-economic indexes for areas) Very disadvantaged area Very advantaged area 3.51 3.30 p =0.03** 3.41 3.42 n.s. Income Threshold
Low income threshold Above threshold income 3.42 3.38 n.s. 3.41 3.42 n.s. Solar PV Does not have solar Has solar 3.48 3.35 p =0.004** 3.41 3.41 n.s. Education Up to year 12 Postgrad 3.40 3.30 p=0.046* 3.42 3.45 n.s Hardship plan Yes No 3.46 3.37 n.s. 3.48 3.41 n.s Worried about the energy bill Worried Not Worried 3.43 3.38 n.s. 3.72 3.14 p=0.001**
indicator Detail
/5
How do Customers Feel about Retailers?
Emojis have been identified as a potentially useful proxy for trust (Maiberger et al., 2023; Toure-Tillery & McGill, 2015) and thus an analysis of emojis used in the 31,084 Facebook social media post by customers about 28 retailers was conducted (see Figure 7). A full list of retailers included in the analysis is provided in Appendix A– Method.
Social media findings
•The dominant emoji used (49.9 % of sample) was the indicating positive sentiment towards retailers. This corresponds with the moderate trust score of 3.98/7 in the survey sample for retailers. This indicates that social media sentiment analysis may be a useful proxy for trust, albeit offering an inflated representation of trust in the current sample.
•The negative emojis of �� and�� indicate negative sentiment towards retailers. There were fewer incidences of use of these negative emojis compared with the positive emojis which does not correspond with the moderate distrust score of 3.42/5 in the survey sample. This means that social media sentiment analysis of these emojis is not a useful proxy for distrust, tending to under-represent trust in the current sample.
• Both the wow emoji�� and haha emoji�� can be either positive or negative and thus cannot be used as proxies without further analysis.
•The remaining emoji of reflects empathy or support for the poster rather than directed at the retailer.
•Notably, we did not find major differences in the mean usage of emoji between retailers, potentially indicating that customers do not see meaningful differences between retailer trustworthiness or distrust.

pg. 22
Percentage of emoji per post 50% 40% 30% 20% 10% 0%
Figure 7: Average Percentage of Emojis on Energy Actors Facebook Posts
Which Actors in the Energy Sector are the Most Trusted and Distrusted?
Participants in the customer workshops were given a list containing actors from across the energy system and were asked to indicate which of these actors they trusted and which ones they distrusted. The workshop identified the most trusted (CSIRO, Universities, Ombudsman, Farmers, Other Consumers) and distrusted actors (Political parties, Media, Extreme Media, Social Media, Federal and State Government, Energy Retailers) in the system. Further detail is available in Appendix B – Workshop Participants Trust and Distrust in Energy Actors.
The survey results revealed similar findings to the qualitative customer workshops (see Figure 8) with customer perceptions of trust represented by green bars and industry perceptions of who they think customers trust represented by blue bars. The survey did not include questions about distrust of specific actors to keep the survey at a reasonable length and reduce respondent fatigue. Given the small sample size for the industry sample, difference tests between customer and industry views cannot be conducted.
For comparison purposes, the survey included the family doctor as an actor known to be the most trusted and the banking industry as least trusted (Johnson, 2019) (light green and light blue) and trust in the sector as a whole (light green/blue). The survey included the additional actor of electricians, as they were identified in the workshops and by the industry reference group. In addition, AEMO was added. Others were not included as actors as they were deemed less important by customers in the workshop. This resulted in 14 actors being included in the survey. The relationship of trust in each actor to overall trust in the energy sector along with the trust relationship between actors was measured (see Table 4).

Note: the small industry sample size prevents meaningful interpretation of the industry results above and prevents significance testing. Scale 1 = low trust 7 = high trust.
pg. 23
Figure 8: Trust in Energy Actors (Survey)

These dimensions were measured on a 1-7 scale (low to high)
pg. 24 T
for Different Energy Actors
able 4: Correlations of Customer Trust
Key Findings: Trust and Distrust in the Energy System
•Overall trust in the energy sector was rated at 3.39/5 which is moderate. This is consistent with the Edelman Trust Index which found the energy sector scores 61/100, a similarly moderate score.
• Industry survey scores for trust (mean 2.83/5) were inconsistent with customer trust in the energy sector (mean of 3.39) indicating that industry underestimates the amount of trust customers have in the sector. For the dimensions of trust, there was closer alignment for competence and authenticity scores. However, there was misalignment for openness (customer mean 3.44, industry mean 2.50) and responsibility (customer mean 3.19, industry 2.47).
•Overall distrust in the energy sector was rated at 3.42/5 which is moderate and similar, though not significantly different to, the trust score of 3.39/5.
•Customers were more likely to have lower trust in the sector if they live in a disadvantaged area or have education of year 12 or less Customers were more likely to have higher distrust in the sector if they are worried about their energy bill.
• Confidence in the data was confirmed by measuring the most trusted industry actor of family doctor (Johnson, 2019) which was also the highest scoring trust actor/industry in the sample. The least trusted industry of banking (Edelman, 2023) scored low in the sample. However, this was not as low as news and social media.
•The survey data shows that trust and distrust are not opposites of a ‘trust’ spectrum, rather, they are different concepts.
•The survey data shows the most trusted actors are electricians, CSIRO, universities and the ACCC while the least trusted are social and news media. This is broadly consistent with the workshop data.
• Trust in retailers is moderate (3.98/7) and is similar to trust in all three levels of government but lower than trust in the energy generators/ transmitters/distributors, AEMO, ACCC, CSIRO, universities and electricians.
• The trust relationships between all 14 actors are positive. However, the relationship strength between them varies. The relationship between energy transmitters, generators, distributors and retailers is moderate to strong (ranging from 0.645 – 0.647). This indicates that if a customer has trust in one of these actors, they are likely to have trust in the other actors too.
• The relationship between media (news and social) and almost every actor is weak (0.175 –0.424) with the exception of retailers (0.463) and government (ranging from 0.402 – 0.433). Weak correlations indicate that customers see little relation between media and other actors, with the exception of retailers and government.
• Media has the lowest trust scores of all the actors (social media – 3.35/7 and news media 3.54/7). This lack of trust is illustrated in the following workshop quote: “I don’t like watching the news anymore. It has become too biased, and they keep putting that it is breaking news, when it is not, just to get our attention” –Brisbane Customer
• Notably, electricians had one of the highest trust scores (4.79/7) which could be due to high credibility and competence due to their energy expertise and perceived independence. The next most trusted actors are CSIRO (4.71/7) and universities (4.68/7).
pg. 25
Key Findings for Benchmarking trust and distrust in the energy system
• The survey (n = 1,029) revealed that customers score in the mid-range for both overall trust and overall distrust in the energy system, scoring 3.39 and 3.42 out of 5 respectively. Trust and distrust scores are similar, reflecting that these concepts are not two sides of the same coin.
• The overall trust score is made up of four dimensions (competence, openness, authenticity, responsibility), with competence as the highest scoring (3.67/5) and responsibility as the lowest scoring dimension (3.19/5).
• The overall distrust score is made up of three dimensions (malevolence, incompetence, deceit), with malevolence and deceit both scoring higher at 3.52/5 and incompetence lower at 3.22/5.
• Analysis revealed no significant differences in trust or distrust levels between jurisdictions, NEM v WEM, regional and metropolitan areas nor by remoteness level.
• • For customers experiencing vulnerability, being worried about the bill was a significant predictor of higher distrust scores (M=3.72). Income was not a significant predictor, indicating that worry about the bill is a stronger potential predictor of distrust than income levels. Solar PV installation was related to low trust levels.
• Social media analysis examined whether emoji sentiment could potentially be used as a proxy for trust and distrust.
• The dominant emoji used on energy sector posts (49.9 % of sample) was the indicating positive sentiment for retailers, which corresponds with the moderate trust score of 3.98/7 for retailers in the survey. This indicates that social media sentiment analysis is a useful proxy for trust, albeit it may overrepresent trust.
• Fewer incidences of negative emojis �� and �� – despite a moderate survey distrust score of 3.42/7 – mean social media emoji sentiment analysis is not a useful proxy for distrust, as levels may be underrepresented.
The survey built on similar findings from the customer workshops and found the top five most trusted actors in the energy sector were:
1. Electricians
2. CSIRO
3. Universities
4. The ACCC
5. Energy Transmission
The five least trusted actors were:
1. Social Media
2. News Media
3. Government – Federal
4. Government – State
5. Energy retailers
Notably, customers have low trust in social media and news compared with higher trust in non-market actors such as electricians, CSIRO, universities and regulators like the ACCC. Customer trust in social media has a weak relationship with almost all actors in the system.
pg. 26
Limitations and Further research
•Survey participants picked their top three in order of preference for factors associated with trust and factors associated with distrust. A longer survey could have measured the level of trust and distrust for each factor albeit at the risk of increased participant lethargy making responses less likely to be accurate.
•We deliberately measured general-level entities in the scope of the current study. However, energy information on social media may perhaps be more trusted in areas where specific objects are focused on, for instance Reddit subreddits, Facebook groups, or Whirlpool discussion forums. Future research may choose to examine these areas.
•Importantly, one limitation of cross-sectional survey research is that causality cannot be determined. Future research should use longitudinal methods to determine causal relationships between trust, distrust, and relevant factors and priorities.
• A limitation for several elements of this research is the low sample size for industry participants. This meant that making meaningful comparisons between customer and industry data was difficult. Future research should focus on ways to enhance engagement more broadly across industry actors in the energy sector.
• It is recognised that the posts available to be analysed for the social media analysis were those originating from energy sector actors like retailers, meaning that posts are not organic/unsolicited customer posts and the sample is skewed to those customers most likely to follow energy sector actors (i.e., these customers may be more engaged, and have higher trust and lower distrust levels compared with others, particularly for those who use emoji reactions or comments). Future research may consider examining unsolicited customer responses outside of posts/pages originating from energy sector retailers.
Insights – Benchmarking trust and distrust in the energy sector
• Trust and distrust are different concepts and therefore require different strategies to address.
• Perceived energy sector deceit and malevolence are the two distrust dimensions with the most room for improvement in the eyes of customers.
• Functionality is an associated factor for both trust and distrust.
• Trust and distrust levels are consistent across the country regardless of geographic location, climate, regulatory system or social density.
• It appears that installing rooftop solar PV is partly motivated by low trust levels in the energy system, but not by distrust, per se
• Social media data revealed that customers do not perceive differences between retailers o they trust, or distrust, them equally. This means there is low disparity amongst retailers from a customer perspective.
• The survey data indicates that trust-building efforts are likely to have a positive spillover effect to other actors in the energy system when they are focused on non-market actors of electricians, CSIRO, universities, regulators such as ACCC and AEMO, and energy transmission and generators.
• The trust relationship between government actors is only strong with other government actors, so building trust in government is unlikely to have a spillover effect to other actors.
• Industry views of customer perceptions compared with customer perceptions of energy generation differ. This highlights that what industry ‘see’ due to their inside experiences of working in the sector is starkly different from what customers ‘see’ or know about the supply change. This suggests that customer-led strategies and policies are likely to resonate better with customers in future.
• Both trust and distrust were moderate for retailers suggesting customers trust some aspects of retailer service provision and distrust other aspects.
pg. 27
Recommendations
for Building Trust and reducing distrust levels in the Energy System
1.1 Develop a national trust-building program to increase trust and reduce distrust in the energy system.
1.2 Provide guidelines around avoiding perceived malevolent/deceitful strategies and tactics to reduce customer distrust.
1.3 Leverage trusted sources of non-traditional energy actors such as electricians, CSIRO, universities.
1.4 Embed a customer lens in all strategic decisions, as industry insights do not always reflect customer insights and preferences.

Understanding Customer Priorities for the Energy System (RQ2)
This section answers RQ2: What are customers’ priorities for their energy system? Customer priorities were drawn from existing knowledge via a desktop review that uncovered twenty key priorities, which were then narrowed down to eleven via customer workshops, with these priorities quantified and ranked in the national survey. This section first outlines the customer priorities established from the literature, before discussing the final ranked customer priorities for the energy system emerging from the survey with support from the workshops. The remainder of this section discusses the alignment between customer identified priorities and the priorities identified by industry in the survey.
This project is the first to directly examine the relative importance of customer energy system priorities: providing a ranked list and an updated energy trilemma (the Customer Energy Trust Bundle) for use by policymakers and industry representatives.
What Themes Emerge in the Literature on Customer Priorities for the Energy System?
Customer priorities were identified from both academic journal articles as well as industry and government reports. The following sections provide an overview of the identified trends. An overview of 20 priorities identified in the academic and industry literature is shown in Figure 9. For full details of each theme refer to Appendix E – Themes Emerging from the Literature on Energy Priorities.

•Light Blue: Affordability and Support
• Dark Blue: The Basics vs Value Alignment
• Olive Green: Transparent Communication
• Green: Clearer Roles for Government and Industry
pg. 29
Figure 9: Customer Priorities Emerging from the Energy Literature
How do Customers Rank Priorities for the Energy System?
The 20 priorities identified in the desktop review were expanded to 25 by separating some of the priorities, and the workshops refined these to 14 that were relevant (see Appendix F – Customer Ranking of Energy Priorities, and Appendix G – Industry Ranking of Energy Priorities). Survey participants were asked to identify which of the 14 customer priorities were most important to them and industry/policy participants were asked what they thought customers wanted (see Figure 10).

Note: the small industry sample size prevents meaningful interpretation of the industry results above and prevents significance testing.
Customer priority findings
•There is common agreement amongst customers for the top three priorities with more than 80% agreement for affordable energy (93%), reliable energy (83%), and fast resolutions/clear communication during outages (80%).
•Communication is of importance for customers – for instance, valuing clear communication during outages (80%), clear energy tariffs and plans (78%) and having a single-point of contact (65%).
•There is alignment between customers and industry views on the first priority (affordable energy). However, there is wide disparity between the proportion of customer and industry responses, i.e., 83% of customer think that reliable energy is important while 67% of industry think that customers think it is important.
•Misalignment exists between customer and industry views on non-price related priorities. Customers prioritise reliability, outage management and vulnerability assistance whereas industry believe that customers prioritise clean/green energy and energy efficiency incentives.
• Customers see affordable energy as much more important than any other priority, while industry expected that two other priorities (clean/green/socially responsible energy and home energy efficiency incentives) would be as equally important to customers as affordability.
pg. 30
Figure 10: Customer and Industry/Policy Perspective on Customer Priorities in the Energy Sector
From an Industry Energy Trilemma to a Customer Energy Trust Bundle
Looking closer at the customer priority data, the energy trilemma (affordability, sustainability and security/reliability) (Heffron, McCauley, and Sovacool, 2015) is present in the top customer priorities. However, the energy trilemma represents an industrycentric perspective on the priorities in the energy sector and does not represent the only – nor always the most important –priorities for customers.
•An alternative view is a customer-centric view which we have termed the Customer Energy Trust Bundle (CETB) consisting of the top seven customer priorities (see Figure 11). These seven priorities are defined as those selected as important by 70% or more participants.
•The four additional customer priorities added to the three industry trilemma priorities are representative of four central concepts: communications, assistance, clarity and vision. All of these concepts were present in the themes identified from the literature.
•We use the metaphor of a flower (customer experience of energy) with seven petals (customer priorities) growing within a garden (energy system). The ‘petals’ demonstrate the relative importance of different priorities with the numbers offering a ranking, with affordability being the most important.


pg. 31
Figure 11: From the Energy Trilemma to the Customer Energy Trust Bundle
How do the trust/distrust factors from the social media analysis compare with customer priorities?
A social media analysis was presented as part of the results for research question one, showing how customers responded (via emoji) to social media posts about the nine trust elements (psychological, values, functionality, customer experience, communication, reputation, control, support, reputation-collaboration). While the frequency scores of functionality, reputation and outages are consistent with the survey results for customer priorities (see Figure 10), the scores of sustainability and vulnerability support are not consistent with the customer priorities and highlights a key difference between what customers talk about on social media and what is actually important to them. The love emoji is the most used across all nine factors with the sad emoji the least used, potentially reflecting the type of content posted on retailer pages (see Appendix H - Emoji Reactions on Energy Organisations Facebook Posts for each of the 9 Factors).
Social Media Analysis Findings
• The topics from most to least use of positive emojis are: Price (53%), Sustainability (49%), Function (49%), Reputation (49%), Control (47%), Customer Experience (45%), Support (42%), Communication (42%), and Outage (42%). This has some overlap with the top ranked customer priorities from the survey, with price aligning with the affordability priority (1st), sustainability with green/clean/socially responsible energy (4th), and function aligning with reliability (2nd). However, the priority for ‘fast resolutions and clear communication during outages’ comes 3rd in the survey but received the lowest percentage of positive emojis here, alongside communication and support. Where priorities are ranked higher but receive fewer positive emojis, one interpretation is that these are areas of opportunity for building customer trust.
• The topics from most to least use of negative emojis are: Control (24%), Communication (18%), Price (15%), Reputation (14%), Function (14%), Outage (13%), Customer Experience (11%) and Support (10%). These emojis also have some alignment with customer priorities, with control having the most negative emojis and therefore the most potential for improvement. Control aligns not with a single priority, but with reliability (2nd), fast resolutions (3rd) and elements of the four components of trust (competence, responsibility).
• Price social media posts: there are more �� and �� emojis than posts on other topics. These emojis indicate anger or sarcasm about discussions of energy prices. This makes sense given that the top customer priority identified in the survey was affordability, and the negative emojis mean there is room to improve not only affordability but also communication with customers around pricing.
• Sustainability social media posts: there is no difference in emoji use in social media posts for sustainability compared with posts without sustainability. Sustainability was the 6th priority for customers (clean/green/socially responsible energy) in the survey, which may show that this is not a key concern for customers at the moment – given the current cost of living crisis, affordability remains a higher priority.
• Functionality social media posts: These posts include keywords like reliability, supply and disconnection, and see �� and �� increase to compared with posts that are not about functionality. The use of these emojis indicate a sense of angered surprise or disappointment regarding functionality. This best aligns with the reliability priority in the survey, which was ranked second most important by customers. This indicates that enhanced reliability as well as offering clear communications around functionality is an area where trust can be built.
• Reputation social media posts: there is no difference in emoji use about reputation compared with posts without reputation. While reputation was not explicitly linked to any one priority, it is indirectly measured in the four components of trust (competence, openness, authenticity, responsibility). Customer scores are just above the mid-point for these four dimensions.
• Control social media posts: there are fewer �� emojis about control compared with posts on other topics. Control does not align with any one priority, but with reliability (2nd), fast resolutions (3rd) and elements of the four components of trust (competence, responsibility). The priorities related to control were ranked as important, but the relevant trust scores were 3.67 and 3.19 out of five. This indicates that control is another area for trust growth.
• Customer experience social media posts: there are more and �� emojis about the customer experience than posts on other topics. This suggests those reacting were not aware of specific customer experience initiatives in the post. Customer experience was not a specific priority measured, but rather is created through achievement of all important customer priorities. More posts about customer experience initiatives offer a chance for actors to highlight how they are meeting customer priorities.
pg. 32
• Support social media posts: there are more �� emojis about support compared with posts on other topics. This may be because customers wish they had more support or they could be expressing empathy for those who need support. In particular, assistance for customers experiencing vulnerability was an important priority for customers in the survey as it was ranked fourth.
• Communication social media posts: there are more �� emojis about communication compared with posts on other topics. This is a similar response to customer experience topics potentially indicating that customers are either impressed or unaware of the communication. The survey indicated that communication was prioritized for customers during outages (3rd) as well as through clear energy tariffs/plans (5th), simpler ways to compare plans (9th) and offering a single point of contact (10th). This indicates that while communication is always a strong priority for customers, this is especially true when immediate action is needed (e.g., outages, selecting plans).
• Outages social media posts: there are more �� and �� emojis about outages than posts on other topics. This means customers are surprised or sad about the outage. Customers prioritized fast resolutions of outages as their third priority in the survey.
Key Findings – Customer Priorities for the Energy Sector
According to the survey (n = 1,029), the top customer priorities for the energy system are:
1. Affordable energy
2. Reliable energy
3. Fast resolutions/clear communications during outages
4. Assistance for customers experiencing vulnerability
5. Clear energy tariffs and plans
6. Green, clean, socially responsible energy
7. A longer-term vision from government
8. Simpler energy plan comparison
9. Single point of contact
10. Contingency plan for unforeseen transition consequences
11. Energy Independence
12. Smaller, more frequent energy bills
These priorities were narrowed down during the two customer workshops (n = 29) from the 20 original priorities uncovered in the desktop review.
These findings are mirrored by the social media analysis, which found customers tend to respond most positively to posts about pricing, which aligns with affordability as the most important customer priority identified in the survey.
pg. 33
! ! ! pg. 33
Limitations and Further research
• Customer priorities were ranked to determine their level of preference, however by using a ranking order structure more complex statistics could not be conducted. For instance, we could not determine by how much the first preference exceeds the second preference. Future research should measure priorities using best-worst scaling to garner more sophisticated statistical information.
Insights – Customer priorities
•Customer priorities are broader than the industry-based energy trilemma (affordability, sustainability and reliability) and include communication, hardship assistance, clarity in energy plans and a long-term national vision. However, both customers and industry are aligned in placing affordability as the top priority so pricing strategies are important for trust.
•The customer energy trust bundle (CETB) offers an extension to the original energy trilemma, by incorporating key customer priorities.
•Communication is a key element of the CETB, and is very important to establishing and maintaining customer trust. Communication is most important when customers are required to take action (i.e., manage an outage, select an energy plan)
•Service provision impacts the customer experience for both trust and distrust.
Recommendations for Building Trust in the Energy System
2.1 Transform current pricing approaches to increase energy affordability for all households, with particular and added attention to those in hardship or experiencing heightened vulnerability.
2.2 Integrate the Customer Energy Trust Bundle into energy regulatory frameworks and energy communications. This will ensure that customer priorities and elements that build trust inform energy strategies, policies and communications.
2.3 Set a minimum service standard for actors interfacing with customers to ensure the customer experience is positive. This will result in increased customer confidence, favourable reputation, and positive word-of-mouth: all factors associated with trust.
pg. 34
Mapping Trust in the Energy System –Actors and Factors (RQ3)
This section answers RQ3: What are the relationships between key actors in the energy system that play a key role in building trust? Energy System actors and factors were extracted from the literature, with additions then made by drawing on the insights of customers and industry experts via consultation and workshops. Actors refer to individuals, groups or entities operating with the system, while factors refer to elements of the system. These actors and factors were then synthesised to create a systems map of the electricity system in Australia, which was refined as part of our Industry Reference Group co-design process, before being finalised by the research team. This section commences with presenting the actors and factors identified and concludes with presenting the energy system map developed in this project.
This project is the first to map the electricity system so that it is inclusive of human actors and thus extends beyond the supply chain. As outlined at the start of this report, the systems map focuses on the Australian electricity sector, and does not include any gas-specific actors as this was outside the project scope. However, many of the actors in the systems map are relevant to both electricity and gas including political, regulatory and customer actors.
‘Understanding the Australian Electricity Sector from a Systems Perspective’?
Systems thinking presents a holistic way of thinking about, understanding and addressing complex problems. Systems thinking involves the study and generation of understanding of how systems behave, interact, and influence or are influenced by other systems. A system can be understood as an entity that maintains its existence through the mutual interaction of its constituent components (Bertalanffy, 1968). Any system will also interact with the environment in which it is located, for example, the national, economic, political or cultural context. The process of mutual interaction in a system is critical, as it is through these interactions that impacts and outcomes occur and where system level effects are experienced. Furthermore, a system displays characteristics that are not created by any subset of its parts but are a result of the dynamics of the system as a whole. As such, a system exhibits discernible behaviours and creates outcomes over time.
Systems thinking is helpful for solving problems as it provides a way of considering different problems as constituent parts of overall systems. This contrasts with the traditional way of understanding and trying to solve problems that involves breaking things down into discrete components which we then analyse individually and separately without connecting them to the larger context of a system. It is argued that this fragmented approach is often ineffective for understanding complex issues (Boulding, 1956; Bertalanffy, 1968), because such discrete forms of analysis are unable to answer the ‘why’ questions about things. For example, you can singularly focus on the study of the pieces of a clock for eternity but never understand why a minute is as long as it is unless you understand the system of time (Ackoff, 1974). Instead, systems thinking advocates analysis and synthesis. Therefore, it is just as important to attempt to understand and synthesise the nature of a system, how things fit together and how a system operates and relates to its environment, in addition to undertaking more traditional analysis of the elements of a system and the nature of their interaction and effects on outcomes.
The benefit of systems thinking is that it allows us to move beyond thinking and responding reactively to events that have already happened, but also to think anticipatively about patterns and trends, and to consider what has been happening and what might happen. Furthermore, using systems thinking means we can learn about system structures, including a focus on the multiple forces that may contribute to certain patterns and trends. This holistic systems thinking approach can then facilitate transformative thinking about why situations or problems persist and how they could be tackled (French & Gordon, 2020). As such, our research adopted a systems thinking approach for considering trust in the electricity system in Australia.
The traditional approach to defining an energy system such as the Australian electricity sector is to describe the infrastructure of poles and wires that generates, transmits and distributes energy to customers and the retailers that bill the customers. This traditional engineering, technical approach often omits many of the human and social factors that influence the energy system. We adopt a more holistic definition of an energy system that combines the physical world with the human and social worlds (an eco-system) where actors such as customer groups, governments and customers themselves are included (Bedggood et al., 2023).
The energy system also consists of subsystems; these comprise smaller systems of actors that have rules and information flows within that impact on the broader system. A system can be represented visually by a systems map and in this project, we consider the actors and factors (i.e., non-human/agentic elements of the energy system) that affect trust and distrust. For the purpose of this project, electricity is the focus of the systems map.
pg. 35
Developing the Systems map of trust in the Australian Electricity Sector
The actors in the Australian electricity sector that are associated with trust and distrust were identified using data from the desktop review, drawing upon the wider literature on the Australian discussions/workshops with industry experts (include the IRG and RACE) and customer workshops, resulting in 63 actors and 38 factors. These actors and factors were then classified by the research team into five subsystems. For each of the five subsystems the actors and factors were drawn from literature, industry and/or customer sources (please see Appendix J – Actors and Factors Associated with Trust in the Australian Energy System).
The five subsystems are:
1. Consumer (the actors and factors that are within the personal sphere of a consumer)
2. Energy supply (the organisations that are in the supply chain of the provision of energy and the bill),
3. Regulation (regulatory bodies such as AEMO and AER, energy ombudsman and consumer advocates who provide advice to regulators such as ECA)
4. Political (local, state and federal government and political parties)
5. Information source (media outlets such as news and social media and scientific organisation such as CSIRO and universities).
Workshop on Trust and Distrust of Energy Subsystems
The customer workshop participants indicated the trust and distrust they have in the five subsystems (see Figure 12). The larger bubbles represent participants indicating the importance of the subsystem for trust and distrust. Notably, the information subsystem split into two groups dependent on trust scores – research and education, and media. Workshop participants indicated that the research and education elements of the information subsystem had the highest trust while the political system had the highest distrust.
A systems map was created by combining data from the survey, workshops, social media and desktop review, as well as drawing from the extant literature on systems thinking. In this project, the purpose of the systems map was: 1) classify actors and factors into subsystems, and 2) identify the relationships associated with trust and distrust between these actors and factors.
Mapping the Australian Energy Sector for Trust
pg. 36
Figure 12: Relative Importance of Subsystems for Trust and Distrust by Workshop Participants
Trust Subsystem Information (Research & Education) Consumer Regulation Energy Supply Information (Media) Political Distrust
It is important to note here that following a systems thinking approach explained earlier in this section means that the electricity systems map is intended to be viewed as a holistic whole, and not simply broken down into constituent parts (see Figure 14 and Figure 13 for a metaphor on the holistic nature of systems). Furthermore, the systems map is not designed to articulate quantitative measurements regarding components of a system and how they might interact, but rather to holistically map what they are and how they connect, and in turn, visualise how the holistic system is constituted. For this reason, we do not include trust scores from the survey regarding specific components/actors represented in the system, as this would not align with or be representative of a systems analysis. It is the components and how they relate, rather than their intensity, that informs the map.

Source: Public Health England, 2019, p. 18
The systems map shown has 5 components: actors, factors, subsystems, flows, and markets (see Figure 14):
1. Actors: There are 63 actors identified in the literature and workshops as influencing trust and distrust. Actors include organisations, institutions or individuals who affect trust and distrust in the energy system. Data source: literature, workshop and survey. These are shown in orange.
2. Factors: There are 38 factors that are associated with trust and distrust identified in the literature and workshops as important. Factors are features of the context or individual(s) that influence trust and distrust in the energy sector. These are shown in blue.
3. Subsystems: there are 5 subsystems containing actors and factors; information source, energy supply, political, regulation and consumer.
4. Flows: The trust/distrust relationship between actors, factors and subsystems are represented by arrows. The survey data relationships are shown in block lines while relationships derived from the workshop data are shown in dash lines. Relationships from the literature are shown in dotted lines. Double-headed arrows are used to show associations between actors and factors.
5. Markets: There are two ‘markets’ with different regulatory status in Australia; the National Energy Market (NEM - Queensland Operating in New South Wales, the Australian Capital Territory, Queensland, South Australia, Victoria and Tasmania) and the Wholesale Electricity Market (WEM – Western Australia).
Many actors and factors exist within each subsystem with arrows showing the direction of their flow. The systems map overall shows a complex set of interrelationships between and within each subsystem.
pg. 37
38
Figure 13: A Bicycle Metaphor for Systems
Energy supply subsystem
The energy supply subsystem shows the processes from raw materials through to generation, transmission, transmission to homes, and the retailer actors. The main inputs here are coal phases outs (Wiseman, 2023) and the increased growth of renewables (Arraño-Vargas et al., 2022) being led by the Australian Renewable Energy Agency (ARENA) (ARENA, 2023). Retailers are at the customer-facing end of this supply chain, and may contribute to customer distrust through complex tariff structures and the confusing customer energy bills that can result (Young et al., 2019). According to those within the industry, the energy supply chain in Australia is relatively straightforward (Australian Government, 2023; Energy Networks Australia, 2023). However as new technologies and customer goods and services are connected to, or supersede, the main grid, this is likely to change.
Notes regarding the Actors in the Energy System
• More than half of the actors that influence trust and distrust in the energy system were identifiable through the desktop review data.
• The customer workshops identified non-traditional actors such as electricians or the ACCC which are not typically considered as actors when thinking of the energy system.
• There are five subsystems in the energy system with actors that affect trust and distrust; consumer, regulation, energy supply, political, and information source with a combined total of 63 actors.
• The workshop data indicates that customers have trust in the information source - research and education and consumer subsystems. Customers have distrust in the information source – media and political subsystems. There is neither trust or distrust in the regulatory and energy supply sub-systems, which may reflect a lack of knowledge about these subsystems and how they operate on the part of customers. This is typical for below-the-line operations.

pg. 38

The political subsystem
The political subsystem is full of actors ranging from all levels of government (local, State and Territory, and Commonwealth), political parties, international obligations, unions, and lobby groups. The processes encountered here are mainly political strategies such as the National energy performance strategy which is currently under consultation. The interaction between these entities sets the agenda for the energy supply subsystem and the media cycle interactions with the political subsystem. The media cycle represents the flow of information between people such as politicians, readers, and news operators, it is continuous, operating 24/7.
Information source subsystem
The information source subsystem consists of various information sources such as news media, community groups, friends and family (word of mouth), CSIRO, Universities in the form of academic experts, social media, interest groups and environmental advocacy organisations. These entities shape thought and customer socialisation through the media cycle. Further, local newspaper and radio can affect local issues by putting it top of mind, and customers can then share their thoughts through social media and community groups regarding the electricity sector. Thought leaders in specific spaces can amplify their voices, such as Renew Economy, a renewable focused website. Friends and family are a double-edged sword as they can promotive positive or negative word-of-mouth, leading to increased trust (Awad & Ragowsky, 2008) or distrust (Chen et al., 2014).
Regulation subsystem
The regulation subsystem is very complex as it spans multiple markets, namely the WEM (Western Australia), NEM (Eastern Seaboard) and NT Power and Water Corporation (Northern Territory). Many energy ombudsmen exist within each jurisdiction. The ombudsman receives complaints from end users and acts on their behalf (Field, 2013; Frahm, 2012). The regulation subsystem is also comprised of laws which affect critical assets. Within this subsystem are different laws that are relevant to the NEM, or to the WEM For the NEM, these consist of the National Electricity Law and National Electricity Rules (aemc.gov.au, 2023a), the Australian Energy Market Commission (aemc.gov.au, 2023b), Energy Consumer Australia input (aemc.gov.au, 2023c), Australian Energy Market Operator (aemo.com.au, 2023a; aemo.com.au, 2023b), and Australian energy Regulator (aemo.com.au, 2023a). For the WEM, laws and regulations include the Wholesale Electricity Market Rules, Minster for Energy, Energy Policy WA, Coordinator of Energy, Electricity Review Board, and the Economic Regulation Authority (aemo.com.au, 2023b).
Consumer subsystem
The consumer subsystem consists of mainly process or factors with a small number of actors. The main one being the actual customers/households. Other actors are mostly consumer advocacy organisations (Choice, PIAC, CUAC) and the providers of consumer goods and services such as electricians, energy auditors, EV manufacturers, solar panel installers, energy efficient appliances, and third parties such as real estate agents, body corporates and facility managers. Notably, within the survey it was found that electricians attracted high levels of trust. From the literature, in terms of improving customer trust, reliability was an important factor (Mal et al., 2018), as was expectations of future energy systems (Alan, 2016), satisfactory service recovery (Mal et al., 2018), affordability (Casamassima et al., 2023), and social licence which can affect both customer trust (Lal & Brown, 2023) and distrust (Luke et al., 2018) depending on the context. Poor response to blackouts has been associated with customer distrust (Sudarshan, 2017), as are wrongful disconnections (Arraño-Vargas et al., 2022). Customer distrust led to complaints (Indibara et al., 2023) and outrage (Stefańska, & Zasuwa, 2022) which understandably triggered higher need for energy ombudsmen. Special mention is given to the impact of A.I. which could potentially lead to improved reliability (Ahmad, Zhang, Huang, Zhang, Dai, Song, & Chen, 2021; Hiroaki, 2023), improved service recovery (Song et al., 2022), more positive customer attitudes (Jain, Wadhwani, & Eastman; Mariani, Machado, & Nambisan, 2023), and lower energy bills (Bashar et al., 2023).
Overall, the system map shows a holistic, high-level overview of the impacts, drivers, processes, and actors that operate in the electricity sector. Importantly, systems thinking recognises that systems are often dynamic and change over time, and therefore periodic updates of the systems map should be made to reflect this reality.
pg. 40
i
Key Findings for Key Actors and Factors Associated with Trust in the Energy System
This project utilised data from a desktop review, discussions/workshops with industry experts, and customer workshops to identify 63 actors and 38 factors in the Australian energy system that affect trust and distrust. These 63 actors and 38 factors fit 5 subsystems:
• Consumer (the actors and factors that are within the personal sphere of a consumer)
• Energy supply (the organisations that are in the supply chain of the provision of energy and the bill)
• Regulation (regulatory bodies such as AEMO and AER, energy ombudsman and consumer advocates who provide advice to regulators such as ECA)
• Political (local, state and federal government and political parties)
• Information source (media outlets such as news and social media and scientific organisations such as CSIRO and universities).
Of these five sub-systems, customer workshop participants indicated that the research and education actors of the information source subsystem had the highest trust while the political system had the highest distrust. Visual inspection of the map reveals that some subsystems have clearer interactions with the consumer subsystem than others. Electricians were the most trusted individual actor, potentially due to closeness to the customer and perceived objectivity. Correlations also exist between some sub-systems.
• The consumer subsystem consists of key actors including third parties, residential services such as electricians, family and friends and consumer advocacy organisations, and suppliers of consumer energy goods and services. Workshop data indicates that customers feel that the consumer subsystem is complex and include unfamiliar actors.
• Evidence from the review of energy and systems literature reveals that trust and distrust in the consumer subsystem are associated with trust in all the other subsystems including: regulation (Field, 2013), political (Holum, 2023), energy (Zywiołek, J., Rosak-Szyrocka, J., Khan, & Sharif, 2022) and information source subsystems (Tranter, 2023).
• The emotional sentiment towards retailers is moderately positive with 49% of the emojis used on social media posts about retailers being . However finding should be considered with a caveat: the posts analysed were from retailer-hosted social media pages, which may influence the types of posts, the audience, and thereby the reactions.
Limitations and Further research
• The list of actors reflect the known actors as at 2023. As the energy market alters or the role of organisations shift, this will bring new actors in the system and remove other actors from the system. Regular updating of this list is required.
• The list of factors is not exhaustive, there are factors that are context or jurisdiction specific that may not appear in this list.
• Causality between actors and subsystems cannot be inferred from the evidence sources. Longitudinal data is required to demonstrate cause and effect between variables, which also allows controlling for external factors. Future research seeking to establish causality should use either experimental design or time-series analysis.
• There are 11,990 possible relationships based on the number of factors and actors for both trust and distrust in the Australian electricity sector which is excessive for inclusion in a 25-minute online survey. Therefore, the 14 actors identified as important for trust by workshop participants were included in the systems map with 91 trust relationships between actors mapped. Further research should explore trust and distrust relationships with other actors in the systems map. Expansion of the number of actors or factors in a survey will increase the required sample size and the cost of the data collection as well as altering the research design (possibly factorial or conjoint) to keep the survey within a reasonable length for participants.
pg. 41
Insights – Mapping Trust in the Energy System – Actors and Factors
• The systems map illustrates the considerable complexity of the electricity sector in Australia, with numerous different actors, processes, and interactions across the system.
• Given the complexity of the system, the numerous actors, and different jurisdictions and areas of responsibility, the systems map highlights that there could be challenges in understanding who in the system does or should have oversight and be responsible for addressing problems with customer trust, or processes and issues that influence trust. Further research could help investigate this and expand our understanding.
• The five subsystems are tight and appear to be somewhat siloed. This suggests that actors within each subsystem may not be aware of other subsystems or how they operate.
• Not all subsystems interact sufficiently with the consumer subsystem. This suggests that a customer-centric approach is not adopted by all.
• The key actors included the expected actors (e.g., customers, actors responsible for energy generation, transmission, distribution and retail, government, regulation, media) as well as some unexpected actors, such as electricians and third-parties like universities and CSIRO.
• The map also demonstrates that regulation of the electricity sector is complex with numerous actors and a range of responsibilities across different areas of jurisdiction within that subsystem. This could potentially lead to a lack of clarity over regulatory responsibility, especially for non-experts, and for problems for customers in understanding who they should approach with issues pertinent to a regulator.
• Generally, customers appreciate simplicity and clear lines of responsibility in the market. From a customer perspective the significant complexity of the electricity system could create challenges for them in navigating aspects of the system, for example, in knowing which actors to engage with for support when experiencing hardship, problems with supply, or issues relating to energy policy.
Recommendations - Building Trust in the Energy System
3.1 Undertake further research to identify how the complexity of the system impacts customers, and the effect on trust and distrust.
3.2 Investigate the utility of introducing an overarching consumer body responsible for providing a single place for customers to access support, information and relief.
3.3 Increase engagement across all key actors in the energy system in building customer trust to ensure diversity of perspectives and inclusion of customerfacing actors.
3.4 Identify how the energy system could be simplified, for example, by unifying certain functions and responsibilities under the auspices of fewer actors –especially those that are more customer-facing.
3.5 Encourage all actors in the energy system to adopt a customer-centric focus to their strategies and approaches to customer engagement.
pg. 42
System Leverage Points for Building Trust and Reducing Distrust (RQ4)
This section answers RQ4: Where are the leverage points in the energy system that can build trust (and reduce distrust)? The desktop review provided a framework of system leverage points, which were quantified in the survey based on ideas for changing the energy system that emerged from the workshops. Finally, the survey also examined who should be responsible for leading energy sector changes, after the workshops revealed a desire amongst customers for a long-term energy vision. This section commences with a discussion of system leverage points, and then provides the ranked list of leverage points selected by customers in the survey and augments this with selected workshop comments. The section concludes with the survey findings on the importance of a longterm energy vision and who customers believe should be responsible for leading changes.
This project is the first to identify the leverage points in the energy system necessary for building trust.
A Framework for System Leverage Points for Trust and Distrust
One way the energy sector can build customer trust and reduce distrust levels is through the identification of trust and distrust leverage points. Leverage points are broadly defined as places within a complex system where a small intervention or change can lead to significant and lasting transformation (Meadows, 1999). Leverage points provide avenues for systematic change through re-shaping complex systems in a way that unlocks untapped potential. There are 12 leverage points in a system ranging from deep (where related interventions are hard to implement but produce significant change) to shallow (where related interventions are easy to implement but produce little change) (Meadows, 1999) (see Figure 15). These leverage points can be classified into four categories based on the characteristic of the system they relate to – the parameters, feedbacks, design or intent (Abson et al., 2017) (see Figure 15). These leverage points have been used to assist in the creation of strategies to deal with issues including gender inequality (Manlosa et al., 2019), antimicrobial resistance (Lambraki et al., 2022) and unsustainable farming (Rosengren et al., 2020).

Source: Meadows (1999) and Abson et al (2017)
pg. 43
Figure 15: Places to Intervene in a System
What Leverage Points Do Customers Want Actioned?
Survey participants were provided with a list of changes to the energy system corresponding to 12 leverage points, identified in the literature and honed via the workshops. Customers were asked to identify which change they would most like to see occur in the energy sector (see Figure 16; the colours represent one of four Absons et al (2017) categories)
Figure 16: Customer Preference for Leverage Point Change to Build Trust

Preference for system change findings
Parameter changes preferred: The two most popular changes are both related to the parameters of the system and are associated with ensuring everyone has an accessible supply of energy (193/200 points). This aligns with the top customer priorities for the energy system selected in the survey, particularly the first four priorities (affordable, reliable, fast resolutions of outages, assistance for customers experiencing vulnerability) as these priorities all deal with making sure everyone has the energy they need to live. Parameter changes are typically mechanistic characteristics that can be easily targeted by policymakers, but will yield little major change in the system (Abson et al 2017).
Intent and design are high priorities: After the top two preferences of parameter change, the next 6 most popular changes relate to either the intent or design of the system. These are both what Meadows (1999) considers deep leverage points. The popularity of these categories suggest that energy customers are wanting to see larger, more systematic changes within the sector. The results suggest a desire for innovation and new ways of thinking about energy.
Feedbacks changes are least preferred: The area with the least requirement for change is feedbacks which includes fixing issues and rules. This suggests that customers may be satisfied with these aspects of the system and do not see changes in this area as a priority.
pg. 44

Improving the System - Findings
Participants in the workshops were asked to ideate how to change the energy system for the better. These ideas were then coded by the research team to correspond with the twelve leverage points in the system (Meadows 1999), and included in the survey where customers ranked them from lowest to highest (1 = lowest ranked; 12 = highest ranked; see Table 5). The subsystem most responsible for each leverage point is also shown, along with the trust in that subsystem.
Intent
Customer preferences (survey data)
(Rank 3) Be open to completely new ways of thinking about and changing the energy system [Transcend Paradigms]
(Rank 6) Change our thinking about what is important, valuable or true in the energy system [Mindset]
(Rank 7) Consider what the energy system should be achieving for us, and make sure we’re monitoring it [System Goal]
Design
The customer preferences relating to Design are provided below with their ranking 1-12.
(Rank 4) Ensure the energy system is able to evolve and adapt to new changes [Evolution]
(Rank 5) Ensure the right people have access to understandable information to help keep the energy system accountable [Structure of Info Flows]
(Rank 8) Re-think the rules associated with energy, and make sure they’re serving us [Rules]
Responsible subsystem Trust score for actors in the subsystem
These are wholeof-system considerations, but will require Government initiation and support.
The trust score for the Government subsystem: 3.95/7.0
Workshop suggestions for trust building
No comments were made in the workshops regarding transcending paradigms. “Common vision for future. Long-term plans and roadmap for Australian energy” (Customer)
“Think futuristically about energy needs. Make policies that reflect the goals. Understand the consumption patterns and intent in assets that are built with longer term vision.” (Industry).
These leverage points are also whole-ofsystem, but fit best with the Government, Energy Generation and Regulation subsystems.
The trust score for these subsystems:
Government: 3.95/7.0
Energy Generation: 4.28/7.0
Regulation: 4.15/7.0
“Perhaps trialling microgrids in new suburbs or developments so people on that microgrid can collectively deal with energy providers directly to achieve better prices for the collective group.” (Customer).
“Real time usage app that tells you where you can make changes in real-time to save money/energy.” (Customer)
“Minimum standards for energy efficiency in new homes, renovated homes, particularly in remote areas prone to extreme heat.” (Industry)
“Establish an independent entity that is not subject to political influence and control to determine how carbon neutral targets will be met.” (Customer)
pg. 45
Table 5: Summary of Trust Building Solutions at Each Leverage Point
(survey data)
Feedbacks
The customer preferences relating to Feedbacks are provided below with their ranking 1-12. Feedbacks were the least popular leverage points.
(Rank 10) Monitor the energy system, to quickly spot and fix issues [Negative Feedback Loop]
(Rank 11) Ensure energy supply and rules governing it are provided in a timely way [Delays]
(Rank 12) Make sure no energy system organisation can have “unchecked’ growth [Positive Feedback Loops]
Parameters
The customer preferences relating to Parameters are provided below with their ranking 1-12. Parameters were the most popular leverage points.
(Rank 1) Have adequate supply of energy for everyone, including in storage to be used when needed [Buffer/Stock]
(Rank 2) Make sure energy and resources move efficiently in the system to ensure everyone gets what they need [Structure/Flows]
(Rank 9) Re-think who gets to control the energy supply and what methods we have for using more/less energy [Parameters]
These leverage points relate primarily to the regulation subsystem.
The trust score for the regulation subsystem: 4.15/7.0
“An app that charges you to the cheapest retailer. This should make retailers competitive with their rates.” (Customer)
“Enable control of devices - PV, EV & Storage.” (Industry)
“Transitioning to renewable energy needs specific change management plan with timeframes. Timeframes need to be generous so that specific industry transition plans can be implemented.” (Customer)
“Make energy providers accountable. Profits to go to infrastructure and not shareholders.” (Customer)
These leverage points are als0 whole-ofsystem, but fit best with the Government, Energy Generation and Regulation subsystems.
The trust score for these subsystems:
Government: 3.95/7.0
Energy
4.15 /7.0
“Support installations of solar/batteries so people can use their own input as needed…” (Customer)
“Vulnerable people having access to electricity. Surplus / refunds on prepaid plans go to a pool that’s distributed to people struggling. No questions asked. Better to risk someone exploiting the system than an elderly person having food spoiled. Means/asset testing.” (Customer)
“Less complexity and greater transparency. Consolidation of transmission / network / retail. (with regulation).” (Industry).
“Establish clarity in the constitution about which level of government is responsible for energy generation and distribution. Hold a referendum to invite the Australian community to vote yes for this responsibility to rest solely with the federal government.” (Customer)
Suggestions for change findings
•There was broad alignment between customer and industry workshop participants for suggested changes to the system.
•Both customers and industry had some preference for intervention at the design level which reflects deeper change (i.e., changes to the social structures/institutions that manage the system and how it works).
•Almost all the ideas for improving the energy system involve multiple actors and subsystems indicating a whole-ofsystem approach is needed for increasing customer trust and reducing distrust in the energy system.
pg. 46
Customer preferences
Responsible Subsystem Trust score for actors in the subsystem Workshop suggestions for trust building
Generation:
Regulation:
4.28/7.0
Who Should Lead Energy Sector Changes?
The finding that energy customers want to see progress and change within the sector is further evidenced by 88.2% of survey participants who indicated that it is important that Australia has a national, long-term plan for energy. In addition, 60.1% of survey participants believe that the responsibility for a national long-term energy plan is the government’s (federal, state and local) with 43.7% attributing responsibility to the federal government (see Figure 17 and 18 respectively).


The workshop participants (customer and industry/policy) indicated dissatisfaction with the current regulatory approach. There was broad agreement that customers were not at ease with the current energy system structure and were seeking additional government involvement. However, there were diverse opinions on the type of involvement and strategy that was recommended. For instance, while some customers called for buy-backs (i.e., government re-purchasing of energy sector assets), others supported less overseas involvement, or increased accountability and transparency in regulations. Some industry workshop participants also supported the customer call while others were focused on non-regulatory system interventions to build trust. Some illustrative quotes are provided below, with further verbal and workbook comments provided in Appendix K – Verbal and Workbook Quotes For Regulation Change. These comments are consistent with the survey result of 88.2% of customers recognising the importance of an Australian national energy strategy, and the expectation that Government is responsible for the strategy.
• “There needs to be a national approach to the provision of energy – it is an essential service. It should be government owned and supplied on a non-for-profit basis” (Customer)
• “Don’t let overseas government and businesses buy into our state’s power grid. Australian electricity should be owned by the Australian government” (Customer)
• “Deregulation is bad. The government needs to buy back” (Customer)
• “They need to look at the long term. Look what happened to the banks in 2008, they are too short-sighted” (Customer)
• “Bringing everything under federal control helps with over-investment and efficiency” (Industry).
pg. 47
Figure 17: Customer Views of the Importance of Having a National Energy Strategy
Figure 18: Who Should be Responsible for a National Energy Strategy
National long-term energy plan findings
• 88.2% of customers believe that it is moderately to extremely important that Australia has a national long-term energy strategy.
• The survey results show that 61.9% of customers believe that government should be responsible for a long-term national energy strategy.
• Workshop participants were dissatisfied with the current regulatory and government role in the sector and seek change.
• 28.2% of customers believe that everyone in the energy system, including customers, should be responsible for a national long-term plan for energy.
• Only 1.4% of customers believe that they are responsible for a national energy plan.
Key Findings for leverage points in the energy system
The survey (n = 1,029) indicated that the leverage points where customers most wish to see change in the energy system are (in priority order):
1. Have adequate supply of energy for everyone, including in storage to be used when needed [ParametersBuffer/Stock]
2. Make sure energy and resources move efficiently in the system to ensure everyone gets what they need [Parameters - Structure/Flows]
3. Be open to completely new ways of thinking about and changing the energy system [Intent - Transcend Paradigms]
4. Ensure the energy system is able to evolve and adapt to new changes [ Design - Evolution]
5. Ensure the right people have access to understandable information to help keep the energy system accountable [Design - Structure of Info Flows]
6. Change our thinking about what is important, valuable or true in the energy system [Intent - Mindset]
7. Consider what the energy system should be achieving for us, and make sure we’re monitoring it [Intent - System Goal]
8. Re-think the rules associated with energy, and make sure they’re serving us [Design - Rules]
9. Re-think who gets to control the energy supply and what methods we have for using more/less energy [Parameters - Parameters]
10. Monitor the energy system, to quickly spot and fix issues [Feedbacks - Negative Feedback Loop]
11. Ensure energy supply and rules governing it are provided in a timely way [Feedbacks - Delays]
12. Make sure no energy system organisation can have “unchecked’ growth [Feedbacks - Positive Feedback Loops]
These leverage points were sourced from existing evidence on system intervention points, and were coded for in the customer (n=29) and industry (n = 14) workshops and then were written in customer-facing language and quantified in the survey.
Parameter level changes were most preferred, which relate to ensuring access to energy which aligns with top customer priorities in the survey (affordability, reliability, fast resolution of outages, assistance for customers experiencing vulnerability). These types of changes involve minor changes to the industry and are unlikely to produce the transformative outcomes needed alone.
Intent and Design level changes, which deal with deep change, were also high priorities, indicating that customers may be seeking innovation in the sector. These types of changes involve significant changes to the design and operation of the industry and are thus likely to produce the most improved outcomes.
The need for change in the energy system is supported by the survey, where a substantial majority (88.2%) of customers indicated that a longterm national energy strategy was important for Australia, with most (61.9%) indicating that Government should be responsible (either Federal, State or Local) for this strategy.
Change in the regulatory structure and role of government of the system is evidenced by workshop dissatisfaction and the survey result of 61.9% wanting government to be responsible for the long-term vision.
• “They need to look at the long term. Look what happened to the banks in 2008, they are too short-sighted” (Customer)
• “Bringing everything under federal control helps with over-investment and efficiency” (Industry)
pg. 48
The need for change in the energy system is supported by the survey, where a substantial majority (88.2%) of customers indicated that a long-term national energy strategy was important for Australia, with most (61.9%) indicating that Government should be responsible (either Federal, State or Local) for this strategy.
Change in the regulatory structure and role of government of the system is evidenced by workshop dissatisfaction and the survey result of 61.9% wanting government to be responsible for the long-term vision.
• “They need to look at the long term. Look what happened to the banks in 2008, they are too short-sighted” (Customer)
• “Bringing everything under federal control helps with over-investment and efficiency” (Industry)
Limitations and Further research
• In the survey, leverage points were ranked and so we cannot determine by how much one leverage point is prioritised over another. This can be done in future research using best-worst scaling.
• Leverage points are likely to change over time and so the leverage points should be updated every year or as major changes to the systems map are encountered.
Insights – Leverage points in the energy system
• With leverage point findings indicating customer desire for redesign of the industry to better meet customer needs, broad oversight and a focus on consumer experiences will be important.
• The findings indicate that consumers are seeking deeper changes to the energy system at the ‘design’ and ‘intent’ aspect of the system.
• Consumers believe Australia needs a longer-term vision and that this should be led by government, who they believe should take a more significant role in the sector.
• Consumers and industry indicated in the workshops that they were not satisfied with the current role of regulation and government. Some consumers wanted government to ‘buy back’ privatised assets. However, the lack of difference in trust and distrust between the NEM and WEM indicates that the regulatory structure of the WEM may not be a useful model for the NEM for building trust.
Recommendations - Building Trust in the Energy System
4.1 Create a consumer-facing organisation that is a one-stop shop offering oversight and advocacy and relief support to build trust and improve consumer experiences.
4.2 Co-design a long-term national vision for the energy system, with this process led by Government and the resulting vision implemented/owned by government.
4.3 Explore alternative regulatory models and structures, and identify the role governments should adopt in the system that will build trust.
pg. 49
Conclusion and Next Steps
The RACE E1 Opportunity Assessment Roadmap Report led by QUT and partly-funded by the RACE for 2030 Energy CRC revealed significant gaps in our understanding of trust in the energy sector. The report also offers five themes for future work to address (see Figure 19). This project on benchmarking trust in the energy system and mapping the system addresses a priority in program 4.
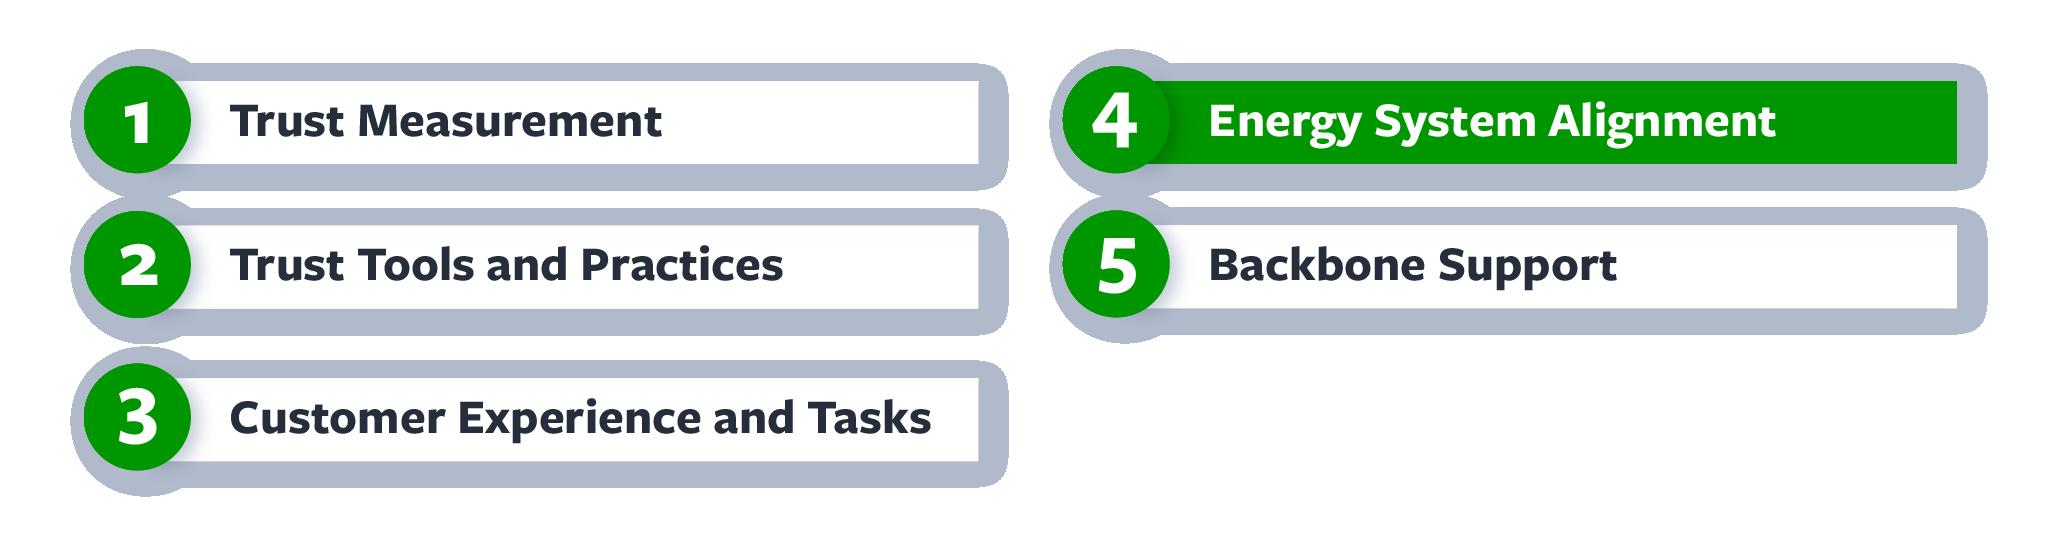

pg. 50
Figure 19: Five Recommended Program Themes from RACE E1 Opportunity Assessment Roadmap
The current project contributes to program theme 4, Alignment in the Energy System, by providing a systems map of the Australian electricity sector. It also contributes to theme 1, Trust Measurement, by providing an initial indication of trust levels in the energy system – which are currently in the mid-ranges at best, often scoring lower than the mid-point of the scale across the four main dimensions of trust: competence, responsibility, openness and authenticity. Our work serves to highlight the importance of continued research and programs of work focused on finding ways to maintain a customer-focused lens for the energy transition. Future research could investigate where there is room for change with how trust is established, explore missed opportunities for trusted partnerships, exploring ways to better leverage identified trust drivers, and addressing customer desire for significant change and innovation across the energy system.
The systems map demonstrates the significant complexity of the electricity sector in Australia, with numerous actors, processes, interactions and areas of responsibility across the system. This is the reality that customers need to navigate. Given this complexity, there may be challenges in understanding who is ultimately responsible for managing customer trust in the energy system and further research is needed to better understand the implications of this and to identify appropriate solutions, Specifically, regulation in the system is complex and for customers it may be unclear who they should engage regarding problems they experience such as hardship, issues with supply, or matters pertaining to energy policy. Furthermore, if the system does not function in a holistic way, and instead adopts a siloed approach this could cause customers to have difficulties in successfully navigating the system when they have a problem, which could potentially negatively impact customer trust. Therefore, careful consideration should be given to redesigning and improving the system, for example through streamlining some aspects of the system, making it more customer oriented and easier to navigate for householders, and setting clearer lines of responsibility. Ideally, customers may prefer a one-stop shop in the form of an overarching customer regulator or similar body that can deal with their issues. This would require further research to provide insights on optimal system design, good policy, and strong participation and consensus building among the various actors in the sector. As suggested elsewhere a key focus for the system moving forward should be to develop a holistic eco-system where value is shared more equitably and people can access the energy they need to live a dignified, healthy and comfortable life (Bedggood et al., 2022 - EEWP-P1 report).

References
ABS. (2021). Remoteness Structure. Retrieved from: https://www.abs.gov.au/statistics/standards australian-statistical-geography-standard-asgs-edition-3/jul2021-jun2026/remotenessstructure#:~:text=The%20five%20remoteness%20classes%20are,Regional%2C%20Remote%20 and%20Very%20Remote.
ABS. (2022). Household Income and Wealth, Australia https://www.abs.gov.au/statistics/economy/finance/ household-income-and-wealth-australia/2019-20#data-downloads
ABS. (2023). Remoteness Areas https://www.abs.gov.au/statistics/standards/australian-statisticalgeography-standard-asgs-edition-3/jul2021-jun2026/remoteness-structure/remoteness-areas
Abson, D. J., Fischer, J., Leventon, J., Newig, J., Schomerus, T., Vilsmaier, U., von Wehrden, H., Abernethy, P., Ives, C. D., Jager, N. W., & Lang, D. J. (2017). Leverage points for sustainability transformation. Ambio, 46(1), 30–39. https://doi.org/10.1007/s13280-016-0800-y
Ackoff, R. L. (1974). Redesigning the future : a systems approach to societal problems. Wiley-Interscience. AEMC (2023a). National Energy Governance. Retrieved from: https://www.aemc.gov.au/regulation/ national-energy-governance/other-responsible-bodies
AEMC (2023b). National Electricity Rukes. Retrieved from: https://www.aemc.gov.au/regulation/energyrules/national-electricity-rules
AEMC. (2014). Consumer Priorities for Energy Market Development. https://www.aemc.gov.au/ sites/default/files/content/Report-Consumer-Priorities-for-Energy-Market-Development-FINAL-18December-2014.PDF
AEMO (2023a). Market Bodies. Retrieved from: https://aemo.com.au/en/learn/market-bodies
AEMO (2023b). WEM Reform Rules. Retrieved from: https://aemo.com.au/en/initiatives/major-programs/ wem-reform-program/market-design/wem-reform-rules
Ahmad, T., Zhang, D., Huang, C., Zhang, H., Dai, N., Song, Y., & Chen, H. (2021). Artificial intelligence in sustainable energy industry: Status Quo, challenges and opportunities. Journal of Cleaner Production, 289, 125834.
Alan, Alper T. (2016) People’s interaction with future autonomous energy systems in their everyday lives at home. Doctoral Thesis, 122pp
ARENA. (2023). Strategic priorities: optimise the transition to renewable electricity. https://arena.gov.au/ about/strategic-priorities/strategic-priorities-optimising-the-transition-to-renewable-electricity/
Arraño-Vargas, F., Shen, Z., Jiang, S., Fletcher, J., & Konstantinou, G. (2022). Challenges and Mitigation Measures in Power Systems with High Share of Renewables—The Australian Experience. Energies (Basel), 15(2), 429–. https://doi.org/10.3390/en15020429
pg. 52
Australian Energy Regulator. (2022). AER starts a journey towards energy equity https://www.aer.gov.au/ news-release/aer-starts-a-journey-towards-energy-equity
Australian Government. (2022). Transition to net zero https://www.globalaustralia.gov.au/industries/netzero
Australian Government. (2023). Energy Supply https://www.energy.gov.au/government-priorities/energysupply
Awad, N. F., & Ragowsky, A. (2008). Establishing Trust in Electronic Commerce Through Online Word of Mouth: An Examination Across Genders. Journal of Management Information Systems, 24(4), 101–121. https://doi.org/10.2753/MIS0742-1222240404
Awaworyi Churchill, S., & Smyth, R. (2020). Ethnic diversity, energy poverty and the mediating role of trust: Evidence from household panel data for Australia. Energy Economics, 86, 104663–. https://doi.org/10.1016/j.eneco.2020.104663
Bashar, M. A., Nayak, R., Astin-Walmsley, K., & Heath, K. (2023). Machine learning for predicting propensity-to-pay energy bills. Intelligent Systems with Applications, 17, 200176–. https://doi. org/10.1016/j.iswa.2023.200176
Becker, S., Demski, C., Evensen, D., & Pidgeon, N. (2019). Of profits, transparency, and responsibility: Public views on financing energy system change in Great Britain. Energy Research & Social Science, 55, 236–246. https://doi.org/10.1016/j.erss.2019.05.013
Bedggood, R., Russell-Bennett, R., McAndrew, R., Glavas, C., & Dulleck, U. (2023). Challenging the socialpower paradigm: Moving beyond consumer empowerment to an energy ecosystem of shared value. Energy Policy, 173, 113405.
Bertalanffy, L. V. (1968). General system theory: Foundations, development, applications. G. Braziller.
Boulding, K. E. (1956). General Systems Theory-The Skeleton of Science. Management Science, 2(3), 197–208. https://doi.org/10.1287/mnsc.2.3.197
Bronfman, N. C., Jiménez, R. B., Arevalo, P. C., & Cifuentes, L. A. (2015). Public Acceptance of Electricity Generation Sources: The Role of Trust in Regulatory Institutions. Energy & Environment (Essex, England), 26(3), 349–368. https://doi.org/10.1260/0958-305X.26.3.349
Büscher, C., & Sumpf, P. (2015). “Trust” and “confidence” as socio-technical problems in the transformation of energy systems. Energy, Sustainability and Society, 5(1), 1–13. https://doi.org/10.1186/ s13705- 0150063-7
Caferra, R., Colasante, A., & Morone, A. (2021). The less you burn, the more we earn: The role of social and political trust on energy-saving behaviour in Europe. Energy Research & Social Science, 71, 101812–https://doi.org/10.1016/j.erss.2020.101812
Carattini, S., Baranzini, A., & Roca, J. (2015). Unconventional Determinants of Greenhouse Gas Emissions: The role of trust: Unconventional Determinants of Greenhouse Gas Emissions. Environmental Policy and Governance, 25(4), 243–257. https://doi.org/10.1002/eet.1685
Casamassima, Alessia/Morone, Andrea et. al. (2023). On the Relevance of Risk, Chen, Y.-S. (2010). The Drivers of Green Brand Equity: Green Brand Image, Green Satisfaction, and Green Trust. Journal of Business Ethics, 93(2), 307–319. https://doi.org/10.1007/s10551-009-0223-9
Chen, Y.-S., Lin, C.-L., & Chang, C.-H. (2014). The influence of greenwash on green word-of-mouth (green WOM): the mediation effects of green perceived quality and green satisfaction. Quality & Quantity, 48(5), 2411–2425. https://doi.org/10.1007/s11135-013-9898-1
pg. 53
Chester, L. (2015). The privatisation of Australian electricity: Claims, myths and facts. The Economic and Labour Relations Review, 26(2), 218-240. https://doi.org/10.1177/1035304615574973
Craig, C. S., & McCann, J. M. (1978). Assessing Communication Effects on Energy Conservation. The Journal of Consumer Research, 5(2), 82–88. https://doi.org/10.1086/208718
de Wilde, M., & Spaargaren, G. (2019). Designing trust: how strategic intermediaries choreograph homeowners’ low-carbon retrofit experience. Building Research and Information : the International Journal of Research, Development and Demonstration, 47(4), 362–374. https://doi.org/10.1080/096132 18.2018.1443256
Dimoka, A. (2010). What Does the Brain Tell Us About Trust and Distrust? Evidence from a Functional Neuroimaging Study. MIS Quarterly, 34(2), 373–396. https://doi.org/10.2307/20721433
Driscoll, J. W. (1978). Trust and Participation in Organizational Decision Making as Predictors of Satisfaction. Academy of Management Journal, 21(1), 44–56. https://doi.org/10.5465/255661
Energy Consumers Australia. (2020). A Future Energy Vision Consumer Expectations Research https:// energyconsumersaustralia.com.au/projects/consumer-values-expectations-and-needs
Energy Consumers Australia. (2022). Energy Consumer Sentiment & Behaviour Surveys https://ecss. energyconsumersaustralia.com.au/sentiment-survey-dec-2022/
Energy Network Australia. (2023). Representing Australia’s Energy Networks https://www. energynetworks.com.au/
Ernst & Young. (2022). Energy Transition Consumer Insights ey-energy-transition-consumer-insightsfinal.pdf
Familia, T., & Horne, C. (2022). Customer trust in their utility company and interest in household-level battery storage. Applied Energy, 324(C), 119772–. https://doi.org/10.1016/j.apenergy.2022.119772
Faure, C., Guetlein, M.-C., Schleich, J., Tu, G., Whitmarsh, L., & Whittle, C. (2022). Household acceptability of energy efficiency policies in the European Union: Policy characteristics trade-offs and the role of trust in government and environmental identity. Ecological Economics, 192, 107267–. https://doi. org/10.1016/j.ecolecon.2021.107267
Fereday, J., & Muir-Cochrane, E. (2006). Demonstrating Rigor Using Thematic Analysis: A Hybrid Approach of Inductive and Deductive Coding and Theme Development. International Journal of Qualitative Methods, 5(1), 80–92. https://doi.org/10.1177/160940690600500107
Field, C. (2013). The role of the Western Australian Energy Ombudsman and its relationship with regulators, industry and consumers. Australian Business Law Review, 41(1), 43-47.
Field, C. (2013). The role of the Western Australian Energy Ombudsman and its relationship with regulators, industry and consumers. Australian Business Law Review, 41(1), 43-47.
Finkle, A. (2017). Independent Review into the Future Security of the National Electricity MarketBlueprint for the Future https://www.energy.gov.au/publications/independent-review-future-securitynational-electricity-market-blueprint-future
Frahm, M. (2012). Australasia and Pacific Ombudsman Institutions: Mandates, Competences and Good Practice (pp. 165175). Berlin, Heidelberg: Springer Berlin Heidelberg.
French, J., & Gordon, R. (2020). Strategic social marketing : for behaviour & social change (Second edition.). SAGE Publications Ltd.
pg. 54
Gordon, J. A., Balta-Ozkan, N., & Nabavi, S. A. (2022). Beyond the triangle of renewable energy acceptance: The five dimensions of domestic hydrogen acceptance. Applied Energy, 324, 119715–. https://doi.org/10.1016/j.apenergy.2022.119715
Greenberg, M. R. (2014). Energy policy and research: The underappreciation of trust. Energy Research & Social Science, 1, 152–160. https://doi.org/10.1016/j.erss.2014.02.004
Greenberg, M., Mayer, H., & Powers, C. (2011). Public preferences for environmental management practices at DOE’s nuclear waste sites: Public Preferences for Environmental Management Practices at DOE’s Nuclear Waste Sitess. Remediation (New York, N.Y.), 21(2), 117–131. https://doi.org/10.1002/ rem.20285
Grossmann, K., Jiglau, G., Dubois, U., Sinea, A., Martín-Consuegra, F., Dereniowska, M., Franke, R., Guyet, R., Horta, A., Katman, F., Papamikrouli, L., Castaño-Rosa, R., Sandmann, L., Stojilovska, A., & Varo, A. (2021). The critical role of trust in experiencing and coping with energy poverty: Evidence from across Europe. Energy Research & Social Science, 76, 102064–. https://doi.org/10.1016/j.erss.2021.102064
Heberlein, T. A., & Warriner, G. K. (1983). The influence of price and attitude on shifting residential electricity consumption from on-to-off-peak periods. Journal of Economic Psychology, 4(1-2), 107–130. https://doi.org/10.1016/0167-4870(83)90021-1
Heffron, R. J., McCauley, D., & Sovacool, B. K. (2015). Resolving society’s energy trilemma through the Energy Justice Metric. Energy Policy, 87, 168–176. https://doi.org/10.1016/j.enpol.2015.08.033
Hiroaki, J. (2023). AI-Based Optimized Layout Power Management Unit. Emerging Science and Technology, 1(1), 1-4.
Holum, M. (2023). Citizen participation: Linking government efforts, actual participation, and trust in local politicians. International Journal of Public Administration, 46(13), 915-925.
Horne, C., Familia, T., & Huddart Kennedy, E. (2022). California Consumers’ Beliefs and Trust in Electric Utilities. Sociological Research for a Dynamic World, 8, 237802312211057–. https://doi. org/10.1177/23780231221105708
Horne, C., Kennedy, E. H., & Familia, T. (2021). Rooftop solar in the United States: Exploring trust, utility perceptions, and adoption among California homeowners. Energy Research & Social Science, 82(C), 102308–. https://doi.org/10.1016/j.erss.2021.102308
Hu, G., Wang, J., Laila, U., Fahad, S., & Li, J. (2022). Evaluating households’ community participation: Does community trust play any role in sustainable development? Frontiers in Environmental Science, 10. https://doi.org/10.3389/fenvs.2022.951262
Huijts, N. M. A., Molin, E. J. E., & Steg, L. (2012). Psychological factors influencing sustainable energy technology acceptance: A review-based comprehensive framework. Renewable & Sustainable Energy Reviews, 16(1), 525–531. https://doi.org/10.1016/j.rser.2011.08.018
Indibara, I., Halder, D., & Varshney, S. (2023). Consumer cynicism: Interdisciplinary hybrid review and research agenda. International Journal of Consumer Studies, 47(6), 2724–2746. https://doi.org/10.1111/ ijcs.12979
Jain, V., Wadhwani, K., & Eastman, J. K. Artificial intelligence consumer behavior: A hybrid review and research agenda. Journal of Consumer Behaviour.
Johnson, C. (2019). Doctors trusted the most, survey. Australian Medicine, 31(6), 12. Kalkbrenner, B. J., & Roosen, J. (2016). Citizens’ willingness to participate in local renewable energy projects: The role of community and trust in Germany. Energy Research & Social Science, 13, 60–70. https://doi.org/10.1016/j.erss.2015.12.006
pg. 55
Koirala, B. P., Araghi, Y., Kroesen, M., Ghorbani, A., Hakvoort, R. A., & Herder, P. M. (2018). Trust, awareness, and independence: Insights from a socio-psychological factor analysis of citizen knowledge and participation in community energy systems. Energy Research & Social Science, 38, 33–40. https:// doi.org/10.1016/j.erss.2018.01.009
Lal, N. N., & Brown, L. (2023). Give a little to get a little: A DER Bill of Rights and Responsibilities provides the social license for participation and control in DER-dominated grids - an Australian example. The Electricity Journal, 36(4), 107265–. https://doi.org/10.1016/j.tej.2023.107265
Lambraki, I. A., Cousins, M., Graells, T., Leger, A., Henriksson, P., Harbarth, S., Troell, M., Wernli, D., Jørgensen, P. S., Desbois, A. P., Carson, C. A., Parmley, E. J., & Majowicz, S. E. (2022). Factors influencing antimicrobial resistance in the European food system and potential leverage points for intervention: A participatory, One Health study. PloS One, 17(2), e0263914–e0263914. https://doi.org/10.1371/journal. pone.0263914
Lehtonen, M., & de Carlo, L. (2019). Community energy and the virtues of mistrust and distrust: Lessons from Brighton and Hove energy cooperatives. Ecological Economics, 164, 106367–. https://doi. org/10.1016/j.ecolecon.2019.106367
Lewicki, R. J., McAllister, D. J., & Bies, R. J. (1998). Trust and Distrust: New Relationships and Realities. The Academy of Management Review, 23(3), 438–458. https://doi.org/10.2307/259288
Liu, L., Bouman, T., Perlaviciute, G., & Steg, L. (2019). Effects of trust and public participation on acceptability of renewable energy projects in the Netherlands and China. Energy Research & Social Science, 53, 137–144. https://doi.org/10.1016/j.erss.2019.03.006
Liu, L., Vrieling, L., Perlaviciute, G., Bouman, T., & Steg, L. (2022). The role of trust in public acceptability of energy projects: Integrity versus competence. Environmental Research Communications, 4(3), 35003–. https://doi.org/10.1088/2515-7620/ac5718
Luke, H., Brueckner, M., & Emmanouil, N. (2018). Unconventional gas development in Australia: A critical review of its social license. The Extractive Industries and Society, 5(4), 648–662. https://doi. org/10.1016/j.exis.2018.10.006
Maiberger, T., Schindler, D., & Koschate, N. (2023). Let’s face it : When and how facial emojis increase the persuasiveness of electronic word of mouth. Journal of the Academy of Marketing Science, 0123456789. https://doi.org/10.1007/s11747-023-00932-8
Mal, C. I., Davies, G., & Diers‐Lawson, A. (2018). Through the looking glass: The factors that influence consumer trust and distrust in brands. Psychology & Marketing, 35(12), 936–947. https://doi. org/10.1002/mar.21146
Maller, C. J., & Strengers, Y. (2011). Housing, heat stress and health in a changing climate: promoting the adaptive capacity of vulnerable households, a suggested way forward. Health Promotion International, 26(4), 492–498. https://doi.org/10.1093/heapro/dar003
Manlosa, A. O., Schultner, J., Dorresteijn, I., & Fischer, J. (2019). Leverage points for improving gender equality and human well-being in a smallholder farming context. Sustainability Science, 14(2), 529–541. https://doi.org/10.1007/s11625-018-0636-4
Mariani, M. M., Machado, I., & Nambisan, S. (2023). Types of innovation and artificial intelligence: A systematic quantitative literature review and research agenda. Journal of Business Research, 155, 113364.
Meadows, D. (1999). Leverage points: places to intervene in a system. The Sustainability Institute, Hartland, Vermont. https://www.benlandau.com/wp-content/uploads/2015/06/Meadows-1997-Placesto-intervene.pdf
pg. 56
Mezger, A., Cabanelas, P., Cabiddu, F., & Rüdiger, K. (2020). What does it matter for trust of green consumers? An application to German electricity market. Journal of Cleaner Production, 242, 118484–. https://doi.org/10.1016/j.jclepro.2019.118484
Moody, G. D., Lowry, P. B., & Galletta, D. F. (2017). It’s complicated: explaining the relationship between trust, distrust, and ambivalence in online transaction relationships using polynomial regression analysis and response surface analysis. European Journal of Information Systems, 26(4), 379–413. https://doi.org/10.1057/s41303-016-0027-9
Moon, B. B., & Rhee, Y. (2013). Exploring negative dimensions of organization-public relationships (NOPR) in public relations. Journalism & Mass Communication Quarterly, 90(4), 691-714.
Mumford, J., & Gray, D. (2010). Consumer engagement in alternative energy—Can the regulators and suppliers be trusted? Energy Policy, 38(6), 2664–2671. https://doi.org/10.1016/j.enpol.2009.05.054
Nader, L., & Milleron, N. (1979). Dimensions of the “people problem” in energy research and “the” factual basis of dispersed energy futures. Energy (Oxford), 4(5), 953–967. https://doi.org/10.1016/03605442(79)90025-2
Nepal, R., & Foster, J. (2015). Electricity networks privatization in Australia: An overview of the debate. Economic Analysis and Policy, 48, 12–24. https://doi.org/10.1016/j.eap.2015.10.001
Nowell, L. S., Norris, J. M., White, D. E., & Moules, N. J. (2017). Thematic analysis: Striving to meet the trustworthiness criteria. International journal of qualitative methods, 16(1), https://doi. org/10.1177/1609406917733847
Offermann-van Heek, J., Katrin Arning, Anika Linzenich, & Martina Ziefle. (2018). Trust and Distrust in Carbon Capture and Utilization Industry as Relevant Factors for the Acceptance of Carbon-Based Products. Frontiers in Energy Research, 6. https://doi.org/10.3389/fenrg.2018.00073
Owens, S., & Driffill, L. (2008). How to change attitudes and behaviours in the context of energy. Energy Policy, 36(12), 4412–4418. https://doi.org/10.1016/j.enpol.2008.09.031
Przepiorka, W., Horne, C., Leerstoel Buskens, & Social Networks, S. and I. (2020). How Can Consumer Trust in Energy Utilities be Increased? The Effectiveness of Prosocial, Proenvironmental, and ServiceOriented Investments as Signals of Trustworthiness. Organization & Environment, 33(2), 262–284. https://doi.org/10.1177/1086026618803729
Public Health England. (2019). Health matters: whole systems approach to obesity https://www.gov.uk/ government/publications/health-matters-whole-systems-approach-to-obesity/health-matters-wholesystems-approach-to-obesity
Quiggin, J. (2014). Electricity Privatisation In Australia A Record Of Failure. https://www.etuvic.com.au/ Documents/Campaigns/Electricity_Privatisation_Report.pdf
Robbins, B. G. (2016). Probing the Links Between Trustworthiness, Trust, and Emotion: Evidence From Four Survey Experiments. Social Psychology Quarterly, 79(3), 284–308. https://doi. org/10.1177/0190272516657546
Rosengren, L. M., Raymond, C. M., Sell, M., & Vihinen, H. (2020). Identifying leverage points for strengthening adaptive capacity to climate change. Ecosystems and People (Abingdon, England), 16(1), 427–444. https://doi.org/10.1080/26395916.2020.1857439
Russell-Bennett, Rebekah, Riedy, Chris, Gardner, John, Chong, Heap Yih (John), Kuch, Declan, Niklas, Sarah, Clements, Adam, Flew, Terry, Mathmann, Frank, McAndrew, Ryan, Letheren, Kate, Zimbatu, Alexandra, Whittaker, Lucas, Minunno, Roberto, Amin, Ruhul, & Goulding, Benjamin. (2021). Trust building for collaborative win-win customer solutions in the energy sector: RACE 2030 Insights, Gaps and Opportunities Overview. Queensland University of Technology, Brisbane, Australia.
pg. 57
Savage, C. (2022). Restoring trust and confidence to our electricity markets https://www.aer.gov.au/newsrelease/restoring-trust-and-confidence-to-our-electricity-markets-opinion-piece-from-aer-chair-claresavage
Schober, P., Boer, C., & Schwarte, L. A. (2018). Correlation coefficients: appropriate use and interpretation. Anesthesia & analgesia, 126(5), 1763-1768.
Six, F. E., & Latusek, D. (2023). Distrust: A critical review exploring a universal distrust sequence. Journal of Trust Research, 13(1), 1–23. https://doi.org/10.1080/21515581.2023.2184376
Smolander, J. (2002). Effect of Cold Exposure on Older Humans. International Journal of Sports Medicine, 23(2), 86–92. https://doi.org/10.1055/s-2002-20137
Song, M., Du, J., Xing, X., & Mou, J. (2022). Should the chatbot ?save itself? or ?be helped by others?? The influence of service recovery types on consumer perceptions of recovery satisfaction. Electronic Commerce Research and Applications, 55, 101199–. https://doi.org/10.1016/j.elerap.2022.101199
Stefańska, M., & Zasuwa, G. (2022). The impact of doing bad on consumer (dis) trust in the company: The moderating role of moral values 1. In Corporate Social Responsibility and Sustainability (pp. 8091). Routledge.
Stenner, K., Frederiks, E. R., Hobman, E. V., & Cook, S. (2017). Willingness to participate in direct load control: The role of consumer distrust. Applied Energy, 189, 76–88. https://doi.org/10.1016/j. apenergy.2016.10.099
Sudarshan, A. (2017). Nudges in the marketplace: The response of household electricity consumption to information and monetary incentives. Journal of Economic Behavior & Organization, 134, 320–335. https://doi.org/10.1016/j.jebo.2016.12.015
Touré-Tillery, M., & McGill, A. L. (2015). Who or what to believe: Trust and the differential persuasiveness of human and anthropomorphized messengers. Journal of Marketing, 79(4), 94–110. https://doi. org/10.1509/jm.12.0166
Tranter, B., Lester, L., Foxwell-Norton, K., & Palmer, M. A. (2023). In science we trust? Public trust in Intergovernmental Panel on Climate Change projections and accepting anthropogenic climate change. Public Understanding of Science, 09636625231165405.
Truong, D., Davidson, D. J., & Parkins, J. R. (2019). Context matters: Fracking attitudes, knowledge and trust in three communities in Alberta, Canada. The Extractive Industries and Society, 6(4), 1325–1332. https://doi.org/10.1016/j.exis.2019.09.004
Trust and Social Attitudes to Energy Affordability Perception : Evidence from Europe. [S.l.]: SSRN https:// doi.org/10.2139/ssrn.4500677
Utz, M., Johanning, S., Roth, T., Bruckner, T., & Strüker, J. (2023). From ambivalence to trust: Using blockchain in customer loyalty programs. International Journal of Information Management, 68, 102496–. https://doi.org/10.1016/j.ijinfomgt.2022.102496
Volland, B. (2017). The role of risk and trust attitudes in explaining residential energy demand: Evidence from the United Kingdom. Ecological Economics, 132, 14–30. https://doi.org/10.1016/j. ecolecon.2016.10.002
Wiersma, B., & Devine-Wright, P. (2014). Decentralising energy: comparing the drivers and influencers of projects led by public, private, community and third sector actors. Contemporary Social Science, 9(4), 456–470. https://doi.org/10.1080/21582041.2014.981757
pg. 58
Wiseman, J. (2023). Accelerating the Phase Out of Coal in Australia: Key Trends and Drivers. Handbook of Energy Law in the Low-Carbon Transition, 183
World Health Organisation. (2018). Heat and Health. https://www.who.int/news-room/fact-sheets/detail/ climate-change-heat-and-health
Wright, B., & Bragge, P. (2018). Interventions to promote healthy eating choices when dining out: A systematic review of reviews. British Journal of Health Psychology, 23(2), 278–295. https://doi.org/10.1111/bjhp.12285
Young, S., Bruce, A., & MacGill, I. (2019). Potential impacts of residential PV and battery storage on Australia’s electricity networks under different tariffs. Energy Policy, 128, 616–627. https://doi.org/10.1016/j.enpol.2019.01.005
Żywiołek, J., Rosak-Szyrocka, J., Khan, M. A., & Sharif, A. (2022). Trust in Renewable Energy as Part of Energy-Saving Knowledge. Energies (Basel), 15(4), 1566–. https://doi.org/10.3390/en15041566
pg. 59
Appendices
Appendix A– Method
This project employs five complementary methods to address the four research questions. Specifically, a (1) literature review, (2) social media analysis, (3) consultative workshops, (4) online survey, and (5) development of a systems map (which draws from all previous phases). The method for each phase is provided in this section.
1.Literature Review
This literature review employed a rapid review approach. Rapid reviews are a method of synthesising research where an overview of evidence is required in a short time (Wright & Bragge, 2018). While a definitive systematic review is more detailed, rapid reviews enable industry, practice and policy bodies to be informed by research evidence sooner. Therefore, as the intent of this review was to help inform upcoming phases of the project, a rapid review was deemed appropriate.
The initial search was performed in November 2022 and a subsequent search occurred in January 2023 to include any papers released after the initial search. The academic literature searches were undertaken in both the Web of Science and Scopus databases while the grey literature was found using Google’s advanced search capabilities. Grey literature represents non-academic literature which consists of industry reports, blog posts, and newspaper articles.
Search Terms & Inclusion Criteria
Search terms were selected based on the synonyms and related terms of the five key concepts in this study: Energy Sector, Energy Actors, Trust, Distrust and Customer Priorities. The project industry reference group helped confirm the rigour of the included terms (see Table 6). Although the searches were not limited to years, only articles published in English were included.
Selection Process and Data Extraction
One reviewer examined all potential titles and where necessary the abstracts for inclusion. Any papers that did not relate to the search terms or inclusion criteria were excluded. Furthermore, any papers that were cited and met the inclusion criteria in the initial selection of papers were also included. Using Microsoft Excel, a literature table was created to extract the desired data from the papers. The paper’s research questions/aims, method, trust measurement, results and data related to the four research questions of this study (customer priorities, trust levels, key actors & leverage points) were extracted from each paper.
Key Concepts
Energy Sector
Search Terms
Energy OR Electricity OR Gas OR Power OR “Energy System” AND Energy Actors
“Sociali*ation agents” OR Retailers OR Distributors OR Agents OR Regulator OR Transmission OR Government OR “Solar Installer” OR “Embedded Network” OR “Consumer Advocate”
Trust
Trust OR Competent OR Honest OR Moral OR Accountable OR Open OR Credible OR Powerful OR Ethical OR Reliable OR Respectful OR Considerate OR Benevolent OR Self-sacrificing OR Integrity OR Cautious OR Genuine OR Sincere OR Transparent OR Distrust
Distrust OR Incompetent OR Dishonest OR Immoral OR Unaccountable OR Closed-off OR Unbelievable OR Weak OR Unethical OR Unreliable OR Disrespectful OR Inconsiderate OR Malevolent OR Self-interested OR “Lack of Integrity” OR Reckless OR Disingenuous OR Insincere OR Unkind OR Greedy OR Secretive OR Threat AND Customer Priorities
Consumer OR “Relationship Quality” OR “Customer Experience” OR “Service Quality” OR “Pain Points” OR End-User OR Customer OR B2C OR Household
pg. 60
Table 6: Key Concepts and Search Terms
AND
2.Social Media Analysis Method
Energy retailers and relevant partners were selected for the social media analysis based on availability of social media posts and relevance to the project. To assess customers’ social media reactions to the energy retailers, Facebook posts were downloaded from the official Facebook page of retailers. To generate a representative and timely sample we constrained our dataset to Facebook pages that had more than 11 posts and had been active in the last 5 months. Data from the time period of 2/1/2004 to 14/11/2022 were collected for the social media analysis in this project. Table 8 below indicates the number of posts per organisation.
To assess customers reactions to different topics, we custom-built wordlists to identify contents of posts representing 9 key drivers of trust and distrust; price, sustainability, outage communication, functionality, customer experience, communication, reputation, control and support (Russell-Bennett et al., 2021) (see Table 7). Analysis of the posts was done using descriptive statistics via SPSS, and then visually represented using graphing software.
Table 7: Wordlists for Key Drivers for Trust and Distrust
Wordlist
economic* bargain affordable call* wait* hold* queue* friendl* unfriendl* pleasant respect* empath* credib* clear* understand* simpl* two-way one-way sustainabl_ green wind* solar* battery efficient renewable geothermal hydro* bio* co2
exorbitant
control in charge
pg. 61
Experience
Driver
Price Customer
Communication
tariff* charg* rate* fee* cost* pric* valu_
money
Sustainability Control
greed* expens*
cheap
Outage hardship crisis flood fire bushfire wildfire Distress disaster suppl* interrupt* blackout* reliabl* disconnec* connec* cut off* power cut*
Support
Table 8: Overview
Number of Social Media Posts by Retailers
pg. 62
Social
Posts by Retailer
of
Media
Organisation Number Percent 1.Ausgrid 9107 29.3 2.Ergon Energy 4228 13.6 3.Actew AGL 2806 9 4.Enova Community Energy 2264 7.3 5.Western Power 1645 5.3
Energy 1426 4.6
Energy 1301 4.2
Australia 974 3.1 9.AGL 808 2.6 10.OVO Energy 802 2.6 11.Powershop Australia 712 2.3 12.Momentum Energy 616 2 13.Red Energy 487 1.6 14.Aurora Energy 472 1.5 15.CS Energy 432 1.4 16.Alinta Energy 425 1.4 17.Glo Bird Energy 399 1.3 18.Simply Energy 391 1.3 19.Mojo Power 389 1.3 20.Tas Gas 385 1.2 21.Energy Locals 286 0.9 22.ReAmped Energy 280 0.9 23.LPE - Queensland’s Electricity Provider 186 0.6 24.CleanCo Queensland 150 0.5 25.Altogether Group 51 0.2 26.Brighte 34 0.1 27.Energy Australia Yallourn 16 0.1 28.Flow Power 12 0 Total 31084 100
6.Lumo
7.Origin
8.Energy
3.Qualitative Workshops
Interactive co-design workshops with energy customers and industry stakeholders were undertaken to gain an understanding of current energy priorities and perceptions of actors in the energy system. Ethics approval was gained through Queensland University of Technology. All workshops occurred in February and March of 2023. To gain insights from both metropolitan and regional areas customer workshops took place in Brisbane, QLD and Port Macquarie, NSW. Customer workshop participants were recruited through a third-party research organisation. Industry workshops were conducted in Sydney, NSW and Perth, WA. Industry participants were recruited via the project Industry Reference Group. A total of 29 people attended across the two customer workshops, with 14 industry attendees across the two industry-focused workshops (Table 9 provides an overview of customer participant demographics, Table 10 provides an overview of industry participant demographics and Table 11 provides a list of the fields of work of the industry participants).
The workshops were 2-hours in duration and involved three main activities. Activity one consisted of participants identifying their top energy priorities from a list that was developed from the findings of the literature review. Activity two involved participants categorising which actors in the energy system they trust, which they distrust and if any actors were missing from the provided list. During activity two industry participants were given the option to reconstruct the energy system in a way that makes the most sense to them, or to make changes to the current system in the activity workbook. Lastly, during activity three participants were asked to identify any changes they would like to see within the energy system. Industry participants were additionally asked whether they thought customers would agree with their recommendations. Co-design activities were later analysed using thematic analysis (Fereday & Muir-Cochrane, 2006) to identify relevant themes and patterns in the data.
Table 9: Characteristics of Customer Workshop Participants (N = 29)
pg. 63
Characteristic Representation Gender Male 38% Female 62% Age Group 18 - 24 Location 25 - 34 17% 35 - 44 17% 45 - 54 17% 55 - 64 28% 65+ 21% Location Brisbane 55% Port Macquarie 45% Household Income Up to $11,000 3% -$31,000 14% -$51,000 7% -$71,000 17% -$91,000 10% -$111,000 14% -$151,000 21% More than $151,000 14% Dwelling Situation Owned 55% Rented 45% Household Composition Single 21% Living with Parents 10% Living with Housemates 3% Living with Partner 28% Living with Partner & Children 28% Living with Extended Family 3% Other 7%
pg. 64 Characteristic Representation Household Energy Systems Solar Panels 31% Batteries 3% Electric Vehicle/s 3% Automated Energy Management 3% Table
Industry Workshop Participants Table 11: Work Fields of Industry Workshop Participants Characteristic Representation Gender Male 57% Female 43% Age Group 18 - 24 0% 25 - 34 14% 35 - 44 36% 45 - 54 29% 55 - 64 21% 65+ 0% Location Sydney 36% Perth 64% Years in Role Up to 10 years 43% -20 years 36% More than 20 years 21% Work Fields of Industry Participants Number Energy Policy and Regulatory Affairs 6 Customer Insights & Engagement 3 Community Law 1 Energy Sector Development and Quality Assurance 1 Energy Research 1 Consulting 1 Community Organiser 1
10: Characteristics of
4.Online Surveys
The online surveys measured items and constructs based on the literature review and overall research questions. The survey was designed to capture both customer and industry viewpoints in order to determine their differences, as such two surveys were created. Qualtrics was used to design and host the survey. To gather the customer sample of 1,000 Australians ages 18 years and above Qualtrics was also employed. Ethics approval was gained through Queensland University of Technology. Key industry stakeholders were also invited to comment on the survey and changes were made based on these. Additionally, seven key questions were added by industry stakeholder partners. The survey was soft launched on the 25th of May (2023), and officially launched on the 29th of May (2023). The industry survey was launched on the 8th of June (2023). Overall, the customer survey captured 1,029 participants once finalised, and the industry survey collected 15 participants though it is estimated to have reached 100+ potential participants (estimate only as a snowballing sampling method was utilised). Survey data quality was ensured by excluding speeders, straight-liners, and nonsensical answers.
The data were then imported into SPSS (version 27), a statistical software package. Here it was cleaned, constructed were summated, and new variables created. A summary of sample characteristics for the customer survey and industry survey are provide in Table 12 and Table 13 respectively.
pg. 65 Characteristic Representation Gender Male 50.2% Female 49.4% Non-Binary 0.2% Prefer not to say 0.2% Age Group 18 - 24 21.2% 25 - 34 32.4% 35 - 44 20.4% 45 - 54 10.5% 55 - 64 5.3% 65+ 10.2% Location New South Wales 32.4% Victoria 25.5% Queensland 20% South Australia 7% Western Australia 10% Tasmania 3.3% Northern Territory 0.2% Australian Capital Territory 1.7% Household Income Up to $10,000 3.2% -$30,000 9.4% -$50,000 12.3% -$71,000 17% -$91,000 13.2% -$100,000 7.4% -$151,000 20.1% More than $151,000 12.3% Prefer
5.1%
not to say
Table 12: Characteristics of Customer Survey Participants (N = 1,029)
Panel Ownership
Group
Table 13: Characteristics of Industry Survey Participants (n = 15)
To analyse the survey a variety of techniques were used including measures of central tendency, counts, independent sample t-tests, exploratory factor analysis (EFA), one-way analysis of variance (ANOVA).
5.Systems Mapping
All phases contributed to the creation of the systems map, with the desktop review and social media analysis providing input on the actors and relationships to be included in the creation of the first map, the workshops and surveys offering amendments and a chance to gauge customer and industry opinions about the map, and the final systems mapping workshop providing a chance to refine and finalise the systems map. Please see research questions three and four in the report for additional information.
pg. 66
Below Grade
2.3% Grade
6.4% Grade
3.6% High
17.9% TAFE
25.4% Undergraduate University 30.2% Post Graduate University 12.7% Doctor/PhD 1.5% Solar
Have Solar
31.4% Do
59.6%
9%
Characteristic Representation Education
10
10
11
School Diploma
or Technical College
Panels
not have Solar Panels
Considering Purchasing Solar Panels
Characteristic Representation Gender Male 60.0% Female 13.3% Prefer not to say 26.7% Age
18
0% 25
16.7% 35
33.5% 45
6.7% 55
13.4% 65+ 13.4% Prefer
6.7% Location New South Wales 6.7% Victoria 13.3% Queensland 13.3% South Australia 13.3% Western Australia 33.3% Tasmania 0% Northern Territory 0% Australian Capital Territory 0% Prefer not to say 20.0% Industry Energy Retailer 6.7% Energy Distributor 6.7% Government 26.7% Social Service Organisation 20.0% Energy Consumer Advocate 13.4% Energy Technology Provider 6.7% Academia 6.7%
- 24
- 34
- 44
- 54
- 64
not to say
Appendix B – Workshop Participants Trust and Distrust in
Note: Numbers indicate how many times an actor was marked as trusted/ distrusted by workshop participants.
pg. 67
Subsystem Actor Consumer Complaints 3 3 2 3 1 0 Consumer service recovery 3 0 2 0 1 1 Consumer Queensland Competition Authority (QCA) 5 0 4 0 1 0 Consumer Consumer 12 0 11 0 1 0 Consumer wrongful disconnection 3 1 2 1 1 0 Consumer blackouts 3 1 2 1 1 1 Consumer affordability 6 2 5 2 1 0 Consumer energy bills 6 4 5 4 1 1 Consumer consumer perceptions 3 2 2 2 1 0 Consumer Pro-sumer 5 0 4 0 1 0 Consumer Energy Networks Australia 2 4 2 3 0 1 Education/Research Academic experts (Universities, etc) 14 0 13 0 1 0 Education/Research CSIRO 16 0 13 0 6 0 Education/Research Solar Schools (Horizon Power) 3 0 2 0 1 0 Education/Research Education sector 6 0 5 0 4 0 Energy Generators 5 0 5 0 1 0 Energy Transmission 1 1 1 0 0 1 Energy Gen-tailers 2 0 2 0 0 0 Energy Distribution 3 3 3 3 0 0 Energy Retailers 2 15 2 9 0 6 Energy Western Power (Retailer) 0 0 0 0 0 0 Media Left learning media (Guardian) 3 14 2 14 2 1 Media Right learning media (Murdoch) 1 20 0 19 2 1 Media RenewEconomy media 2 7 1 6 1 1 Media Social media 2 20 0 19 5 1 Political Federal 2 17 2 15 1 4 Political State 2 16 2 14 3 3 Political Local 3 15 3 13 3 3 Political The Greens 5 16 4 14 1 3 Political Labor 2 21 2 18 0 4 Political Liberals 4 25 4 21 0 5 Political Nationals 3 20 3 18 0 2 Political Teal Independents 4 12 3 10 4 2 Political Unions 5 9 4 8 1 1 TOTAL TRUST TOTAL DISTRUST Total Customer Trust Total Customer Distrust Total Industry Trust Total Industry Distrust
Energy Actors
Note: Numbers indicate how many times an actor was marked as trusted/distrusted by workshop participants.
pg. 68 Subsystem Actor Regulation Ombudsmen 14 1 11 1 11 0 Regulation Clean energy regulator 5 2 3 2 2 0 Regulation Australian Renewable Energy Agency (ARENA) 6 3 4 3 2 0 Regulation Horizon Power (Rural retailer) 0 1 0 1 1 0 Regulation National Electricity Rules (NER) (NEM) 0 1 0 1 0 0 Regulation Australian Energy Market Operator (AEMO) 1 2 1 2 0 0 Regulation National Electricity Law (NEL) 1 2 1 1 0 1 Regulation AEMC 0 1 0 1 0 0 Regulation Australian Energy Regulator (AER) 2 2 2 2 0 0 Regulation Economic Regulation Authority (ERA) 1 2 0 1 1 1 Regulation Energy Policy WA 0 1 0 1 1 0 Regulation Minister for Energy 1 8 1 7 1 2 Regulation Coordinator of Energy 0 2 0 1 0 1 Regulation Electricity Review Board 1 2 1 2 0 0 Regulation National energy performance strategy (consultation) 0 1 0 1 0 0 Regulation Wholesale Energy Market (WEM) 0 1 0 1 0 0 Regulation South West Interconnected System (SWIS) 0 1 0 1 1 0 Stakeholders Farmers 13 0 13 0 0 0 Stakeholders Indigenous land corporations 4 2 3 2 1 0 Stakeholders Energy Consumers Australia (ECA) 2 0 0 0 2 0 Stakeholders Environment advocacy organisations (TEC, ACF, Greenpeace, etc) 8 2 6 2 2 0 Stakeholders Consumers advocacy organisations (Choice, PIAC, CUAC, etc) 8 0 5 0 5 0 Stakeholders Community support organisations 9 0 6 0 5 0 TOTAL TRUST TOTAL DISTRUST Total Customer Trust Total Customer Distrust Total Industry Trust Total Industry Distrust
Appendix C – Correlation between Trust and Distrust
This project employs five complementary methods to address the four research questions. Specifically, a (1) literature review, (2) social media analysis, (3) consultative workshops, (4) online survey, and (5) development of a systems map (which draws from all previous phases). The method for each phase is provided in this section.
**. Correlation is significant at the 0.01 level (2-tailed).
pg. 69
Trust
items) Overall distrust (9 items) Overall Trust (15 items) Pearson Correlation 1 -.303** Sig. (2-tailed) .000 N 1029 1029 Overall Distrust (9 items) Pearson Correlation -.303** 1 Sig. (2-tailed) .000 N 1029 1029
Overall
(15
Appendix D – Trust and Distrust Scores by Vulnerability Indicator
pg. 70
Vulnerability indicator Trust Distrust SEIFA Index (1 to 10 the higher the score the better off the postcode) 1.00 2.00 3.00 4.00 5.00 6.00 7.00 8.00 9.0o 10.00 3.51 3.51 3.43 3.55 3.49 3.30 3.36 3.29 3.26 3.30 1.00 2.00 3.00 4.00 5.00 6.00 7.00 8.00 9.0o 10.00 3.41 3.44 3.28 3.24 3.40 3.57 3.43 3.51 3.39 3.42 p-value = .003** p-value = .050ns Income Low income: Low income: Threshold for a low-income household is $710 (ABS, 2022). 3.42 High income 3.38 n.s. 3.41 High income 3.42 n.s. Solar vs non-solar (No, Yes, Considering purchasing) No: 3.35 Yes: 3.48 Considering purchasing: 3.26 p-value = .004** No: 3.41 Yes: 3.41 Considering purchasing: 3.49 n.s. Education Postgrad v others UP to year 12: 3.40 Postgrad: 3.30 p-value = .046* Below postgrad: 3.42 Postgrad: 3.45 n.s. On a hardship plan? (yes, no) Yes: 3.46 No: 3.37 p-value = .065ns Yes: 3.48 No: 3.41 n.s. How worried are you about your energy bill? Worried: 3.43 Not Worried: 3.38 n.s. Worried: 3.72 Not Worried: 3.14 p-value: 0.001**
Trust and distrust were measured on a 1-5 scale (low to high).
Appendix E – Themes Emerging from the Literature on Energy Priorities
Below provides an overview of the key themes found in the literature review and a short summary of these (see Figure 20)
Theme 1: The Importance of Affordability and Customer Hardship Support
Government, industry, and academic papers all ranked affordability as the most important customer priority for the Energy Sector (Energy Consumers Australia, 2022; Ernst & Young, 2022; AEMC, 2014). For example, Energy Consumers Australia (2022) found that 49% of households believe having affordable energy for all Australians is the most important issue facing the sector. The rising cost of living and particularly of energy has increased the number of customers unable to pay their energy bills (ECA, 2022). Despite this, reports suggest that the number of customers on energy hardship programs has decreased (ECA, 2022). This could be seen as both evidence of deep-rooted distrust as distrusting customers have been found to be more reluctant to engage with and ask for help from their energy providers (Grossman et al., 2021; Lehton & de Carlo, 2019; Büscher & Sumpf, 2015; Mumford & Gray, 2010) and also highlights a lack of initiative from energy providers to proactively assist customers who are going through financial hardships.
Some of this reluctance from customers to engage with their energy providers has been attributed to poor customer service. For example, one study reported that customers – especially those going through financial hardship - felt patronised, looked down upon and humiliated by customer-service representatives (Grossman et al., 2021; Becker et al., 2019). They believe that these staff strictly follow bureaucratic formalities, do not consider the personal circumstances of ordinary people, and ignore the severity of situations thus leading to low levels of trust (Grossman et al., 2021). However, positive experience with these representatives has been shown to foster trust, even when the customer distrusts the organisation they represent. Having this single trusted person a customer can talk to has been found to increase customers contact with the institution and can even enable an understanding of the perspective of the institution (Grossman et al., 2021). Thus showing that personal trust can emerge within a larger picture of distrust in institutions when frontline staff are adequately trained to deal with the complexities of energy hardship.
Theme 2: The Basics vs Values Alignment
While customers continue to rank affordable and reliable energy as their top priorities there is an increasing emphasis in the literature on the importance of value alignment (Bedgood et al., 2023). Customers are wanting energy that is clean, green and socially responsible, however with only 19% of customers reporting being happy with the values of their energy provider (Energy Consumers Australia, 2022), it is clear that customers do not think these priorities are being met. Indeed, there is a trend towards interest in energy independence. Recent studies have found that although reliability and affordability are often considered more important to customers, it is the alignment of values that has the greatest impact on customer satisfaction (Ernst & Young, 2022). With multiple academic studies finding a direct link between customer satisfaction and trust (Driscoll, 1978), these findings together highlight the potential advantages of working closely with energy customers to understand what these values are and how they can be incorporated into the customer journey.
Theme 3: The Desire for Transparent Communication
Customers are continuing to find it difficult to comprehend energy organizations roles, communication, and pricing. While many energy companies are asking customers to accept or adopt their products and services – once they do they are often left feeling confused and unsure about who to contact when they have questions or if issues arise (Ernst & Young, 2022; de Wilde, 2019). Adopting just one product often means that customers need to deal with multiple energy actors (retail store to purchase, contractor to install it, government department to permit it, retailer to incorporate into billing), making the set-up process long and confusing.
This lack of transparency and confusion is found across multiple actors in the energy system. Surveys have revealed that communication from energy providers is the least satisfactory aspect during the resolution of a power outage (ECA, 2022). Furthermore, confusing tariffs and bill structures mean that many customers are struggling to understand how companies charge for their energy consumption and if they are on the best energy plan for their household (Grossman et al., 2020). This issue is also present in the service and retrofitting space with one study finding that the majority of participants (70%) were struggling with what they termed the “opaqueness” of quotes and procedural communication (de Wilde, 2019). The difficulty of deciphering energy related communication results in customers feeling overwhelmed and hopeless, which reduces trust and often drives them to give up and disengage (ECA, 2022). For example, one customer that participated in a study exploring the link between trust and energy poverty mentioned that “I avoid contact with energy suppliers because I never manage to get the answers I need” (Grossman et al., 2020).
pg. 71
Theme 4: The Call for a Clearer Distinction Between the Role of Government and Industry in the Energy Transition
While the literature consistently finds low customer trust in both the Government and energy organisations, customers perceive the government as entity that is meant to be responsible for representing and serving the interests of the people, whereas industry is primarily perceived to be focused on profits and appeasing their shareholders. Therefore, instances where Government and industry are closely intertwined – such as in the energy system – can make customers question whether their interests are being properly considered (Grossman et al., 2021). For example, one study found that customers believe that the government is too influenced by energy companies through profits and lobbying (Becket et al., 2019) and that this entanglement has resulted in collusion, higher prices, and less transparency in the sector (Becket et al., 2019; Mumford & Gray, 2010). Furthermore, customers perceive that any failure of the government to adequately regulate shows that they are allowing energy companies to work together to fix prices, which undermines the suggested benefit of a competitive private market and leads to distrust (Becket et al., 2019).
Furthermore, the essential nature of electricity for living has meant that many customers simply do not believe energy should be run on a for-profit basis as they perceive this to result in a focus on positive outcomes for shareholders at the expense of the customer (Horne et al., 2021). While some reports do suggest that the privatisation of the Australian energy market has resulted in increased prices and a decline in safety and reliability for customers (Nepal & Foster, 2015; Quiggin, 2014), different methods of measurement has resulted in other reports finding that this isn’t necessarily the case (Chester, 2015). Nonetheless, the simple fact that these negative perceptions do exist suggests that strategies need to be implemented to address them and make the role between government and industry clearer – especially when how decisions are made and by whom.
Importance of Affordability and Consumer Support
Affordability is consistently ranked as the most important customer priority, including in an ECA (2022) sudy that found 49% of customers afforable energy for all is the most important issues for the energy sector. becoming even more important as cost of living increases.
The number of customers on hardship programs has decreased, potentially indicating distrust as consumers are less likely to engage/ask for help from energy providers when experiencing distrust (Grossman et al., 2021; Lehton & de Carlo, 2019; Büscher & Sumpf, 2015; Mumford & Gray, 2010).
Evidence indicates that customer service can be both the cause and the cure for lack of engagement (Grossman et al., 2021).
Customers care about the ‘basics’ provided by an affordable, reliable, responsive energy system.
However, increasingly customers are looking to see that their values and priorities are in alignment with those of their energy companies.
A recent ECA (2022) study found only 19% of customers are happy with the values of their energy provider.
Customer desire for energy independence may be values-driven, not just a reflection of afforadability and reliability-seeking. Alignment of values has a substantial impact on customer satisfaction (Ernst & Young, 2022) and trust (Driscoll, 1978).
Alignment of values has a substantial impact on customer satisfaction (Ernst & Young, 2022) and trust (Driscoll, 1978).
Customers are continuing to find it difficult to comprehend energy organizations roles, communication, and pricing.
Adopting just one product often means that customers need to deal with multiple energy actors (retail store to purchase, contractor if installation needed, government department to permit it, retailer to incorporate into billing), making the set-up process long and confusing.
Customers report issues with communication during outages (ECA, 2022), confusing pricing (Grossman et al., 2020), and retrofitting (de Wilde, 2019).
Communication issues lead customers to disengage.
Customers perceive different roles for government and industry in the energy system: the government is seen as an entity that is meant to be responsible for representing and serving the interests of the people, whereas industry is primarily perceived to be focused on profits and appeasing their shareholders.
Customers think government is too influenced by industry (Becket et al., 2019), believing too much collaboration between government undermines the competitive market (Becket et al., 2019).
Conflicting evidence emerges from the literature on the perceptions and benefits of the privatised energy market (Nepal & Foster, 2015; Quiggin, 2014; Chester, 2015).
pg. 72
Figure 20: Four Customer Priority Themes in the Literature
The Basics vs Values Alignment
Desire for Transparent Communication
Clearer Roles for Government and Industry
Appendix F – Customer Ranking of Energy Priorities
pg. 73
(Workshop) Place Priority Description Votes % voted 1 P1 Affordable energy 28 0.97 2 P6 Reliable energy (e.g., I always have access to the energy I need when I need it – no brownouts/blackouts) 21 0.72
P22 A simpler way to compare energy plans/offers between companies 21 0.72 4 P24 A longer-term energy vision from government 19 0.66 5 P2 Clear energy tariffs/plans so I know I’ve chosen the right one for my household 17 0.59 5 P14 Incentives for upgrading the energy efficiency of my home (e.g., insulation, appliances, solar). 17 0.59 5 P18 Fast resolution of outages and clear communication throughout 17 0.59 5 P21 Green, clean, socially responsible energy 17 0.59
P25 An assurance that the unintended consequences of energy changes are being dealt with properly (e.g., a program for recycling old, inefficient appliances when customers upgrade). 16 0.55 10 P16 Access to both digital portals/information AND a human contact 14 0.48 11 P12 Increased energy efficiency standards for new homes and renovations 13 0.45 11 P20 Timely and accurate responses from energy providers to my queries or needs 13 0.45 13 P10 Treating customers experiencing vulnerability with respect 12 0.41 13 P19 The ability to customise my energy plan (including whether prices are flat or vary by time) to suit me 12 0.41 15 P8 Easily being able to find out if I am eligible for assistance 11 0.38 15 P15 Single point of contact and information for any questions I have about my energy (including use, bills, changes, renovations, etc) 11 0.38 17 P4 Energy plans with flat prices so I know exactly how much I will pay each cycle 10 0.34 17 P11 Energy independence (e.g., generating my own energy) 10 0.34 19 P7 Assistance to help customers experiencing vulnerability to pay energy bills and avoid disconnection 9 0.31 19 P13 Energy efficiency education for households 9 0.31 19 P17 Virtual/augmented reality view of my energy use in real-time as well as how new appliances/services would change this 9 0.31 22 P9 Encouraging households to purchase efficient appliances 8 0.28 23 P23 A platform facilitated by an objective third-party where my opinions on energy are heard and considered 7 0.24 24 P3 Smaller, more frequent energy bills (rather than less frequent, larger bills) 6 0.21 25 P5 Pre-paid energy plans (e.g., paid in advance like pre-paid phone plans) 5 0.17
2
9
Appendix G – Industry Ranking of Energy Priorities
4
pg. 74
(Workshop) Place Priority Description Votes % voted 1 P1 Affordable energy 13 0.93 2 P18 Fast resolution of outages and clear communication throughout 12 0.86 2 P21 Green, clean, socially responsible energy 12 0.86
P6 Reliable energy (e.g., I always have access to the energy I need when I need it – no brownouts/blackouts) 10 0.71 5 P7 Assistance to help customers experiencing vulnerability to pay energy bills and avoid disconnection 9 0.64 6 P10 Treating customers experiencing vulnerability with respect 7 0.50 6 P15 Single point of contact and information for any questions I have about my energy (including use, bills, changes, renovations, etc) 7 0.50 6 P20 Timely and accurate responses from energy providers to my queries or needs 7 0.50 6 P24 A longer-term energy vision from government 7 0.50 10 P8 Easily being able to find out if I am eligible for assistance 6 0.43 10 P16 Access to both digital portals/information AND a human contact 6 0.43 12 P4 Energy plans with flat prices so I know exactly how much I will pay each cycle 5 0.36 12 P14 Incentives for upgrading the energy efficiency of my home (e.g., insulation, appliances, solar). 5 0.36 12 P22 A simpler way to compare energy plans/offers between companies 5 0.36 15 P2 Clear energy tariffs/plans so I know I’ve chosen the right one for my household 4 0.29 15 P3 Smaller, more frequent energy bills (rather than less frequent, larger bills) 4 0.29 15 P9 Encouraging households to purchase efficient appliances 4 0.29 15 P13 Energy efficiency education for households 4 0.29 19 P11 Energy independence (e.g., generating my own energy) 3 0.21 19 P12 Increased energy efficiency standards for new homes and renovations 3 0.21 19 P19 The ability to customise my energy plan (including whether prices are flat or vary by time) to suit me 3 0.21
P25 An assurance that the unintended consequences of energy changes are being dealt with properly (e.g., a program for recycling old, inefficient appliances when customers upgrade). 3 0.21 20 P5 Pre-paid energy plans (e.g., paid in advance like pre-paid phone plans) 2 0.14 20 P23 A platform facilitated by an objective third-party where my opinions on energy are heard and considered 2 0.14 21 P17 Virtual/augmented reality view of my energy use in real-time as well as how new appliances/services would change this 1 0.07
19
Appendix H - Emoji Reactions on Energy Organisations Facebook
Posts for each of the 9 Factors
The following graphs offer a representation of the average number of emoji of a certain type tend to be used by customers viewing posts that either do or do not discuss a specific factor (e.g., functionality, price, etc).


pg. 75


pg. 76
Appendix I – List of Energy System Actors from the Literature
Source Research Question/s
Liu, L., Vrieling, L., Perlaviciute, G., Bouman, T., & Steg, L. (2022). The role of trust in public acceptability of energy projects: Integrity versus competence. ENVIRONMENTAL RESEARCH COMMUNICATIONS, 4(3), 35003–. https://doi.org/10.1088/25157620/ac5718
Stenner, K., Frederiks, E. R., Hobman, E. V., & Cook, S. (2017). Willingness to participate in direct load control: The role of consumer distrust. Applied Energy, 189, 76–88. https://doi. org/10.1016/j.apenergy.2016.10.099
Mumford, J., & Gray, D. (2010). Consumer engagement in alternative energy—Can the regulators and suppliers be trusted? Energy Policy, 38(6), 2664–2671. https://doi. org/10.1016/j.enpol.2009.05.054
Offermann-van Heek, J., Katrin Arning, Anika Linzenich, & Martina Ziefle. (2018). Trust and Distrust in Carbon Capture and Utilization Industry as Relevant Factors for the Acceptance of Carbon-Based Products. Frontiers in Energy Research, 6. https://doi. org/10.3389/fenrg.2018.00073
To what extent integrity-based and competence-based trust in the NAM are associated with how acceptable the public finds Energy Projects
Bronfman, N. C., Jiménez, R. B., Arevalo, P. C., & Cifuentes, L. A. (2015). Public Acceptance of Electricity Generation Sources: The Role of Trust in Regulatory Institutions. Energy & Environment (Essex, England), 26(3), 349–368. https://doi. org/10.1260/0958-305X.26.3.349
1. Investigate whether self-professed distrust in the energy company is associated with less willingness to subscribe to the program
2. Does providing randomly selected participants with a trust-restoring message upfront influence their responses (acceptance)
How are consumer expectations about future energy being formed and who is expected to deliver?
Actor/Trustee
1. How do potential users evaluate diverse potential benefits, potential barriers, and the acceptance of different CCU products? (RQ1)
2. How might the participants view different information sources as differently credible? (RQ2)
3. What information do potential users need about innovative (CCU) products and the corresponding manufacturing company and how should the marketing of CCU products be oriented? (RQ3)
4. Which factors and dimensions are relevant for trust and distrust in CCU companies? (RQ4)
5. How strong are potential connections between diverse dimensions of (dis)trust, credibility, and the perception of CCU products? (RQ5)
What are the characteristics that influence different dimensionsof public trust in regulatory institutions and what is their impact on social acceptability judgments of electricity generation sources?
Regulators & energy actors broadly (NGOs, regulators, energy companies, different government levels, scientists, community members)
Range of energy actors but focus on energy & chemistry companies
Regulatory Institutions & Sources of energy
pg. 77
NAM (Dutch oil & gas supplier)
Australian Energy Company
Source Research Question/s
Truong, D., Davidson, D. J., & Parkins, J. R. (2019). Context matters: Fracking attitudes, knowledge and trust in three communities in Alberta, Canada. The Extractive Industries and Society, 6(4), 1325–1332. https://doi. org/10.1016/j.exis.2019.09.004
Przepiorka, W., Horne, C., Leerstoel Buskens, & Social Networks, S. and I.(2020). How Can Consumer Trust in Energy Utilities be Increased? The Effectiveness of Prosocial, Proenvironmental, and Service-Oriented Investments as Signals of Trustworthiness. Organization & Environment, 33(2), 262–284. https://doi. org/10.1177/1086026618803729
What are the public perspectives regarding fracking in regions where fracking is operating or will be operated?
In what ways do local contextual factors help shape these attitudes?
Does evidence of utility prosocial behavior increase trust in the utility?
Does evidence of utility proenvironmental behavior increase trust in the utility?
Does evidence of utility service-oriented behavior increase trust in the utility?
Does evidence of utility prosocial, proenvironmental, and service-oriented behaviors increase consumer willingness to participate in a utility program. These effects will be mediated by consumer trust in the utility.”
Actor/Trustee
Government, scientists, politicians and the media
Focus on Energy Utility companies but tests trust of several energy actors
Koirala, B. P., Araghi, Y., Kroesen, M., Ghorbani, A., Hakvoort, R. A., & Herder, P. M. (2018). Trust, awareness, and independence: Insights from a socio-psychological factor analysis of citizen knowledge and participation in community energy systems. Energy Research & Social Science, 38, 33–40. https://doi.org/10.1016/j. erss.2018.01.009
Kalkbrenner, B. J., & Roosen, J. (2016). Citizens’ willingness to participate in local renewable energy projects: The role of community and trust in Germany. Energy Research & Social Science, 13, 60–70. https://doi. org/10.1016/j.erss.2015.12.006
Can a participant’s willingness to participate in community energy systems be predicted using demographic, socioeconomic, socio-institutional and environmental factors?
Fellow consumers in the same energy community
Nader, L., & Milleron, N. (1979). Dimensions of the “people problem” in energy research and “the” factual basis of dispersed energy futures. Energy (Oxford), 4(5), 953–967. https://doi. org/10.1016/0360-5442(79)90025-2
Craig, C. S., & McCann, J. M. (1978). Assessing Communication Effects on Energy Conservation. The Journal of Consumer Research, 5(2), 82–88. https://doi.org/10.1086/208718
1.Are citizens willing to participate in community energy projects?
2.How does community identity influence the willingness to participate in community energy projects?
3.How does trust influence the willingness to participate in community energy projects?
4.How do social norms influence the willingness to participate in community energy projects?
What are the socio-cultural problems in the energy sector?
General Trust (propensity to trust)
Mainly focuses on trust in Governments
What is the impact of source credibility (trust) and repetition of messaging on consumer engagement and behaviour change in the Energy sector?
Energy company vs Public service commission
pg. 78
Source Research Question/s
Wiersma, B., & Devine-Wright, P. (2014). Decentralising energy: comparing the drivers and influencers of projects led by public, private, community and third sector actors. Contemporary Social Science, 9(4), 456–470. https://doi.org/10.1080/21582 041.2014.981757
Owens, S., & Driffill, L. (2008). How to change attitudes and behaviours in the context of energy. Energy Policy, 36(12), 4412–4418. https://doi. org/10.1016/j.enpol.2008.09.031
HEBERLEIN, T. A., & WARRINER, G. K.(1983). The influence of price and attitude on shifting residential electricity consumption from on-to-offpeak periods. Journal of Economic Psychology, 4(1-2), 107–130. https:// doi.org/10.1016/0167-4870(83)90021-1
Awaworyi Churchill, S., & Smyth, R.(2020). Ethnic diversity, energy poverty and the mediating role of trust: Evidence from household panel data for Australia. Energy Economics, 86, 104663–. https://doi.org/10.1016/j. eneco.2020.104663
Volland, B. (2017). The role of risk and trust attitudes in explaining residential energy demand: Evidence from the United Kingdom. Ecological Economics, 132, 14–30. https://doi. org/10.1016/j.ecolecon.2016.10.002
Carattini, S., Baranzini, A., & Roca, J.(2015). Unconventional Determinants of Greenhouse Gas Emissions: The role of trust: Unconventional Determinants of Greenhouse Gas Emissions. Environmental Policy and Governance, 25(4), 243–257. https:// doi.org/10.1002/eet.1685
Caferra, R., Colasante, A., & Morone, A.(2021). The less you burn, the more we earn: The role of social and political trust on energy-saving behaviour in Europe. Energy Research & Social Science, 71, 101812–. https://doi. org/10.1016/j.erss.2020.101812
Greenberg, M. R. (2014). Energy policy and research: The underappreciation of trust. Energy Research & Social Science, 1, 152–160. https://doi. org/10.1016/j.erss.2014.02.004
1.What drives the emergence of DE initiatives, and what influencers shape their evolution?
2.To what extent do these drivers and influencers differ, depending upon the sector of the instigating actor (public, private, third, community)?
Actor/Trustee
Community, private sector, public sector and third party
How to change attitudes and behaviours in the context of energy?
Focus on consumers
How do residential electricity customers shift consumption in response to a time differentiated price, and what role do attitudes play in this shift?
What is the impact of ethnic diversity on household energy poverty and how is this related to trust?
Energy companies
What is the relationship between risk attitudes, trust propensity and energy consumption at the household level?
General Trust & trust in neighbours
General Trust (propensity to trust)
Does trust impact greenhouse gas emissions?
General Trust (propensity to trust)
Does pro-social behaviour, as measured by a combination of social and political trust lead to pro-environmental behaviour (energy saving)?
Government & Social (interpersonal) trust
How much does the public trust energy researchers and managers compared to others?
Why is trust important for energy research and policy?
Institutional, Government & Interpersonal Trust
pg. 79
Source Research Question/s
Mezger, A., Cabanelas, P., Cabiddu, F., & Rüdiger, K. (2020). What does it matter for trust of green consumers? An application to German electricity market. Journal of Cleaner Production, 242, 118484–. https://doi. org/10.1016/j.jclepro.2019.118484
Greenberg, M., Mayer, H., & Powers, C. (2011). Public preferences for environmental management practices at DOE’s nuclear waste sites: Public Preferences for Environmental Management Practices at DOE’s Nuclear Waste Sitess. Remediation (New York, N.Y.), 21(2), 117–131. https://doi. org/10.1002/rem.20285
Büscher, C., & Sumpf, P. (2015). “Trust” and “confidence” as socio-technical problems in the transformation of energy systems. Energy, Sustainability and Society, 5(1), 1–13. https://doi.org/10.1186/s13705-0150063-7
Liu, L., Bouman, T., Perlaviciute, G., & Steg, L. (2019). Effects of trust and public participation on acceptability of renewable energy projects in the Netherlands and China. Energy Research & Social Science, 53, 137–144. https://doi.org/10.1016/j. erss.2019.03.006
de Wilde, M., & Spaargaren, G. (2019). Designing trust: how strategic intermediaries choreograph homeowners’ low-carbon retrofit experience. Building Research and Information : the International Journal of Research, Development and Demonstration, 47(4), 362–374. https://doi.org/10.1080 /09613218.2018.1443256
Huijts, N. M. A., Molin, E. J. E., & Steg, L. (2012). Psychological factors influencing sustainable energy technology acceptance: A review-based comprehensive framework. Renewable & Sustainable Energy Reviews, 16(1), 525–531. https://doi.org/10.1016/j. rser.2011.08.018
Familia, T., & Horne, C. (2022). Customer trust in their utility company and interest in household-level battery storage. Applied Energy, 324(C), 119772–. https://doi.org/10.1016/j. apenergy.2022.119772
Actor/Trustee
Develop a measure of trust of green consumers. Institutional
What is the publics preferences for the management of nuclear waste sites?
Focus on Government and contractors of energy projects
What are the prerequisites of the public’s participation in the new energy system: the capacity of social mechanisms, such as trust, for the solution of social problems?
Consumer trust towards all actors in system
How does trust in agents who are responsible for renewable energy projects and public influence over decisions regarding these projects influence public acceptability of these projects?
How do energy sector intermediaries choreograph low-carbon retrofit experiences of homeowners through the design of a ‘customer journey’?
Actors responsible for renewable energy projects
What are the psychological factors that influence the acceptance of sustainable energy technology?
Trust in the expertise of intermediaries, trust in neighbours & trust in the technology
H1: Customer trust in their electric utility will be negatively associated with interest in battery storage.
H2: Perceptions that battery storage is financially and environmentally beneficial will increase interest.
Trust in actors responsible for energy technology
Utility Company
pg. 80
Utz, M., Johanning, S., Roth, T., Bruckner, T., & Strüker, J. (2023). From ambivalence to trust: Using blockchain in customer loyalty programs. International Journal of Information Management, 68, 102496–. https://doi. org/10.1016/j.ijinfomgt.2022.102496
Horne, C., Familia, T., & Huddart Kennedy, E. (2022). California Consumers’ Beliefs and Trust in Electric Utilities. Socius : Sociological Research for a Dynamic World, 8, 237802312211057–. https://doi. org/10.1177/23780231221105708
RQ1: How can blockchain technology enhance institution-based trust and reduce distrust in electricity suppliers? RQ2: How can a trust-based customer loyalty program be designed with blockchain technology?
1.Consumers’ beliefs that their utility company provides a reliable supply of electricity will be positively associated with trust.
2.Consumers’ beliefs that their utility company provides good customer service will be positively associated with trust.
3.Consumers’ beliefs that their utility company is doing a good job managing electricity costs will be positively associated with trust.
4: Consumers’ beliefs that their utility company is adequately managing the grid to prevent wildfires will be positively associated with trust.
Actor/Trustee
Electricity supplier
Faure, C., Guetlein, M.-C., Schleich, J., Tu, G., Whitmarsh, L., & Whittle, C.(2022). Household acceptability of energy efficiency policies in the European Union: Policy characteristics trade-offs and the role of trust in government and environmental identity. Ecological Economics, 192, 107267–. https://doi.org/10.1016/j.ecolecon.2021.107267
Hu, G., Wang, J., Laila, U., Fahad, S., & Li, J. (2022). Evaluating households’ community participation: Does community trust play any role in sustainable development? Frontiers in Environmental Science, 10. https:// doi.org/10.3389/fenvs.2022.951262
H6: Trust in government increases the acceptability of higher energy consumption reduction targets H7: Trust in government increases the acceptability of coercive policy instruments
The Government
Hypothesis H1. The social network has a significant positive impact on the choice of farmers to participate in cooperatives.
Hypothesis H2. Online learning has a significant positive impact on farmers’ choice to participate in cooperatives.
Hypothesis H3. Network interaction has a significant positive impact on farmers’ choice to participate in cooperatives.
Hypothesis H4. Network reciprocity has a significant positive impact on farmers choosing to participate in cooperatives.
Hypothesis H5. Network trust has a significant positive impact on farmers choosing to participate in cooperatives.
Other in the community
pg. 81
Source Research Question/s
Utility Company
Appendix J – Actors and Factors Associated with Trust in the Australian Energy System
(own retailer, other retailers in market)
2.Political
3.Regulation Subsystem
Energy Ombudsman (ACT Civil and Administrative Tribunal, Energy & Water Ombudsman NSW, Energy and Water Ombudsman QLD, Energy Ombudsman TAS, Energy and Water Ombudsman SA, Energy and Water Ombudsman (VIC), Ombudsman NT, Energy and Water Ombudsman WA)
Regulator
for Energy (WA)
(NEL)
(NER)
Energy Market Commission (AEMC)
Energy Consumers Australia (ECA)
pg. 82
Subsystem Literature Industry experts Consumers
Coal suppliers
X Gas suppliers X Gen-tailers X X Retailers
X X X Distribution X X Transmission X X Generation – Fossil
X X Generation – Renewables
X X Hard to understand tariff
X X Coal phase out X Renewables increase X
1.Energy Supply Subsystem
(brown, black)
Fuels
(solar, hydro, wind)
types
Subsystem Federal government X X X State government X X Local government X The Greens X Labor X Teal Independents X Independents X Liberals X Nationals X International obligations X National Cabinet/Energy Ministers X Incumbent energy providers X NIMBYs X National energy performance strategy X Unions X X Energy Networks Australia X Environmental advocacy organisations X
X
X Minister
X Energy
WA X National
X
X Coordinator
Energy X
X
X
X X
Clean Energy
Policy
Electricity Law
National Electricity Rules
of
Wholesale Electricity Market Rules
Australian
Energy Regulator (AER)
Building standards and Energy Efficiency National Construction code / NABERS / BASIX
Economic Regulation Authority
Laws (MID QLD, NSW SEPP 2007, ACL (Australian Consumer Law), SOCI Act 2018, ESC / IPART / QLD CA etc)
Consumer Goods & Services (3rd parties: Real Estate Agents, Body corporates, Facility Managers; Electricians; EV Manufacturers; Solar panel installers; Energy Efficient appliances; Energy audits)
Outrage (i.e., anger)
pg. 83 Subsystem Literature Industry experts Consumers NT Power
X Electricity Review Board X Australian
X
X
and Water Corporation
Energy Market Operator (AEMO)
Australian
X
X
X
Local Newspaper X Local Radio X Social Media X Community Groups on Social Media X X Left Leaning Media X Right Leaning Media X Academic Experts X CSIRO X Renew Economy X X Word of Mouth (WOM), Friends & Family X Interest groups e.g. farmers X
Subsystem Consumer Attitudes X Satisfactory service recovery X Social license RE: land use etc X Poor response to Blackouts X Wrongful disconnection X Support for energy system infrastructure etc. X subsidies and incentives X Energy Bills X Household Solar PV impact X EVs impact X Electricians X X X Expectations of future energy system X Cost of living X Batteries X Consumer Distrust X X X Consumers advocacy organisations (Choice,
etc) X Reliability X Affordability X X X Consumer Trust X X X
4. Information Subsystem
5. Consumer
PIAC, CUAC,
X Complaints X
X A.I. impacts X Customer Data X
Appendix K – Verbal and Workbook Quotes For Regulation Change
Relevant Quotes from Workshops
Verbal Quotes
“There needs to be a national approach to the provision of energy – it is an essential service. It should be government owned and supplied on a non-for-profit basis” – Customer
“Distribution should be owned by the Australian government” – Customer
“How does the government get money without funding?” – Customer
“We need to stop privatising everything – it makes things much more expensive” –Customer
“Don’t let overseas government and businesses buy into our state’s power grid. Australian electricity should be owned by the Australian government” –Customer
“Deregulation is bad. The government needs to buy back” –Customer
“They need to look at the long term. Look what happened to the banks in 2008, they are too short-sighted” –Customer
“Bringing everything under federal control helps with over-investment and efficiency” –Industry
“We need a long-term plan that gets reviewed every 2 years to look at the small changes instead of just having reviews for big changes every 5. You can’t keep up with technology changes as they happen every 18 months. Having shorter reviews means that you can discuss what is the new thing that is coming in that is going to impact our long-term goals. You can then correct for that instead of getting to the review period and having a mess of a system to fix and no long-term plan” –Industry
Desired Changes Identified in Workbook
• Government ownership of grid and them setting prices at non-for-profit rates –Customer
• More government intervention in electricity retailers and prices. Slowly buy back retailers or more checks on retailers. Limit retailers. –Customer
• Re-establish full government ownership of electricity. So as to provide equitable distribution and a fair cost. Decentralising the government. Acquiring full ownership over the next 40/50 years. –Customer
• Government regulation or buy back of energy retail/distribution. –Customer
• More energy regulation in government –Customer
• Long-term plans and roadmap for Australian energy –Customer
• Education packages for consumers and politicians on the science behind the transition – Customer
• Reduce corruption and lobbying within government from fossil fuel companies and shareholders –Customer
• No price fixing or collusion between producers – Customer
• Make energy providers accountable. Profits to go to infrastructure and not shareholders. –Customer
• Consolidation of transmission / network / retail etc. (with regulation). Regulation of entire supply chain in a co-ordinated way –Industry.
pg. 84


B4 Opportunity Assessment Project title Project title www.racefor2030.com.au