

National Bidirectional EV Charging Roadmap V2G Energy Market Modelling Report 3 November 2024


National Bidirectional EV Charging Roadmap V2G Energy Market Modelling Report 3 November 2024


Endgame Economics has partnered with enX to estimate the benefit of enabling Vehicle-to-Grid (V2G) in the National Electricity Market (NEM) for ARENA and RACE for 2030. V2G is a specific type of bidirectional EV charging that allows energy stored in a vehicle’s battery to be discharged into a grid-coupled electricity system. This is different from vehicle-to-load (V2L) or vehicle-to-home/building (V2H/B), in which the vehicle remains electrically separated from the grid.
As coal plants will be phased out in the coming years, the system will have greater firming needs to ensure electricity demand can be met when renewable output is low. At the same time, electrical vehicle (EV) uptake is expected to rise quickly, and making use of energy storage within Australia's EV fleet could provide substantial firming capacity, benefiting EV owners and electricity consumers more broadly.
This study estimates the wholesale market and distribution network cost savings through V2G in the NEM between FY2027 and FY2050.
As the NEM is in a period of transition, there is some uncertainty regarding whether all the renewable policies and key infrastructures will be delayed on time and whether wind or solar will make up the majority of the generation mix. Therefore, while using assumptions broadly consistent with the 2024 ISP Step Change, our study has covered two scenarios that differ in the timing of the delivery of key renewable policies and infrastructure as well as the speed of new wind entering the market.
We have also modelled different V2G uptake rates as well as various V2G operating models with different proportions of static time-of-use (ToU) tariff profiles and more wholesale market responsive operations.
In addition, we have undertaken a high-level analysis to assess the potential distribution network saving due to V2G operation offsetting the need for network augmentations. Our modelling has included a high and a low estimate to provide a credible range of potential network benefits.
We conclude with an analysis of aggregate benefits net of potential customer installation costs.
In a future high renewable penetration world, V2G reduces firming needs from grid-connected generation and storage assets. This will provide a wholesale market benefit by reducing the associated investment and operation costs.
The rate of V2G uptake has a large impact on the V2G benefit. The wholesale market benefit, consisting of reduced generation CAPEX, OPEX and emissions, is between $0.7bn to $1.2bn in the slow uptake scenario and is between $1.7bn to $2.7bn in the fast uptake scenario.
V2G operating according to market signals provide greater wholesale benefit than batteries with ToU tariff-responsive behaviour. This benefit could be further increased by enabling more daylight-hour charging.
V2G operation also contributes to reduced distribution network costs by reducing local peak demand. We estimate the associated cost savings are between $0.6bn and $2.4 bn with fast uptake and between $0.3bn and $1bn with slow uptake. This is in addition to the wholesale market benefit reported above.

• Delayed infrastructure
• Stringent wind build limit
• Less orchestrated behind-the-meter BESS
• Speed of V2G uptake exceeds ISP Step Change
• 2050: 16 GW, 90 GWh
• State targets met
• Mild wind build limit
• Behind-the-meter BESS orchestration as per the ISP
• Speed of V2G uptake lags behind ISP Step Change
• 2050: 8GW, 44 GWh
Market-weighted
• 80% default operation market V2G
• 20% default operation ToU trace V2G
ToU-weighted
• 20% default operation market V2G
• 80% default operation ToU trace V2G *More detailed assumptions are shown in the next slide ** Adjusted for the latest EV uptake projections in the 2024 ESOO
Day-weighted
• 80% day-weighted market V2G
• 20% day-weighted ToU trace V2G
The National Electricity Market is in a state of flux as coal generation is phased out to achieve the renewable transition. As such, there is no consensus view on the future energy outlook, with specific uncertainty surrounding the delivery of critical infrastructures and the composition of the generation mix. We have modelled two outlooks to capture this uncertainty:
The More wind scenario is based on the ISP step change, and timely entry of major infrastructures, on-time delivery of state targets and only mild limits on wind entry.
The More solar scenario reflects a less coordinated transition, with a delayed delivery schedule of infrastructures and state renewable targets and tighter wind build limits.
We have considered two uptake scenarios, quantified by varying installed power (in GW) and capacity (in GWh) of storage representing the EV fleet.
The Fast uptake scenario reflects a more aggressive view of V2G uptake, reaching approximately 16 GW, 90 GWh of storage by 2050 NEM-wide, significantly faster than the ISP.
The Slow uptake scenario is more conservative, reaching around 8GW and 44 GWh of storage by 2050 NEM-wide, lagging behind ISP projections.
Both these scenarios are considered very feasible and are based on a range of conservative assumptions around technology trends and pricing. The fast uptake scenario may be supported by additional national policy measures.
For context, the rate of V2G uptake
The contribution of EVs to the grid is predicated on more than just fleet size – the charging and discharging behaviour. Vehicle availability to respond to market signals can fundamentally change their impact.
The Market-weighted operating pattern assumes that 80% of the EV fleet responds to market signals, with the remaining 20% operating on fixed ToU schedules. The ToU-weighted scenario inverts this, with 20% of the fleet market responsive and 80% on static ToU schedules. The Day-weighted pattern has the same split as the Market-weighted pattern but assumes more EVs are available for charging during the middle of the day.
The day-weighted scenario could play out under a number of plausible conditions including the greater in workplace / carpark charging, public transport usage or autonomous vehicles. The transition to increased daytime charging is assumed to occur gradually.
Largely based on the ISP Step Change. State renewable energy targets are delivered on time. An orderly exit of coal occurs and is replaced by timely VRE investment. Distributed BESS (a.k.a. Virtual Power Plant or VPP) orchestration as per the ISP Step Change.
• Mild wind build limit of 1.5GW/year, relaxed by 250MW/year post-2030, capped at 3GW/year.
• ISP Optimal Development Path Transmission and Pumpedhydro energy storage (PHES) delivery timeline.
• Exclude the full 82% Capacity Invest Scheme (CIS) target.
Delayed delivery of critical infrastructure, such as transmission and PHES. Slower build out of VRE due to more stringent VRE build limit. Government renewable targets not necessarily met. A subdued orchestration level of distributed BESS.
• Wind build limit of 1GW/year, relaxed by 250MW/year post2030, capped at 2GW/year.
• Snowy 2.0 enters in FY2032 and Borumba enters in FY2035. No new PHES before FY2035.
• VNI West and Marinus 1 in FY2033, No Marinus 2.
• Orchestration for behind-the-meter batteries based on ISP Progressive Change scenario.
In both scenarios, we will assume a daily 800 TJ/day gas-powered generation (GPG) limit in southern NEM (ex. QLD). This assumption captures the potential supply limitation of natural gas and avoids overestimating GPG’s ability to provide firming in the future system.
EV uptake projections (millions)
V2G uptake projections (percent of new EVs sold)
While it is clear that Australia is at the early stages of a broad-scale transition to electric mobility (e-mobility) across all road transport sectors, the rate of the change is inherently uncertain.
The most current national forecast is included in AEMO’s 2024 Electricity Statement of Opportunities. This assumes a slightly slower rate of uptake compared to the previous forecasts included in the 2024 ISP. For this long-range market modelling exercise, we used the ISP figures for overall EV load growth estimates. However, V2G uptake assumptions have been based on the more conservation ESOO 2024 EV uptake projections estimates. In both cases, we base our forecasts on the ‘Step Change’ scenario which is generally accepted as the central case for power system planning purposes.
V2G uptake was applied as a percent of new EV sales. These vehicles were taken to be activity enrolled in a V2G arrangement. We used the residential fraction over total NEM EV uptake and did not assume participation of any vehicles outside of the residentials sector.
Future V2G uptake assumptions are ambitious by historic standards but achievable when considering this technology’s potential for mass market adoption. Compared to the 7.9 million EVs expected to be in use by 2040, between 0.595 and 1.45 million were estimated to be V2G active in the slow and fast uptake scenarios, respectively. This compares to 3.7 million Australian households with rooftop solar systems.*
*https://www.energycouncil.com.au/media/fydjqofh/australian-energy-council-solar-report-q12024.pdf
NEM installed capacity by V2G uptake scenario

The modelling assumes V2G uptake begins in FY2027. The Fast uptake scenario exceeds the ISP for the whole modelled horizon, while the Slow uptake scenario keeps pace out to the late 2030s but falls slightly below the ISP uptake afterwards.
Both the Slow uptake and Fast uptake scenarios assume a modest growth in the duration of the V2G fleet from ~4h to ~5.6h over the modelled horizon.
It is worth noting that we donotassume all installed V2G vehicles are available for energy market arbitrage at all times. We apply further derating to capture the real-life limitation that, only a proportion of the V2G is available due to transport driving patterns and assumed consumer plug-in behaviors.
Available capacity (GW) for default charging

Available capacity (GW) for day-weighted charging

The transport and plug-in behavior of EV drivers impacts when the vehicle is available to charge and discharge, and their overall ability to optimise charging against available incentives. We used two weekly plug-in schedules to account for this.
A default schedule was based on currently observed driver behavior, including under international V2G trials. In this scenario, available (available) capacity (GW) varies between around 24.4% of total capacity (during weekdays) to 59% (on Sunday evenings).
In the day-weighted schedule, it was assumed that daytime charging options become more common over time. This could occur for a range of reasons, including a greater availability of workplace charging, greater use of public transport or working from home, or technology innovation such as autonomous vehicles. By 2050, available capacity varies between around 35% (during peak commuting periods) to 50.1% (Sunday evening). This is reflected in tighter overall availability bands.
> How to read these charts
The coloured areas represent ‘availability bands’ overtime. The height of the bands represents the range of availability over the course of a day. The low point generally relates to low availability during the day (default schedule) or during peak transit times (day-weighted schedule).
The minimums and maximums grow overtime as the V2G fleet grows in line with the slow and fast uptake assumptions.
FY 2050 market battery availability, averaged by time of day (ToD)

The Default availability trace represents the availability of the V2Gs to participate in the wholesale market at different hours of each day.
In the Market-weighted operating pattern, we assume 80% of the available capacity, as shown in these charts, can directly respond to the wholesale market signals. To further capture the potential heterogeneous transport-usage pattern of the fleet, we have applied a further conservative assumption, which limits the fleet’s charging capacity by another 50% relative to the capacity shown in the charts. The remaining 20% V2G in the Market-weighted operating pattern will operate according to a static ToU profile.
The ToU-weighted operating patterns use the same availability trace of V2G, but its market-responsive portion is only 20%, and the remaining 80% operates under a static ToU profile.
The Day-Weighted availability trace used by the Day-weighted operating pattern is flatter as we assume more EVs are plugged in during the day to participate in wholesale market arbitrage. Similar to the Market-weighted operating pattern, it assumes that 80% of the V2G fleet can respond freely to wholesale market signals.
Example energy price ($/MWh) by year (2025-29) and time of day
Summer, Queensland
V2G operation varied by market participation scenario. ToU operation was assumed to be driven by residential ToU retail tariffs which were constructed from synthetic network and energy costs in each season, region and market scenario.
Synthetic ToU energy tariffs were derived from baseline scenario NEM-average wholesale market prices. In effect, this assumed that retailers would adjust their pricing each year to match wholesale market conditions. While this generates an optimistic-value bias in relation to retailers having wholesale market cost foresight, a conservative value-bias flows from pricing being NEM-wide rather than adapting to local market conditions.
Synthetic ToU networks tariffs were generalised based on typical historic ToU pricing patterns adjusted to reflect basic assumptions about how continued solar uptake may shift distribution network pricing incentives. These price signals are generally taken to be conservative and network pricing is likely to be more reflective of local conditions over time.
These heatmaps show ToU energy and network prices by time of day (top to bottom) and year (left to right). Red is high pricing and blue is low pricing. Blue network prices reflect a cost to discharge (and a benefit to charge). Blue energy pricing reflects negative average wholesale electricity prices. Example network price ($/MWh) by year (2025-49) and time of day
Overall pricing was used to create a binary charge/discharge logic. These arrangements were only required to generate a realistic operational profile, rather than predict customer revenues from the assumed pricing. Subject to vehicle availability, vehicles were optimised to charge during low price periods, and discharge when prices were high, within SoC and power transfer constraints (summarised on the next page).
> How to read these heatmaps
Key assumptions used in all scenarios
7kW Maximum charge / discharge rate
5kWh Daily discharge limit
40% Minimum allowed state of charge (SoC)
1.15 Round trip loss factor
$120/MWh Network load peak price
-$30/MWh Network solar soak price peak
A range of assumptions are applied that shape the operation of V2G across all scenarios. These have been informed by desktop research and supply chain engagement conducted by enX as part of the broader National Bidirectional EV Charging Roadmap development process.
• We assumed a conservative maximum charge discharge rate of 7kW which is close to the minimum typical power transfer rate of an AC wallbox (IEC Mode 3) residential charger. In reality, bidirectional charge rates will range up to 22kW AC and into the megawatts for commercial vehicles. Increasing the maximum charge rate increases the potential to arbitrage pricing and a customer's ability to provide power system services.
• A daily discharge limit of 5 kWh represents a relatively conservative limit equivalent to around half the capacity of a typical residential BESS. This was enforced to ensure that potential OEM warranty conditions are accounted for. Stakeholders considered these limits would relax over time as customers and OEMs become more comfortable with bidirectional charge impacts on battery heath.
• A Minimum SoC preference of 40% was enforced. This most likely reflects a conservative bias and customer may become more comfortable with lower SoC’s over time.
• Round trip losses were assumed to be around 15% which is considered typical. Lower losses would impose a lower cost on bidirectional discharge operation.
• Network prices were based on a cursory review of current pricing offers. Average network export pricing was forecast to commence at $15/MWh and grow to $30/MWh by 2050. This may overstate solar soak incentives in the short term.
• A weighted average vehicle battery capacity was derived from the 2024 ISP. This grows in line with conservative estimates described in previous enX analysis.*
FY 2050 ToU charging and discharging profiles, averaged by time of day

The ToU charge/discharge profiles are similar in the two uptake scenarios. Positive values mean discharge, and negative values mean charging. The quantum of charging and discharging in the Slow uptake scenario is less than that of the Fast uptake scenario.
The Default ToU charging profile, used by both the Marketweighted and the ToU-weighted operating patterns involves prominent discharging peaks in the morning (6:00 to 9:30 AM) and evening (5:30 to 10:00 PM), with steady charging in the middle of the day.
The Day-Weighted charging profile used by the Dayweighted operating pattern shows a similar diurnal pattern to the Default profile but slightly greater midday charging and slightly lower discharging peaks.
There is minimal difference between the corresponding More wind and More solar profiles.
We used PLEXOS to estimate the impact of V2G operation on the wholesale electricity market. The National Electricity Market (NEM) is an interconnected system where a multitude of participants make their operational and investment decisions that affect the production and investment outcomes of hundreds of plants of various technologies and operation characteristics.
The wholesale market model uses an optimisation-based approach, similar to AEMO’s dispatch algorithm, to simulate the long-term market outcome and allows us to assess the market benefit and cost arising from various V2G uptake and operational assumptions.

For V2G under static ToU schedules, their operation was applied as a variation to the baseline (ISP Step Change) EV load trace and therefore an input into PLEXOS.
Conversely, for V2G that are responsive to wholesale price signals, their operation was produced in PLEXOS as though it were a BESS unit operating with the additional constraints assumed for V2G.
What investment do we need to meet demand, satisfy our constraints and at least cost?
Build path
term dispatch (ST)
What are the future market dispatch outcomes when we represent the market at high granularity?
Detailed dispatch outcomes

Installed capacity and generation mix NEM wide, FY2027-2050


The More solar scenario assumes some delays to achieving state government targets and major infrastructure such as Snowy 2.0. It also contains a more stringent onshore wind entry limit.
Due to the wind entry limit, the More solar counterfactual (i.e., no V2G) sees more investment in utility-scale solar to meet energy consumption growth. This is accompanied by storage to provide firming and transporting solar energy from daylight hours to evening peaks. However, due to the assumed delay in PHES investment, the majority of these firming needs are met by BESS. The system also sees modest gas peaker development over time to provide supply during wind and solar droughts.
Due to the delay in infrastructure rollout and the lack of wind investment in earlier years, supply in this system is tight until the mid-2030s. In particular, the lack of wind means there is less energy available overnight to replace retired coal generation. As a result, storage assets, including V2G, will play an important firming role until sufficient wind can enter the system over a longer timeframe.
Installed capacity and generation mix NEM wide, FY2027-2050

The chart shows V2G’s impact on the NEM investment (top) and dispatch (bottom) outcomes. Positive bars mean more under V2G than the counterfactual, and negative bars mean less in V2G.
The introduction of V2G has a broadly similar impact across all More solar scenarios. Functionally, V2Gs are similar to BESS and, therefore, displace utility firming needs from utility storage and gas peakers. They also incentivise more solar build to feed day charging and night discharging behaviours. The build displacement is mostly frontloaded, with the system equilibrating by about 2040.
Similar but less accentuated results are seen in the Slow uptake compared with the Fast uptake scenario. In Fast, the displaced firming needs are approximately 2-3 GW after 2040. Under Slow uptake, the displaced firming needs are approximately 11.5 GW.
The Day-weighted operating pattern sees the most build displaced, due to it having the greatest ability to capitalise on mid-day solar generation. The Market weighted pattern displaces more build than the ToU weighted pattern as the former has more flexibility than the latter.
Average time of day ToU and market V2G charging and discharging, FY2050


For a given uptake scenario, the Market-weighted and ToUweighted operating patterns differ by the amount of the EV fleet responding to market signals (80% in Market-weighted, 20% in ToU-weighted). The chart compares the time-of-day operating pattern for the V2G fleet in 2050.
The fleet in the Market-weighted scenarios participates more strongly in overnight charging, while the ToU-weighted fleet participates more strongly in daytime charging.
V2G provides wholesale market benefits by avoiding investment and dispatch of utility-level firming assets during morning and evening peaks.
The Market-weighted fleet also discharges more during the evening peak, as it is better able to respond to wholesale market arbitrage opportunities that the ToU-weighted batteries do not capture. This is the key driver of greater wholesale market benefits in the Market-weighted operating pattern.
Dispatch for one week in FY2040, Victoria, More solar scenario, Fast V2G uptake

This chart shows an example week of system operation in Victoria in FY2040 at 30-minute granularity. The results are shown for the fast uptake scenario for both the marketweighted and ToU-weighted operation patterns. This is a period of “normal days” where there is sufficient renewable, especially wind, generation in the system and no gas is dispatched in Victoria in that week.
By 2040, the uptake of V2G has reached a point where it makes a discernible and consistent contribution to the daily operation of the system. Similar to utility storage, V2G charges in the middle of the day and discharges overnight. However, it is midday charging profile is flatter than utility batteries due to the availability of fleet. There is also more early morning charging due to the network price incentives. Given that the system has an abundance of renewable generation throughout the entire day, the early morning charging has no material impact on wholesale market costs.
The Market-weighted operation pattern has a greater utilisation of the V2G fleet during evening discharging than the ToU-weighted operating patterns due to the marketresponsive fleet’s greater ability to respond to wholesale market signals.
Dispatch for one week in FY2040, Victoria, More solar scenario, Fast V2G uptake

This chart shows the operation of the 2040 Victorian system during a week of wind droughts. The results are shown for the fast uptake scenario for both the market-weighted and ToUweighted operation patterns.
In the post-coal system, wind droughts are one of the major drivers of system stress events. Between the 17th and 20th of July of the modelled year, there is very little wind generation in Victoria. V2G is part of the overall system response to the resultant supply scarcity condition. Like the rest of the storage fleet, it charges during the midday from the surplus solar energy and helps meet electricity demand overnight.
However, V2G itself does not generate energy and its contribution is limited by the amount of surplus energy available from midday solar generation. As a result, the Victorian system relies significantly on natural gas and interconnector imports to meet its overall energy needs during this period.

Breaking the wholesale market benefit out into categories and 6-year temporal blocks provides a better picture of when and where benefits associated with V2G uptake occur. We further categorise the source of cost saving in terms of avoided CAPEX, OPEX and emissions cost.* The costs here are shown as the undiscounted sum over the 6-year blocks. The next slide will show the overall benefit in NPV terms.
Across all year blocks and scenarios, the introduction of V2G leads to net cost savings. The relativity of the magnitude of cost savings closely follows that of displaced build, with the following order:
Day-weighted > Market weighted > ToU weighted
The majority of cost savings are attributable to avoided capital costs, although there are modest fuel and emission cost reductions owing to reduced gas operation in the longer term.
NB: The additional costs of installing and operating V2G are not included in this chart.
*Emissions reduction cost is calculated by valuing the avoided emissions from thermal generation at Value of Emissions Reduction (published by the AER)
2027- 2050 NPV wholesale benefit of V2G, discounted to 2027, June 2024 AUD

We present the NPV of V2G wholesale market benefit in the more solar scenario. The NPV is discounted to 2027, which is the start date of V2G uptake in our modelling.
The wholesale market benefit in the more solar scenario is between $1.7bn and $2.7bn in the fast uptake scenario and between $0.7bn and $1.2bn in the slow uptake scenario. This is in line with the ratio of their installed capacity.
Within the same uptake scenario, the operating patterns that are more conducive to V2G responding to wholesale market conditions will also lead to higher wholesale market benefits. As a result, the Day-weighted operating pattern offers the greatest cost savings as more of the V2G fleet can participate during midday charging. This is followed by the Marketweighted pattern as the fleet is better at responding to high pool price events during the evening. The ToU-weighted pattern has the lowest wholesale market benefits due to the associated more static operating profiles of the V2G fleet.

Installed capacity and generation mix NEM wide, FY2027-2050

The More wind scenario contains an energy outlook with timely augmentation of transmission infrastructure and a mild wind build limit, along with the timely achievement of all state renewable energy targets. There is also greater coordination of behind-the-meter batteries (i.e., VPP), as per the ISP Step Change.
As a result, there is more wind in the generation mix at the expense of solar. Due to the more rapid commissioning of infrastructures and faster wind entry rates, this scenario represents a more orderly renewable transition. There are less severe energy shortages during the evening and early morning as more wind generation is available to replace retired coal plants for meeting overnight coal output. As there is more wind in the system, gas plays a more prominent firming role than BESS.
As a result, the impact of the V2G is likely to be smaller in the More wind scenario in the late 2020s and early 2030s.
Installed capacity and generation mix NEM wide, FY2027-2050

The chart shows V2G’s impact on the NEM investment (top) and dispatch (bottom) outcomes. Positive bars mean more under V2G than the counterfactual, and negative bars mean less in V2G.
The introduction of V2G has a broadly similar impact across all simulations in the More wind scenarios. That is, V2G displaces utility firming investment and output and facilitates more solar uptake. As gas makes up a greater proportion of the firming mix in the More wind scenario, V2G forces out mostly gas, and utility storage to a lesser extent.
As higher V2G encourages more solar uptake, this reduces wind investment to a small extent in later years.
The relative impact resulting from different uptake and operating patterns is similar to that from the More solar scenario. Slow uptake of V2G has less impact than the Fast uptake. As with the More solar scenario, the Day-weighted V2G pattern has a greater impact than the Market-weighted pattern, which in turn is more impactful than the ToU-weighted pattern.
Average time of day ToU and market V2G charging and discharging, FY2050

The effect of the ToU-weighted versus Market-weighted V2G fleet is similar between More wind and More solar scenarios.
For a given uptake scenario, the Market-weighted and ToUweighted operating patterns differ by the amount of the EV fleet responding to market signals (80% in Market-weighted, 20% in ToU-weighted). The chart compares the time-of-day operating pattern for the V2G fleet in 2050.
The fleet in the Market-weighted scenarios participates more strongly in overnight charging, while the ToU-weighted fleet participates more strongly in daytime charging.
V2G provides wholesale market benefits by avoiding investment and dispatch of utility-level firming assets during morning and evening peaks.
The Market-weighted fleet also discharges more during the evening peak, as it is better able to respond to wholesale market arbitrage opportunities that the ToU-weighted batteries do not capture. This is the key driver of greater wholesale market benefits in the Market-weighted operating pattern.

As with the More solar scenario, the More wind scenario sees net cost savings in all year blocks and scenarios due to the introduction of V2G. Accordingly, the relative magnitude of cost savings once again closely follows the change in investment and dispatch outcomes.
As V2G displaces further utility storage in the More wind scenario, which already contains less of them in the counterfactual, there is a slight increase in gas dispatch in the mid-2030s. However, the impact is small and eventually, as more V2G enters the system in the late 2030s, they lead to a net reduction gas output and emission.
Installed capacity and generation mix NEM wide, FY2027-2050, Fast uptake scenarios

This chart shows the comparison of V2G’s impact between the More wind (right 3 panels) and the More solar (left 3 panels) scenarios. The chart focuses on the Fast uptake scenarios as the conclusion is similar for the Slow uptake scenarios.
The relative magnitude of impact across different operating patterns is similar in both More wind and More solar scenarios. The Day-weighted scenario has a larger impact than the Market-weighted scenario, which in turn has a larger impact than the ToU-weighted scenario. This is driven by the ability of the V2G fleet to respond to wholesale market signals.
Different system mixes do have an impact on the timing of benefit accrual. In the More solar scenario, the benefits are accrued faster in earlier years due to the tighter supply conditions in the 2030s, as evidenced by greater displacement of storage investments during in the early years. The displacement effect flattens from the 2040s in the More solar scenario as storage eventually saturates the system. However, the displacement effect continues to grow in the 2040s in the More wind scenario due to less utility storage in the system mix.
The timing of benefit accrual means the NPV of the wholesale market benefits are broadly similar in both More wind and More solar scenarios.
2027- 2050 NPV wholesale benefit of V2G, discounted to 2027, June 2024 AUD


The chart compares the NPV of V2G’s wholesale market benefit between the more wind and more solar scenarios. The NPV benefit of the More wind scenario ranges between $1.6bn and $2.7bn with Fast uptake and between $0.7bn and $1.1bn with slow uptake. This is very similar to its benefit in the More solar scenario, which is between $1.7bn and $2.7bn with fast uptake and between $0.7bn and $1.2bn with the slow uptake scenario.
As discussed earlier, the NPV benefits are very similar between the two generation outlooks. The More solar scenario accrues more benefit in earlier years but plateaus after 2040, and the More wind scenarios’ see more benefit in later years.
These results suggest that the wholesale market benefit associated with V2G is robust regardless of whether wind and solar will dominate the future generation mix.


V2G can reduce distribution network costs by discharging back to home or the grid during distribution network peak periods. This lowers peak demand, which may defer or avoid the need for network augmentation. Due to time and data availability constraints, we have not undertaken a detailed bottom-up study of each distribution area. Instead, we estimated a range of avoided distribution network investments due to V2G in each region based on our previous modelling. We then estimated the reduction in distribution network costs by applying the distribution network long-run marginal cost (LRMC as published by the AER) to the avoided investment amount.
Assumes peak network congestion occurs during the nighttime peak, between 5:00 PM and 12:00 AM. Assumes the annual avoided distribution network investment is equal to the averagehalf-hourlyV2G discharge during this period without assuming V2G operation is aligned with network congestion (including both ToU profile and market responsive V2G) in each region. The reduction in peak demand is then converted to a deferred capital cost investment using network LRMC due to reduced peak congestion.
Assumes peak network congestion occurs during the nighttime peak, between 5:00 PM and 12:00 AM. Assumes all available V2G are discharging during this period and find the singlehalf-hourlyintervalwith the greatest V2G discharge in this period. This assumes V2G operation is perfectly aligned with network congestion. Similar to the Low estimates, the reduction in peak demand is then converted to a deferred capital cost investment using network LRMC.
Peak congestion reduction metrics across all modelled scenarios and regions, FY2027-FY2050
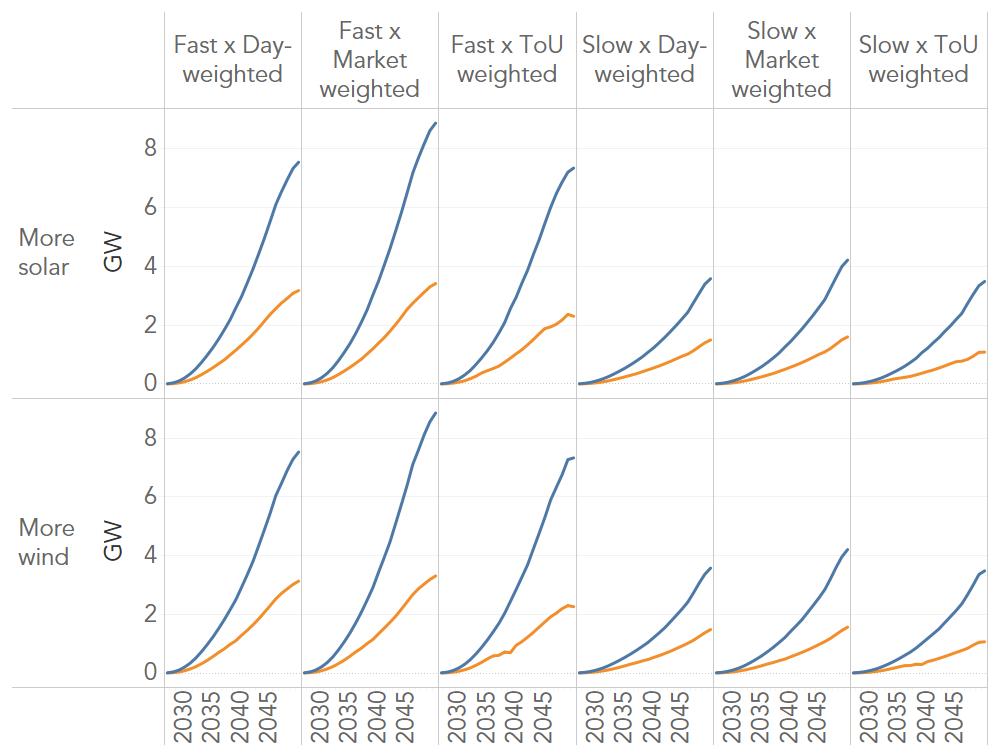
Across all modelled scenarios, the load reduction during peak events is two to three times smaller in the Low estimate compared to the High estimate.
Both estimates are unaffected by the build scenario but show significant variation depending on V2G uptake and operating patterns.
Fleets with a Day-weighted operating pattern produce slightly less peak congestion reduction due to less fleet availability during night-time hours compared to the Market-weighted scenario.
Fleets with a ToU-weighted pattern also offer slightly less peak congestion reduction compared to the Market-weighted scenario due to the less flexible static ToU profiles.
Network cost saving, NPV discounted to 2027, June 2024 AUD

The low estimate amounts to modest savings in the hundreds of millions of dollars NPV, while the high estimate savings are comparable with the level of wholesale cost savings.
As with the wholesale cost savings, the network cost savings show little dependence on the wholesale energy mix, with the network cost saving estimates for the More wind and More solar scenarios tracking very closely.
The magnitude of the effect of the speed of V2G uptake is also roughly in line with wholesale cost savings, with the Fast uptake scenario delivering a roughly two-fold increase in cost savings on the Slow uptake scenario.
The relativity across the V2G operating patterns is slightly different for network cost savings, with Market-weighted cost savings exceeding Dayweighted cost savings. This is attributable to the fact that less of the Day-weighted fleet is available for discharging in the assumed night-time peak congestion window.
Network cost saving, NPV discounted to 2027, June 2024 AUD, shown with wholesale cost saving components

With the addition of the high estimate network cost savings, the total savings range from $1.5bn to $2bn in the slow uptake scenario and $3.5bn to $4.5bn in the fast uptake scenario. Combining network and wholesale sectors, the Day-weighted operating pattern and the Market-weighted operating pattern have similar total benefits. This is because the Dayweighted operating pattern has higher CAPEX saving from the distribution network sector, whereas the Market-weighted pattern sees more benefit from reduced wholesale investment and operation. In all cases, the ToU weighted shows a slightly lower saving.
Overall, our analysis shows that the total cost savings from V2G can be material across the wholesale and distribution network sectors. The estimated benefits remain consistent regardless of whether wind and solar make a greater mix in the future energy system. Increasing the V2G’s responsiveness to wholesale market signals will further unlock its potential to reduce the cost of the future electricity system and end consumer bills.
Cost premiums compared to a standard wallbox charger installation*
enX developed technology uptake and cost projections to determine the uptake capital cost premium of V2G installations relative to standard wallbox unidirectional charging. This has been based on high-level, bottom- up cost analysis and feedback from interviews with over 50 industry stakeholders and supply chain participants conducted as part of the broader project.
Potential optimistic biases include:
• Competitive market operation and increasing production scales will drive equipment pricing to a cost-reflective level over time.
• In line with some automaker expectations, the industry will transition over time to AC V2G.
Potential conservative biases include:
• Conservative AC & DC cost estimates and a high proportion of DC V2G is assumed for the next decade, significantly front-loading costs.
• No savings are assumed by leveraging offboard solar and battery power conversion equipment across the V2G fleet.
Final assumptions are intended to strike a balance of potentially optimistic and conservative biases to produce credible results, with an overall conservative bias
Based on the assumptions presented on the previous page, a NEM-wide aggregate installation cost premium was calculated at $1.337 billion and $618 million for the fast uptake and slow uptake scenarios, respectively ((2024 AUD).
An indicative total economy net present value (NPV) for V2G has been calculated by netting out the estimated installation cost premiums from the reported market and network benefits. This uses an average of network cost saving estimates and the average of the electricity market benefits between the ‘more solar’ and ‘more wind’ scenarios.
This analysis produces a positive total system NPV across scenarios ranging from $2.96 billion in day-weighted, fast uptake scenario, to $735 million in the ToU-weighted scenario.
In economic terms, this analysis indicates that supporting a faster uptake of bidirectional charging is likely to be a no regrets activity, and there is total net benefits pool of up to $2.96 billion that could be used to incentivise uptake (through electricity pricing or complementary incentives).
However, it is important to take this analysis is an initial highlevel estimate based on currently anticipated technologies and their costs. Further data and analysis will contribute to a firmer understanding of the value of bidirectional EV charging over time.