WEBB SPACE TELESCOPE NEW DISCOVERIES FROM THE MATISSE PROJECT
Quantum Design UK and Ireland is part of the Quantum Design International (QDI) group QDI is a global laboratory equipment manufacturer. The company distributes scientific and industrial instrumentation through an international network, with subsidiaries in every major technological centre around the world.
WITH CONTENT CONTRIBUTIONS FROM OUR PARTNERS:
Foreword
Company Video
New Partner IXRF Systems
Meteorite Analysis App Note
Crack and Void Identification in Solder
Cracks in Solder Connections and/or PCB
Substrate
Space Instrument Failure Analysis
James Webb vs. Hubble Telescopes
Measuring Up to NASA’S James Webb
Space Telescope
ProFlux Nanowire UV Polarisers
Moxtek in Space - a Timeline
Space Camera Solutions Imaging
With these ever-changing landscapes, we at Quantum Design UK and Ireland are always looking to develop and grow to provide you the best solutions for todays challenges.
Our suppliers are responsible for supporting the development of iconic inventions such as the James Webb Space Telescope and the Mars Perseverance Rover. The QDUKI team are happy to introduce a taster of our full solution for space and spacequalified testing in this new magazine
The Quantum Design UK and Ireland Sales Team
Dr Shayz Ikram TECHNICAL DIRECTOR
Dr Luke Nicholls TECHNICAL SALES MANAGER
Dr Alex Murphy TECHNICAL SALES ENGINEER
POWERING PROGRESS: IXRF SYSTEMS INC.
MICROANALYSIS AND MICROXRF ANALYTICAL INSTRUMENTATION
For almost three decades IXRF has been designing and manufacturing high-end X-ray Microanalysis systems that are fitted to Scanning Electron Microscopes (SEM/EDS). Almost 10 years ago, IXRF developed SEM-XRF microscope attachments allowing broader elemental analysis coverage.
In 2014, IXRF launched the ATLAS series of general purpose, microXRF energy dispersive X-ray fluorescence
(micro-XRF) spectrometers for elemental analysis and hyperspectral imaging of elements from sodium (Na) through uranium (U) IXRF specialises in: SEM/EDS, SEM-XRF and micro-XRF VISIT THE X-RAY RANGE
Meteorite Analysis
App note from IXRF Systems
The Murchison meteorite fell in Australia in 1969 near Murchison, Victoria...
A meteorite is the term given to a piece of a comet or asteroid that falls into the Earth's atmosphere and survives to hit the surface Modern classification schemes divide meteorites into groups according to their structure, chemical and isotopic composition and mineralogy.
The Murchison Meteorite belongs to the CM group of carbonaceous chondrites Carbonaceous chondrites are primitive and undifferentiated meteorites that formed in oxygen-rich regions of the early solar system so that most of the metal is not found in its free form but as silicates, oxides, or sulphides
CM chondrites are well known to contain a wealth of complex organic compounds. Like most CM chondrites, it experienced extensive alteration by water-rich fluids on its parent body before falling to Earth.
Cosmochemists reported in January 2020 that the silicon carbide particles in the Murchison meteorite have been determined to be 7 billion years old.
Instrumentation:
Model: Atlas M microXRF
Map (pixels): 1600 x 902
Software: Iridium Ultra Size (mm): 11.40 x 6.42
Voltage: 50 kV
Current: 1000 µA
Point dwell: 130 ms
Atmosphere: vacuum
Filter: open Spot size: 5 µm
Data:
Micro-spot energy dispersive X-ray fluorescence spectroscopy was employed to produce hyperspectral XRF images of the distribution of the primary elements identified in the Murchison meteorite sample. Under the analysis conditions employed, the observable elements were: Mg, Al, Si, S, K, Ca, Ti, V, Cr, Mn, Fe and Ni.
Meteorites are known to contain a significant amount of iron. The elemental map of iron (Figure 2) was set to a thermal scale in the image … to not only show the presence of iron but also the dramatic concentration distribution
The Si-map (Figure 3) shows the silicon from silicon carbide inclusions.
This meteorite is similar to other CM chondrites in that it contains abundant calcium and aluminium rich inclusions. These inclusions can be seen in the elemental map overlay (Figure 4), where calcium is yellow and aluminium is blue.
Figure 1 XRF maps by element
Figure 2 Thermal map of Fe concentration (red is highest)
Figure 3. Silicon carbide map
Figure 4 Inclusions: Ca is yellow and Al is blue
Other elements of research interest were also identified in the meteorite; just a few are shown (Figures 5-7) and are set to a thermal scale to highlight details of areas of higher concentration. The use of a 5 µm spot size allows for incredible detail in the elemental maps
Discussion:
Application of a non-destructive analytical procedure, such as microXRF, to characterise the mineral phases in meteorites solves a key issue in the preservation of these scarce materials Elemental composition analysis was performed using the ATLAS M hyperspectral microXRF imaging spectrometer, affording elemental distribution maps – with 5 µm special resolution – for the meteorite sample Microspot EDXRF expands the abilities of researchers
This analytical technology is ideally suited for the analysis of inorganic species, and offers excellent sensitivity to trace elements (for example, concentrations less than 100 ppm can be detected, depending on the element and sample matrix) Point analysis allows fast identification of mineral species, even when analysing individual grains in a section Hyperspectral imaging provides detailed elemental images, highlighting the distribution of mineral phases and graphically illustrating general structure.
Figure 5 Al map
Figure 6 S map
Figure 7. Ca map.
CRACK AND VOID IDENTIFICATION IN SOLDER TO CHECK FOR CONNECTIVITY AND LEAK PATHWAYS
High Resolution Virtual Sectioning for 1.1um virtual slice
CRACKS IN SOLDER CONNECTIONS AND/OR PCB SUBSTRATE
Using the Sigray Apex 3D X-ray Microscope
Cross-Section, sagittal view of PCB solder connections
1um Virtual Slice Analysis – visualising microstructure of joints, locating voids and defects
About the Sigray Apex
Rethink Impossible
Sub-Micron 3D X-ray In Minutes
Advanced semiconductor packaging & FA
2um Voxel, 3D Volume Rendering
SPACE INSTRUMENT
FAILURE ANALYSIS
with Synchrotron Grade MicroCT
3D x-ray microscope with industry-leading spatial resolution
Achieve down to 0 5 µm spatial resolution and <100nm voxels
Powerful reconstruction and data analysis software
Advanced artifact reduction and image optimisation. GPU-accelerated FDK and iterative reconstruction engines
Multiple detectors in a single system
Optimise your field of view and resolution
Learn more about Sigray PrismaXRM
About Sigray
Sigray, Inc is a San Francisco Bay Area company founded with the aim to accelerate scientific progress by providing powerful, synchrotron-grade research capabilities in its laboratory x-ray systems
High Throughput (>10X)
For flat, thin samples, such as dies, packages and wafers Can acquire high quality tomographies within 15minutes
High Throughput preservation for large samples
System geometry makes this possible even for 300mm wafers
True 3D Volumetric Imaging at 1um resolution
Virtual Cross-Sectioning. Failure Analysis.
Learn more about Sigray ApexXCT
These systems represent a major step-change from existing laboratory x-ray systems and their breakthrough performance are uniquely enabled by Sigray’s patented innovations in x-ray source, optics, and detector technologies
Since its founding in 2013, Sigray’s products have already been adopted by prominent scientific leaders in Asia, America, and Europe The company holds over 40 patents on x-ray component and system technologies
events
NEVER MISS AN EVE
Join our Mailing List and be first to hear about events
QDUKI hosts a number of events each year, we strongly encourage you to join our mailing list to be the first to hear about these. We also keep you updated with webinars from our partners, as well as other industry conferences, exhibitions and seminars we think you may be interested in.
explainer
JSWT Mission Goals
JWST is 100 times more powerful
JWST mirror is 6 larger
JWST can see IR wavelengths
Hubble can see 480 Million years after the Big Bang
JWST can see 250 Million years after the Big Bang
Hubble orbits the Earth, James Webb does not
"Any way you slice it, the Cartwheel Galaxy is magnificent to behold. The top half of this image shows the galaxy as seen by NASA's Hubble Space Telescope in visible light, while the lower half of this image shows the James Webb Space Telescope's infrared view. Hubble and Webb will continue to work together to provide complementary views of the universe."
NASA
Search for the first galaxies formed after the Big Bang
Determine how galaxies have evolved
Observe the formation of stars and the formation of planetary systems
Measure the physical and chemical properties of planetary systems
Investigate the potential for life in the Universe
CASE STUDY: MEASURING UP TO NASA’S JAMES WEBB
SPACE TELESCOPE
H. Philip Stahl Senior Optical Physicist, NASA
Measuring optics for space-based optical systems, like the James Webb Space Telescope, comes with a high risk-profile. After all, it’s difficult to get systems into space, and once deployed, it can be very hard to make a repairvisit NASAisunderstandablycarefulnot toleavetheirnextbigopticsprojecttochance, and they have reformulated their testing criteria over the years. NASA senior optical physicist H Philip Stahl has written extensively ontheapproachtheyhavechosen
"Probably the most difficult metrology project in a generation of astronomical optics"
H. Philip Stahl Senior Optical Physicist, NASA
The 18 mirror segments, the secondary mirror, and the tertiary mirror were measured individually and in sets, for surface figure and surface roughness. They were re-measured in cryogenic vacuum conditions. It required a giant helium refrigeration chamber to bring the optics to -240 °C (30K) With pump vibrations surrounding the mirrors, the vibration would be high.
4D Technology was designated primary metrology supplier, providing instruments for several measurements of the optics and the support structure. The selection was in part because of our dynamic metrology technology, and in part because of our willingness to engineer and design to the extremely stringent requirements
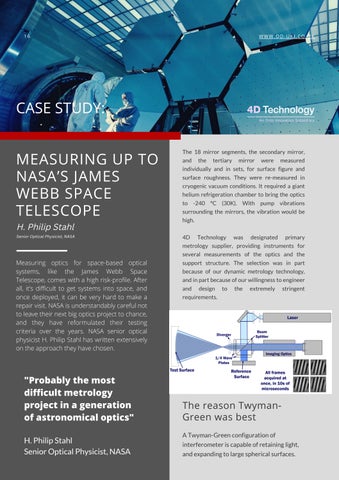
The reason TwymanGreen was best
A Twyman-Green configuration of interferometer is capable of retaining light, and expanding to large spherical surfaces.
Measuring concave segmented mirrors
One challenge of measuring a segmented mirror, using interferometry, is that the interferometer has a small tolerance for measuring step discontinuities that is, the difference in Z of one mirror segment to its neighbours in the array The system is prone to vibration, because the focal lengths and the size of the array could not permit the interferometer and the optical array to be coupled together
To ensure NASA could make a measurement that 1) would be vibration immune, 2) could tolerate the step discontinuities, and 3) could capture enough light in a light-absorbing computergenerated hologram measurement, we offered our dynamic interferometry technique in a Twyman-Green interferometer, using twowavelength measurements.
The ability of an interferometer to differentiate step discontinuities is just ¼ of the wavelength used to measure. By using two-wavelength interferometry, the dynamic range increases dramatically by creating a longer functional wavelength The downside is that the time taken to acquire two measurements makes the results more likely to be obscured by vibration. In one proof of concept test, we demonstrated two wavelength acquisitions in less than 100 millionths of a second – effectively making ‘stopaction’ out of any vibration
Learn more about the 4D Technology PhaseCam Models
The 4D PhaseCam line of Twyman-Green dynamic interferometers we first released for this project served in both the ambient and cryochamber tests, and the end-to-end test.
PhaseCam Models
Three models of PhaseCam, a Twyman-Green interferometer with dynamic measurement capabilities
Shorter frequency measurements
The simultaneous phase-shift architecture of the PhaseCam permits rapid measurement of the surface shape for specular reflecting objects
A Tywman-Green interferometer, measuring surface figure, is unable to resolve the microscopic variances and roughness of polish that affect scatter. In space telescopes attempting to image exoplanets, and in X-ray telescopes, ultralow surface roughness and the complex shapes of the optics themselves require tools capable of rapidly measuring surface quality across a very large aperture.
About 4D Technology
4D Technology is the leader in high-resolution surface and wavefront measurements for challenginglocationsandapplications
4D pioneered “dynamic” measurement technology, paving the way for entirely new classes of instruments that change how manufacturers and scientists think about measurement From the world’s premiere astronomical observatories, to optical manufacturing shops, to aircraft flight lines, 4D gages and instruments provide 3D measures accurately, despite vibration and noise that stop other instruments in their tracks
Learn more about the 4D Technology PhaseCam Models
Interferometric measurement of the vibrational characteristics of light-weight mirrors
"We present a technique to characterise and quantitatively measure the vibrational mode shapes and amplitudes of mirrors concurrently with surface figure testing. The technique utilises a fast interferometer that does not introduce any mass loading to the test structure. We present the fundamentals of the technique, discuss several modes of operation, such as resonant and transient response, and analyse the operational limits. The performance of the measurement system is characterised using a small ambient test mirror "
James Millerd, Mark Schmucker, John Hayes (4D Technology) Ron Engb, John Lassiter, H. Philip Stahl (NASA Marshall Space Flight Centre), Ted Rogers, James Hadaway and Joseph Geary (University of Alabama)
Learn more about Polarisers
Moxtek® has invested many man-years of research into producing high performance polariser options to complement many emerging technologies.
ProFlux® Nanowire® Ultraviolet polarisers offer excellent solutions for UV and DUV applications. They are specifically designed for UV applications from 240nm to 400nm Also, by nature of Moxtek’s patented Nanowire® technology, these polarisers are broad band capable and on fused silica substrates, function well at IR wavelengths up to 4um
High transmission and high contrast choices are available. The large acceptance angle eases alignment concerns.
Durability is equivalent to Moxtek's standard visible spectrum products recognised for their high durability in hot and environmentally difficult applications such as astronomy
Ultraviolet imaging of objects in space gives an enhanced view and can detect differences not seen in visible light images NASA Hubble Space Telescope high resolution UV image of Jupiter’s satellite Io is shown here
The UVT and UVD Series ProFlux Nanowire Ultraviolet polarisers offer excellent solutions for UV and DUV applications. High transmission and high contrast choices are available. The high transmission products are indicated by UVT and the high contrast products are indicated by UVD The UVT series are naturally capable of broadband applications into the NIR spectral range to 4μm.
In 1996, Moxtek’s provided their first space flight component (x-ray window) to NASA/JPL onboard the Mars Sojourner rover. Since then, NASA/JPL has used a Moxtek window on every Mars mission (Sojourner, Spirit, Opportunity, Curiosity, and now the Perseverance).
2020 Mars Rover - Perseverance (NASA - X-ray Tube & Window - more on next page)
2003 Mars Rover - Opportunity (NASA - X-ray Window)
2003 Mars Rover - Spirit (NASA - X-ray Window)
1999 EPIC Camera - XMMNewton (ESA - X-ray Window)
1996 Mars Rover - Sojourner (NASA - X-ray window)
Learn more about X-Ray Sources
FLIGHT-READY CAMERAS FOR SPACE SPACE CAMERA SOLUTIONS
QDUKI's photonics partner, Raptor Photonics has a unique space heritage...
with cameras flying as optical payloads on several live LEO Cubesat missions for Earth
Observation as well as ground based stations Camera cores are SWaP optimised, athermalised and ruggedised to withstand launch conditions and maintain optical performance while being exposed to the extremeoperatingconditionsexperiencedinthe space environment. Raptor's in-depth knowledge and experience allow them to work with OEMs and integrators to offer unique customdesignfeaturesthatmeetyourimaging requirements
RaptorcamerasareonLEOsatellitesrevolvingat an altitude between 160 to 2,000 kilometers flying at approximately 17,000 mph Some of the cameras have been operational for over 18 months RaptoroffersLEOcamerasolutionsfrom UV (180nm) to SWIR (1700nm) Plus, flight-ready COTS options as well as custom OEM designs in platformsfrom1Uto10U.
More astronomers are looking into the SWIR bands these days. A German researcher, Dr. Sebastian Voltmer, has been looking at the inner planet Venus as a Ring next to the sun and how the crescent is getting bigger. He investigated slight irregularities in the atmospheric layers, as shown in Figure 1.
The challenge was to reveal the ground structures of Venus in NIR For surface observations (night side) through the clouds of Venus require a spectral window around 1000 nm
Ninox640IIintelescopeset-up
Tbservations at wavelengths beyond 10 micron are very interesting to observe the lower clouds of Venus through the infrared radiation that escapes from the planet through holes of lower cloud content at an altitude of about 50 km abovethesurface TheNinox640IISWIRcamera was able to reveal the surface and the lower cloudsinoneimage
In late June and early July 2020, the crescent morningstarVenuswasnarrowenoughandthe planet was positioned far enough from the sun. This meant that the sky was dark enough to capture the night side in SWIR The seeing conditions (less turbulence in the atmosphere) beforesunrirsearemuchbetterthanthoseafter sunset On July 1st 2020, Dr Voltmer was able to captureanuniqueimageof CrescentVenusand theinfraredradiation ofthehotplanet
Figure2:
OnJuly1st2020,Dr.Voltmerwasabletocapture an unique image of Crescent Venus and the infraredradiationofthehotplanet
Figures 2 and 3 show the set up on his scope in Spicheren,France
He was able to capture the very faint radiation beyond 1000 nm of the surface of Venus, as displayed on Figure 4 The image was captured with a prototype Sloan Z filter from Baader Planetarium(820-1500nm)andaNinox640IIIR
camera He aligned it with a circle congruent withthenightsideofVenus
12,000 video frames were necessary for the recording and a significant amount of post processingwork
"In my previous images of Venus from May 2020 I only used planetary CCD cameras with NIR sensitivity. It was hard to get any signal of Venus’s surface. But with the cooled Ninox 640 II SWIR camera I got a much better signal-to-noise ratio. With the Ninox 640 II SWIR camera I was able to reveal the surface and the lower clouds in one image"
Figure 4: July 1, 2020: Crescent Venus and the thermal radiationofthehotplanet,capturedinshortexposure
Learn more about
Raptor Ninox 640 II
Here at Quantum Design UK and Ireland, we only want to send you the information that you would like to see. When filling out the form, please tick the particular fields and product suppliers that interest you, and we will make sure you are kept up to date with ONLY the most relevant information.
MATISSE UPDATE
(MATURATION OF INSTRUMENTS FOR SOLAR SYSTEM EXPLORATION)
An international team of astronomers led by Violeta Gámez Rosas (Leiden University) has observed a supermassive black hole hidden in a ring of dust. This discovery fits the idea that the so-called active centres of galaxies are much more similar than observations show, because the viewing angle from Earth causes distortions The research was done with the MATISSE instrument, co-developed in the Netherlands, which combines infrared light from four European Very Large Telescopes (VLT) in Chile
MATISSE is the acronym for Multi AperTure mid-Infrared SpectroScopic Experiment. MATISSE not only couples the ls between light from the VLT, but also
Netherlands Research School for Astronomy (NOVA) built all the lenses and mirrors in the cooled part of MATISSE together with the Dutch space industry. The Netherlands had gained experience while developing its forerunner MIDI, which could link two telescopes instead of four.
The heart where the beams of the four VLT telescopes converge, consists of two aluminium boxes that are almost a meter in size These boxes are filled to the brim with hundreds of optical components, dozens of sensors and dozens of tiny motors. Most of the components work with nanometer precision or even higher.
Credit: ESO/M Kornmesser and L Calçada analyses it. MATISSE was created specifically for infrared light with wavelength 3 micrometers and 13 micrometers Infrared light is also created when something gives off heat. Therefore, MATISSE is cooled to minus 241 degrees Celsius so the instrument itself does not interfere with the measurements. Nanometer precision.
This illustration shows what the core of Messier 77 might look like. As other active galactic nuclei, the central region of Messier 77 is powered by a black hole that is surrounded by a thin accretion disc, which itself is surrounded by a thick ring or torus of gas and dust In the case of Messier 77, this thick ring completely obscures our view of the supermassive black hole This active galactic nucleus is also believed to have jets, as well as dusty winds, that flow out of the region around the black hole perpendicularly to the accretion disc around it.
Learn more about Andover Filters
Cryogenics
Highlights:
Customisable Cryostats
Focus on Temperature Sensors
view here
Lowest Temperature Measurements
Environment
The Next Generation of Helium Recovery view here
Highlights:
A Revolution in Textile Sorting
The Role of Structural Defects in Commercial Lithium-ion Batteries
Advancing Energy Research with Highly Sensitive
Measurement Instrumentation
Imaging Cameras
Highlights:
view here
Advancing Geology with Hyperspectral Imaging
Avoiding Contamination in the Food Industry
SWIR Cameras for Telecomms Applications
Streak Cameras in Action
Semiconductors
Highlights:
view here
Camera of PET Semiconductor Inspection
Power Electronics Efficient Control of the Future Energy
Analyse Electronic Components of Semiconductors using AFM