

The region is expected to return to the low growth trend seen prior to the COVID-19 pandemic. Against the backdrop of restrictions, there is need of coordinated macroeconomic policies that support the acceleration of growth, investment and the reduction of poverty and inequality, while tackling inflation.
A sequence of crises has led to weak growth and an acceleration in inflation in the global economy. Weaker growth in GDP and world trade, the appreciation of the dollar and the tightening of global financial conditions have weighed on the countries of the region.
What does the 2022 Economic Survey tell us?
Beyond the dynamics of the economic cycle, low growth in investment in the past three decades represents a structural limitation on development. Reactivating investment is central to sustainable and inclusive growth.
SELECTED REGIONS AND COUNTRIES:
ends in March of the following year. GDP GROWTH RATE, 2020–2022,
Source: Economic Commission for Latin America and the Caribbean (ECLAC), on the basis of Organisation for Economic Co- operation and Development (OECD), OECD Economic Outlook, June 2022; International Monetary Fund (IMF), World Economic Outlook: War Sets Back the Global Recovery, April 2022; World Bank, Global Economic Prospects, Washington, D.C., June 2022; European Central Bank (ECB), “Macroeconomic projections”, June 2022 [online] https://www.ecb.europa.eu/pub/projections/html/index.es.html;
Capital Economics, Global Economics, 13 June and United States Federal Reserve, “Summary of Economic Projections”, 16 June [online]
PROJECTIONS FOR 2022 BEFORE THE WAR IN UKRAINE (Percentages) Weaker growth of the region’s major trading partners (United States, China and the European Union) Latin America and the Caribbean faces externalweakerdemand
In 2022, the war in Ukraine has weighed on world economic growth
Notehttps://www.federalreserve.gov/monetarypolicy/fomcprojtabl20210616.htm:ThefiguresforIndiaareforthefiscalyear,whichbeginsinApriland

Source: Economic Commission for Latin America and the Caribbean (ECLAC), on the basis of Netherlands Bureau of Economic Policy Analysis (CPB), World Trade Monitor and Pink Sheet del Banco Mundial. WORLD TRADE VOLUME: YEAR-ON-YEAR CHANGE AND PROJECTION FOR 2022 (Percentages, on the basis of a seasonally adjusted index) World trade is slowing and commodity prices are rising INTERNATIONAL COMMODITY PRICE INDICES (Baseline January 2006=100)


Inflationary pressure is leading to more restrictive monetary policies in the developed world Source: Economic Commission for Latin America and the Caribbean (ECLAC), on the basis of Capital Economics, FRED and Bloomberg YEAR-ON-YEAR INFLATION (Latest available data, percentages) RATE OF GROWTH IN MONEY SUPPLY (Percentages, annual averages based on monthly data) MONETARY POLICY RATES (Percentages)


Source: Economic Commission for Latin America and the Caribbean (ECLAC), on the basis of Institute of International Finance (IIF) and official figures
Source: Economic Commission for Latin America and the Caribbean (ECLAC), on the basis of Invenomica.
Decline in capital flows to emerging markets, including Latin America PORTFOLIO CAPITAL FLOWS TO EMERGING MARKETS (Billions of dollars) FINANCIAL FLOWS TO LATIN AMERICA (Billions of dollars)
EMERGING MARKETS BOND INDEX (EMBI) (Basis points)


LATIN AMERICA: VARIATION IN FOUR-QUARTER GDP (Percentages, on the basis of a seasonally adjusted index) LATIN AMERICA: GDP GROWTH (Percentages) Economic activity in the region had stagnated prior to 2020 and returned to weak growth in the first half of 2022 Source: Economic Commission for Latin America and the Caribbean (ECLAC).


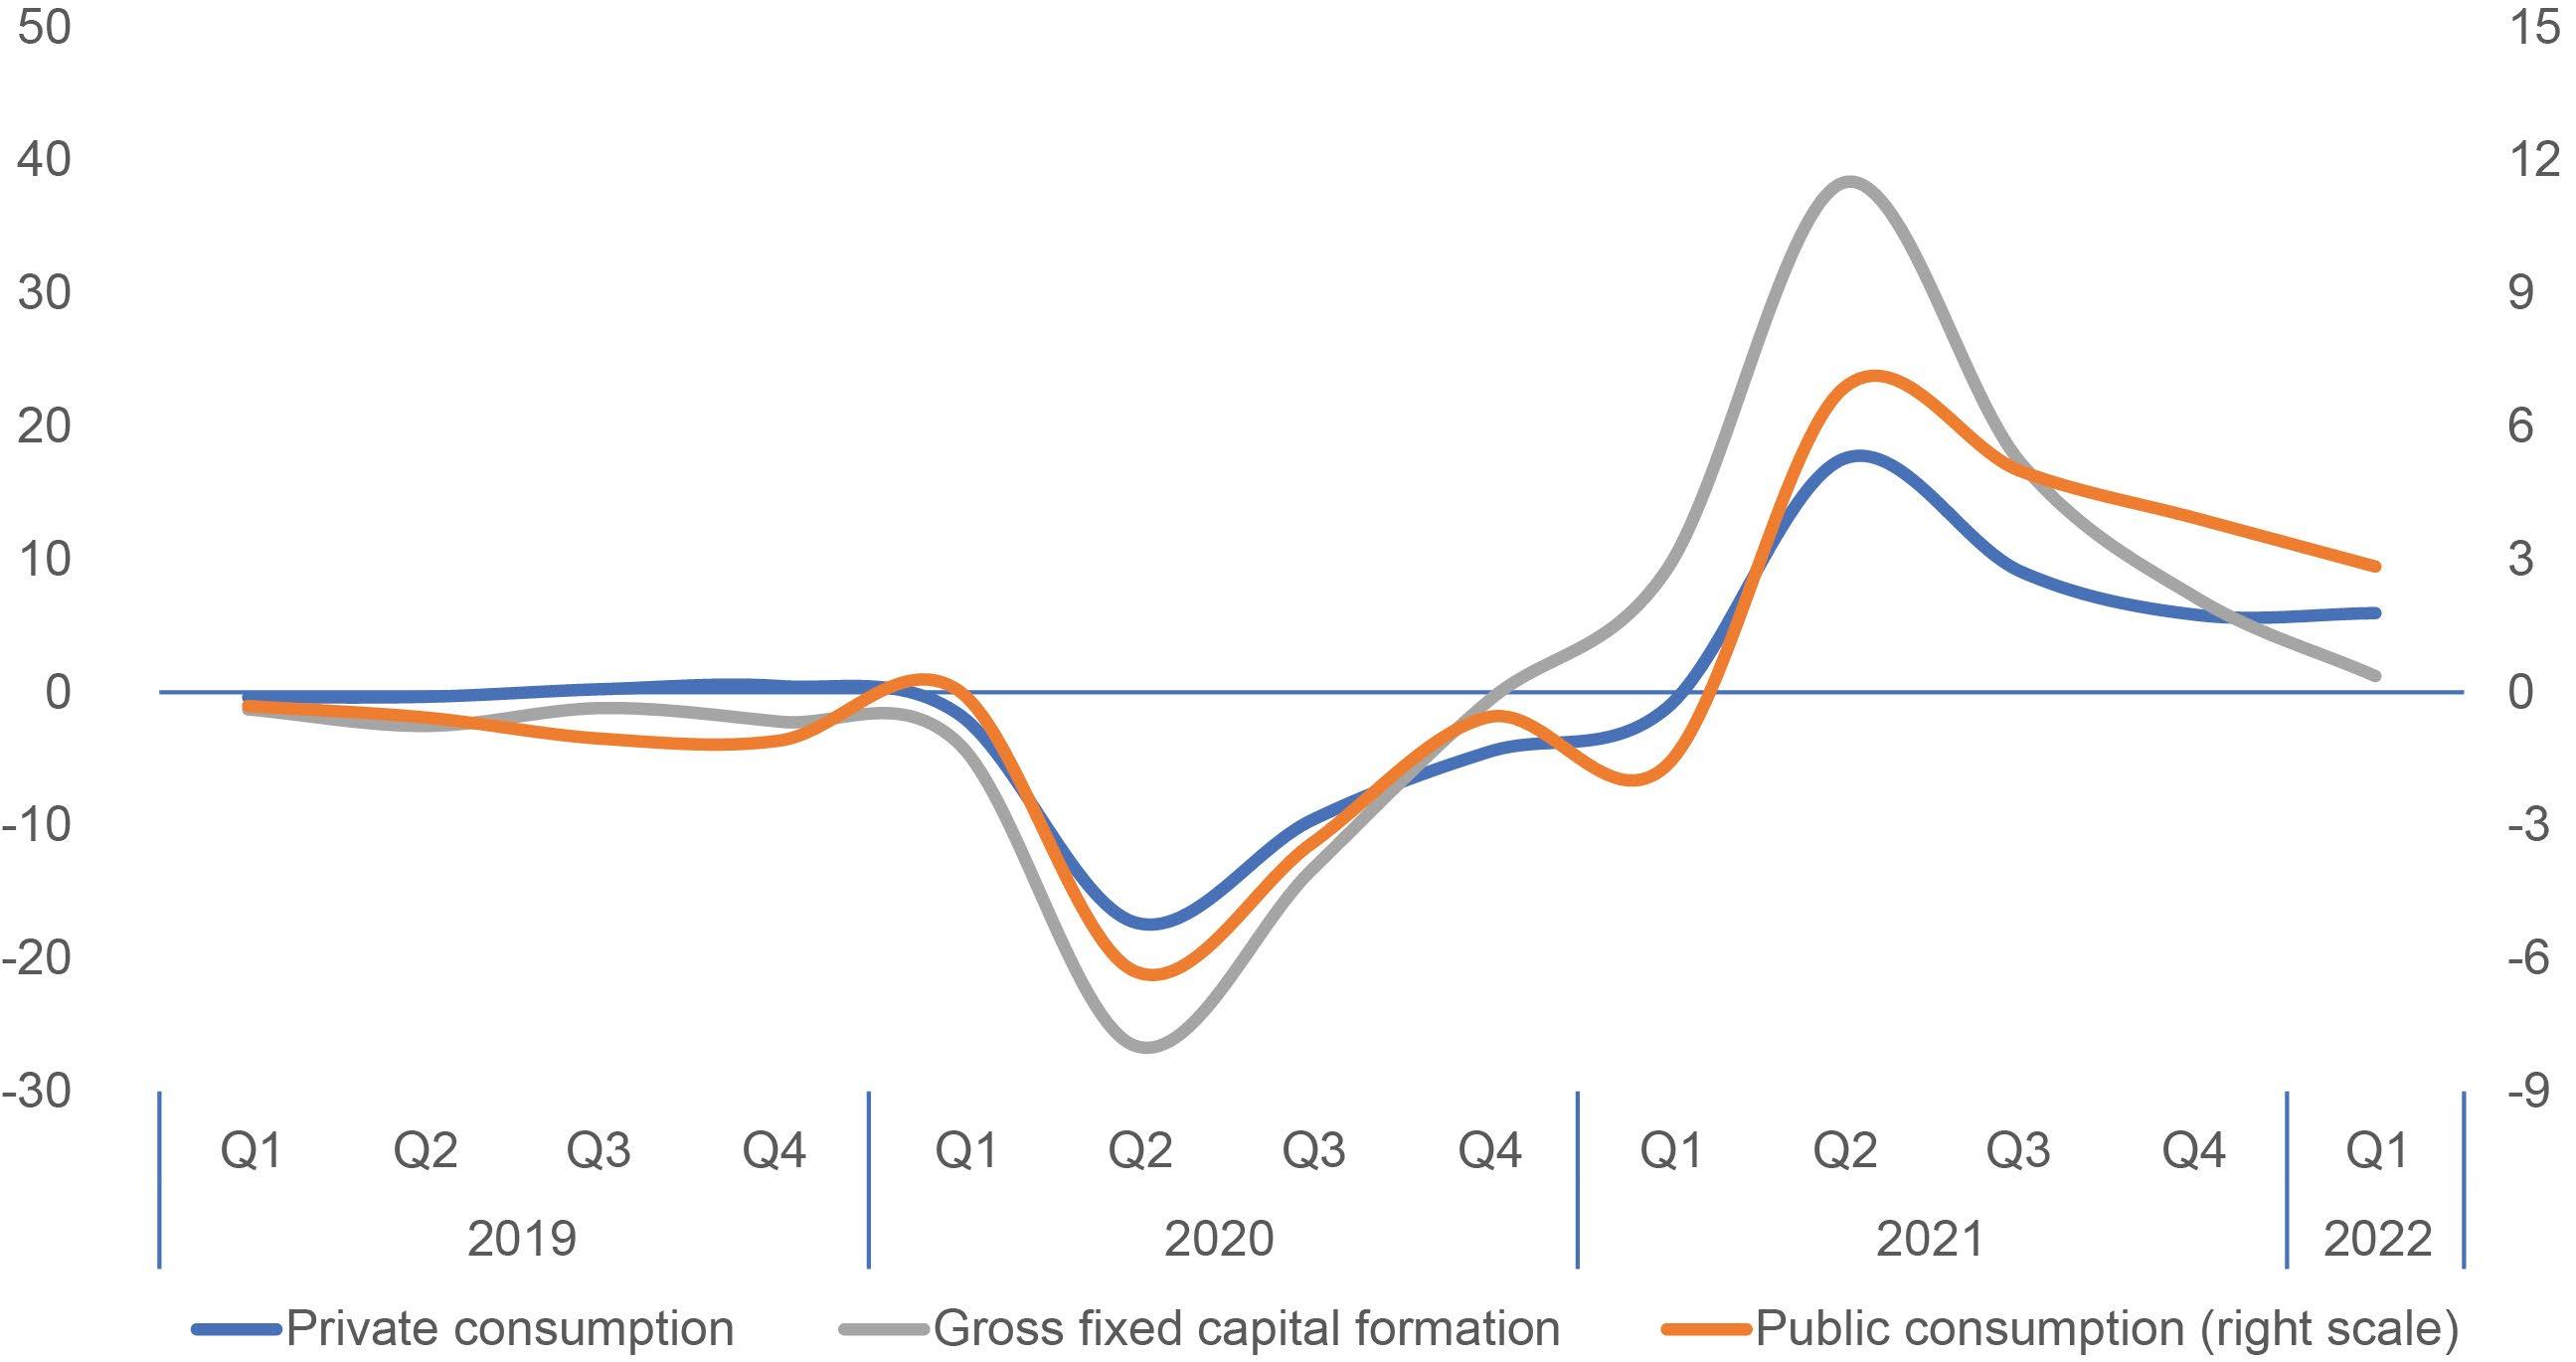
Among aggregate demand components, investment has slowed the most LATIN AMERICA: YEAR-ON-YEAR VARIATION IN PRIVATE CONSUMPTION, PUBLIC CONSUMPTION AND GROSS FIXED CAPITAL FORMATION (Percentages) Source: Economic Commission for Latin America and the Caribbean (ECLAC).
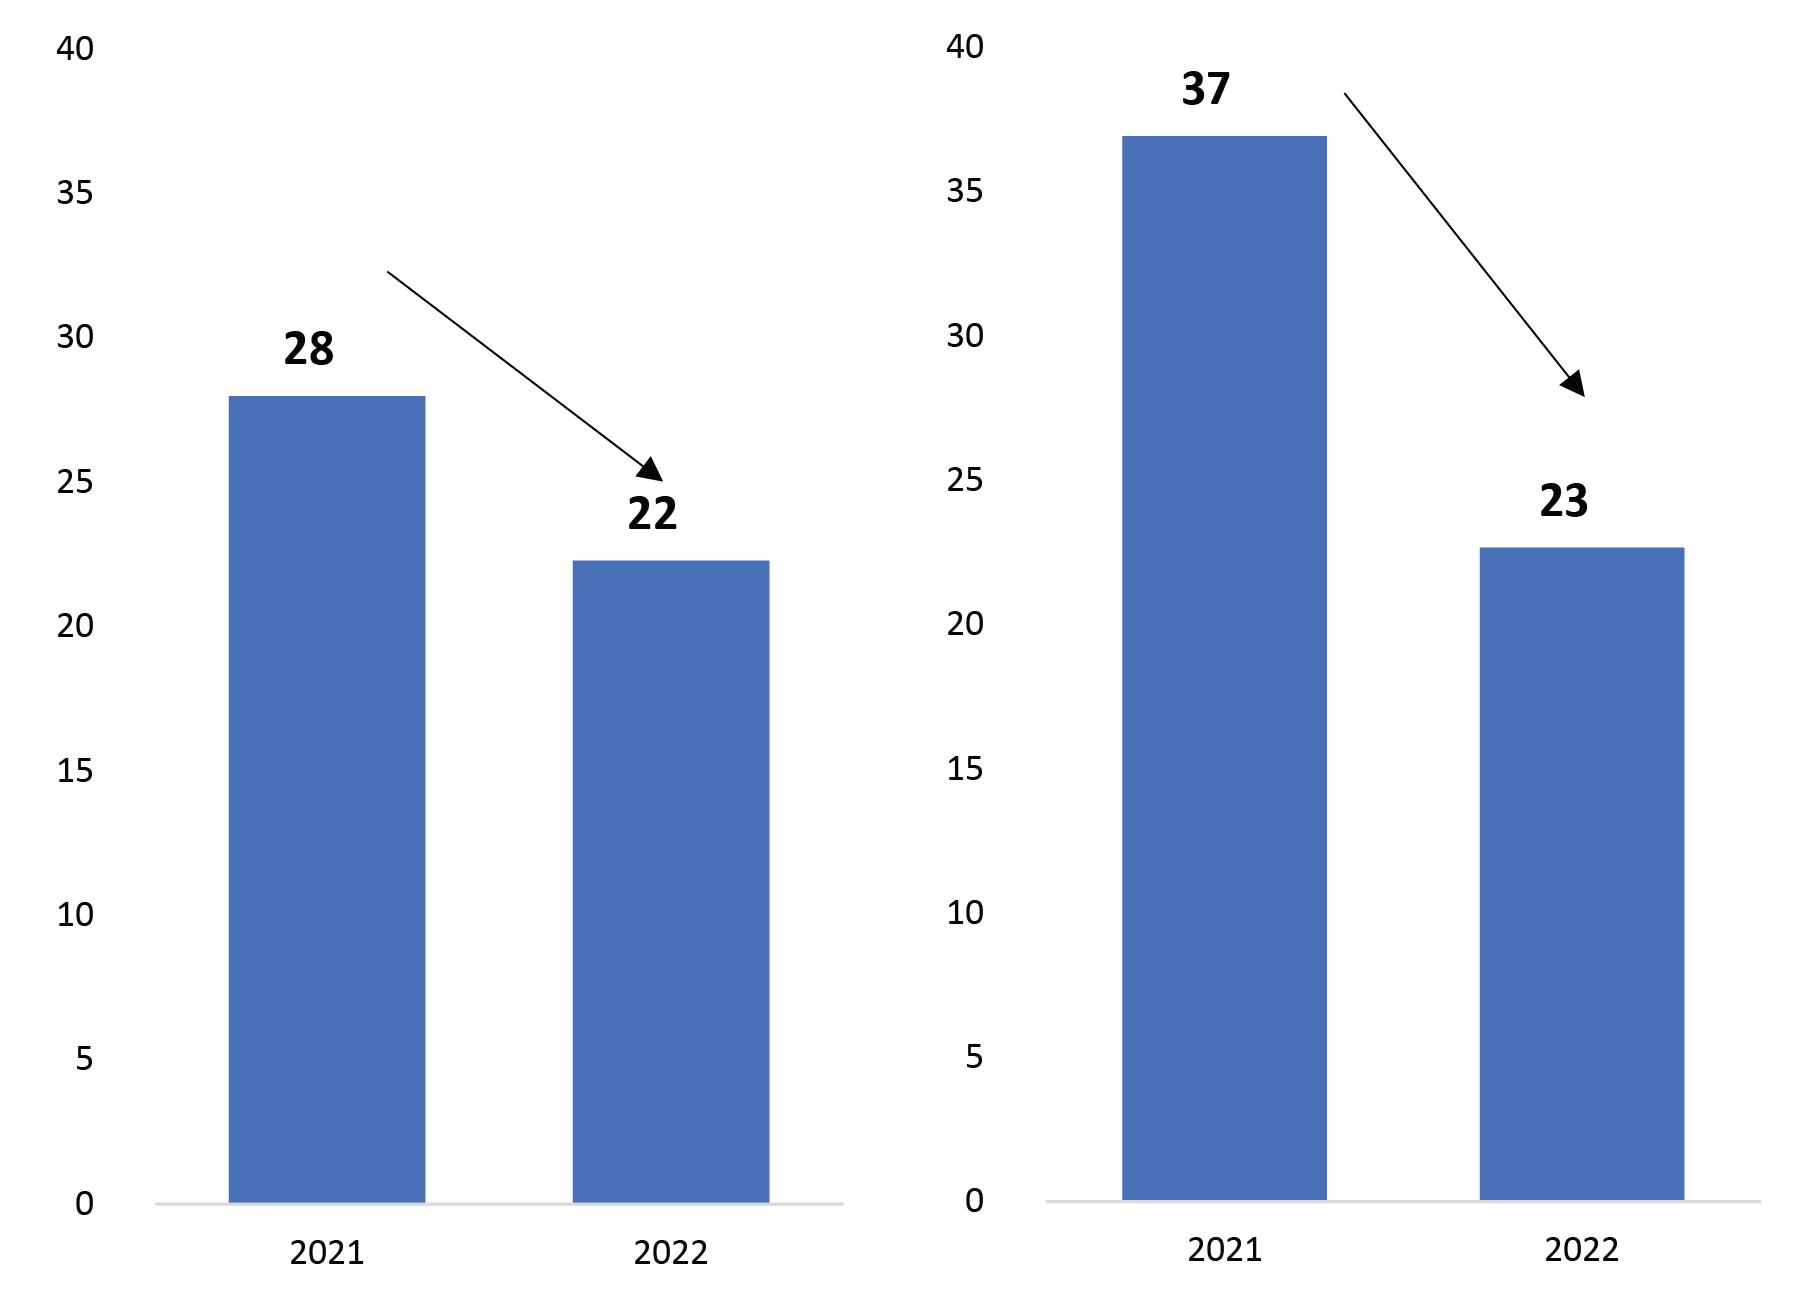
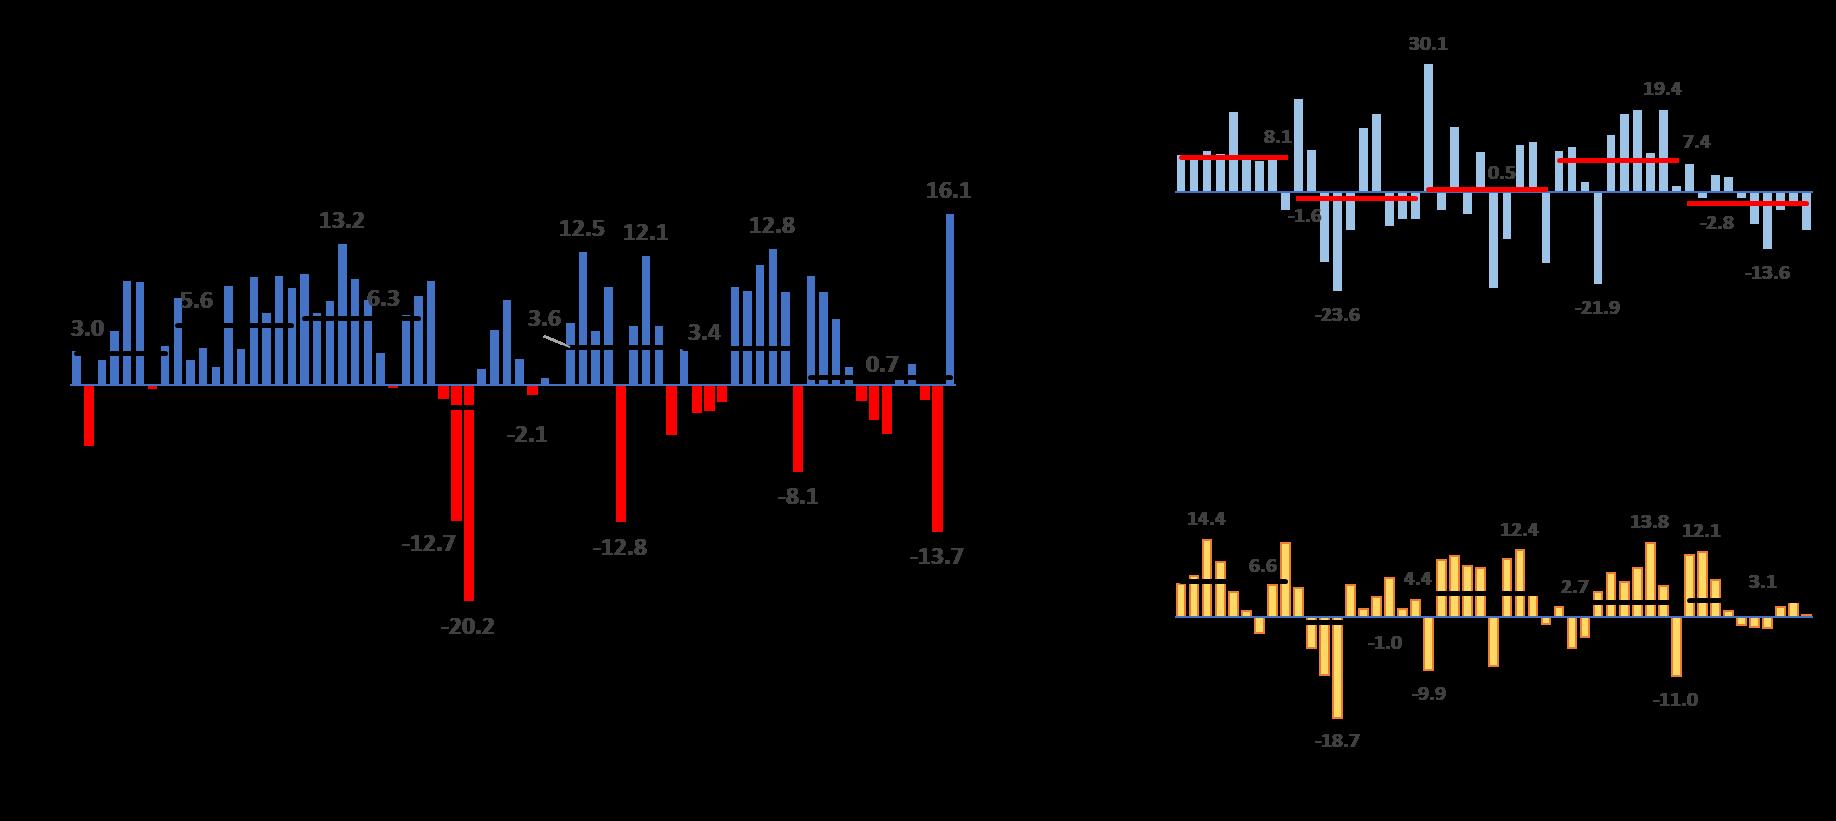
Growth in the value of goods exports, imports and remittances is slowing Exports Imports Source: Economic Commission for Latin America and the Caribbean (ECLAC), on the basis of official data. LATIN AMERICA: VALUE OF GOODS EXPORTS AND IMPORTS IN 2021 AND PROJECTION FOR 2022 (Percentages) LATIN AMERICA AND THE CARIBBEAN (SELECTED COUNTRIES): RATE OF VARIATION IN EMIGRANT REMITTANCE FLOWS (Percentages)

Source: Economic Commission for Latin America and the Caribbean (ECLAC), on the basis of official figures
Note: Does not include averages for economies with chronic inflation (Argentina, the Bolivarian Republic of Venezuela, Cuba, Haiti and Suriname) * Energy index variation was determined using information from 10 countries: Bolivia, Brazil, Chile, Colombia, Costa Rica, Ecuador, Mexico, Jamaica, Peru and Uruguay.
Source: Economic Commission for Latin America and the Caribbean (ECLAC), on the basis of official figures
Inflation is up, and the most vulnerable households are hardest hit
Note: Does not include averages for economies with chronic inflation (Argentina, the Bolivarian Republic of Venezuela, Cuba, Haiti and Suriname)
LATIN AMERICA AND THE CARIBBEAN: 12-MONTH RATES OF VARIATION IN THE CONSUMER PRICE INDEX (CPI), JANUARY 2005 JUNE 2022 (Percentages)
LATIN AMERICA AND THE CARIBBEAN: 12-MONTH RATES OF VARIATION IN THE FOOD AND ENERGY COMPONENTS OF THE CONSUMER PRICE INDEX (CPI) AND IN CORE INFLATION, JANUARY 2019–JUNE 2022 (Percentages)


The depreciation trend in currencies is contributing to rising inflation LATIN AMERICA AND THE CARIBBEAN (SELECTED COUNTRIES): NOMINAL EXCHANGE RATE INDEX FOR THE DOLLAR, SECOND HALF OF 2019–MID-YEAR 2022 (Index, second half of 2019 = 100) Source: Economic Commission for Latin America and the Caribbean (ECLAC), on the basis of official figures * Appreciation (lower values) / depreciation (higher values) of the indicator

December312020(percentage)(1) Beginning of the rate(2)rise Monetary poli cy (percentage)Julyrate,2022(3) (4)(percentageVariationpoints)=(3)(1) JunerateInflationasof2022(5) Brazil 2.00 March 2021 13.25 11.25 11.9 Chile 0.50 July 2021 9.75 9.25 12.5 Colombia 1.75 October 2021 9.00 7.25 9.7 Costa Rica 0.75 Dicember 2021 5.50 4.75 10.1 RepublicDominican 3.00 November 2021 7.25 4.25 9.5 Guatemala 1.75 May 2022 2.25 0.50 7.6 Honduras 3.00 3.00 0.00 10.2 Jamaica 0.50 October 2021 5.50 5.00 10.9 Mexico 4.00 June 2021 7.75 3.75 8.0 Paraguay 0.75 August 2021 7.75 7.00 11.5 Peru 0.25 August 2021 6.00 5.75 8.8 Uruguay 4.50 August 2021 9.75 5.25 9.3 United States 0.125 March 2022 2.375 2.25 9.1 European Union 0.25 July 2022 0.75 0.5 8.6
a
d
e
b
Central banks raised policy rates and dampened growth in monetary aggregates LATIN AMERICA AND THE CARIBBEAN (COUNTRIES THAT USE THE INTEREST RATE AS THE MAIN MONETARY POLICY TOOL) – UNITED STATES AND EUROPEAN UNION: VARIATION IN MONETARY POLICY RATES, DECEMBER 2020–JULY 2022 (Percentages and percentage points) Source: Economic Commission for Latin America and the Caribbean (ECLAC), on the basis of official figures LATIN AMERICA AND THE CARIBBEAN: MONETARY BASE, MEDIAN 12-MONTH RATE OF VARIATION BY COUNTRY GROUPING, JANUARY 2019–MARCH 2022 (Percentages)
c
Monetary
Note: The classification of countries by their monetary and exchange rate framework is based on the method described in IMF, Annual Report on Exchange Arrangements and Exchange Restrictions 2020, p 6 Brazil, Chile, Colombia, Mexico, Peru and Uruguay. Costa Rica, Dominican Republic, Guatemala, Honduras, Jamaica and Paraguay Guyana, Nicaragua, Plurinational State of Bolivia and Trinidad and Tobago Economies with fixed exchange rates: Antigua and Barbuda, Bahamas, Barbados, Belize, Dominica, Grenada, Saint Kitts and Nevis, Saint Lucia, and Saint Vincent and the Grenadines Dollarized economies: Ecuador, El Salvador and Panama Argentina, Bolivarian Republic of Venezuela, Haiti and Suriname. policy rate,

On the fiscal front, declines in deficits have continued as debt levels remain high LATIN AMERICA (16 COUNTRIES): CENTRAL GOVERNMENT FISCAL INDICATORS, 2010–2022 (Percentages of GDP) LATIN AMERICA (16 COUNTRIES): CENTRAL GOVERNMENT GROSS PUBLIC DEBT, 2000–MARCH 2022 (Percentages of GDP) Source: Economic Commission for Latin America and the Caribbean (ECLAC), on the basis of official data.


Public spending has continued to fall in 2022
LATIN AMERICA (16 COUNTRIES): CENTRAL GOVERNMENT SPENDING, BY COMPONENT, (PROJECTION) (Percentages of AMERICA (16 COUNTRIES): TOTAL CENTRAL GOVERNMENT SPENDING, SUBSIDIES AND CURRENT TRANSFERS, 2015–2022 (PROJECTION) (Percentages of GDP)
TOTAL
GDP) LATIN
2019–2022
Source: Economic Commission for Latin America and the Caribbean (ECLAC), on the basis of official data Note: Rounding may lead to discrepancies between individual figures and totals.

High debt levels persist in the Caribbean, exceeding 90% of GDP in 6 countries THE CARIBBEAN (12 COUNTRIES): CENTRAL GOVERNMENT FISCAL INDICATORS, 2010–2022 (PROJECTED) (Percentages of GDP) THE CARIBBEAN (13 COUNTRIES): CENTRAL GOVERNMENT GROSS PUBLIC DEBT, DECEMBER 2021 AND MARCH 2022 (Percentages of GDP) Source: Economic Commission for Latin America and the Caribbean (ECLAC), on the basis of official data.

The will is
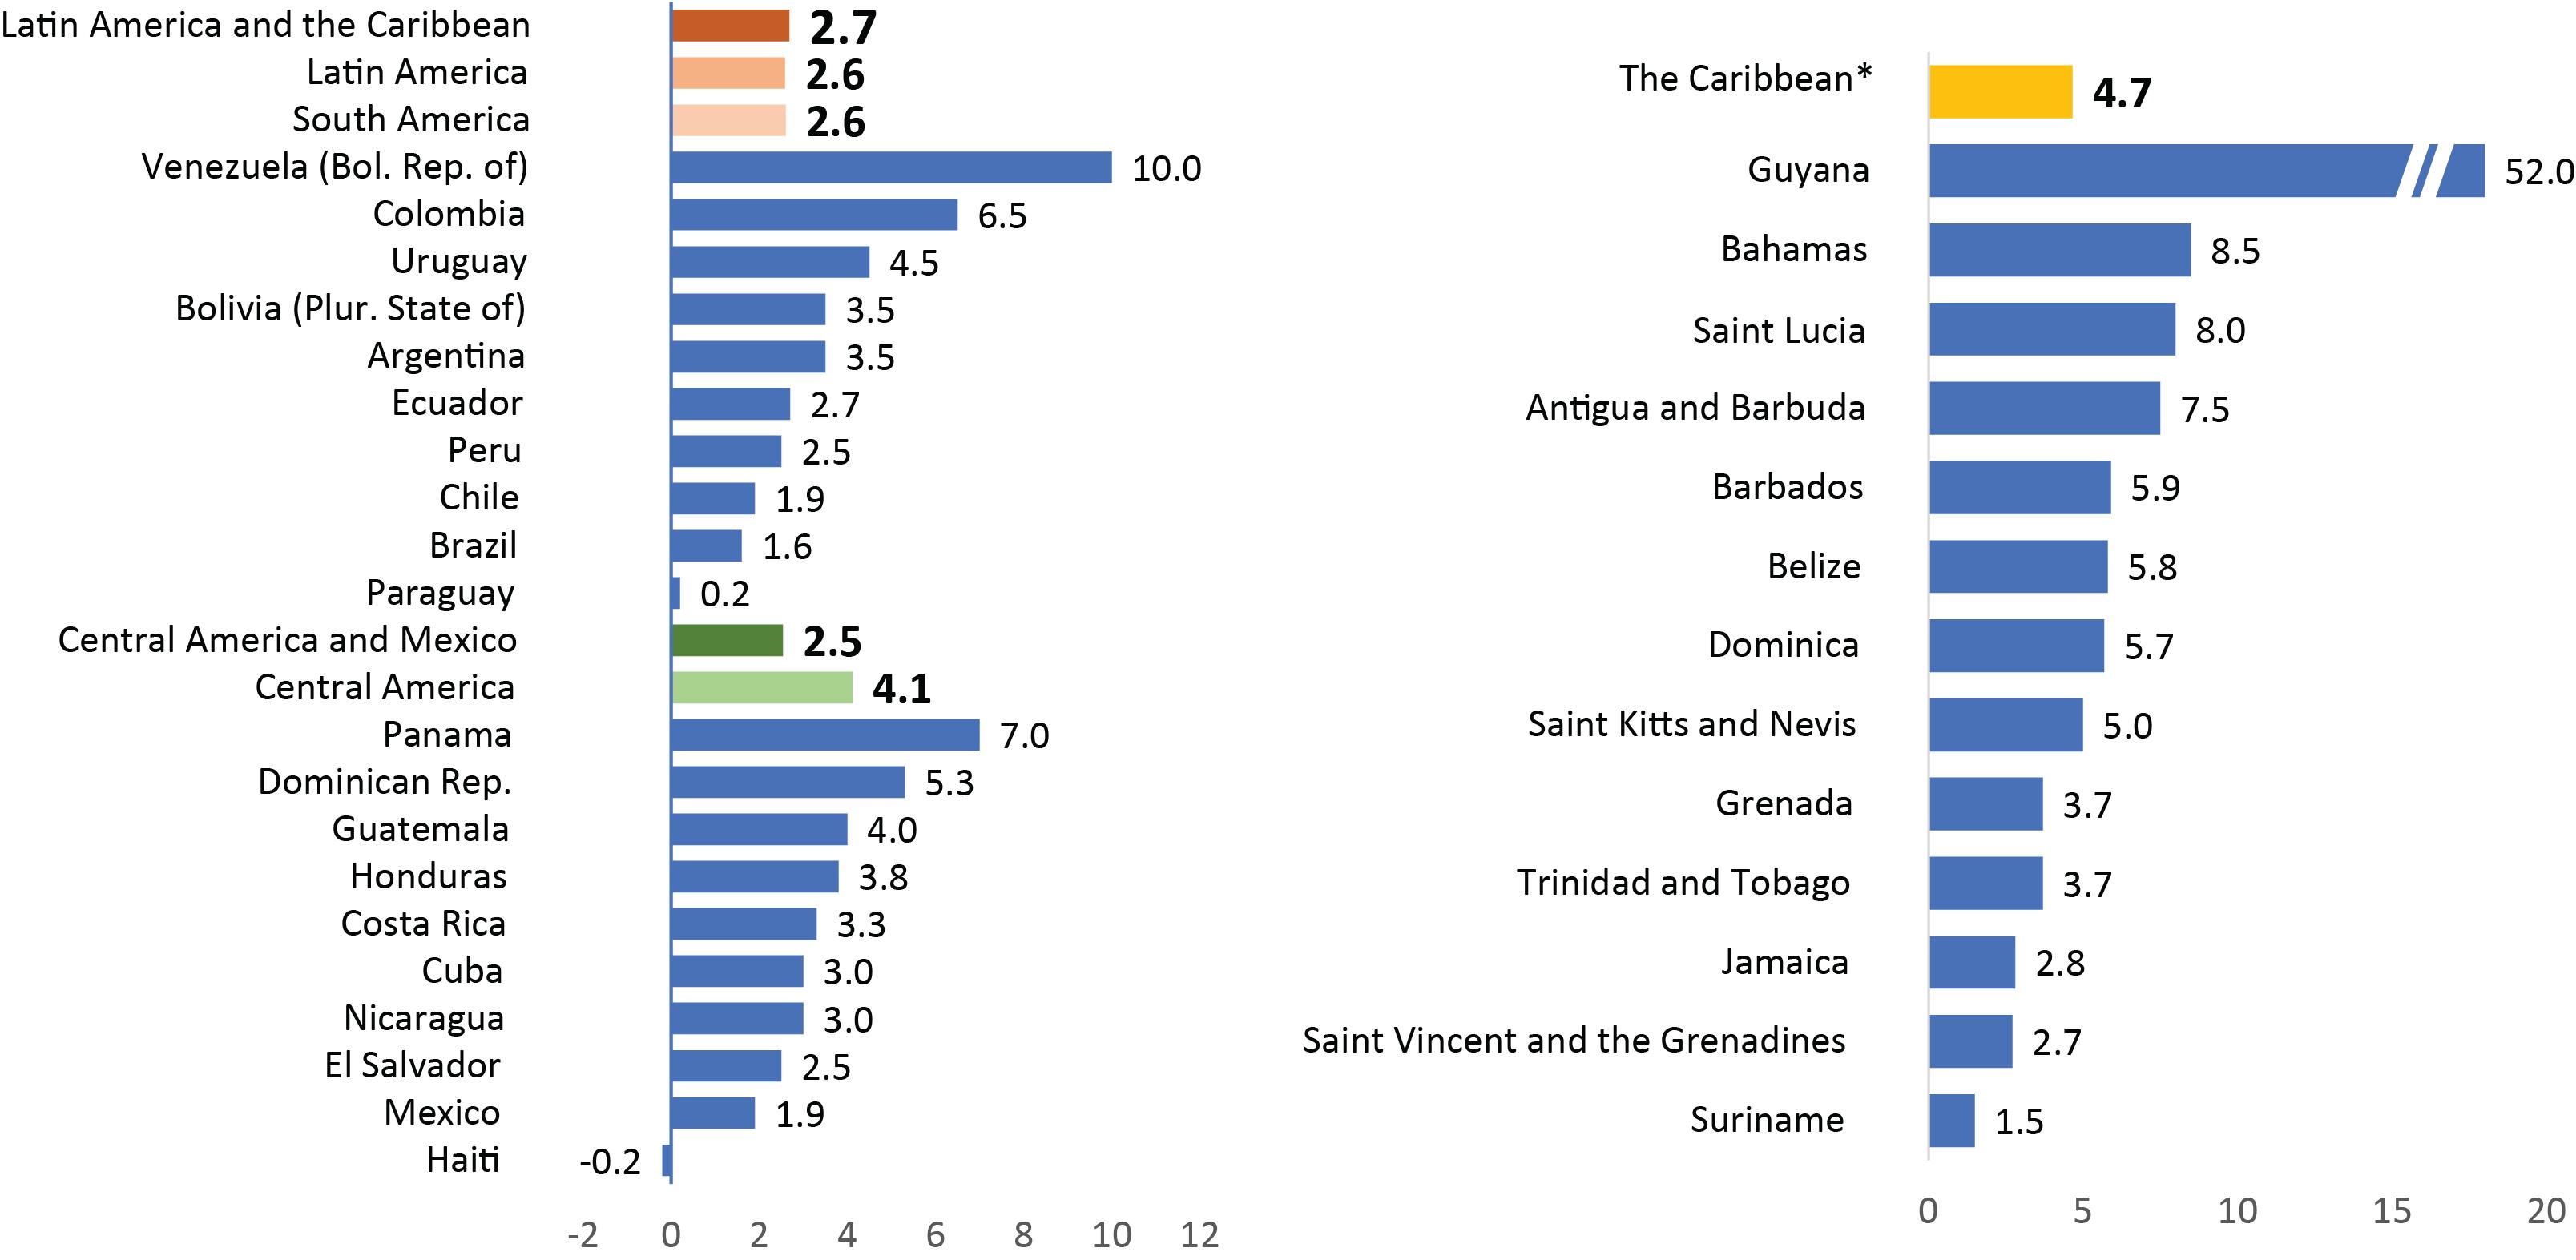
grow by 2.7% in 2022 and the slowdown
expected to continue
Source: Economic Commission for Latin America and the Caribbean (ECLAC), on the basis of official figures.
LATIN AMERICA AND THE CARIBBEAN: PROJECTED GDP GROWTH RATES,
2022 (Percentages)
Nota: Central America includes Cuba, Haiti and the Dominican Republic. Note: Average for the Caribbean does not include Guyana.
region
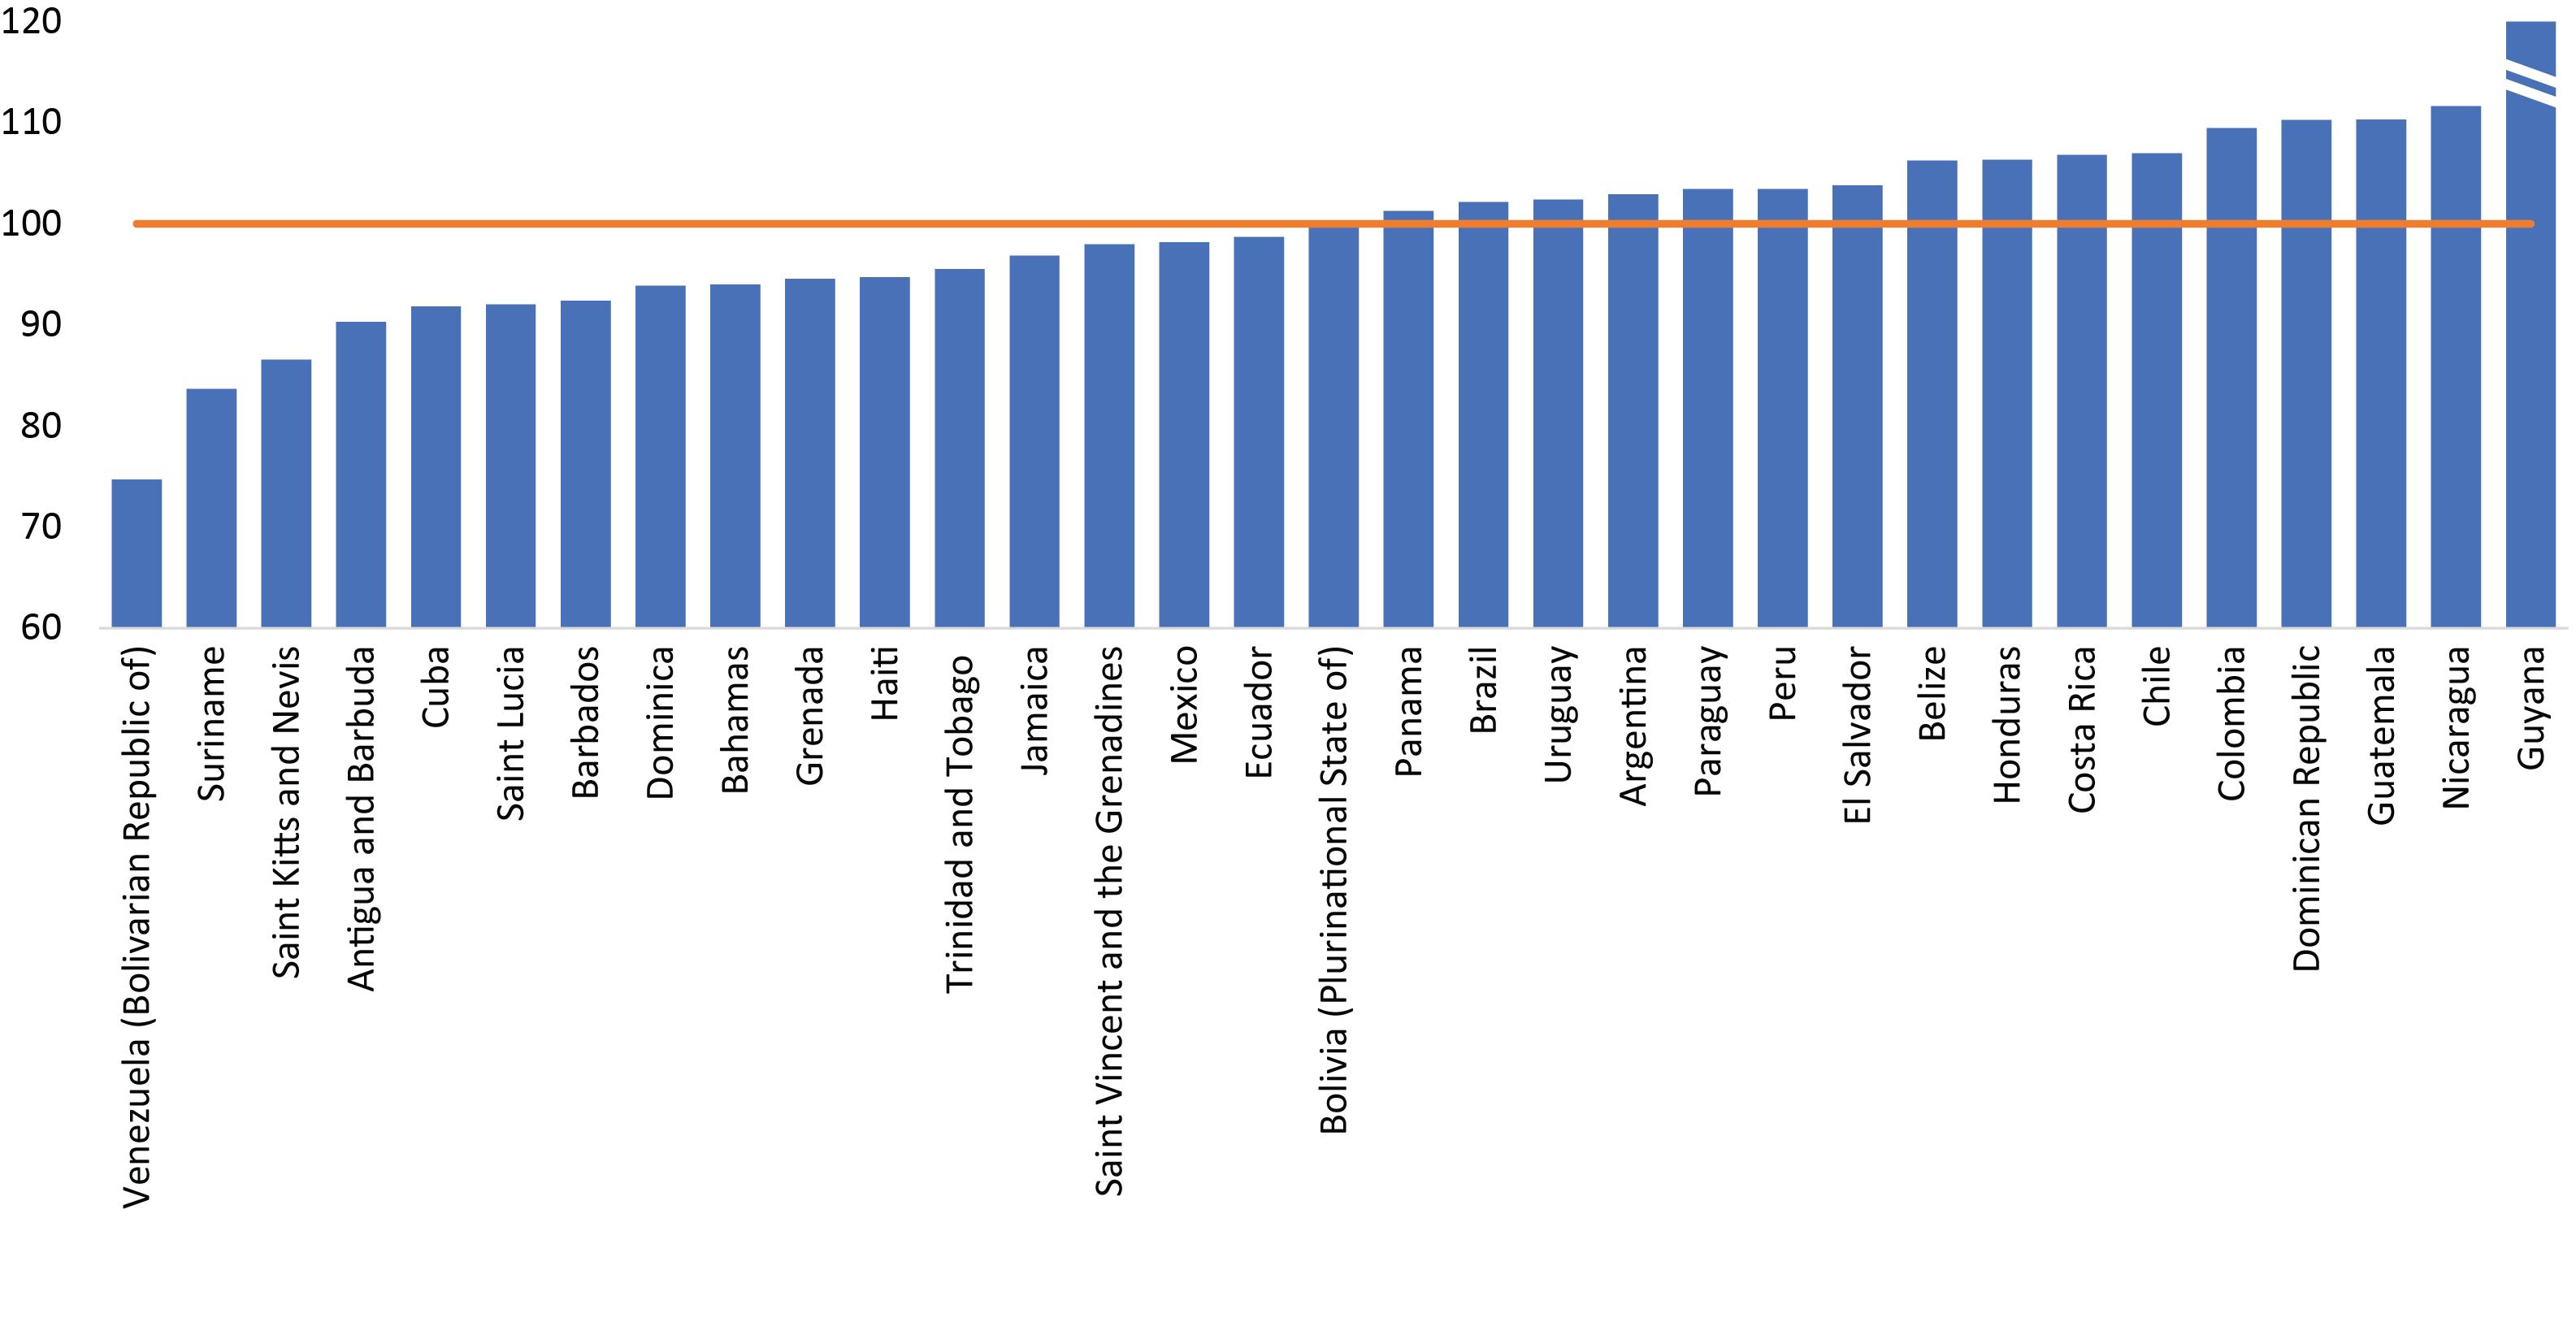
17 16 of the region’s countries are not expected to return to pre-pandemic GDP levels in 2022 LATIN AMERICA AND THE CARIBBEAN: PROJECTED GDP FOR 2022 COMPARED TO PRE-PANDEMIC LEVEL (Index 2019=100) Source: Economic Commission for Latin America and the Caribbean (ECLAC), on the basis of official data.
LATIN AMERICA AND THE CARIBBEAN: PARTICIPATION RATE, UNEMPLOYMENT RATE AND CHANGE IN TOTAL EMPLOYED, BY GENDER (Percentages) Source: Economic Commission for Latin America and the Caribbean (ECLAC), on the basis of official figures. a Estimates 2019 2020 2021 2022a Participation rate 63.3 58.9 61.4 62.6 Women 51.8 47.7 50.0 51.1 Men 75.5 70.9 73.5 74.9 Unemployment rate 7.9 10.3 9.3 9.4 Women 9.5 12.1 11.3 11.6 Men 7.9 10.3 9.3 9.4 Variation in number of employed 1.9 -8.2 6.7 3.2 The slowdown in economic activity is hindering labour market recovery, affecting women to a greater degree
LATIN AMERICA AND THE CARIBBEAN: REAL RATE OF GROWTH OF GROSS FIXED CAPITAL FORMATION, (Percentages) AMERICA AND THE CARIBBEAN: RATE OF GROWTH OF PUBLIC GROSS FIXED CAPITAL FORMATION, 1971–2019 (Percentages)
The trend in investment is a
structural problem
1951–2021
LATIN
The region has the lowest investment ratio Source: Economic Commission for Latin America and the Caribbean (ECLAC), on the basis of official figures. LATIN AMERICA: PUBLIC (RATIO OF PUBLIC GROSS FIXED CAPITAL FORMATION TO GDP) AND PRIVATE (RATIO OF PRIVATE GROSS FIXED CAPITAL FORMATION TO GDP) INVESTMENT EFFORTS, 1970–2019 (Percentages of GDP) WORLD AND SELECTED REGIONS: RATIO OF INVESTMENT TO GDP, 1990–2021 (Ratios on the basis of current dollars, in percentages)

Investment and public capital stock are low compared to other regions SELECTED GROUPINGS AND REGIONS: GENERAL GOVERNMENT GROSS FIXED CAPITAL FORMATION, 2019a (Percentages of GDP at constant prices) SELECTED COUNTRY GROUPS: GENERAL GOVERNMENT CAPITAL STOCK, 2015 (Percentages of GDP) Source: Economic Commission for Latin America and the Caribbean (ECLAC), on the basis of International Monetary Fund (IMF), “Investment and Capital Stock Dataset”. a Weighted averages are calculated on the basis of purchasing power parity GDP in international dollars at current prices.

Macroeconomic
policy challenges In a situation of domestic and external restrictions, the major challenges in terms of macroeconomic policy is to reconcile the trade-offs among different macroeconomic goals: • Boosting sustainable growth • Easing inflationary pressure • Creating quality jobs • Reducing poverty and inequality • For this reason, it is vital to bolster investment This requires greater coordination of fiscal, monetary and exchange-rate policy and good use of the set of tools available to authorities.
Macroprudential instruments • Legal fit • Restriction of certain types of credit • Provisions, etc. Regulation of financial inflows/outflows Exchange-rate instruments • Market interventions • Spot market • Forwards • Lines of credit with central banks and international financial institutions Monetary instruments • Conventional (monetary policy rates, monetary aggregates) • Unconventional (balance sheets) Growth Stability of prices exchange/rateFinancialstabilityEmploymentInvestment/ In these circumstances, the challenge for monetary authorities is linking and coordinating the available tools with other policies


In fiscal policy, expanded space and sustainable public spending are needed
• Adapt
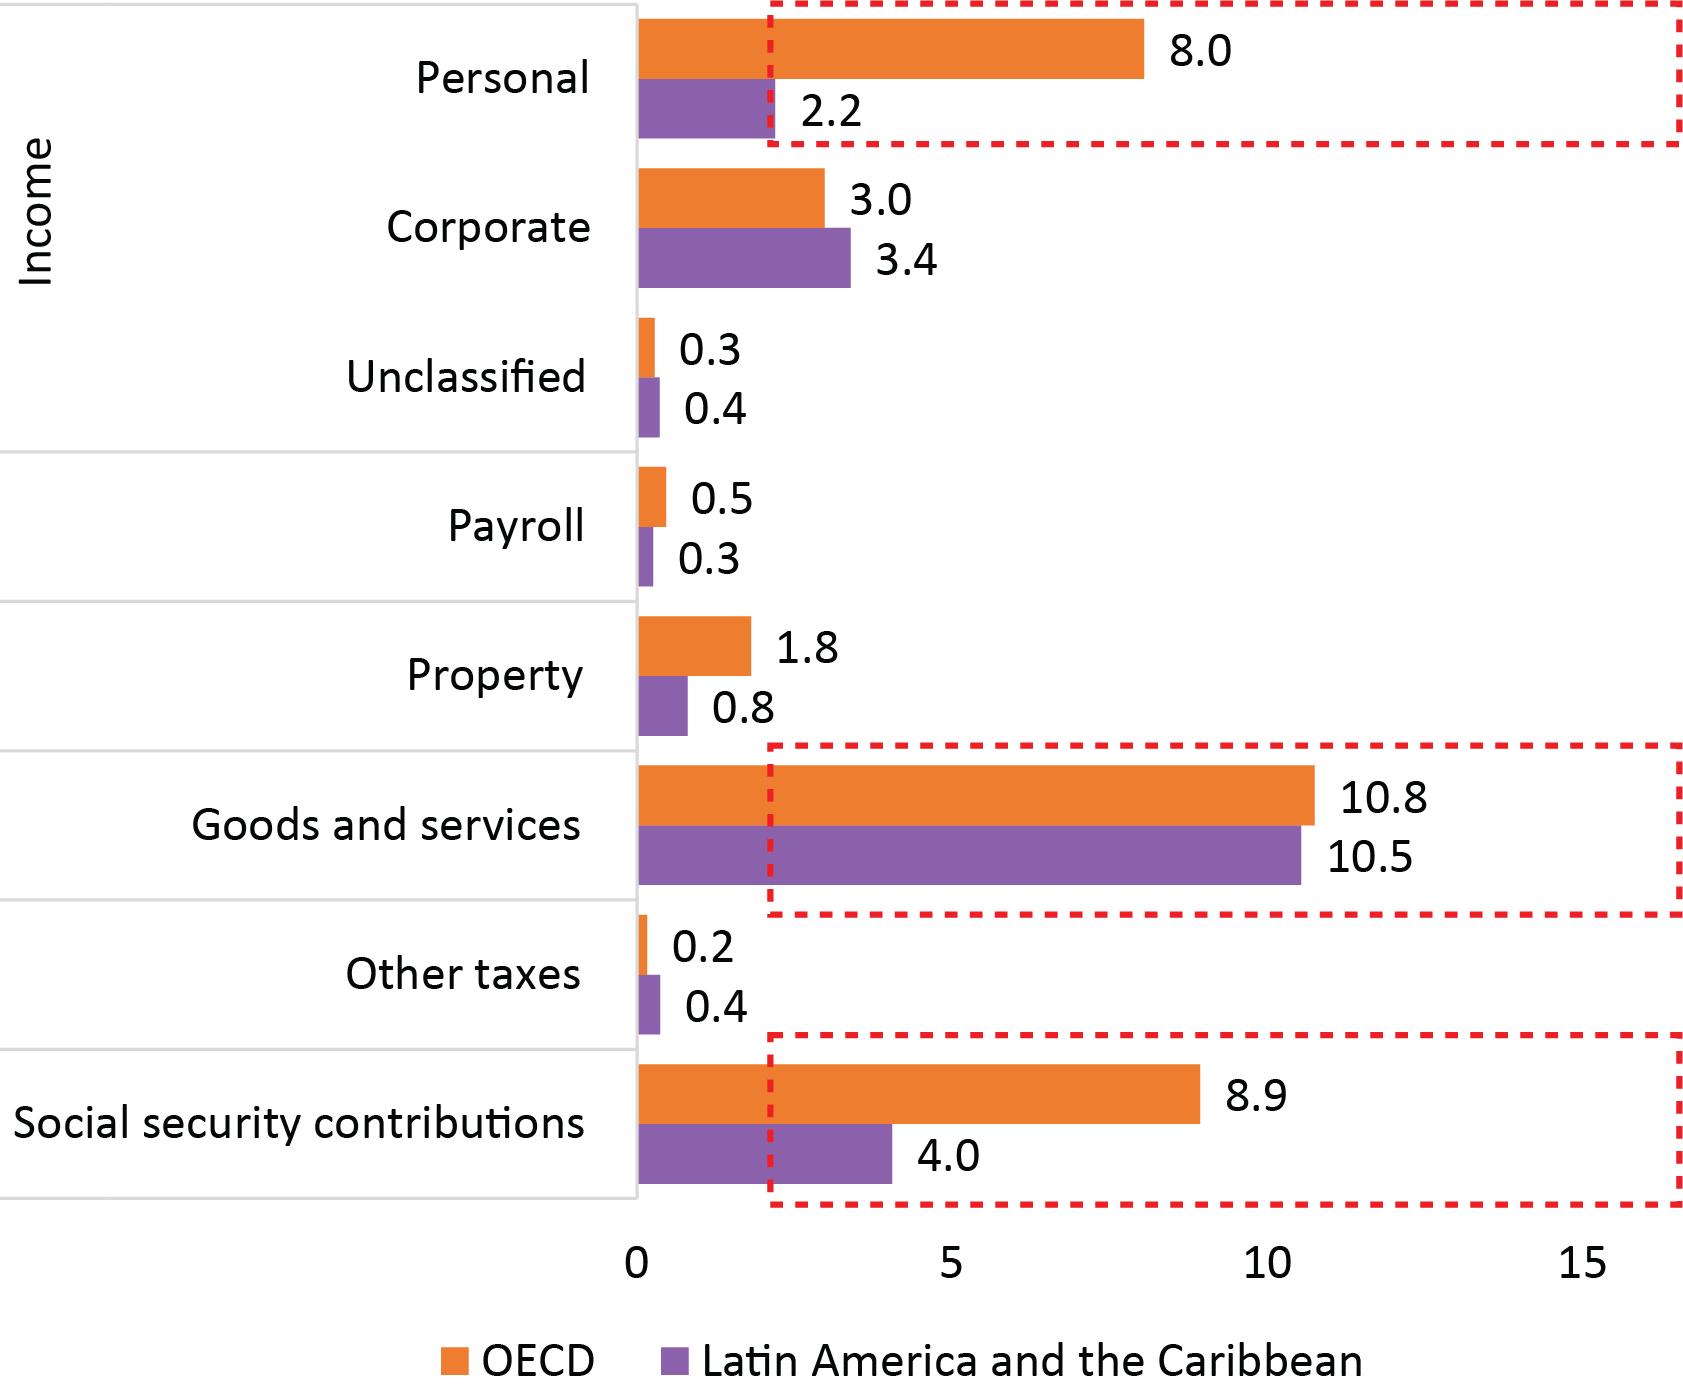
Source: Economic Commission for Latin America and the Caribbean (ECLAC), on the basis of figures from Organisation for Economic Co operation and Development (OECD) and others, Revenue Statistics in Latin America and the Caribbean 2022, Paris, OECD Publishing the short term: End tax evasion: unpaid tax amounted to US$ 325 billion, 6.1% of regional GDP. tax expenditures: average of 3.7% of GDP or 17% of central government budgeted expenditure. tax regulations to new good practices for taxation of the digital economy (base erosion and profit shifting). the medium term: Consolidate personal income tax: 2.2% of GDP in Latin America and the Caribbean, 8.0% of GDP in countries of the Organisation for Economic Co-operation and Development (OECD) in 2020. Expand the scope of wealth and property taxes. Review and update fiscal regimes for exploitation of non-renewable resources. environmental taxes and taxes linked to public health problems.
•
•
•
• Review
In
• Consider
•
LATIN AMERICA AND THE CARIBBEAN (27 COUNTRIES) AND ORGANISATION FOR ECONOMIC CO-OPERATION AND DEVELOPMENT (OECD): GENERAL GOVERNMENT TAX STRUCTURE, 2020 (Percentages of GDP)
In
Properly designed tax incentives within appropriate governance frameworks will move private investment towards strategic sectors (crowding-in).
The green transition and stronger demand for minerals (copper, iron, lithium) that are required by clean technology present a challenge and an opportunity to adapt production methods and technologies.
National public investment systems are important for promoting consistent, efficient and effective public investment.
Challenges to increasing investment
Access to long-term financing with favourable terms to respond to climate change and create low-carbon development options.
The reinvigoration of public and private investment must not be subordinate to anti-inflationary policies.
Reduce coordination problems that hinder the adoption of new and better technology, to create virtuous circles.
Key
messages
Macroeconomic policy must boost sustainable growth, pursue price stability, create quality jobs and reduce poverty and inequality.
Greater coordination of macroeconomic policies is required and fiscal policy must be made sustainable, making use of available monetary policy instruments to avoid subordinating growth and investment to anti-inflationary policy.
It is vital to bolster investment, as it links the short and medium term and is crucial to the response to climate change.
The region is following a path of low growth, similar to the one seen before the pandemic, in a situation of considerable external and internal restrictions.
Macroeconomic efforts must be accompanied by policies on industry, innovation and technological development, trade, social affairs and the care economy.
Financing for development and mobilization of external resources should support countries’ pursuit of sustainable growth and development.
