


GDPGrowth
Q1Q3Q1Q3Q1Q3Q1Q3Q1Q3 20192020202120222023
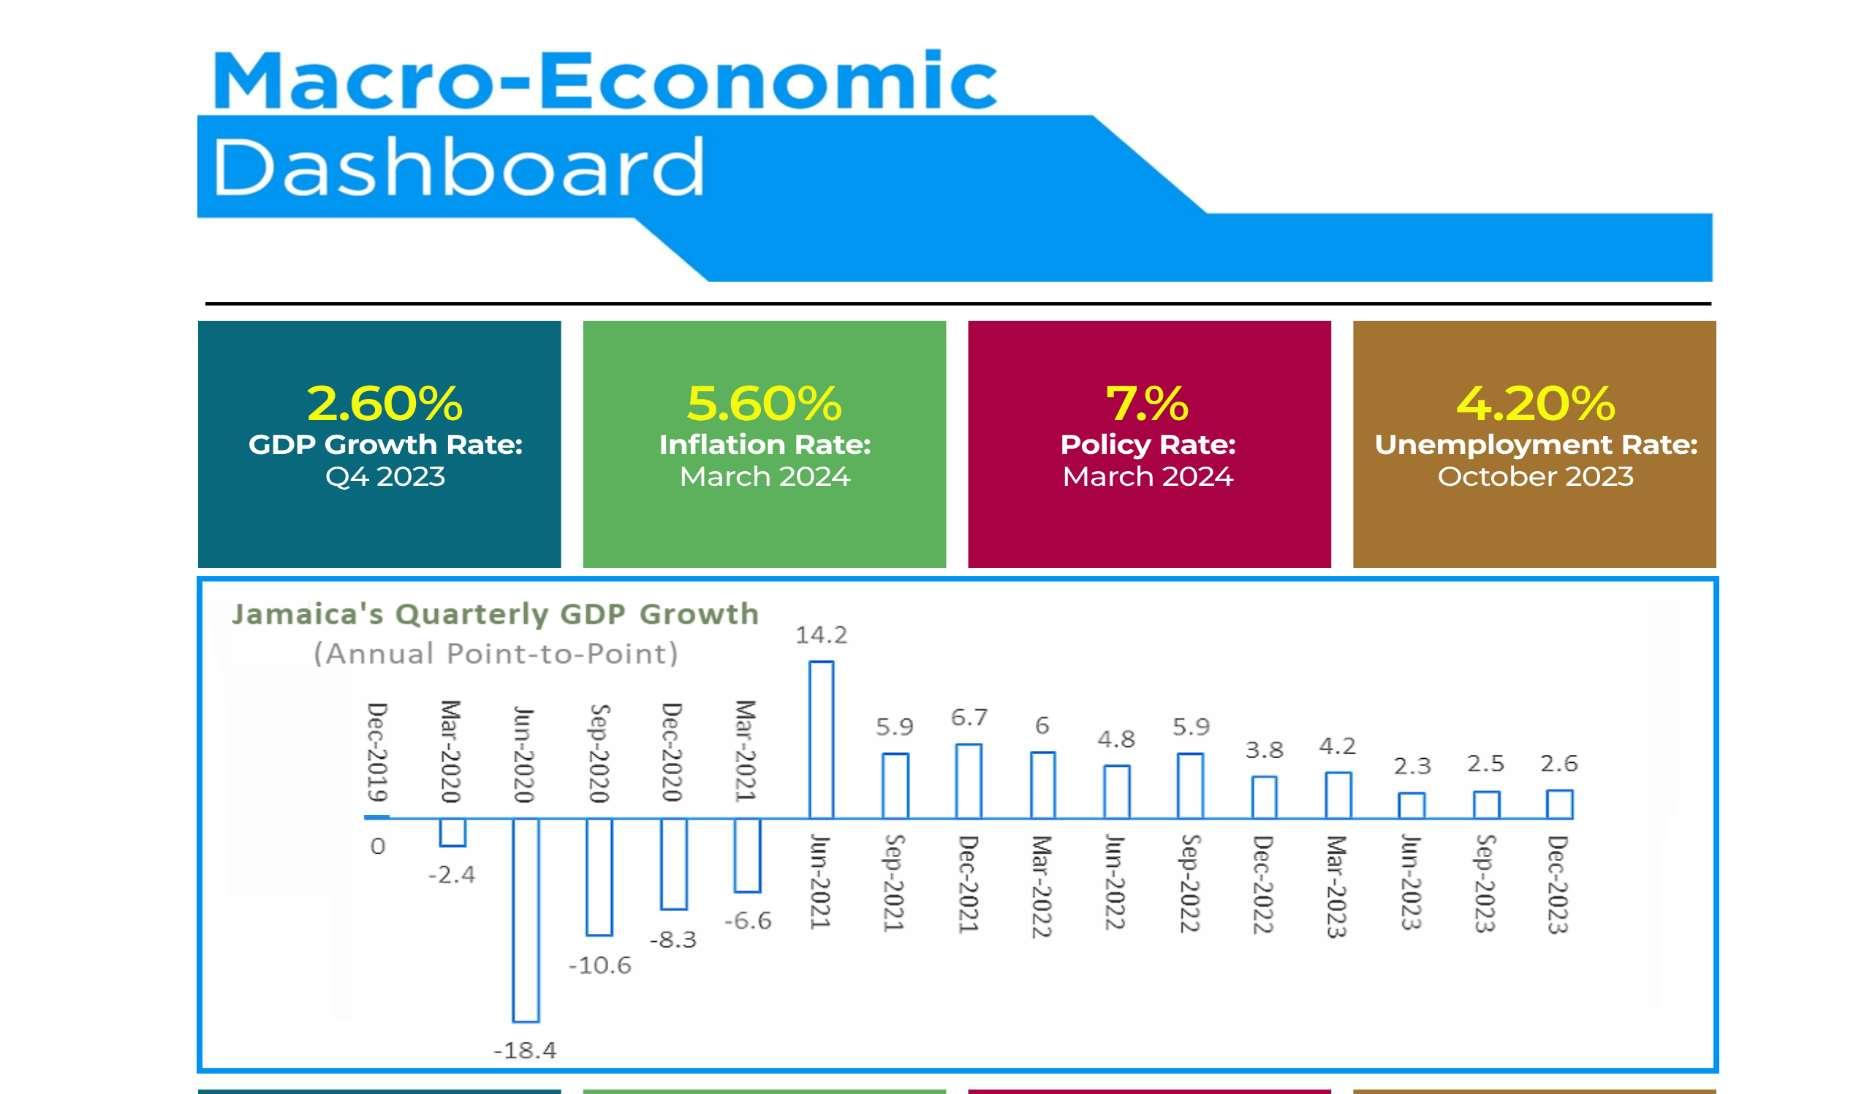
TheStatisticalInstituteofJamaica(STATIN) reports that the domestic economy saw a year-over-year expansion of 1.70% in Q4 2023onaseasonallyunadjustedbasisand 2.60% when adjusted for seasonal variations.Theservicessectoraccountedfor 74.50%ofthisgrowth,withgoods-producing industries contributing 25.50%. Among services, "Hotels and Restaurants" experienced the most rapid growth, expanding by 12.40%, while within goodsproducing industries, Mining & Quarrying sawthehighestgrowthrateat21.50%.
12-MonthPoint-To-PointConsumer Inflation
In March 2024, Jamaica's point-to-point inflation rate dropped to 5.60%, marking a 40-basis point difference from the Bank of Jamaica's targeted range of 4%-6%. This decline was primarily driven by a slower increase in the 'Food and Non-Alcoholic Beverages' division, which saw a rise of 4.80%comparedto7.70%inFebruary.The reduction in prices of agricultural products likeyam,tomato,cabbage,andcarrotplayed a significant role in this division's decline. Notable inflation risks persist, including potentialhikesintaxifaresandprivatesector wageincreasesduetotighteningjobmarket conditions.
The BOJ concluded its Monetary Policy Meeting (MPC) on March 27 to maintain the policy interest rate at 7.0%, stability in the foreign exchangemarket,andtightJamaicandollar liquidity conditions. Risks to the inflation outlook are balanced, with potential higher inflation from second-round effects of fare increasesandwageadjustments.TheMPC remains vigilant and committed to using all available tools to support policy decisions and address inflation risks, including potentialinterestrateincreases.
January2021-February2024


JanMarMayJulSepNovJanMarMayJulSepNovJanMar 202220232024
At the end of March 2024, the Jamaican dollar appreciated by 1.35% month-overmonth to the US dollar, with the weighted average selling rate (WASR) moving from $156.78 at the end of February to close March at $154.70. The Bank of Jamaica (BOJ) did not conduct any flash sales in March.However,inthecurrentmonth,there have been three flash sales totaling $90 millionbetweenApril9thandApril11th.
1,500.00 2,000.00 2,500.00 3,000.00 3,500.00 4,000.00 4,500.00 5,000.00 5,500.00
JanAprJulOctJanAprJulOctJanAprJulOctJan 2021202220232024
Thestockofnetinternationalreserves(NIR) asatend-March2024wasUS$5.14billion,a US$438.39 million increase from endFebruary. Foreign assets increased by US$423.61 million, mainly due to a US$ 420.11 million increase in currency and deposits. Meanwhile, foreign liabilities decreased by US$14.78 million, with liabilitiestotheInternationalMonetaryFund (IMF) accounting for 100% of total foreign liabilities,ofUS$94.46million.
International Merchandise Trade For the period January to November 2023, Jamaica’s total expenditure on imports was valued at US$6,982.00 million, marking a 1.60%declinecomparedtotheUS$7,095.50 millionspentduringthesameperiodin2022. This decrease was primarily driven by reduced imports of "Raw Materials/Intermediate Goods" and "Fuels and Lubricants," which fell by 5.00% and 13.90% respectively. Meanwhile, earnings fromtotalexportsforthesameperiodtotaled US$1,862.70 million, a 12.10% increase from the US$1,661.70million earned in the corresponding 2022 period. The uptick in total exports was chiefly attributed to the heightened value of exports of "Crude MaterialsexcludingFuel’’.
Jamaica'stopfivetradingpartnerswerethe US, China, Brazil, Japan, and Colombia. Expenditure on imports from these nations
amountedtoUS$4,282.10million,reflecting a 1.30% decrease compared to the corresponding period in 2022. This decline was largely driven by reduced imports of "Mineral Fuels." Conversely, the leading destinations for Jamaica's exports were the US, Puerto Rico, Latvia, the Russian Federation, and Iceland. Revenue from exportstothesecountriesroseby10.90%to reachUS$1,269.30million.
The ISM Manufacturing PMI registered 50.30%inMarch,up2.50percentagepoints fromthe47.80%recordedinFebruary2024, representing an expansion in the Manufacturing sector. Economic activity in the Services sector contracted in March 2024 as the Services PMI registered at 51.40%, 1.20 percentage points lower than the52.60%recordedinFebruary.
TheunemploymentrateinMarch2024came in at 3.80%, 10 basis points less than the 3.90%recordedinFebruary.
Job growth occurred in healthcare, government, and construction. The job growth which remains mostly unchanged sawnonfarmpayrollincreasingby231,000, this growth continues to fuel consumer spending.TheinflationrateforMarchcame inat3.50%,30basispointsabovethe3.20% in February. The marginal increase in CPI wasaresultofa3.80%riseinthefoodand energyindex.
Existinghomesalesroseby9.50%monthover-month(MoM)inFebruary2024to4.38 million but decreased by 3.30% year-overyear.Housingdemandremainsonasteady rise in tandem with population and job growth.
The Federal Open Market Committee (FOMC) of the Federal Reserve System convened its latest meeting on March 20, 2024, maintaining the federal funds rate at 5.25% - 5.50% for the fifth consecutive session. The Committee underscored its commitmenttowithholdreducingthefederal funds target range until inflation demonstrates sustained movement towards 2%. Additionally, the Federal Reserve continues to decrease its holdings of U.S. Treasury securities, agency debt, and agencymortgage-backedsecurities.
Recenteconomicindicatorsindicatearobust expansion of the U.S. economy, with consistent job gains and a low unemployment rate. Although inflation has
moderated over the past year, it remains elevated. The FOMC believes that risks to achieving its employment and inflation objectivesareincreasinglyaligning.
Source: National Bureau of Statistics of China
For the month of March 2024, the year-onyear national Consumer Price Index (CPI) experiencedadecline,withthecostoffood decreasing by 2.70%, non-food items increasingby0.70%,thepriceofconsumer goods decreasing by 0.40%, while services recordedanincreaseof0.80%.Overall,from January to March, on average, the national CPImaintainedthesameasthesameperiod lastyear.
China's manufacturing industry also experienced a 1.70% increase in its PurchasingManagerIndex(PMI)relativeto February.Thisincreasewashigherthanthe threshold and indicates a rebound in the climate level of the manufacturing industry. Additionally, according to preliminary estimates,thegrossdomesticproduct(GDP) in the first quarter of 2024 increased by 5.30%yearonyearatconstantprice,andby 1.60%overthatinthefourthquarterof2023.
Thus, notwithstanding external pressures, China’s national economy further consolidated its momentum for quarter one
2024withitsprogressinMarch,accelerating on a continued positive trend towards economicrecovery.
Indicator January February March
Source: Eurostat; the Statistical office of the EU
N/A
InMarch2024,EUannualinflationdeclined further to its lowest level since July 2021, primarily due to falling energy prices, and unemployment remained at historically low levels. Additionally, the EU economic sentiment showed signs of improvement, reversing the decline observed in the previous month. This rise was primarily driven by improved confidence among retailers,consumersand,toalesserextent, services and industry managers, while confidenceremainedstableinconstruction.
InFebruary2024,bothindustrialproduction and retail trade remained below their 2021 levels, despite increases in industrial production.GDPgrowthcontinuestopresent aflattrend.
Indicator January February March
0.80% N/A
Source: Central Bank of Trinidad & Tobago
For March 2024, the Monetary Policy Committee(MPC)maintained themonetary policy rate at 3.50%. This was due to the observation that the Trinidad and Tobago economy is continuing on a path of steady recovery, supported by good credit expansion. At the same time, despite the recent increase, inflation remained at less than1%andshort-terminterestdifferentials, while still relatively wide, have started to narrow. In addition, The IMF continues to maintain a positive economic outlook for Trinidad&Tobagowiththeexpectationthat realGDPwillexpandby2.40%for2024.
Notwithstanding, downside risks present somelevelofuncertaintyfortheeconomy.In the short term these risks stem from uncertaintyintheglobalenergymarketand disappointments in domestic energy productionwhichcouldnegativelyaffectthe economy.
Indicator January February March
6.20% N/A
Source: Central Bank of the Dominican Republic
TheCentralBankoftheDominicanRepublic (BCRD)maintaineditsmonetarypolicyrate at7.00%forMarch2024.Thisdecisionwas maintainedwiththeexpectationthatinterest ratesinadvancedeconomieswouldremain highforaperiodoftimelongerthanexpected and that the raw material prices would continuetoincrease.
Notably, despite the minute increase, the DominicanRepubliccontinuestoexperience adeclineinyear-on-yearinflation,leadingto the rate being well within the center of the target range of 4.0% ± 1.0%. The BCRD forecaststhatinflationwillremainwithinthis range, under an active monetary policy scenario.Atthenationallevel,theDominican economy continues to become more dynamic, with an expansion of the monthly indicator of economic activity (IMAE) of 6.20% year-on-year in February, bringing averagegrowthto5.40%year-on-yearinthe first two months of 2024. This result was drivenbytheperformanceofthehotels,bars and restaurants sector; as well as construction,manufacturing,commerceand financialservices.
Indicator February March
Source: Banco de Mexico
For the first time since 2021, Banco de Mexico reduced the monetary policy rate. This was done effective March 22, 2024, where the MPR was reduced by 25 basis pointsto11.00%,inordertoensurethatthe monetary stance remained restrictive and impactful to achieve the outcome of the convergenceofinflationtothegoalof3%in the forecast horizon; the second quarter of 2025.
The weight of the Mexican peso has appreciated,anditsvolatilityhasdecreased. Additionally, it is expected that in the first quarterof2024,economicactivitywillshow greater dynamism in relation to the weakness recorded inthe previous quarter, and the labor market continues to show strength. A slight increase in inflation was recorded for March 2024, however the convergenceofinflationtotargetremainsas forecasted.
Domestic risks to the Mexican economy include the persistence of core inflation, exchange rate depreciation, greater cost pressures,andclimateimpacts.Onaglobal scale, risks include worsening geopolitical tensions, prolonged inflationary pressures,
tight financial conditions and, to a lesser extent,challengestofinancialstability.
Indicator February March
Source: Banco de la República Colombia
The Central Bank of Colombia reduced the monetary policy rate by 50 basis points effectiveMarch26,2024.Thisdecisionwas taken considering the favorable downward trend of inflation since 2024 and the recent decreaseandstabilityoftheexchangerate.
Duetothedownwardtrendof inflationover thepastthreemonths,theinflationforecast fortheendof2024wasadjustedfrom5.9% to5.4%,withexpectedconvergencetowards thetargetof3%inarangeof+/-1ppbymid2025. Economic activity continues to decelerateasthemanufacturing,commerce and construction industries continue to experiencedeclines.However,itisexpected thattheirrecoverywillbepositivelyimpacted bythedeclineinthemonetarypolicyrate.
Notwithstanding, there exists risks and uncertainties to the Columbian economy. Thisincludesthelessenedthoughcontinued impacts of the El Niño phenomenon, international financial conditions, high energy rates in certain parts of the country and an upward movement of inflation inducedbythedecreaseintheMPR.
Peru
Source: Central Reserve Bank of Peru
The Central Reserve Bank of Peru (BCRP) maintaineditsmonetarypolicyrateat6.25% for March 2024, with a projected 25-basis pointreductionexpectedforApril2024.
The year-on-year inflation returned to its downwardtrenddespitethe0.27%increase in February. Thus, year-on-year inflation is projected to continue its downwardtrend in the forecast horizon and will be within the targetrangeinthecomingmonths.InMarch, notably,allexpectationindicatorswereinthe optimistic range. However, the 12-month expectation indicators showed a slight deterioration.
Theoutlookforglobaleconomicactivityalso indicates moderate growth in the event of lower inflationary pressures. However, volatility in financial markets continues, driven primarily by uncertainties in the initiation of monetary policy easing in advancedeconomies.Additionally,thereare potential risks to fuel and freight price stability due to growing international conflicts.
Chile
Source: Banco Central de Chile
The Central Bank of Chile has reduced the monetarypolicyrateby75basis-points. This deliberatechoiceisaimedatreinforcingthe continueddecreaseininflation,asindicated by the annualConsumer PriceIndex (CPI), with the anticipation that inflation will converge with the bank's target range of 3.0%bythelatterhalfof2024.Concurrently, the monetary policy rate is expected to stabilize at its neutral level within the same period.
In recent years, Jamaica has made impressive strides in macroeconomic stability, with inflation and unemployment reaching historic lows. Additionally, the reductioninpublic-sectordebtandimproved credit ratings underscore the government's commitmenttofiscalresponsibility, creating a favorable environment for business expansion and investment. The government's recent budget debate highlights key initiatives aimed at further fueling this growth, with significant benefits forbusinesses.
Oneofthehighlightsofthebudgetdebateis the reduction in the corporate income tax (CIT) rate, offering tangible benefits to businesses operating in specific sectors. Independent Power Producers (IPPs) generatingatleast75%oftheirenergyfrom renewable resources will see their tax rate slashed from 33 1/3% to 25%. This incentivizesinvestmentinrenewableenergy
infrastructure, aligning with Jamaica's broader sustainability goals while creating opportunities for businesses in the renewable energy sector. Additionally, Regulated Trust and Corporate Service Providerswillbenefitfromasimilarreduction intheCITrate,furtherenhancingJamaica's appeal as a hub for financial services and fostering a conducive environment for corporateserviceproviders.
The budget debate also introduces measures aimed at bolstering the growth trajectory of small and medium-sized enterprises (SMEs),particularly those listed ontheJuniorStockExchange.Byincreasing the maximum permitted voting equity capitalization for companies listed on the Junior Stock Exchange, businesses can access additional capital while enjoying the tax benefits associated with listing on the JuniorMarket.
The implementation of these initiatives heralds a new era of opportunity for businesses operating in Jamaica. As Jamaica's economy continues to thrive, businessesstandtobenefitimmenselyfrom the government's proactive measures. Whether in renewable energy, financial services, or SME sectors, opportunities abound for those ready to capitalize on Jamaica's economic resurgence. With innovationand adaptability, businessescan thrive in this dynamic and promising landscape, contributing to Jamaica's ongoingjourneytowardsprosperity.
Sources: Statistical Institute of Jamaica (STATIN),BankofJamaica(BOJ),Planning Institute of Jamaica (PIOJ), Bloomberg, International Monetary Fund (IMF), Observer, Gleaner, US Bureau of Labour Statistics, US Census Bureau, Institute for SupplyManagement,NationalAssociationof Realtors,CentralBankofBarbados,National Bureau of Statistics of China, Central Bank of the Dominican Republic (BCRD), Banco deMexico,BancodelaRepúblicaColombia, Central Reserve Bank of Peru, Banco CentraldeChile,Eurostat,

*Projections/Budget
~Actual as at April 19, 2024
* Projections are taken from Bloomberg survey of economists as of April 19, 2024
~Actual as at April 19, 2024