Economic Bulletin


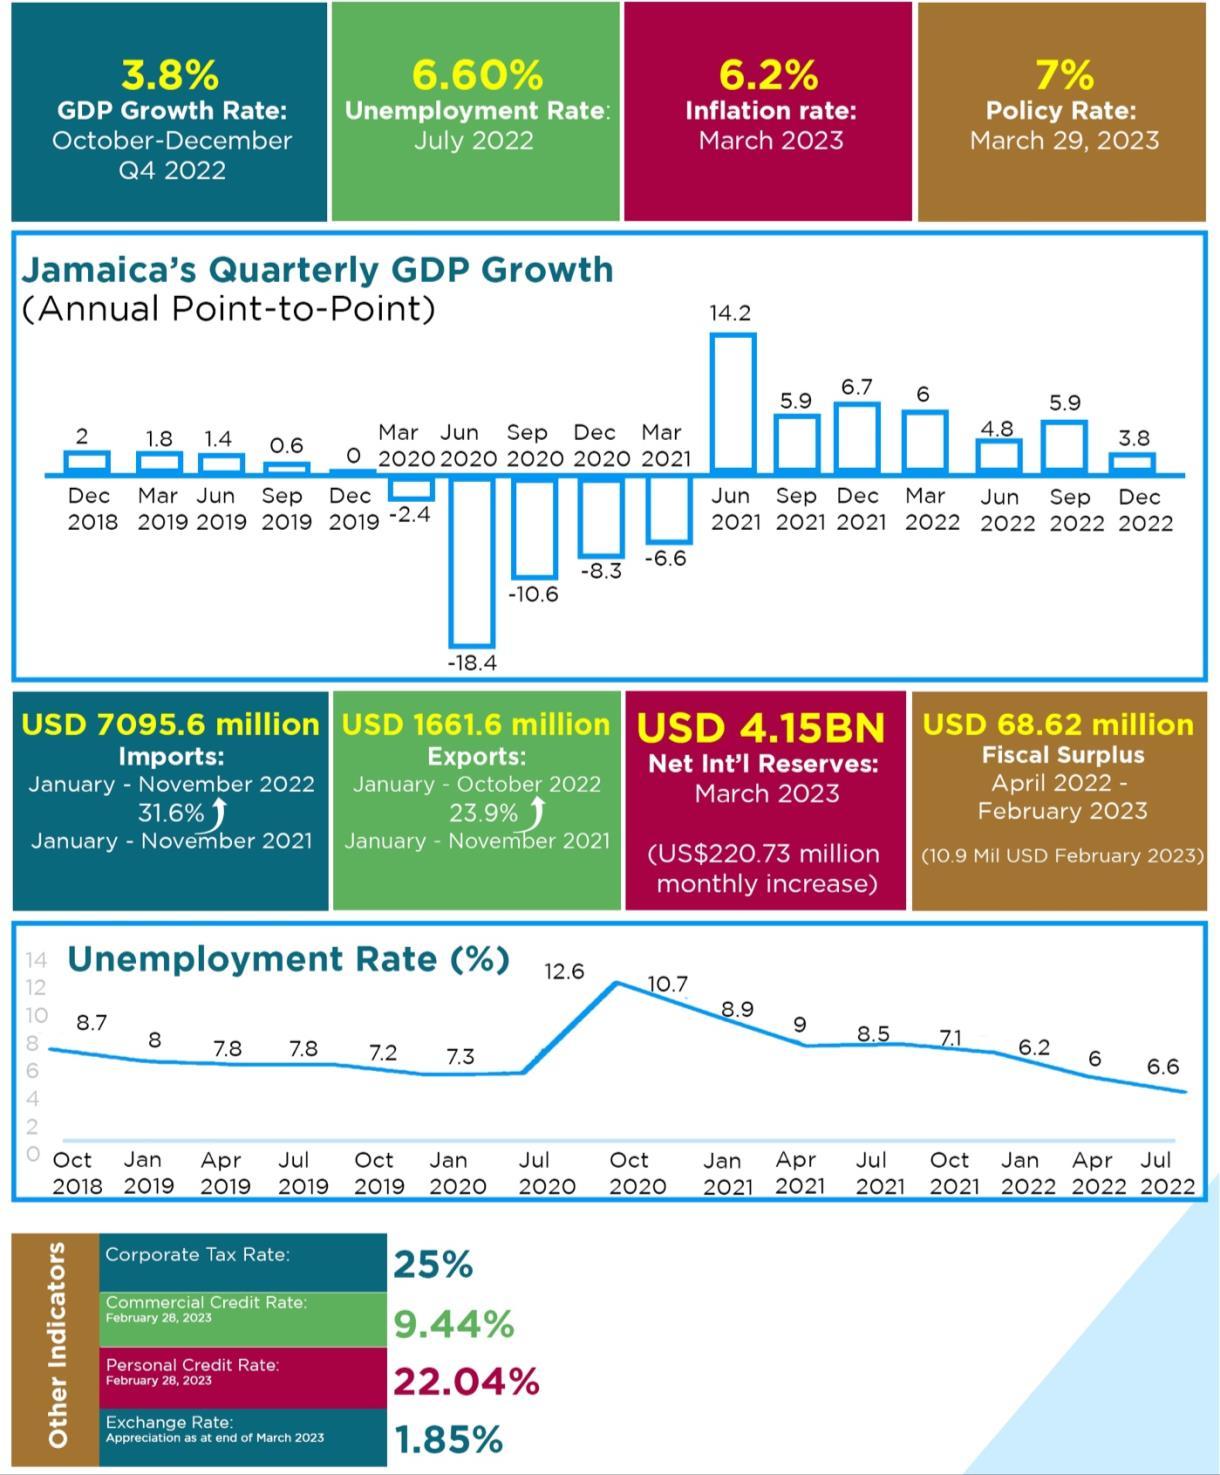


The12-monthpoint-to-pointinflationratehas declined by 154 basis-points to a historic 19month low of 6.22% compared to the 7.76% recorded at the end of February 2023. This was the 20th consecutive monthly breach of the upper limit of the Bank of Jamaica’s (BOJ) 4% to 6% inflation target but the lowest point-to-point rate since September 2021.
Month-over-month inflation increased by 0.16%.This was driven mainly by 1.07% and 0.80% monthly increases in ‘Restaurants and Accommodation Services’ and ‘Food and Non-Alcoholic Beverages’ respectively.
The increases were tempered by a 1.78% monthly decrease in ‘Housing, Water, Electricity, Gas and Other Fuels’. This decrease was due to a 4.18% decrease in ‘Electricity, Gas and Other Fuels’ and a 2.49% decrease in ‘Water Supply and MiscellaneousServicesRelatedtoDwelling’. The year-over-year movement was primarily driven by a 16.78% point-to-point increase in the ‘Restaurant and Accommodation Services’ division, along with a 10.12% and increase in the ‘Food and Non-Alcoholic Beverages’division.Theratewas,however, tempered by a 1.94% point-to-point decrease in the ‘Housing, Water, Electricity, GasandOtherFuels’division.
TheBOJ’sovernightpolicyrateremainedat 7.00%, after

(MPC) meeting on March 29, 2023. The rate was maintained as the central bank expects the policy signals to influence interest rates on deposits and loans upwards. Positive inflation results indicate that the BOJ may end its monetary policy tightening through rate hikes and may relax the rates by the end of the year.
At the end of March 2023, the JMD strengthened month-over-month, with an appreciation of 1.85% against the US Greenback. According to the BOJ’s Weighted Average Selling Rate (WASR), the local dollar gained$0.65,toend the month at
$150.9129. There were no B-FXITT interventions in March to stabilize the exchange rate.
The stock of net reserves experienced a US$220.73 million increase month-overmonth in March to close at US$4.15 billion. Foreign assets increased by US$212.48 million, mainly due to a US$230 million and US$1.16increaseincurrency&depositsand
the SDR and IMF Reserve position respectively. This was offset by a US$18.89 million decrease in securities. Foreign liabilities amounted to US$532.21 million, an 8.25% change with 100% of foreign liabilities being from the IMF.
The Institute of Supply Management (ISM) Purchasing Manufacturing Index (PMI) ended March at 46.30%, 140 bps lower than its February figure of 47.70%. This was the fourth month of contraction after 30 months of continuous growth. The decline is expected to continue as there is a slowing of new orders to better match the reduced demand in the first half of 2023 and prepare for the anticipated growth in the second half ofthe year.This was mainlydue toa 270 bps reduction in the New Orders Indexat44.30% and a 2.30 percentage point decrease in the New Exports Index. Similarly, the ISM Services Index registered a 390 bps decrease from 55.10% in February to 51.20% in March.
The release from the US National Association of Realtors (NAR) on pending home sales indicated an increase by 0.80 percentage points in February, after nearly a year of contraction in the housing sector. Year-over-year pending sales fell by 21.1% when compared to February 2022. Chief economistatthe NAR,Lawrence Yun,stated
that the housing sector contraction is finally coming to an end as existing homes sales and pending contracts have climbed for the last three months.
The Consumer Price Index for all Urban Consumers (CPI-U) increased by 5.00% in March on a point-to-point seasonally unadjusted basis and 0.10% on a monthover-month seasonally adjusted basis. On a point-to-point basis, the increase was due to a 5.60% in ‘All items Less Food’ Index, while the energy index has decreased 6.40% on a point-to-point basis. The 5.00% seasonally unadjusted increase is the lowest increase since May 2021, evidence that inflation is cooling at a faster pace. The Producer Price Index (PPI) for final demand decreased by 0.50% month-over-month on a seasonallyadjusted basis in March 2023 and increased by 2.70% on a point-to-point unadjusted basis.The 0.50% decline in the final demand index was led by a 1.00% decrease in the prices for final demand goods.
Following the US Federal Reserve Federal Open Market Committee (FOMC) meeting on March 22,the Fed Funds Rate was raised by 25 bps bringing the target range to 4.75% - 5.00%.The Fed has chosen to remain strict on its efforts to reduce inflation even though it has been cooling. The recent banking sectorinstability has increased the creditand liquidity risks within the financial system. The Fed chair has stated that they do not see a continuation of rate hikes going forward. Additionally, the FOMC continues to reduce
the size of balance sheet assets through its phasedreductionofholdingsinTreasuryand mortgage-backed securities (MBS).Thenext Fed Open MarketCommittee meetingis May 2-3, 2023.
In the first quarter, China's GDP reached 28,499.7 billion yuan, indicating a 4.5 percent year-on-year increase at constant prices, or a 2.2 percent increase over the fourthquarterof2022.Theprimaryindustry's value added was 1,157.5 billion yuan, up by 3.7 percent year on year; the secondary industry was 10,794.7 billion yuan, up by 3.3 percent; and the tertiary industry was 16,547.5 billion yuan, up by 5.4 percent. In March, China's manufacturing industry had a Purchasing Manager Index (PMI) of 51.9 percent, which was 0.7 percentage points lower than the previous month. However, it remained above the threshold andindicatedthatthemanufacturingindustry continued to expand.
In the first quarter, the total value of imports and exports of goods in China was 9,887.7 billion yuan,indicatinga 4.8 percentyear-onyear increase. The total value of exports was 5,648.4 billion yuan, which was up by 8.4 percent. The total value of imports was 4,239.3 billion yuan, showing a slight increase of 0.2 percent. The trade balance was 1,409.0 billion yuan in surplus.
A “game-changing” waste-to-energy project designed to slash fuel prices by half and significantly reduce CO2 emissions will be rolled out in the country in June. The new venture is being executed by locally based biofuel company, Rum and Sargassum Incorporated, which has produced biogas from co-digesting rum distillery wastewater, Blackbelly sheep manure, and Sargassum seaweed, in the laboratory at the University of the West Indies (UWI), Cave Hill Campus. Over the lifetime of this solution, 103 000 metric tons of CO2 emissions will be removed every year from the atmosphere,by cars in Barbados driving on sargassum BioCNG instead of gasoline.
The renewable energy project is aimed at addressing three key issues: keeping the Sargassum weed off the beaches; supporting the country’s goal of becoming fossil-fuel-free by 2030 and strengthening energy security through localfuel production; and solving a waste problem by reusing rum distillery wastewater.
Trinidad and Tobago’s GDP grew by approximately 2.5 percent in 2022, driven by a strong performance in the energy sector and an increase in non-energy production and is anticipated to remain favourable in 2023, barring major external shocks. The country's inflation rate moderated, declining
to 8.3% in January 2023 from 8.7% in the previous month. Despite this positive news, the Monetary Policy Committee (MPC) has maintained the repo rate at 3.50 percent as at March 31, 2023, citing potential external shocks and second-round effects of fuel price adjustments that could temper further reductions in inflation in the short run. The banking sector in Trinidad and Tobago remains strong, with ample liquidity and credit growth. Commercial banks’ excess reserves at the Central Bank fell by approximately $400 million, from $6.7 billion at the end of December 2022 to $6.2 billion at March 28, 2023 due to the use of more extensive open market operations. The differential between interest rates on threemonth treasures in Trinidad and Tobago and the United States moved to -429 basis points in February 2023. This compares to –392 basis points at the end of December 2022. There was a slight upward movement in domestic interest rates. The rise in average rates on loans exceeded those on deposits resulting in an expansion in the loan/deposit spread by 5 basis points to 6.36 per cent.
Realtors,CentralBankofBarbados,National Bureau of Statistics of China, Central Bank of Trinidad and Tobago.
Sources: Statistical Institute of Jamaica (STATIN), Bank of Jamaica (BOJ), Ministry of Finance & the Public Service, Planning Institute of Jamaica (PIOJ), Bloomberg, International Monetary Fund (IMF), Observer, Gleaner, US Bureau of Labour Statistics, US Census Bureau, Institute for SupplyManagement,NationalAssociationof

*Projections/Budget
^Actual
~Actual as at April 25, 2023
* Projections are taken from Bloomberg survey of economists as of April 25, 2023
* Projections are taken from Bloomberg survey of economists as of April 25, 2023