


“Adverse conditions, such as inadequate nutrition and housing, poor maternal health, or a lack of positive early experiences and nurturing relationships have a lasting detrimental effect on the developing brain, even if a child’s circumstances are improved later in childhood.”
The Regional Data Book aims to monitor the well-being of children and provide insights into their status across four key areas: early child care and education, K-12 education, family and economic well-being, and maternal and child health.
This information will assist the Governing Board of the Early Learning Hub of Linn, Benton, and Lincoln Counties in making strategic decisions that enhance family stability, improve kindergarten readiness, and ensure that services are coordinated in a family-centered, equitable, and culturally and linguistically appropriate manner for our region.
Oregon Revised Statute OAR 414-900010 states that children who are at risk experience chronic and persistent opportunity gaps due to family circumstances beyond their control, such as poverty, drug abuse in the home, unsafe housing, racism or ethnic discrimination, unmet medical needs, parental mental illness, child abuse and/or neglect, involvement with Department of Human Services (DHS), and families involved in juvenile and adult corrections.


When children live in poverty, there is a high probability that they will not have stable housing, food security, or health insurance. There is also a higher chance that they will drop out of school and have lower overall earnings in life.
by Audrey Mechling, “A Portrait of Poverty in Oregon,” Oregon Center for Public Policy, 2020.
➢ Benton County has the highest median family income at $113,224, which is higher than the statewide average of $98,832. Linn County follows with a median income of $87,508, while Lincoln County has the lowest at $76,426.
➢ Lincoln County has the highest percentage of families with children living below the federal poverty level at 20.4%, followed by Benton County at 14.4% and Linn County at 13.1%. All of these figures exceed the statewide level of 11.5%.
Data Source: 2023 ACS 5-Year Estimates.
Source: 2023 ACS 5-Year Estimates.
Families with Young Children Living in Poverty by Type of Families
➢ The Hispanic or Latino population has increased in three counties over the past ten years. Lincoln County has the highest percentage of Latino children at 23.0%, followed by Linn County at 16.9% and Benton County at 16.3%.
➢ Spanish is the most commonly spoken language after English in three counties and statewide.
➢ Linn County has the highest number of people and children living in rural areas, followed by Lincoln County among the three counties.
➢ Lincoln County has the highest percentage of people and children living in rural areas, followed by Linn County among the three counties.
People Living in Rural and Urban Areas
Under 5 years
Under 18 years
Total population
Under 5 years
Under 18 years
Total population
Under 5 years
Under 18 years
Total population
Under 5 years
Under 18 years
Total
Data Source: 2023 ACS 5-Year Estimates.
Rural communities face more disparities,
➢ Home values have increased over the past decade across three counties and statewide. As of January 2025, Benton County has the highest average home value, at approximately $535,000, which exceeds the statewide average of about $489,000. Following Benton County, Lincoln County has an average home value of $461,000, and Linn County has the lowest at $404,000.
➢ Low-income households are more likely to be costburdened by housing costs than households with higher incomes.
Data Source: 2023 ACS 5-Year Estimates.
➢ As of January 2025, Lincoln County had the highest all-home rent at $2,049 per month, closely followed by Benton County at $2,003 per month. Linn County had the lowest all-home rent at $1,660 per month.
Households Receiving Food Stamps/Supplemental Nutrition Assistance Program (SNAP)
Data Source: 2023 ACS 5-Year Estimates.
➢ Children living in food-insecure households have limited or uncertain availability of nutritionally adequate food.
➢ Linn County has the highest percentage of young children (under 6 years old) without health insurance at 3.8%, followed closely by Lincoln County at 3.7% and Benton County at 2.9%. All three counties exceed the statewide level of 2.5%.
➢ Our region is considered a “child care desert,” where access to regulated child care is limited for all children, with the greatest need for child care slots among children aged 0 to 2 years.
➢ Only 6 out of every 100 children aged 0-2 have access to regulated slots in Lincoln County, followed by 7 per 100 in Linn County and 21 per 100 in Benton County.
➢ Only 17 out of every 100 children aged 3-5 have access to regulated slots in Linn County, followed by 30 per 100 in Lincoln County and 38 per 100 in Benton County.
➢ In 2023, Lincoln County had the highest preschool enrollment rate at 49.2%, followed by Benton County at 46.2%. Both rates are higher than the statewide level of 41.5%. Conversely, Linn County has the lowest rate at 27.7%.
➢ In 2023, Lincoln County had the highest public preschool enrollment rate of all enrollments at 93.6%. This is followed by Linn County, which has an enrollment rate of 51.1%. Both counties exceed the statewide average of 47.7%. In contrast, Benton County has the lowest public preschool enrollment rate, at just 37%.
Data Source: 2023 ACS 5-Year Estimates. Oregon Child Care Market Price Study, 2024, Oregon State University.
➢ The median monthly cost of toddler care in child care centers in Benton, Lincoln, and Linn counties accounts for 24.9%, 20.5%, and 18.3% of the median household incomes, respectively, all of which exceed the 7% considered affordable.

Data Source: 2023 ACS 5-Year Estimates. Oregon Child Care Market Price Study, 2024, Oregon State University.
Data Source: 2023 ACS 5-Year Estimates. Oregon Child Care Market Price Study, 2024, Oregon State University.
➢ Compared to 2022, the median prices for toddler care have increased in 2024 across all types of care (small home-based care, large home-based care, and center care) in three counties and statewide. The only exception is large home-based care in Benton County, where the price has decreased from $1,448 to $1,100.
➢ Care centers are the most expensive option in three counties and statewide, followed by large homebased care. Small home-based care is the most affordable
➢ Over the past decade, the median prices for toddler care have risen significantly in three counties and across the state.
➢ The cost of toddler care can easily exceed 30% of a parent's monthly income when working a minimumwage job, with center-based care potentially accounting for over 50% in our region and statewide.
“… lack of affordability often prevents families from accessing quality care and education.” Oregon’s Child Care Deserts 2022, Oregon State University
Data Source: Student Enrollment Reports (Fall Membership Report 2023-24), ODE.
Total K-12
Student Enrollment by County
Linn Benton Lincoln EL Hub Region
Data Source: Student Enrollment Reports, ODE.
➢ K-12 Student enrollments have decreased over the past five years in three counties.
Data Source: McKinney-Vento Act: Students Navigating Houselessness Education Program.
➢ Lincoln County School District has the highest percentage of students experiencing homelessness at approximately 15%, followed by Central Linn School District at 10%. Both rates are significantly higher than the statewide level of 4.1%.
Data Source: At-A-Glance School and District Profiles, 2023-24, Oregon Department of Education.
Notes: Students experiencing poverty are defined as those facing economic disadvantage, which goes beyond simply falling below a specific income level. This definition typically follows the USDA income eligibility guidelines for free and reduced-price lunch programs.
Data Source: Assessment Report, 2023-24, Oregon Department of Education.
➢ In the 2022-23 school year, Linn County served the highest number of infants, toddlers, and preschool children through Early Intervention/Early Childhood Special Education (EI/ECSE) services, with a total of 352 children. Benton County followed with 116 children, while Lincoln County served 100 children. Four-Year

Data Source: Cohort Graduation Report, Oregon Department of Education.
Resident Births by the Race/Ethnicity of Mother in EL Hub Region, 2017-2023
Data Source: Oregon Vital Statistics Report, Oregon Center for Health Statistics.
Notes: The General Fertility Rate is a ratio that measures the total number of resident live births for the year per 1,000 women aged 15-44; The Total Fertility Rate is a ratio that estimates the average number of children a woman is expected to have over her lifetime, given current birth rates by age. A Total Fertility Rate of approximately 2.10 is required to maintain a stable population.
➢ The number of resident births has declined across three counties, and Hispanic mothers had the second highest number of new births after white mothers, and this number has seen an increase over the past few years
➢ In 2023, Linn and Lincoln Counties recorded the highest number of new births to mothers aged 25 to 29. Conversely, Benton County had the most significant number of new births among mothers aged 30 to 34.
➢ Lincoln County has the highest rate of new births to unmarried mothers at 54.4%, exceeding the statewide rate of 37.6%. Linn County follows at 37%, and Benton County has 27%.
➢ Over the past decade, both the general fertility rate and the total fertility rate have declined
➢ In 2023, Benton County had the highest immunization rate for two-year-old children, reaching 69.7%. Linn County follows closely with a rate of 68.9%. Both counties exceed the statewide average of 68.3%. In contrast, Lincoln County has the lowest immunization rate among the three counties, standing at 66.5%.
Data Source: Child Welfare Data Book, 2023, Oregon, Oregon Department of Human Services.
➢ In 2023, Lincoln County had the highest rate of victimization per 1,000 children at 22.2, followed by Linn County at 17.3, both of which were higher than the statewide average of 13.0. Benton County had the lowest rate at 10.8.
➢ In 2023, Lincoln County recorded the highest rate of children receiving services at home from Child Welfare Services, at 2.7 per 1,000 children. Linn County ranked second, with a rate of 1.7, both exceeding the statewide average of 1.0. In contrast, Benton County had the lowest rate, at 0.5.
➢ In 2023, Lincoln County reported the highest rate of children in foster care, with 8.8 children per 1,000. This was followed by Linn County, which had a rate of 6.7. Both of these rates are higher than the statewide average of 5.4. In contrast, Benton County had the lowest rate at 4.8 children per 1,000.
➢ In 2024, Linn County had the highest rate of juvenile justice referrals, with 17.8 referrals per 1,000 children. Lincoln County follows closely, with a rate of 17.4, both of which exceed the statewide average of 13.6. In contrast, Benton County has the lowest rate, at 12.1 referrals per 1,000 children.


The Regional Data Book aims to monitor the well-being of children and provide insights into their status across four key areas: early child care and education, K12 education, family and economic well-being, and maternal and child health. This information will assist the Governing Board of the Early Learning Hub for Linn, Benton, and Lincoln Counties in making strategic decisions that enhance family stability, improve kindergarten readiness, and ensure that services are coordinated in a family-centered, equitable, and culturally and linguistically appropriate manner for our region.
Furthermore, this data book is designed to help our community partners and stakeholders better serve local children and families.


"Raise Up Oregon" is a strategic plan aimed at creating a comprehensive early childhood system in Oregon. Covering the years 2024 to 2028, the plan emphasizes collaboration between state agencies, families, communities, and the private sector. Its vision is to ensure that all young children in Oregon, from prenatal stages to age five, receive an early start that promotes positive health, education, and life outcomes, regardless of their zip code, race, or family income.
This plan unites government leaders from various sectors, including early care and education, public education, higher education, health, housing, and human services. By working together, families, communities, and leaders from both the public and private sectors can support Oregon's youngest children during this crucial developmental period.
Please visit the Oregon Department of Early Learning and Care webpage for more detailed information about the strategic plan.
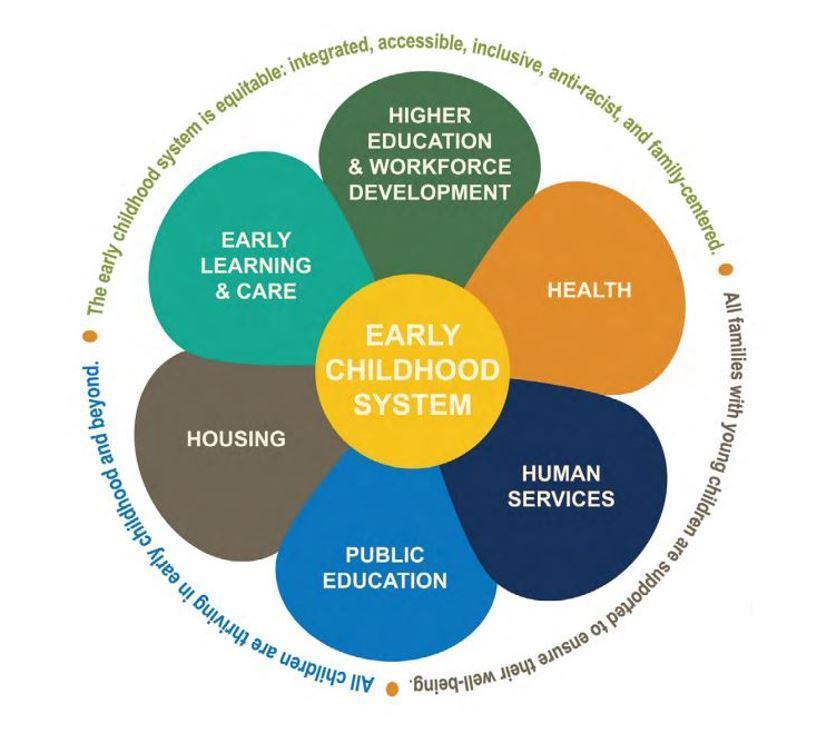
SYSTEM GOAL 1: The early childhood system is equitable: integrated, accessible, inclusive, anti-racist, and family centered.
OBJECTIVE 1: Honor and recognize the sovereignty of the nine federally recognized tribal nations within Oregon and ensure strong government-to-government relationships to benefit tribal communities.
OBJECTIVE 2: Multi-agency partnerships are developed at the state and local levels to systematically support improved outcomes and streamlined access for all young children and their families.
OBJECTIVE 3: Early Learning Hubs are leveraged and resourced to advance regional early childhood systems that are equitable, integrated, accessible, inclusive, and family centered.
OBJECTIVE 4: The business, philanthropic, and non-profit communities champion and support the development of the early childhood system.
SYSTEM GOAL 2: All families with young children are supported to ensure their well-being.
OBJECTIVE 5: Families with young children are supported in knowing about and accessing a full range of services that meet their needs and are culturally and linguistically responsive.
OBJECTIVE 6: Families with young children have increased access to economic supports.
OBJECTIVE 7: All families have access to support for their physical, social, emotional, behavioral, and oral health.
OBJECTIVE 8: Families have expanded access to culturally and linguistically responsive and specific family preservation strategies, resources, and programs focused on the prenatal-to-five population.
OBJECTIVE 9: Affordable housing is available statewide for all families with young children.
OBJECTIVE 10: All parents and families are supported and engaged in enabling their children to thrive
SYSTEM GOAL 3: All children are thriving in early childhood and beyond.
OBJECTIVE 11: Families have access to high-quality, culturally, and linguistically responsive birth-to-five pediatric health care services.
OBJECTIVE 12: Families have access to high-quality, culturally, and linguistically responsive birth-to-five social and emotional supports.
OBJECTIVE 13: Young children with developmental delays and disabilities are identified early and provided with inclusive services to reach their full potential.
OBJECTIVE 14: Families have access to high-quality (culturally responsive, inclusive, developmentally appropriate) and affordable early learning and care that meets their needs.
OBJECTIVE 15: The early childhood workforce is diverse, culturally responsive, high quality, and well compensated.
OBJECTIVE 16: Children and families experience supportive transitions and continuity of services across early learning and care and public education (K-12) settings.
Data Source: Raise Up Oregon: A Statewide Early Childhood System Plan (2024-2028), Oregon Department of Early Learning and Care.
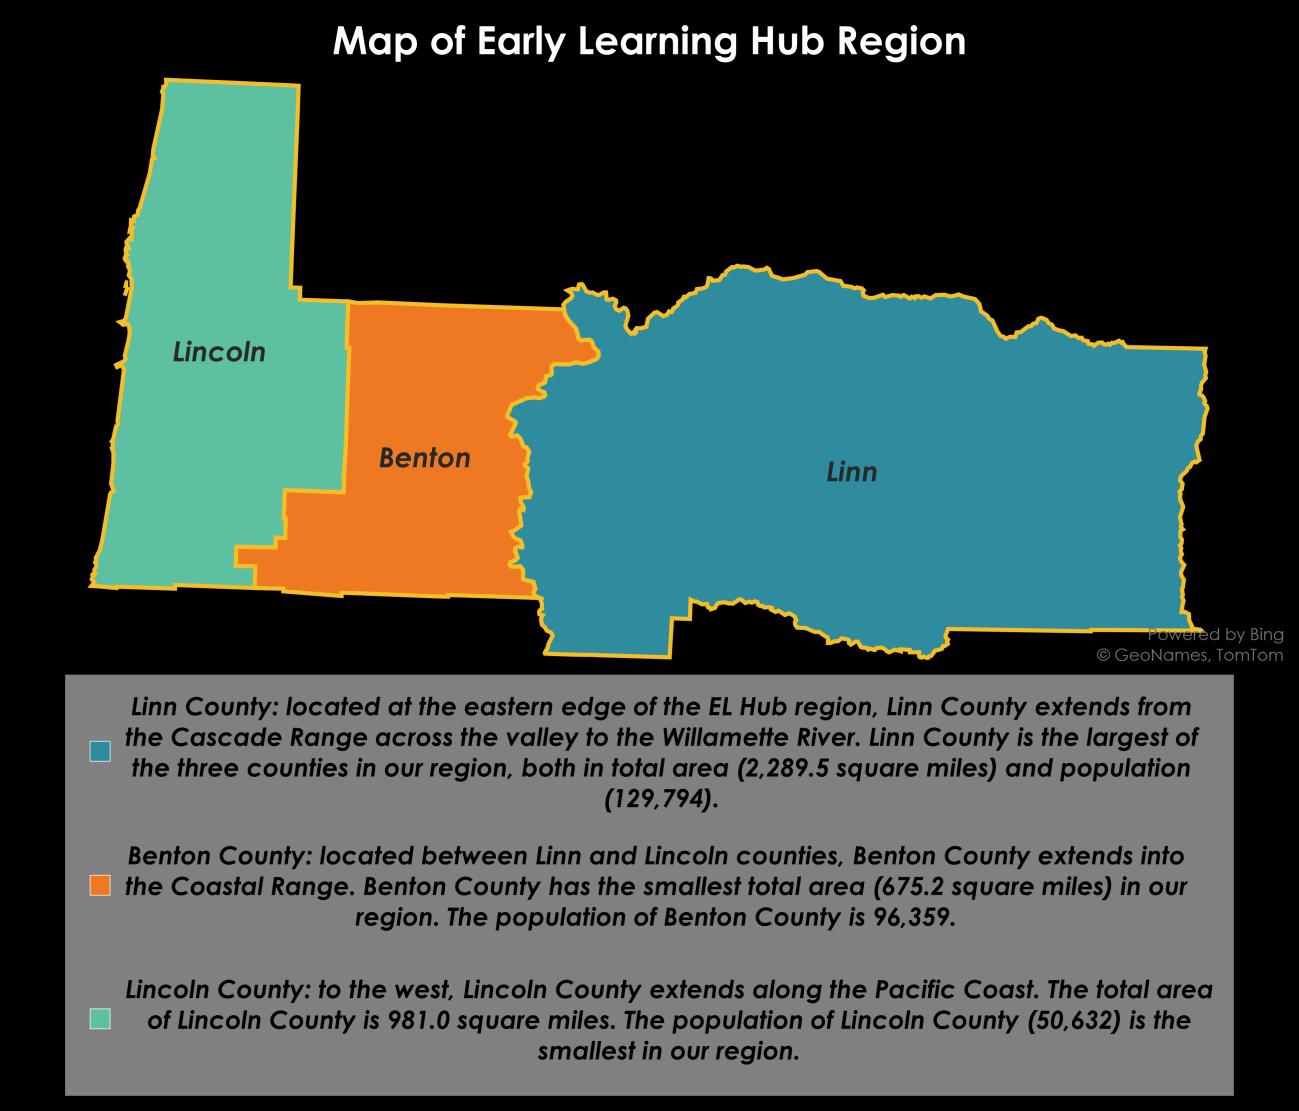
The Early Learning Hub of Linn, Benton, and Lincoln Counties serves the regions of Linn, Benton, and Lincoln Counties in Oregon. According to the 2023 American Community Survey 5-year estimates, the EL Hub Region has a total population of 276,785, including 51,903 children under 18 years old and 12,879 children under five years old.
The vision of the Early Learning Hub is to help communities create an accessible and collaborative system of support and care for families. This aims to enable children to grow up safe, nurtured, healthy, and prepared for school and life. To achieve this, the Early Learning Hub brings together partners, communities, and families to increase family stability, improve kindergarten readiness, and ensure equitable, family-centered, and culturally and linguistically competent service coordination.
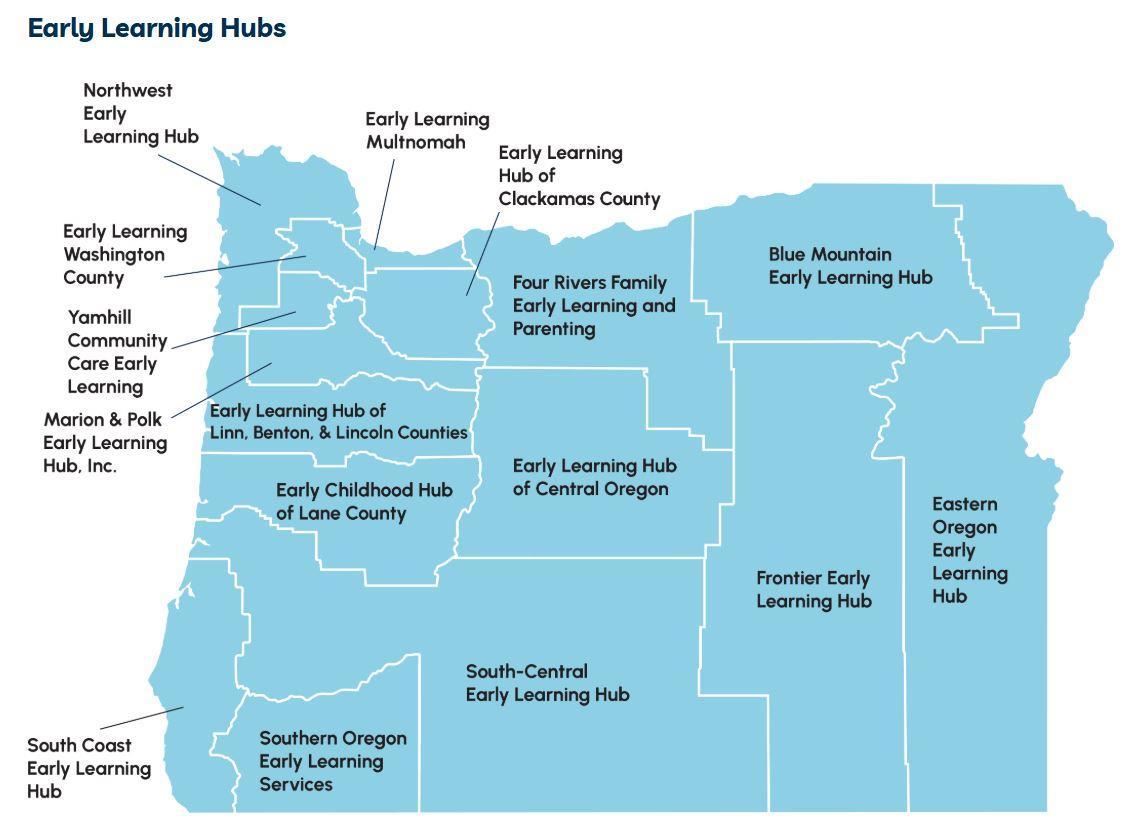

Note: This map is sourced from the Oregon Department of Early Learning and Care website
The Early Learning Hub of Linn, Benton, and Lincoln counties wants to emphasize that children and families from various races, ethnicities, socio-economic backgrounds, geographical locations, and languages spoken at home, as well as those with different gender identities, sexual orientations, religions, and physical and developmental abilities, face unequal access to public service resources. The Hub is dedicated to collaborating with partners, state agencies, and communities to incorporate diverse family perspectives and work towards meeting the varied needs of all children and their families in the three counties.
The 2025 Regional Data Book relies on data from the U.S. Census Bureau, state departments, and agencies to provide the most current, accurate, and comprehensive information available. However, the COVID-19 pandemic has disrupted some data collection efforts. Additionally, data related to specific races, ethnicities, tribes, rural areas, and other underserved populations tends to be undercounted, particularly at the county level. As a result, the information presented in this report offers a limited perspective on the individuals represented by these numbers.
The 2025 Regional Data Book is intended to provide a current and comprehensive overview of the conditions and well-being of children and families in Linn, Benton, and Lincoln counties. This report is designed to serve as a foundation for promoting and coordinating strategic efforts to address inequalities and enhance child well-being in the near future. It will be made available to local communities, partners of EL Hub, and other stakeholders.

In this chapter, you will discover key demographic facts regarding the population composition and changes, migration trends, household income, family structures, industry involvement, language use, access to computers and the internet, and educational attainment within the EL Hub Region.


Data Source: 2023 American Community Survey (ACS) 5-Year Estimates.
Data Source:
Data Source: 2013,2023 American Community Survey (ACS) 5-Year Estimates.
Data Source:
Data Source: 2023 American Community Survey (ACS) 5-Year Estimates.
Linn Benton
Data Source: 2023 American Community Survey (ACS) 5-Year Estimates.
Notes: The median age indicates the age distribution of a population. For example, the median age in Linn County in 2023 is 40.2, meaning that there are an equal number of people older than 40.2 and younger than 40.2
Data Source: 2023 American Community Survey (ACS) 5-Year Estimates.
35-39
30-34 25-29 20-24 15-19 10-14 5-9 0-4
Data Source: 2023 American Community Survey (ACS) 5-Year Estimates.
40-44
35-39
30-34
25-29
20-24
15-19
10-14
5-9
0-4
Male Female
Data Source: 2023 American Community Survey (ACS) 5-Year Estimates.

Data Source: State_to_State_Migration_Table_2023, American Community Survey (ACS). Notes:
• Estimates are about Population 1 year and over.
• - indicates an estimate of zero.
Data Source: 2023 American Community Survey (ACS) 5-Year Estimates.
Data Source: 2023 American Community Survey (ACS) 5-Year Estimates. Average Home Value data are from the Zillow Home Values Index as of 11/30/2024.
Notes:
• - indicates that the estimate could not be computed because there were insufficient sample observations.
• Zip Codes do not generally correspond to city boundaries.

Data Source: 2023 American Community Survey (ACS) 5-Year Estimates.
Under 5 years
Under 18 years
Total urban population
Notes: According to the Census Bureau, an area must encompass at least 5,000 people or at least 2,000 housing units to qualify as urban
Under 5 years
Under 18 years
Total urban population
Data Source: 2023 American Community Survey (ACS) 5-Year Estimates
Notes: Census county divisions (CCDs) are sub-county statistical geographic areas that usually represent a single contiguous area consisting of one or more communities, economic centers, or major land use areas in a county or county equivalent North Albany is the Benton County district of the city of Albany, Oregon
Data Source: 2023 American Community Survey (ACS) 5-Year Estimates.
Under 5 years
Under 18 years
Total population
Under 5 years
Under 18 years
Total population Under 5 years
Under 18 years
Total population Under 5 years
Under 18 years
Total population
Data Source: 2023 American Community Survey (ACS) 5-Year Estimates.
Under 5 years
Under 18 years
Total population
Under 5 years
Under 18 years
Total population
Under 5 years
Under 18 years
Total population
Under 5 years
Under 18 years
Total population
Data Source: 2023 American Community Survey (ACS) 5-Year Estimates.

Housing Tenure
Data Source: 2023 American Community Survey (ACS) 5-Year Estimates.
Notes:
• A family is a group of two people or more (one of whom is the householder) related by birth, marriage, or adoption and residing together; all such people (including related subfamily members) are considered as members of one family.
• A household consists of all the people who occupy a housing unit.
• The term "size of household" includes all the people occupying a housing unit.
• The term "Size of family" includes the family householder and all other people in the living quarters who are related to the householder by birth, marriage, or adoption.
Female
Data Source: 2023 American Community Survey (ACS) 5-Year Estimates.

County and Family Type
with children under 6 years only
Data Source: 2023 American Community Survey (ACS) 5-Year Estimates.
with children under 6 years and 6 to 17 years
with children 6 to 17 years only
Households with Own Children of the Householder Under 18 Years
Data Source: 2011-2023 American Community Survey (ACS) 5-Year Estimates.
Data Source: 2023 American Community Survey (ACS) 5-Year Estimates.
Linn Benton Lincoln Oregon United States
Data Source: 2023 American Community Survey (ACS) 5-Year Estimates.
Linn Benton Lincoln EL Hub Region
Data Source: 2017-2023 American Community Survey (ACS) 5-Year Estimates.
Data Source: 2023 American Community Survey (ACS) 5-Year Estimates.
Data Source: 2023 American Community Survey (ACS) 5-Year Estimates.
Percent Distribution of Household Income, 2023
$200,000 or more
$150,000 to $199,999
$100,000 to $149,999
$75,000 to $99,999
$50,000 to $74,999
$35,000 to $49,999
$25,000 to $34,999
$15,000 to $24,999
$10,000 to $14,999
Data Source: 2023 American Community Survey (ACS) 5-Year Estimates.
Median Incomes of the Population 25 Years and Over by Education Attainment
Linn Benton Lincoln Oregon
Population 25 years and over with earnings
Less than high school graduate
High school graduate (includes equivalency)
Some college or associate's degree Bachelor's degree
Graduate or professional degree
Data Source: 2023 American Community Survey (ACS) 5-Year Estimates.
Less than $10,000 $46,942
Trends in Median Household Income (Nominal vs. CPI Inflation-Adjusted Money), 2014-2023
Data Source: 2014-2023 American Community Survey (ACS) 5-Year Estimates.
Notes:
• The Consumer Price Index (CPI) measures the average change over time in the prices paid by urban consumers for a market basket of consumer goods and services.
• * means inflation adjusted: Income is inflation-adjusted by CPI in November 2024 dollars using the CPI Inflation Calculator from the U.S. Bureau of Labor Statistics.
Nativity and Citizenship Status Linn
U.S. citizen, born in the United States
U.S. citizen, born in Puerto Rico or U.S. Island Areas
U.S. citizen, born abroad of American parent(s)
U.S. citizen by naturalization
Not a U.S. citizen
Data Source: 2023 American Community Survey (ACS) 5-Year Estimates.
Most Common Languages Other Than English and Estimated Number of Speakers
Data Source: Oregon Translation Advisory Council, 2024.
Note: Punjabi is an Indo-Aryan language spoken by over 150 million people in Pakistan, India, and other countries.
Linn Benton Lincoln Oregon
Speak only English Speak a language other than English Spanish Speak only English Speak a language other than English Spanish
Population 5 years and over All citizens 18 years old and over
Data Source: 2023 American Community Survey (ACS) 5-Year Estimates.

Linn Benton Lincoln Oregon
Has one or more types of computing devices Broadband of any type
Data Source: 2023 American Community Survey (ACS) 5-Year Estimates.
Households Without an Internet Subscription by Household Income
Benton Lincoln Oregon
Data Source: 2023 American Community Survey (ACS) 5-Year Estimates.
Educational Attainment (25 years and over)
Data Source: 2023 American Community Survey (ACS) 5-Year Estimates.
Graduate or professional degree
Bachelor's degree
Associate's degree
Some college, no degree
High school graduate (includes equivalency) 9th to 12th grade, no diploma
Less than 9th grade
Data Source: 2023 American Community Survey (ACS) 5-Year Estimates.
First Major Field of a Bachelor's Degree for Individuals Aged 25 and Older Holding a Bachelor's Degree or Higher
Arts, Humanities and Others Education
Business
Science and Engineering Related Fields
Science and Engineering
Data Source: 2023 American Community Survey (ACS) 5-Year Estimates.
➢ The Hispanic or Latino population has increased in three counties over the past ten years.
➢ The population in our area is growing slowly, and the median age of residents is increasing.
➢ More people are leaving Oregon than are moving in, with Washington State being the most common destination for Oregonians who relocate. Meanwhile, Californians represent the largest group of newcomers to Oregon. At a county level, Benton County has the highest percentage of residents moving both within the state and to other states.
➢ Linn County has the highest number of people and children living in rural areas, followed by Lincoln County among the three counties.
➢ Lincoln County has the highest percentage of people and children living in rural areas, followed by Linn County among three counties.
➢ Lincoln County has the highest percentage of single-mother families at 10.3%, which is higher than the statewide level of 10.1%. Linn County follows at 9.9%, and Benton County at 7.8%.
➢ The percentage of households with children increased in 2023 in Linn County and Lincoln County, while it decreased in Benton County and statewide.
➢ In Linn County, 22.2% of the total population are children, which is the same as the statewide level. This is followed by 16% in Lincoln County and 15.7% in Benton County.
➢ Benton County has the highest median household income at $76,011, which is lower than the statewide level of $80,426. Linn County follows with a median income of $73,396, while Lincoln County has $61,314.
➢ The salaries in three counties and statewide have increased in both nominal terms and when adjusted for CPI inflation in 2023.
➢ Spanish is the most common language spoken after English in three counties and statewide.
➢ Lower-income families often lack access to the Internet.
➢ Veterans are an essential part of our community, with 11.4% of the population in Lincoln County being veterans, followed by 9.8% in Linn County and 5.4% in Benton County.
➢ Benton County has the highest percentage of individuals with an education level of an associate’s degree or higher, followed by Lincoln County and Linn County.
This chapter highlights early childhood care and education in the Early Learning Hub region, covering preschool enrollment, child care costs and affordability, participation in the Spark program, and current data on programs like CCLD, ERDC, and Preschool Promise from the Oregon Department of Early Learning and Care. It also includes information about the availability of child care services in the area.
Data Source: 2022, 2023 American Community Survey (ACS) 5-Year Estimates.

Preschool Enrollment Rate of Children Aged 3 to 4, 2014-2023
Data Source: 2014-2023 American Community Survey (ACS) 5-Year Estimates.
Public School Enrollment Rate of All Enrollment of Children Aged 3 to 4, 2014-2023
Data Source: 2014-2023 American Community Survey (ACS) 5-Year Estimates.
Data Source: Child Care Licensing Division (CCLD) Program Data, Oregon Department of Early Learning and Care.
Notes: The Child Care Licensing Division (CCLD) licenses Certified Centers, Certified Family, and Registered Family Facilities. More details about these facility types can be found on the Find Child Care webpage. The data were last updated in January 2025.
• Certified center child care: Providers offer care at a center, not in a home. The maximum number of children allowed is determined by floor space and the number of staff.
• Certified family child care: Providers offer care in their home for up to 16 children at once.
• Registered family child care: Providers offer care in their home for up to 10 children at once.
Data Source: Oregon Department of Early Learning and Care. Notes:
• The Employment Related Day Care (ERDC) program helps families who are working, in school, or receiving Temporary Assistance for Needy Families (TANF) pay for child care, including registration fees. ERDC now has a waitlist for most families applying to the program. Families with specific needs can skip the waitlist For more information, please visit Oregon Department of Early Learning and Care
• The data were last updated on 03/11/2024
Data Source: Preschool Promise Program Data, Oregon Department of Early Learning and Care. Notes:
• Preschool Promise is a free, high-quality preschool program available to Oregon families with incomes at or below 200 percent of the Federal Poverty Level (FPL). Families enroll in Preschool Promise by working with their regional Early Learning Hub. Learn more about this program at the Preschool Promise webpage
• This data is updated yearly, after slots are awarded.
Data Source: Preschool Promise Program Data, Oregon Department of Early Learning and Care.
Data Source: Oregon Prenatal to Kindergarten Program Data, Oregon Department of Early Learning and Care.
Notes:
• Oregon Prenatal to Kindergarten (OPK) is modeled after Head Start to support family success and healthy child development. OPK offers free, high-quality culturally responsive preschool, infant and toddler care in a variety of settings and models. Learn more about this program at the Oregon Prenatal to Kindergarten webpage.
• The data were last updated 04/04/2025.

Data Source: OregonSpark.org, Spark Data Facts as of September 30, 2024. Notes:
• Child Care Quality: Spark, Oregon’s Quality Rating and Improvement System is a system designed to raise the quality and consistency of early learning programs across the state. Spark aligns with
the national trend of QRISs that recognizes, rewards, and builds on the current quality of early learning. Spark provides a framework for program quality improvement while providing a tool that helps parents looking for quality early learning and care options.
• Centers include licensed, the alternative pathway, and Head Start programs. Family Child Care consists of large certified family and small registered family programs.
• C2Q Rating: Commitment to Quality (C2Q).
• Alternative Pathway (AP) indicates programs that are license exempt due to their association with school districts. These School Partner programs may have been licensed in the past and are still eligible for Spark participation. There are other School Partner programs that are not currently participating in Spark. However, the complete list is not available yet, so there may be discrepancies in the Data Facts until all School Partners and School Partners participating in Spark (AP) can be identified.
• Visit http://www.oregonspark.org for more information.
Data Source: OregonSpark.org, Spark Data Facts as of December 31, 2023.
Data Source: OregonSpark.org, Spark Data Facts as of September 30, 2024.
Data Source: Oregon Child Care Market Price Study, 2022-2024, Oregon State University.
Notes: Type of care care setting or facility.
• Small home-based care provided in the provider’s home; small group of children; relative or nonrelative provider
• Center care full or part-time care and education; provided by caregivers/teachers always located in building other than home.
• Large home-based care one or more caregivers; no more than 16 children at any one time; care provided in home setting.
• For more Information, please visit the Oregon Early Learners Facts & Findings page by Oregon State University
Median Toddler Care Prices by Type of Care, Linn County
Data Source: Oregon Child Care Market Price Study, 2010-2024, Oregon State University.
Notes: * means prices are inflation-adjusted by CPI to January 2025 dollars using the CPI Inflation Calculator from the U.S. Bureau of Labor Statistics.
Median Toddler Care Prices by Type of Care, Benton County
Data Source: Oregon Child Care Market Price Study, 2010-2024, Oregon State University.
Notes: * means prices are inflation-adjusted by CPI to January 2025 dollars using the CPI Inflation Calculator from the U.S. Bureau of Labor Statistics.
Median Toddler Care Prices by Type of Care, Lincoln County
Data Source: Oregon Child Care Market Price Study, 2010-2024, Oregon State University.
Notes: * means prices are inflation-adjusted by CPI to January 2025 dollars using the CPI Inflation Calculator from the U.S. Bureau of Labor Statistics. Empty cells indicate no available data.
Median Small Home-Based Toddler Care Prices by County, 2010-2024
Data Source: Oregon Child Care Market Price Study, 2010-2024, Oregon State University. Notes: Empty cells indicate no available data.
Median Center Toddler Care Prices by County, 2010-2024
Data Source: Oregon Child Care Market Price Study, 2010-2024, Oregon State University. Notes: Empty cells indicate no available data.
Median Large Home-Based Toddler Care Prices by County, 2010-2024
Data Source: Oregon Child Care Market Price Study, 2010-2024, Oregon State University.
Notes: Empty cells indicate no available data.

Data Source: Oregon Child Care Market Price Study, 2024, Oregon State University. Notes:
• Small home-based care provided in the provider’s home; small group of children; relative or nonrelative provider
• Prices are as of December 2024.
• A dash reflects no price data for the type of care and age group in a particular county.
• A * indicates prices not reported if the county is represented by only one facility.
• The number of facilities is those that are part of the priced market and reported a full-time price to the CCR&R; this does not reflect all child care facilities and slots in a given county. Prices are facility-level (unweighted) prices.
• For more Information, please visit the Oregon Early Learners Facts & Findings page by Oregon State University
Data Source: Oregon Child Care Market Price Study, 2024, Oregon State University. Notes:
• Large home-based care one or more caregivers; no more than 16 children at any one time; care provided in home setting.
• Prices are as of December 2024.
• A dash reflects no price data for the type of care and age group in a particular county.
• A * indicates prices not reported if the county is represented by only one facility.
• The number of facilities is those that are part of the priced market and reported a full-time price to the CCR&R; this does not reflect all child care facilities and slots in a given county. Prices are facility-level (unweighted) prices.
• For more Information, please visit the Oregon Early Learners Facts & Findings page by Oregon State University.
Data Source: Oregon Child Care Market Price Study, 2024, Oregon State University. Notes:
• Center care full or part-time care and education; provided by caregivers/teachers always located in building other than home.
• • Prices are as of December 2024.
• A dash reflects no price data for the type of care and age group in a particular county.
• A * indicates prices not reported if the county is represented by only one facility.
• The number of facilities is those that are part of the priced market and reported a full-time price to the CCR&R; this does not reflect all child care facilities and slots in a given county. Prices are facility-level (unweighted) prices.
• For more Information, please visit the Oregon Early Learners Facts & Findings page by Oregon State University
Data Source: 2023 American Community Survey (ACS) 5-Year Estimates; Oregon Child Care Market Price Study, 2024, Oregon State University.
Notes:
• According to the U.S. Department of Health and Human Services (HHS), child care is considered affordable if it costs no more than 7% of a household’s income.
• In Oregon, the standard monthly minimum wage for 2023 was $14.20 per hour, or approximately $2,272 per month, with adjustments for non-urban counties and the Portland Metro Area. Here's a more detailed breakdown:
o Standard Minimum Wage: $14.20 per hour.
o Portland Metro Area Minimum Wage: $15.45 per hour.
o Non-Urban Counties Minimum Wage: $13.20 per hour
o A standard monthly minimum wage is about $2,272 in Oregon in 2023.
o Standard: $14.20/hour * 160 hours/month (40 hours/week * 4 weeks/month) = $2,272/month.
• Here, the 2024 child care prices and 2023 incomes are used to be compared. Since incomes in 2024 might be higher than in 2023, these percentages might be overestimated.

Percentages of Monthly Income Needed to Cover The Toddler Care Cost in Center Care by Income Type Linn Benton
Data Source: 2023 American Community Survey (ACS) 5-Year Estimates; Oregon Child Care Market Price Study, 2024, Oregon State University.
Percentages of Monthly Income Needed to Cover The Toddler Care Cost in Large Home-Based Care by Income Type
Linn Benton Lincoln Oregon
Data Source: 2023 American Community Survey (ACS) 5-Year Estimates; Oregon Child Care Market Price Study, 2024, Oregon State University.
Please note that there is currently no available data for the year 2024.
Data Source: Estimated Supply of Child Care and Early Education Programs in Oregon, 2020-2022, Oregon State University. For more information, please visit Early Care and Education Supply, College of Health, OSU.
Data Source: Estimated Supply of Child Care and Early Education Programs in Oregon, 2020-2022, Oregon State University.
Data Source: Estimated Supply of Child Care and Early Education Programs in Oregon, 2020-2022, Oregon State University.
Data Source: Estimated Supply of Child Care and Early Education Programs in Oregon, 2020-2022, Oregon State University.
Data Source: Estimated Supply of Child Care and Early Education Programs in Oregon, 2022, Oregon State University.
Data Source: Estimated Supply of Child Care and Early Education Programs in Oregon, 2020-2022, Oregon State University.
Data Source: Estimated Supply of Child Care and Early Education Programs in Oregon, 2020-2022, Oregon State University.
Data Source: Estimated Supply of Child Care and Early Education Programs in Oregon, 2020-2022, Oregon State University.
Notes: Regulated includes Certified Centers, Certified Family, and Registered Family Providers.
Data Source: Estimated Supply of Child Care and Early Education Programs in Oregon, 2020-2022, Oregon State University.
Notes: Recorded Programs serve primarily preschool and school age groups. A few facilities serve children under 36 months (toddlers) as part of their preschool program.
Data Source: Estimated Supply of Child Care and Early Education Programs in Oregon, 2020-2022, Oregon State University.
Notes: Exempt includes Exempt Centers and Exempt Family providers.
Data Source: Estimated Supply of Child Care and Early Education Programs in Oregon, 2020-2022,
State University.
Notes: Any slot means all types of care, which includes all regulated, recorded, and exempt.
Data Source: Estimated Supply of Child Care and Early Education Programs in Oregon,
Oregon State University.
Notes: Regulated includes Certified Centers, Certified Family, and Registered Family Providers.
Data Source: Estimated Supply of Child Care and Early Education Programs in Oregon, 2020-2022, Oregon State University.
Notes: Public slots for ages five and under include Oregon Pre-kindergarten, Early Head Start, Federal and Tribal Head Start, Oregon Child Development Coalition, Preschool Promise, and Baby Promise.
Linn Benton Lincoln Oregon
➢ In 2023, Lincoln County had the highest preschool enrollment rate at 49.2%, followed by Benton County at 46.2%. Both rates are higher than the statewide level of 41.5%. Conversely, Linn County has the lowest rate at 27.7%.
➢ In 2023, Lincoln County had the highest public preschool enrollment rate of all enrollments at 93.6%. This is followed by Linn County, which has an enrollment rate of 51.1%. Both counties exceed the statewide average of 47.7%. In contrast, Benton County has the lowest preschool enrollment rate, at just 37%.
➢ Compared to 2022, the median prices for toddler care have increased in 2024 across all types of care (small home-based care, large home-based care, and center care) in three counties and statewide. The only exception is large home-based care in Benton County, where the price has decreased from $1,448 to $1,100.
➢ Care centers are the most expensive option in three counties and statewide, followed by large home-based care. Small home-based care is the least expensive.
➢ Over the past decade, the median prices for toddler care have risen significantly in three counties and across the state.
➢ Households in Lincoln County need to allocate approximately 15.7% of their monthly income to cover small home-based care costs. Benton County follows closely at 14.6%, while Linn County is at 12.8%. All three percentages are higher than the statewide average of 12.7%.
➢ Households in Benton County need to pay approximately 24.9% of their monthly income to cover center care costs, which is higher than the statewide average of 22.3%. This is followed by households in Lincoln County at 20.5% and Linn County at 18.3%.
➢ Households in Lincoln County need to allocate approximately 19.7% of their monthly income to cover large home-based care costs. This is followed by Benton County at 17.4% and Linn County at 16.5%, both of which are lower than the statewide average of 20.9%.
➢ The cost of toddler care can easily exceed 30% of a parent's monthly income when working a minimum-wage job, with center care potentially taking over 50% in our region and statewide.
This chapter presents data on K-12 student profiles from school districts, including enrollment, assessments, graduation rates, special education services, students living in poverty, students experiencing homelessness, experienced teachers, student-counselor ratios, and Early Intervention/Early Childhood Special Education (EI/ECSE).
Data Source: At-A-Glance School and District Profiles, 2023-24, Oregon Department of Education. Notes:
• Ever English Learners: the combination of both current and former English learners
• Mobile Students: students with within-year school changes and/or enrollment gaps.
• * <10 students or data unavailable
• Students experiencing poverty are defined as those facing economic disadvantage, which goes beyond simply falling below a specific income level. This definition typically follows the USDA income eligibility guidelines for free and reduced-price lunch programs. In Oregon, poverty is defined more broadly. It includes students who receive TANF (Temporary Assistance for Needy Families) or SNAP (Supplemental Nutrition Assistance Program) benefits, those in foster care, migrant students, and individuals facing homelessness.
Data Source: At-A-Glance School and District Profiles, 2023-24, Oregon Department of Education. Notes: Experienced teachers: licensed experienced teachers with more than 3 years of experience.
Data Source: Small Area Income and Poverty Estimates (SAIPE), 2023, United States Census Bureau.

Data Source: McKinney-Vento Act: Students Navigating Houselessness Education Program.
Notes:
• Students are identified as homeless when they live in an emergency shelter or share housing with others due to loss of housing or economic hardship and/or stay at motels or live in cars, parks, public places, tents, trailers, or other similar settings.
• * indicates suppressed counts of 1-5; Counts of 1 to 5 students have been suppressed to protect confidentiality.
• Students may attend more than one district.
• Shelter: public or private accommodations intended for use by homeless individuals and families.
• Transitional Housing: accommodations for homeless and formerly homeless individuals and families where stay is temporary (not permanent housing) and subsidized fully or nearly so.
• Unsheltered: living in cars, trailers, parks, public spaces, abandoned buildings, substandard housing, bus or train stations, or similar settings not designed as a regular sleeping accommodation.
• Doubled-up: sharing the housing of others, whether relatives or friends, due to loss of housing, economic hardship, domestic violence or similar reason.
• Hotel/Motel: temporary commercial accommodations due to loss of housing, economic hardship or similar reason.
• Unaccompanied: a child residing in one of the above homeless living situations, who is not accompanied by a parent or legal guardian, or adults with educational guardianship. Unaccompanied Homeless Youth (UHY) totals includes all living situations.
• For more information, please visit McKinney-Vento Act.
Data Source: McKinney-Vento Act: Students Navigating Houselessness Education Program. Notes: McKinney-Vento students are those who are experiencing homelessness as defined by the McKinney-Vento Homeless Assistance Act
Data Source: McKinney-Vento Act: Students Navigating Houselessness Education Program.
Data Source: Student Enrollment Reports, Oregon Department of Education.
Total Kindergarten Enrollment by County
1,000 1,500 2,000 2,500 3,000
Data Source: Student Enrollment Reports, Oregon Department of Education
Source: Student Enrollment Reports, Oregon Department of Education
Data Source: Student Enrollment Reports, Oregon Department of Education
Data Source: Student Enrollment Reports, Oregon Department of Education Percent Difference of Total Student Enrollment by
Data Source: Student Enrollment Reports, Oregon Department of Education.
Data Source: Oregon Class Size Report, 2023-24, Oregon Department of Education. Notes: The student/teacher ratio refers to the number of students for every teacher in a school
Student/Teacher Ratio of All Subjects/Grades by School District, 2023-24
SD
SD
SD
Data Source: Oregon Class Size Report, 2023-24, Oregon Department of Education.
Median Class Size of All Subjects/Grades by School District, 2023-24
Central Linn SD
Greater Albany Public SD
Harrisburg SD
Lebanon Community SD
Santiam Canyon SD
Scio SD
Sweet Home SD
Alsea SD
Corvallis SD
Monroe SD
Philomath SD
Lincoln County SD
Data Source: Oregon Class Size Report, 2023-24, Oregon Department of Education.
Median Class Size of Kindergarten by School District, 2023-24
Central Linn SD
Greater Albany Public SD
Harrisburg SD
Lebanon Community SD
Santiam Canyon SD
Scio SD
Sweet Home SD
Alsea SD
Corvallis SD
Monroe SD
Philomath SD
Lincoln County SD
Data Source: Oregon Class Size Report, 2023-24, Oregon Department of Education.
Data Source: Oregon Regular Attenders Report, Oregon Department of Education.
Notes:
• Students are considered "Regular Attenders" if they attended more than 90% of their enrolled days between the beginning of the 2023-24 school year and the first school day in May 2024. All days that the student was enrolled at the listed institution during this timeframe are included in this calculation.
• Students are considered "Chronically Absent" if they attended 90% or fewer of their enrolled days between the beginning of the 2023-24 school year and the first school day in May 2024. This category is calculated by subtraction based on the Regular Attenders' counts and rates.
• Regular Attendance rates from the 2020-21 school year are not directly comparable to rates published for prior school years, and should not be used for comparative or accountability purposes
The Oregon Department of Education (ODE) and Department of Early Learning and Care (DELC) are collaborating with communities across the state to redesign the Oregon Kindergarten Assessment (OKA). The redesigned tool, called “Early Learning Transition Check-In: A Collaborative Engagement with Community,” will support anti-racist practices and a whole-child approach, fostering a safe and supportive environment in which Oregon's young children and families can learn and thrive.
The redesigned “Kindergarten Assessment” will collect a statewide snapshot of data about children and families as they begin kindergarten. The primary purpose will be to inform state-level decisions about Oregon’s early learning and care sector. The redesigned components will also meaningfully support families in building relationships with their kindergarten educators by inviting them to share about their experiences before kindergarten.
• Incorporate anti-racist practices in the assessment approach
• Elevate community voice in assessment design
• Strengthen connections between families and educators
• Inform early learning and care programs, practices, and policies
• Improve efforts to meet the needs of Oregon children and families
For more information, please visit the website of Oregon Department of Early Learning and Care.

Data Source: English Language Arts Assessment Report, 2023-24, Oregon Department of Education.
English Language Arts Proficiency Rates of All Students by County, 2016/17-2023/24 Linn Benton Lincoln Oregon
Data Source: English Language Arts Assessment Report, Oregon Department of Education.
Notes: The 2019-20 school year assessment for ELA, math, and science was canceled due to the COVID-19 pandemic. The 2020-21 assessment is incomplete and is not representative due to low participation rates.
Data Source: Mathematics Assessment Report, 2023-24, Oregon Department of Education.
Data Source: Mathematics Assessment Report, Oregon Department of Education.
Data Source: Science Assessment Report, 2023-24, Oregon Department of Education.
Data Source: Science Assessment Report, Oregon Department of Education.
Data Source: English Language Arts Assessment Report 2023-24, Oregon Department of Education. Notes:
• *: Fewer than 10 students tested. : No students tested.
• < 5.0%: Less than 5% of students achieved Level 3 or 4 / Meets or Exceeds. Test counts are also suppressed. > 95.0%: Greater than 95% of students achieved Level 3 or 4 / Meets or Exceeds. Test counts are also suppressed.
• -: If Percent Level 3 or 4 / Meets or Exceeds is less than 5.0% or greater than 95.0%, all performance levels (and participation) are suppressed.
Data Source: Mathematics Assessment Report 2023-24, Oregon Department of Education. Notes:
• *: Fewer than 10 students tested. : No students tested.
• < 5.0%: Less than 5% of students achieved Level 3 or 4 / Meets or Exceeds. Test counts are also suppressed. > 95.0%: Greater than 95% of students achieved Level 3 or 4 / Meets or Exceeds. Test counts are also suppressed.
• -: If Percent Level 3 or 4 / Meets or Exceeds is less than 5.0% or greater than 95.0%, all performance levels (and participation) are suppressed.
Data Source: Science Assessment Report 2023-24, Oregon Department of Education. Notes:
• *: Fewer than 10 students tested. : No students tested.
• < 5.0%: Less than 5% of students achieved Level 3 or 4 / Meets or Exceeds. Test counts are also suppressed. > 95.0%: Greater than 95% of students achieved Level 3 or 4 / Meets or Exceeds. Test counts are also suppressed.
• -: If Percent Level 3 or 4 / Meets or Exceeds is less than 5.0% or greater than 95.0%, all performance levels (and participation) are suppressed.
Data Source: English Language Arts Assessment Report 2023-24, Oregon Department of Education. Notes:
• *: Fewer than 10 students tested in each school district.
• : No available data
• < 5.0%: Less than 5% of students achieved Level 3 or 4 / Meets or Exceeds. Test counts are also suppressed.
• > 95.0%: Greater than 95% of students achieved Level 3 or 4 / Meets or Exceeds. Test counts are also suppressed.
• -: If Percent Level 3 or 4 / Meets or Exceeds is less than 5.0% or greater than 95.0%, all performance levels (and participation) are suppressed.
• Exercise caution when handling data related to small student groups, as the data for certain school districts may be suppressed.
Data Source: Mathematics Assessment Report 2023-24, Oregon Department of Education.
Notes:
• *: Fewer than 10 students tested in each school district.
• : No available data.
• < 5.0%: Less than 5% of students achieved Level 3 or 4 / Meets or Exceeds. Test counts are also suppressed.
• > 95.0%: Greater than 95% of students achieved Level 3 or 4 / Meets or Exceeds. Test counts are also suppressed.
• -: If Percent Level 3 or 4 / Meets or Exceeds is less than 5.0% or greater than 95.0%, all performance levels (and participation) are suppressed.
• Exercise caution when handling data related to small student groups, as the data for certain school districts may be suppressed.
Data Source: Science Assessment Report 2023-24, Oregon Department of Education. Notes:
• *: Fewer than 10 students tested in each school district.
• : No available data
• < 5.0%: Less than 5% of students achieved Level 3 or 4 / Meets or Exceeds. Test counts are also suppressed.
• > 95.0%: Greater than 95% of students achieved Level 3 or 4 / Meets or Exceeds. Test counts are also suppressed.
• -: If Percent Level 3 or 4 / Meets or Exceeds is less than 5.0% or greater than 95.0%, all performance levels (and participation) are suppressed.
• Exercise caution when handling data related to small student groups, as the data for certain school districts may be suppressed.
Four-Year Cohort Graduation Rates (%) of All Students 2014/15 - 2023/24
Data Source: Cohort Graduation Report, Oregon Department of Education.
Four-Year Cohort Completer Rate (%) of All Students 2014/15 - 2023/24
Data Source: Cohort Graduation Report, Oregon Department of Education.
Five-Year Cohort Graduation Rate (%) of All Students 2014/15 - 2023/24
Data Source: Cohort Graduation Report, Oregon Department of Education.
Five-Year Cohort Completer Rate (%) of All Students 2014/15 - 2023/24
Data Source: Cohort Graduation Report, Oregon Department of Education.
Central Linn SD
Greater Albany Public SD
Harrisburg SD
Lebanon Community SD
Santiam Canyon SD
Scio SD
Sweet Home SD
Alsea SD
Corvallis SD
Monroe SD
Philomath SD
Lincoln County SD
Data Source: At-A-Glance School and District Profiles, 2023-24, Oregon Department of Education.
Licensed Teachers with More Than 3 Years of Experience by County, 2018/19-2023/24
Linn Benton Lincoln
Data Source: At-A-Glance School and District Profiles, 2018-19 to 2023-24, Oregon Department of Education.
Enrolled Student/Counselor & Psychologist Ratio. 2023-24
Enrolled Student/Counselor & Psychologist Ratio # Counselors & Psychologists
Central Linn SD
Greater Albany Public SD
Harrisburg SD
Lebanon Community SD
Santiam Canyon SD
Scio SD
Sweet Home SD
Alsea SD
Corvallis SD
Monroe SD
Philomath SD
Lincoln County SD
Data Source: At-A-Glance School and District Profiles, 2023-24, Oregon Department of Education.
Notes: Student/Counselor & Psychologist ratio calculates the average number of students served by one counselor or psychologist.

Data Source: At–A–Glance Special Education Profile, 2022-23, Oregon Department of Education. Notes:
• *: Data are suppressed.
• Regular Class: Students placed inside the regular class 80% or more of the day (Oregon target 77.00% or more).
• Separate Class: Students placed inside the regular class less than 40% of the day (Oregon target –8.70% or less).
• Separate Setting: Students served in separate public or private schools, residential placements, or homebound/hospital settings (Oregon target - 1.60% or less).
• Graduation rate: Students with IEPs earning a regular or modified diploma (Oregon target- 81.00%)
• Dropout rate: Students with IEPs who drop out (Oregon target- 12.17%)
Total Infants, Toddlers, and Preschool
Children in the Special Education Child Count
Student EI/ECSE Served
Percentage of total population birth to age 1 with IFSPs receiving EI services (Oregon target - 0.81%)
Percentage of total population birth to age 3 with IFSPs receiving EI services (Oregon target - 2.50%)
Families who report that EI services helped the family know their rights (Oregon target90.31%)
Family and parent survey results
ECSE Environment
Families who report that EI services helped the family effectively communicate their child's needs (Oregon target - 91.97%)
Families who report that EI services helped the family help their child to develop and learn (Oregon target - 92.16%)
Parents who report that the ECSE program facilitated parent involvement as means of improving services and results (Oregon target - 89.79%)
Natural Environment: Infants and toddlers who primarily receive early intervention services in home or programs for typically developing children. (Oregon target, 96.50%)
Regular Childhood Program: Children receiving a majority of ECSE services in a regular childhood program. (Oregon Target, 48.30%)
Other Childhood Program: Children receiving the majority of ECSE services in a separate special education class, separate school, or residential facility. (Oregon Target,23.00%)
Home: Children receiving special education and related services in the home. (Oregon Target,19.70%)
Data Source: At–A–Glance Special Education Profile, 2022-23, Oregon Department of Education. Notes:
• *: Data are suppressed.
• Early Intervention (EI): A special education program for children from birth to age three who have developmental delays or a medical condition likely to result in a developmental delay.
• Early Childhood Special Education (ECSE): A special education program for children aged three to school age with developmental delays and/or other disabilities that qualify them for special education.
• Individualized Family Service Plan (IFSP): A plan for special services and special education for infants, toddlers, and children ages three to five with developmental delays.
• Natural Environment: Infants and toddlers who primarily receive early intervention services in the home or programs for typically developing children.
• Regular Childhood Program: Children receive a majority of ECSE services in a regular childhood program.
• Other Childhood Program: Children receiving the majority of ECSE services in a separate special education class, separate school, or residential facility.
• Home: Children receiving special education and related services in the home.

➢ The Greater Albany School District is the largest school district in terms of student enrollment across three counties, followed by the Corvallis School District and the Lincoln County School District. The smallest district is the Alsea School District, followed by the Monroe School District and the Harrisburg School District.
➢ Santiam School District has the highest percentage of students with disabilities at 21%, followed by Central Linn School District at 20% and Sweet Home School District at 19%.
➢ Santiam School District has the highest percentage of mobile students at 37%, followed by Scio School District at 31%, and Alsea School District at 23%.
➢ Alsea School District has the highest percentage of students experiencing poverty at 50%, followed by Sweet Home School District at 47% and Lincoln County School District at 43%.
➢ Lincoln County School District has the highest percentage of students experiencing homelessness at approximately 15%, followed by Central Linn School District at 10%. Both rates are significantly higher than the statewide level of 4.1%.
➢ K-12 student enrollments have decreased over the past five years in three counties.
➢ Santiam School District has the largest student-to-teacher ratio at 30.7, followed by Scio School District at 24.4 and Corvallis School District at 23.8. All of these ratios are higher than the statewide level of 21.5.
➢ Attendance rates in all school districts across three counties have increased in the 2023-24 school year compared to 2022-23, except for the Santiam School District, which experienced a decline.
➢ In the 2023-24 school year, proficiency rates for English Language Arts and Mathematics decreased in both Linn County and Lincoln County, while Benton County experienced an increase compared to the 2022-23 school year.
➢ In the school year 2023-24, four-year cohort graduation rates have improved in all school districts across three counties, with the exception of the Alsea, Central Linn, Corvallis, Monroe, and Santiam School Districts, which experienced a decrease compared to the 2022-23 school year.
➢ Central Linn School District has the highest percentage of experienced teachers at 90%, followed by Santiam School District at 85% and Philomath School District at 84%. In contrast, the Greater Albany School District has the lowest percentage at 36%.
➢ Alsea School District has the highest percentage of students in Special Education at approximately 20.5%, followed by Sweet Home School District at 18.5% and Central Linn School District at 17.4%.
➢ In the 2022-23 school year, Linn County served the highest number of infants, toddlers, and preschool children through Early Intervention/Early Childhood Special Education (EI/ECSE) services, with a total of 352 children. Benton County followed with 116 children, while Lincoln County served 100 children.

This chapter provides data on family economic well-being, income and poverty, food insecurity, housing, WIC, health insurance, and the costs associated with raising children in the EL Hub Region.
Data Source: 2023 American Community Survey (ACS) 5-Year Estimates.
Data Source: 2023 American Community Survey (ACS) 5-Year Estimates.
For individuals
For a family of 2
For a family of 3
For a family of 4
For a family of 5
For a family of 6
For a family of 7
$25,820
$31,200
$36,580
$41,960
$47,340
For a family of 8 $52,720
For a family of 9+
For families/households with more than 8 persons, add $5,380 for each additional person.
For families/households with more than 8 persons, add $5,500 for each additional person.
For more information, please visit https://aspe.hhs.gov/topics/poverty-economicmobility/poverty-guidelines
Data Source: Office of the Assistant Secretary for Planning and Evaluation.
Notes:
• The Federal Poverty Level (FPL) is a measure of income issued annually by the U.S. Department of Health and Human Services (HHS) and is used to determine eligibility for certain government programs and benefits. The 2025 guidelines indicate that a family of four is considered to be living below 100 percent of FPL if the annual income is less than 32,150. Programs often determine a family’s eligibility based on a percentage of the FPL, such as 130 percent or 200 percent. living in poverty by FPL. For example, children automatically qualify for Head Start when living in households with income below 100 percent of the FPL.
• Children under age six who live in families with income up to 200 percent of the FPL qualify for Preschool Promise (PSP), a free, high-quality program. Preschool Promise is a publicly funded program that serves children ages three and four and complements other early learning programs such as Oregon Pre-Kindergarten. (more information is available on Oregon Department of Early Learning and Care website).
Data Source: Office of the Assistant Secretary for Planning and Evaluation
Linn Benton Lincoln Oregon
Data Source: 2023 American Community Survey (ACS) 5-Year Estimates.
Data Source: 2023 American Community Survey (ACS) 5-Year Estimates.
Linn Benton Lincoln Oregon
Data Source: 2023 American Community Survey (ACS) 5-Year Estimates.

Families with Children Living Below Poverty Level by the Type of Families with Related Children of Householder
Linn Benton Lincoln Oregon
Data Source: 2023 American Community Survey (ACS) 5-Year Estimates.
Families with Young Children (Under 5 Years) Living in Poverty by Type of Families
Linn Benton Lincoln Oregon
Data Source: 2023 American Community Survey (ACS) 5-Year Estimates.
Data Source: 2023 American Community Survey (ACS) 5-Year Estimates.
Data Source: 2023 American Community Survey (ACS) 5-Year Estimates.
Young Children Living Below 100% Poverty Level by Age Group
Data Source: 2023 American Community Survey (ACS) 5-Year Estimates.
Young Children Living Below 200% Poverty Level by Age Group
Linn Benton Lincoln
Data Source: 2023 American Community Survey (ACS) 5-Year Estimates. Children with a Disability Living in Poverty
Data Source: 2023 American Community Survey (ACS) 5-Year Estimates.
Percent of Civilian 16 Years and Over in Labor Force and Unemployment Rate
Percent of civilian 16 years and over in labor force Unemployment Rate
Data Source: 2023 American Community Survey (ACS) 5-Year Estimates.
Percent of All Parents with Own Children in the Labor Force by Age Group of Children
Data Source: 2023 American Community Survey (ACS) 5-Year Estimates.
Data Source: 2023 American Community Survey (ACS) 5-Year Estimates.
Data Source: 2023 American Community Survey (ACS) 5-Year Estimates.
Linn Benton Lincoln Oregon
$600,000
Data Source: Zillow Home Values Index.
Notes: Median House Price data are as of 01/2025.
Benton Lincoln Oregon
Data Source: Zillow Home Values Index
Notes: The percentages are calculated using the home values for the first month of every year. The data are as of 01/31/2025.
Data Source: Zillow Home Rentals Index
Notes: Unavailable data are not shown. Data are as of 01/2025.
Percentage Change of All Home Rents Year Over Year
Data Source: Zillow Home Rentals Index.
Notes: Unavailable data are not shown. The first month of every year's home rents are used to calculate the percentages. The data are as of 01/31/2025. $1,660 $2,003 $2,049
Data Source: U.S. Bureau of Economic Analysis, Regional Price Parities.
Notes:
• Regional price parities (RPPs) measure the differences in price levels across states and metropolitan areas for a given year and are expressed as a percentage of the overall national price level.
• All items RPPs cover all consumption goods and services, including rents.
• If an area has an RPP under 100, it means that a dollar in this area has more purchasing power than the national average.
$2,500 or more
$2,000 to $2,499
$1,500 to $1,999
$1,000 to $1,499
$500 to $999
Less than $500
Data Source: 2023 American Community Survey (ACS) 5-Year Estimates.
All occupied housing units
Owner-occupied housing units
Renter-occupied housing units
All occupied housing units
Owner-occupied housing units
Renter-occupied housing units
All occupied housing units
Owner-occupied housing units
Renter-occupied housing units
All occupied housing units
Owner-occupied housing units
Renter-occupied housing units
Data Source: 2023 American Community Survey (ACS) 5-Year Estimates.
Data Source: 2023 American Community Survey (ACS) 5-Year Estimates.
Notes: Cost-burdened housing is defined as paying more than 30% of household income for housing (rent or mortgage plus utilities).
Owner-occupied housing units
Renter-occupied housing units
Owner-occupied housing units
Renter-occupied housing units
Owner-occupied housing units
Renter-occupied housing units
Owner-occupied housing units
Renter-occupied housing units
Data Source: 2023 American Community Survey (ACS) 5-Year Estimates.
Less than $20,000
$20,000 to $34,999
$35,000 to $49,999
$50,000 to $74,999 $75,000 or more
Housing Tenure by Family Type and by Housing Unit Type
Owner-occupied housing units Renter-occupied housing units
Nonfamily household
Female householder, no spouse present, family household
Male householder, no spouse present, family household
Married-couple family household
Nonfamily household Total
Female householder, no spouse present, family household
Male householder, no spouse present, family household
Married-couple family household
Nonfamily household Total
Female householder, no spouse present, family household
Male householder, no spouse present, family household
Married-couple family household
Nonfamily household Total
Female householder, no spouse present, family household
Male householder, no spouse present, family household
Married-couple family household
Data Source: 2023 American Community Survey (ACS) 5-Year Estimates.
Data Source: 2011-2023 American Community Survey (ACS) 5-Year Estimates; Zillow Home Values Index
Notes: The Home Price-to-Household Income Ratio is useful for assessing housing affordability in a particular region. It is calculated by dividing the median home price by the median household income of that area. A ratio between 2 and 3 is considered to be a healthy range. A low Home price-to-income ratio suggests that housing is relatively affordable and accessible to the residents of that region, while high ratios indicate unaffordability

Households Receiving Food Stamps/Supplemental Nutrition Assistance Program (SNAP) by Household Type
Data Source: 2023 American Community Survey (ACS) 5-Year Estimates.
Linn Benton Lincoln
Women, Infants and Children Served by WIC # WIC Families Served
Data Source: 2024 Oregon WIC data, OHA.
Note: Please visit Oregon WIC Program for more information.
Linn Benton Lincoln
% of all pregnant women served by WIC % of WIC families are working families / of participants are infants and children under five
Data Source: 2024 Oregon WIC data, OHA.
Linn Benton Lincoln Oregon
Data Source: 2023 American Community Survey (ACS) 5-Year Estimates.
Health
Data Source: Medicaid Demographic Report, OHP Data & Reports. Data is as of December 2024.
Notes: The Oregon Health Plan (OHP) is Oregon's medical assistance program, providing health care coverage for individuals from all walks of life, including working families, children, pregnant adults, single adults, and seniors. For more information, please visit Oregon Health Plan (Oregon Medicaid)
The following information pertains to the Family Budget Calculator created by the Economic Policy Institute (EPI). It includes fact sheets that provide detailed estimates of costs for ten different family types, ranging from one to two adults with zero to four children. These fact sheets are designed to help understand the income needed to maintain a "modest yet adequate standard of living (Family Budget Fact Sheet, 2024)1”. They serve as useful tools for comprehending the basic expenses required for different family situations.
Please visit the Family Budget Fact Sheet from the Economic Policy Institute for more information.
Family Budgets per Month in 2024 Dollars by Family Size and Composition in Linn County
Family Sizes and Compositions
Family Budgets per Month in 2024 Dollars by Family Size and Composition in Benton County
Family Sizes and Compositions
Data Source: Family Budget Fact Sheet, 2024, Economic Policy Institute
1 Is cited from Family Budget Fact Sheet, 2024, Economic Policy Institute
Family Budgets per Month in 2024 Dollars by Family Size and Composition in Lincoln County
Sizes and Compositions
Data Source: Family Budget Fact Sheet, 2024, Economic Policy Institute
➢ Benton County has the highest median family income at $113,224, which is higher than the statewide average of $98,832. Linn County follows with a median income of $87,508, while Lincoln County has the lowest at $76,426.
➢ Single-parent families have a much lower median income than marriedcouple families across three counties and statewide.
➢ Benton County has the highest percentage of residents living below the federal poverty level at 19.2%, followed by Lincoln County at 15.7% and Linn County at 12.8%. All three counties have rates higher than the statewide level of 11.9%.
➢ Lincoln County has the highest percentage of families living below the federal poverty level at 11.0%, followed by Benton County at 7.8% and Linn County at 7.6%. All of these are higher than the statewide level of 7.3%.
➢ Lincoln County has the highest percentage of families with children living below the federal poverty level at 20.4%, followed by Benton County at 14.4% and Linn County at 13.1%. All of these figures are higher than the statewide level of 11.5%.
➢ Lincoln County has the highest percentage of families with young children (under 5 years old) living below the federal poverty level, at 40.7%. Following Lincoln County are Benton County at 19.7% and Linn County at 15.4%, all of which are significantly higher than the statewide average of 11.1%.
➢ Families headed by single mothers with young children (under 5 years old) experience higher rates of poverty compared to all families and marriedcouple families across three counties and statewide.
➢ Lincoln County has the highest percentage of young children (under 5 years old) living below the federal poverty level at 31.1%, followed by Linn County at 24.2% and Benton County at 15.1%, all of which are higher than the statewide level of 14.4%.
➢ Linn County has the highest number of young children living below the 100% federal poverty level or the 200% federal poverty level, followed by Lincoln County and Benton County.
➢ Lincoln County has the highest percentage of children with disabilities living below the federal poverty level at 29.4%, which is higher than the statewide level of 21.4%. Linn County follows with 13.9%, and Benton County has 7.1%.
➢ Home values have experienced increases over the past 10 years across three counties and statewide. Benton County has the highest average
home value at approximately $535,000, which is greater than the statewide average of about $489,000. Following Benton County, Lincoln County has an average home value of $461,000, and Linn County has the lowest at $404,000.
➢ As of January 2025, Lincoln County had the highest all-home rent at $2,049 per month, closely followed by Benton County at $2,003 per month. Linn County had the lowest all-home rent at $1,660 per month.
➢ Benton County has the highest median monthly housing cost at $1,399, followed by Linn County at $1,300 and Lincoln County at $1,118, all of which are lower than the statewide average of $1,507.
➢ Households with an income of less than $50,000 are significantly costburdened in housing across three counties and statewide.
➢ Lincoln County has the highest percentage of families with children receiving Food Stamps/Supplemental Nutrition Assistance Program (SNAP) at 34.2%, followed by Linn County at 27.4%. Both of these are higher than the statewide level of 22.2%, while Benton has the lowest percentage at 18.1%.
➢ Linn County has the highest percentage of young children (under 6 years old) without health insurance at 3.8%, followed closely by Lincoln County at 3.7% and Benton County at 2.9%. All three counties exceed the statewide level of 2.5%.
This chapter offers detailed information on various aspects of childbirth and motherhood. You will learn about maternal risk factors, fertility rates, prenatal care, teenage pregnancy rates and birth rates, health challenges in children, child welfare, and the support available for children through OHP Behavioral Health Services, Intellectual and Developmental Disability Services, and Juvenile Justice Services.
Resident Births by County, 2013-2023
Data Source: Oregon Vital Statistics Report, Oregon Center for Health Statistics.
Resident Births by the Race/Ethnicity of Mother by County, 2023
Data Source: Oregon Vital Statistics Report, Oregon Center for Health Statistics.
Resident Births by the Race/Ethnicity of Mother in EL Hub Region, 2017-2023
Data Source: Oregon Vital Statistics Report, Oregon Center for Health Statistics.
Resident Births by Age Group of Mother (Counts and Percent), 2023
Ages
Ages
Ages
Ages
Ages
Ages
Ages
Data Source: Oregon Vital Statistics Report, Oregon Center for Health Statistics.
Oregon Vital Statistics Report, 2010-2023, Oregon Center for Health Statistics; 2010-2023 American Community Survey (ACS) 5-Year Estimates
Notes: Age-Specific Birth Rate is a ratio that measures the number of births to women of a specific age group per 1,000 women in that age group
Age-Specific Birth Rates by Monther's Age Group in Benton County, 2010-2023
Oregon Vital Statistics Report, 2010-2023, Oregon Center for Health Statistics; 2010-2023 American Community Survey (ACS) 5-Year Estimates.
Age-Specific Birth Rates by Monther's Age Group in Lincoln County, 2010-2023
Oregon Vital Statistics Report, 2010-2023, Oregon Center for Health Statistics; 2010-2023 American Community Survey (ACS) 5-Year Estimates
Data Source: Oregon Vital Statistics Report, 2023, Oregon Center for Health Statistics.
Data Source: Oregon Vital Statistics Report, 2010-2023, Oregon Center for Health Statistics; 2010-2023
American Community Survey (ACS) 5-Year Estimates
Notes: General Fertility Rate is a ratio that measures the total number of resident live births for the year per 1,000 women aged 15-44.

Data Source: Oregon Vital Statistics Report, 2010-2023, Oregon Center for Health Statistics; 2010-2023
American Community Survey (ACS) 5-Year Estimates
Notes: Total Fertility Rate is a ratio that estimates the average number of children a woman is expected to have over her lifetime, given current birth rates by age. A Total Fertility Rate of about 2.10 is needed in order to maintain a stable population.
Linn Benton Lincoln Oregon
Inadequate prenatal care
Nonwhite race/ Hispanic ethnicity Ages <18 Ages >=35 4+ live births
<12 years education
Data Source: Oregon Vital Statistics Report, 2023, Oregon Center for Health Statistics.
Linn Benton Lincoln Oregon
Data Source: Oregon Vital Statistics Report, 2023, Oregon Center for Health Statistics.
Data Source: Oregon Vital Statistics Report, Oregon Center for Health Statistics. Notes: Pregnancy counts include live births and abortions (including pregnancy terminations).
Data Source: Oregon Vital Statistics Report, Oregon Center for Health Statistics; 2010-2022 American Community Survey (ACS) 5-Year Estimates.
Notes: Teen Pregnancy Rate is the number of pregnancies per 1,000 women aged 15 to 19.
Number of Teen Births by County, 2010-2023
Data Source: Oregon Vital Statistics Report, Oregon Center for Health Statistics.
Teen Birth Rate by County, Trends from 2010 to 2023
Data Source: Oregon Vital Statistics Report, Oregon Center for Health Statistics; 2010-2022 American Community Survey (ACS) 5-Year Estimates.
Notes: Teen Birth Rate is the number of births per 1,000 women aged 15 to 19.
WIC Agency
Data Source: WIC Breastfeeding Rates, 2023, Oregon Health Authority WIC Data. Notes: WIC infants are considered 'fully breastfed' until the introduction of formula
Two-Year-Olds Up-to-Date Immunization Rates, 2014-2023
Data Source: Oregon Immunization Program, Oregon Health Authority.
Data Source: Oregon Immunization Program, Oregon Health Authority.
Data Source: Oregon Immunization Program, Oregon Health Authority.
Please note that as of September 2023, OHA will no longer produce and publish children's health complexity data reports. For more information, please visit Children’s Health Complexity Data from the Oregon Health Authority.
Children’s health complexity uses system-level data to summarize medical and social complexity factors for children enrolled in the Oregon Health Plan (OHP) and Children’s Health Insurance Plan (CHIP) coverage.
These data are from various sources such as state, CCO, and county-level health complexity reports. The data includes information on 19,277 children from Linn County, 7,128 children from Benton County, 6,015 children from Lincoln County, 502,475 children from Oregon, and 29,458 children enrolled in Intercommunity Health Network as of January 2023.
The child health complexity data assists CCOs to guide and support their efforts to engage communities and identify supports for families and children
Children without Chronic Disease/Healthy
Children with Non-Complex Chronic Disease
Children with Complex Chronic Disease
Data Source: Children’s Health Complexity Data Reports, 2023, Oregon Health Authority.
Linn Benton Lincoln Oregon IHN-CCO
Poverty (Child)
Poverty (Parent)
Foster Care Parental Death
Parental Incarceration
Mental Health (Child)
Mental Health (Parent)
Substance Use Disorder (Child)
Substance Use Disorder (Parent)
Child Abuse and Neglect
Potential Language Barrier
Parental Disability
Data Source: Children’s Health Complexity Data Reports, 2023, Oregon Health Authority.
Linn Benton Lincoln Oregon IHN-CCO
Poverty (Child)
(Parent)
Care Parental Death Parental Incarceration Mental Health (Child)
Mental Health (Parent) Substance Use Disorder (Parent) Child Abuse and Neglect Potential Language Barrier Parental Disability
Data Source: Children’s Health Complexity Data Reports, 2023, Oregon Health Authority.
Data Source: Children’s Health Complexity Data Reports, 2023, Oregon Health Authority.
Data Source: Children’s Health Complexity Data Reports, 2023, Oregon Health Authority.
Benton County did not participate in the 2022 Oregon Student Health Survey. For 2022 county-level survey results about Linn County and Lincoln County, please visit SHS 2022 Results, Oregon Health Authority.
Data Source: Children’s System of Care Data, 01/01/2023-12/31/2023, Oregon, Oregon Department of Human Services.
Data Source: Children’s System of Care Data, 01/01/2023-12/31/2023, Oregon, Oregon Department of Human Services.
Number of Children Served by Child Welfare Services per 1,000 Children, 2023
Data Source: Children’s System of Care Data, 01/01/2023-12/31/2023, Oregon, Oregon Department of Human Services.
Data Source: Child Welfare Data Book, 2023, Oregon, Oregon Department of Human Services.
Notes: * County of Origin is the county where the report of child abuse originated
Data Source: Child Welfare Data Book, 2023, Oregon, Oregon Department of Human Services
Screening Reports of Suspected Child Abuse by Source, FFY 2023
Police Parent/Self Other non mandated Other mandated
Data Source: Child Welfare Data Book, 2023, Oregon, Oregon Department of Human Services.
Data Source: Child Welfare Data Book, 2023, Oregon, Oregon Department of Human Services. Notes: Values Suppressed to ensure confidentiality
Data Source: Child Welfare Data Book, 2023, Oregon, Oregon Department of Human Services. Notes: *New allegation types of Abandonment in Care, Financial Exploitation in Care, Involuntary Seclusion in Care, Neglect in Care, Physical Abuse in Care, Sexual Abuse in Care, Verbal Abuse in Care, and Wrongful Restraint in Care were added effective 1/1/2020
Data Source: Child Welfare Data Book, 2023, Oregon, Oregon Department of Human Services.
Data Source: Child Welfare Data Book, 2020-2023, Oregon, Oregon Department of Human Services.
Data Source: Child Welfare Data Book, 2014-2023, Oregon, Oregon Department of Human Services.
Data Source: Child Welfare Data Book, 2020-2023, Oregon, Oregon Department of Human Services.
Notes: Data is point-in-time on 9/30
Data Source: Child Welfare Data Book, 2020-2023, Oregon, Oregon Department of Human Services. Notes: Data is point-in-time on 9/30
Number of Children in Foster Care per 1,000 Children, 2014-2023
Data Source: Child Welfare Data Book, 2014-2023, Oregon, Oregon Department of Human Services.
Data Source: Child Welfare Data Book, 2023, Oregon, Oregon Department of Human Services. Notes: Data is point-in-time on 9/30. Values suppressed to ensure confidentiality.
Data Source: Child Welfare Data Book, 2023, Oregon, Oregon Department of Human Services.
Notes: *State total does not include Title IV-E eligible children served by Tribes.
Data Source: Child Welfare Data Book, 2022-2023, Oregon, Oregon Department of Human Services. Notes: *State total does not include Title IV-E eligible children served by Tribes.
Data Source: Child Welfare Data Book, 2023, Oregon, Oregon Department
Notes: Data is point-in-time on 9/30 Values suppressed to ensure confidentiality
Data Source: Child Welfare Data Book, 2023, Oregon, Oregon Department
Notes:
• - Values suppressed to ensure confidentiality.
• *Unique Count: Only the initial certification is counted.
• **Unique Count: Only counts closed and expired providers that did not begin care again.

Data Source: Children’s System of Care Data, 01/01/2023-12/31/2023, Oregon, Oregon Department of Human Services.
Notes: It is possible that the sum of percentages of every child age group may exceed 100% due to the fact that children can change their ages, location, or serving system during the time when they are being served. This means that a child could be counted more than once in yearly data, leading to an inflated percentage.
Data Source: Children’s System of Care Data, 01/01/2023-12/31/2023, Oregon, Oregon Department of Human Services.
Number of Children Served by Behavioral Health Services per 1,000 Children, 2023
Data Source: Children’s System of Care Data, 01/01/2023-12/31/2023, Oregon, Oregon Department of Human Services.
Children Served by Behavioral Health Services by Service Type, 2023
Data Source: Children’s System of Care Data, 01/01/2023-12/31/2023, Oregon, Oregon Department of Human Services.
Notes:
• ED: Emergency Department.
• MH: Mental Health.
• SUD: Substance Use Disorder.
Data Source: Children’s System of Care Data, 01/01/2023-12/31/2023, Oregon, Oregon Department of Human Services.
Notes: It is possible that the sum of percentages of every child age group may exceed 100% due to the fact that children can change their ages, location, or serving system. This means that a child could be counted more than once in yearly data, leading to an inflated percentage.
Data Source: Children’s System of Care Data, 01/01/2023-12/31/2023, Oregon, Oregon Department of Human Services.
Data Source: Children’s System of Care Data, 01/01/2023-12/31/2023, Oregon, Oregon Department of Human Services.
Data Source: Children’s System of Care Data, 01/01/2023-12/31/2023, Oregon, Oregon Department of Human Services.
Data Source: Youth and Referrals Reports, 2024, Juvenile Justice Information System Notes:
• The report divides the counts into criminal offenses (felony and misdemeanor), non-criminal offenses (violations), and dependency/status offenses. Each category is further divided into subcategories based on crime types. Sub-totals and grand totals are provided for each category.
• There are two sets of data for each jurisdiction, “Youth” counts and “Referral” counts. Additionally, there are statewide data sets for youth and referrals. The data counts:
• The unique number of “youth” processed by the juvenile justice system in the reporting year. This means no matter how many times a youth is referred, the youth is only counted once in the youth data. The youth is categorized by the most serious offense the youth committed during the reporting period and is included in the county that received the most serious offense.
• The unique number of “referrals” received by county juvenile departments during the reporting year. A single youth can have more than one referral in a year (i.e., the youth may have several reports by the police). The most serious charge associated with a referral is used to categorize the referral.
• Dependency Status Offenses: Most status offenses are included in the Non-Criminal reporting category. However, there are a few offenses generally considered status offenses that are categorized in statute as Dependency. These include Runaway, Beyond Parental Control, and Behavior to Endanger Self or Others. Not all counties enter Dependency Status Offenses
Data Source: Youth and Referrals Reports, 2024, Juvenile Justice Information System
Data Source: Youth and Referrals Reports, 2024, Juvenile Justice Information System
Data Source: Youth and Referrals Reports, 2024, Juvenile Justice Information System
Data Source: Youth and Referrals Reports, 2024, Juvenile Justice Information System
➢ The number of resident births has declined over the past 10 years across three counties.
➢ In three counties, Hispanic mothers had the second highest number of new births after white mothers, and this number has seen an increase over the past several years.
➢ In 2023, Linn and Lincoln Counties recorded the highest number of new births to mothers aged 25 to 29. This age group was followed by mothers aged 30 to 34. Conversely, Benton County had the greatest number of new births among mothers aged 30 to 34, with mothers aged 25 to 29 following behind.
➢ Lincoln County has the highest rate of new births to unmarried mothers at 54.4%, exceeding the statewide rate of 37.6%. Linn County follows at 37%, and Benton County has 27%.
➢ Over the past decade, general fertility rates have decreased. For 2023, Linn County has the highest rate, with 59.1 resident live births per 1,000 women aged 15-44, which is significantly higher than the statewide rate of 45.8. Following Linn County are Lincoln County at 44.1 and Benton County at 24.5.
➢ Over the past 10 years, total fertility rates have declined. For 2023, Linn County has the highest rate at 1.74, indicating that a woman is expected to have 1.74 children over her lifetime. This is followed by Lincoln County, which has a fertility rate of 1.43, both higher than the statewide average of 1.34. In contrast, Benton County has the lowest rate at 0.93.
➢ Lincoln County has the highest percentage of pregnant women receiving inadequate prenatal care at 5.9%, which is lower than the statewide rate of 6.7%. It is followed by Linn County at 5.1% and Benton County at 4.2%.
➢ Lincoln County has the highest percentage of pregnant women using tobacco at 8.2%, followed by Linn County at 4.7%, both exceeding the statewide rate of 3.5%. Benton County has the lowest rate at 2.5%.
➢ While teen births and their rates have decreased significantly over the past decade, Linn County and Lincoln County experienced increases in 2023 compared to 2022.
➢ In 2023, Benton County has the highest immunization rate for two-year-old children, reaching 69.7%. Linn County follows closely with a rate of 68.9%. Both counties exceed the statewide average of 68.3%. In contrast, Lincoln County has the lowest immunization rate among the three counties, standing at 66.5%.
➢ In 2023, Lincoln County has the highest rate of children served by Child Welfare Services, with 21 per 1,000 children. This is followed by Linn County
at 15.3 and Benton County at 11.5, all of which are higher than the statewide rate of 11.4.
➢ In 2023, Linn County reported the highest number of suspected child abuse cases, with a total of 3,753. This was followed by Benton County, which had 1,567 cases, while Lincoln County had the fewest with 1,212 reported cases. The majority of child abuse incidents in these counties were attributed to threats of harm, followed by cases of neglect.
➢ In 2023, Lincoln County had the highest rate of victimization per 1,000 children at 22.2, followed by Linn County at 17.3, both of which were higher than the statewide average of 13.0. Benton County had the lowest rate at 10.8.
➢ In 2023, Lincoln County recorded the highest rate of children receiving services at home from Child Welfare Services, at 2.7 per 1,000 children. Linn County ranked second, with a rate of 1.7, both exceeding the statewide average of 1.0. In contrast, Benton County had the lowest rate, at 0.5.
➢ In 2023, Lincoln County reported the highest rate of children in foster care, with 8.8 children per 1,000. This was followed by Linn County, which had a rate of 6.7. Both of these rates are higher than the statewide average of 5.4. In contrast, Benton County had the lowest rate at 4.8 children per 1,000.
➢ In 2023, Lincoln County has the highest rate of children served by Behavioral Health Services, at 103.1 per 1,000 children. This is followed by Linn County with a rate of 73.8, both of which are higher than the statewide average of 64.9. In contrast, Benton County has the lowest rate at 51.7 per 1,000 children.
➢ In 2023, Linn County reported the highest rate of children receiving Intellectual and Developmental Disability Services, with 17.7 per 1,000 children. This rate exceeds the statewide average of 14.0, followed by Lincoln County at 13.3 and Benton County at 11.7.
➢ In 2024, Linn County has the highest rate of juvenile justice referrals, with 17.8 referrals per 1,000 children. Lincoln County follows closely with a rate of 17.4, both exceeding the statewide average of 13.6. In contrast, Benton County has the lowest rate, at 12.1 referrals per 1,000 children.
The Early Learning Hub of Linn, Benton, and Lincoln Counties brings partners together to increase family stability, improve kindergarten readiness, and ensure service coordination that is equitable and culturally and linguistically competent.
The EL Hub is dedicated to strengthening connections between the state and local communities, aligning the workforce, and increasing the capacity to support the well-being of children and their families. It leads efforts to create a collaborative system where individuals work as a team, focusing on childcare and education, healthcare, early learning programs, cross-system integration, policy and research, and equity.
Our programs are specifically designed to connect children and their families with available services. These initiatives prioritize families at the center and work to coordinate efforts among families, communities, and various regional departments and agencies.


Pollywog is a program designed to help parents, grandparents, foster parents, and other caregivers build strong, healthy families. It connects families with parenting classes, health services, and local resources and follows up to ensure they get the support that meets their needs. Serving Linn, Benton, and Lincoln counties in Oregon, Pollywog brings together health care, parenting education, and early childhood services for families with children from pregnancy through age five.
Please visit Pollywog’s webpage for more information.
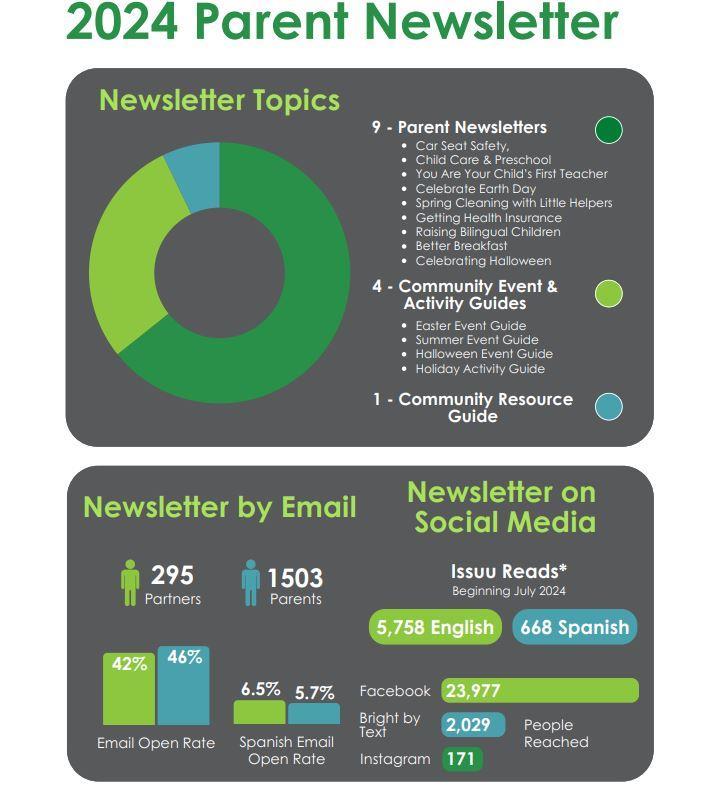
Pollywog’s Community Asset Mapping Project started in 2024 and continues through 2025, thanks to a Public Health Equity grant from OHA. Asset Mapping is a hands-on experience where large maps are the canvas for rural communities to share their perspectives. We seek to understand the resources and services available in rural communities and any barriers to accessing those resources and services.
This project’s priority is to engage and center the voices of families living in rural communities during Asset Mapping sessions held in 16 rural communities throughout Linn, Benton, and Lincoln counties. The selected communities have populations of under 20,000 residents, and at least two of these assets: a healthcare center, a library, and/or a grocery store that sells meat and produce. The Asset Mapping locations are:
➢ Linn County - Brownsville, Halsey, Harrisburg, Lebanon, Mill City, Scio, and Sweet Home;
➢ Benton County - Alsea, Monroe, and Philomath;
➢ Lincoln County - Depoe Bay, Lincoln City, Newport, Siletz, Toledo, and Waldport.
Following each community session, the data and maps are compiled into reports for our partners as well as the participants, if requested. The collected information supports strategic program funding plans that can transform the way that we serve rural families.
Additionally, Asset Mapping sessions benefit participants by increasing their knowledge of local resources and social support systems, promoting empowerment through respect and value of their input, and strengthening selfadvocacy and leadership skills
As of June 2025, nearly 200 rural families have participated in Asset Mapping sessions in their communities. Please visit the Pollywog website for more information.
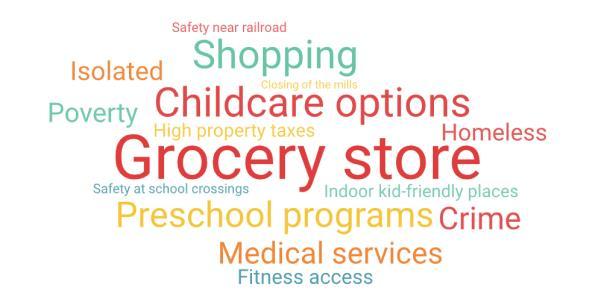
Please note that the following information is from the Oregon Department of Early Learning and Care. For more details, please visit Preschool Promise’s webpage for more information.
Preschool Promise (PSP) is a free, high-quality preschool program available to Oregon families who are living at or below 200 percent of the Federal Poverty Level in Oregon. The program serves children ages 3-4 in a “mixed-delivery model,” meaning that the program is operated in a variety of settings, and with a variety of sponsor organizations.
PSP settings include licensed center-based and home-based child care and schools. PSP sponsor organizations include culturally specific programs, school districts, Head Start programs, Oregon’s nine federally recognized Tribes, Relief Nurseries, education service districts and community-based organizations. Families may choose the PSP setting that best fits their needs.
PSP expands access to culturally responsive early care and education (ECE) programs. By establishing an inclusive, welcoming environment for all families, PSP may engage parents as partners in their child’s learning and development. Preschool Promise is currently the only public early learning program in Oregon in which all materials are offered in English and Spanish, at a minimum. Several Preschool Promise programs are culturally specific and/or multi-lingual.
Data Source: Preschool Promise Program Data, Oregon Department of Early Learning and Care.
Notes:
• Preschool Promise is a free, high-quality preschool program available to Oregon families with incomes at or below 200 percent of the Federal Poverty Level (FPL). Families enroll in Preschool Promise by working with their regional Early Learning Hub. Learn more about this program at the Preschool Promise webpage or Early learning Hub webpage
• This data is updated yearly, after slots are awarded.
Data Source: Preschool Promise Program Data, Oregon Department of Early Learning and Care.
Launched in August 2023 as a collaborative effort between the Early Learning Hub and Family Connections, our regional Child Care Resource and Referral agency, Growing Care is a home-based child care recruitment campaign aimed at licensing more Family child care programs in Linn, Benton, and Lincoln Counties, while assisting those new providers with access to start-up grants, business training focusing on home-based child care, college scholarships for early child care education certificates and degrees, and long-term coaching and mentoring.
To support the Growing Care program, an extensive grant writing campaign resulted in over $300,000 graciously awarded from the City of Albany, the City of Corvallis, the Ford Family Foundation, the United Way of Linn, Benton, and Lincoln Counties, the Tim and Jo Ann McQueary Fund, the Siletz Tribal Charitable Contribution Fund, the Niemeyer Foundation, the John & Tami Marick Foundation, and the Benton Community Foundation.
Over $50,000 was spent on the creation of the Growing Care website, branding material, as well as five separate paid marketing campaigns, leading to over 33,000 unique visitors to the Growing Care website since launching. Our threecounty region has benefited from an approximate 80% increase in the number of Registered Family programs licensed since the start of Growing Care, with fifteen new providers receiving a total of $79,500 in start-up grant funds issued by Family Connections.
Please visit Growing Care’s webpage for more information
The Early Learning Hub’s Business Outreach Initiative (BOI) allies with Linn, Benton & Lincoln Counties' employer leadership, representing business, higher education, public sector, non-profit organizations, or other entities, to educate them about the child care crisis and to seek out beneficial means of helping their organizations and employees.
Online resources available to assist employers with child care include:
➢ Employer's Child Care Solutions Menu
➢ Employer's Child Care Toolkit
➢ Employee Child Care Survey Example
➢ Guide for Finding Child Care Tips
Please visit Early Learning Hub’s webpage for more information.
Kristi Collins
Early Learning Hub Director
LeAnne Trask
Pollywog Coordinator
Connie Adams
Pollywog Community Alignment Specialist
Matt Grams
Program Accountant,
Preschool Promise Eligibility Specialist
Antonia Huerta
Parent Engagement Coordinator
Preschool Promise Coordinated
Enrollment Specialist
Jinguang Lin
Data & Evaluation Coordinator
Ana Reyes
Parent Engagement Coordinator
Preschool Promise Coordinated
Enrollment Specialist
Sam Rounsavell
Program Assistant
Pollywog Program Assistant
Carmen Santacruz
Parent Engagement Coordinator
Preschool Promise Coordinated
Enrollment Specialist
Kelly Schell
Family Resource Specialist
Bryan Steinhauser
Business Liaison
Lola Jones, Chair
Samaritan House
Lincoln County – Housing
DeAnn Brown
Confederated Tribes of Siletz Indians Standing Position
Jeff Davis
Linn-Benton Community College, retired Fiscal Agent – Standing Position
Shelagh Baird
Samaritan Health Services
Lincoln County – Health
Belit Burke
Oregon Department of Human Services
Linn County – Human & Social Services
Dean Craig
Willamette Workforce Partnership
Linn County – Business
Barbara Dougherty
Samaritan Early Learning Center, retired
Lincoln County – Early Childhood Education
Laura Farmer
Parent
Benton County – Parent Voice
Susan Halliday
Philomath School District
Benton County – K-12
Jason Hay
Linn Benton Lincoln Education Service
District
ESD – Standing Position
Todd Jeter
InterCommunity Health Network (IHN)
Coordinated Care – Standing Position
Paulina Kaiser
Samaritan Health Services
Benton County - Health
Stephany Koehne
Kids & Company of Linn County Linn County – Early Childhood Education
Tammi Martin
Oregon Department of Human Services ODHS – Standing Position
Bettina Schempf
Old Mill Center
Benton County – Human & Social Services
Paul Smith
Strengthening Rural Families
Benton County – Early Childhood Education
Diane Wilkinson
Lincoln County School District
Lincoln County – K-12
Lynnette Wynkoop
Child Care Resource & Referral
CCR&R Standing Position
Vacant Positions
• Board Co-Chair
• Benton County – Business
• Benton County – Housing
• Lincoln County – Business
• Lincoln County - Human & Social Services
• Lincoln County – Parent Voice
• Linn County – Health
• Linn County – Housing
• Linn County – K-12
• Linn County – Parent Voice
The following list provides some detail about some of the most common data sources used in the Regional Data Book:
The American Community Survey (ACS) is an ongoing household survey developed by the Census Bureau to provide social, housing, and economic characteristic data about our nation and its people every year. The ACS is collected throughout the year using mailed questionnaires, telephone interviews, and visits from Census Bureau field representatives to about 3.5 million household addresses annually. For more information, please visit https://www.census.gov/programs-surveys/acs.
The “Estimated Supply of Child Care and Early Education Programs in Oregon, 2022” dataset, which has been used since 1999 to track Oregon's early care and education supply over time, is compiled by the Oregon Child Care Research Partnership at Oregon State University using data collected by the Resource & Referral system through a biennial update managed by Central Coordination at Western Oregon University. For more information, please visit https://health.oregonstate.edu/early-learners/research
Spark is Oregon’s Quality Rating and Improvement System (QRIS), designed to raise the quality and consistency of early learning programs across the state. By aligning with the national trend of QRISs that recognizes, rewards, and builds on the current quality of early learning, Spark provides a framework for program quality improvement while providing a tool that helps parents look for quality early learning and care options. For more information, please visit https://oregonspark.org.
The Oregon Market Price Study identifies child care prices, which are related to the age of the child served, the type of care, the local supply and demand for child care, pricing modes, and facilities’ perceptions of the capacity of families to pay for care and the geographic distribution of these prices across the state. For more information, please visit https://health.oregonstate.edu/early-learners/research
The yearly At-A-Glance School and District Profiles, which were designed by and for parents and community members to be an understandable and easy-to-read overview of how schools and districts serve their students, are produced by The Oregon Department of Education (ODE) for schools and districts. For more information, please visit https://www.oregon.gov/ode/schoolsand-districts/reportcards/reportcards/pages/default.aspx.
The U.S. Census Bureau’s Small Area Income and Poverty Estimates (SAIPE) give single-year estimates of income and poverty for all U.S. states and counties and estimates of school-age children in poverty for all 13,000+ school districts. For more information, please visit https://www.census.gov/programs-surveys/saipe.html.
Report & Data from Oregon’s Department of Education supplies data reports and categories related to Preschoolers and K-12 students, covering topics like enrollment, attendance, graduation, assessment, special education, school & district profiles, etc. For more information, please visit https://www.oregon.gov/ode/reports-and-data/Pages/default.aspx.
Report & Data from Oregon Health Authority supplies data reports and categories related to the Oregon Health Plan, Oregon Student Health Survey, drinking water, WIC, immunization, etc. For more information, please go to https://www.oregon.gov/oha/Pages/index.aspx.
Economic Policy Institute’s Family Budget Map, to provide a more accurate and complete measure of economic security in America, produces data about the income a family needs to attain a modest yet adequate standard of living. For more information, please visit https://www.epi.org/resources/budget/budget-map.
The Children's Health Complexity system-level data provides a summary of the medical and social complexity factors for children covered by Oregon Health Plan (OHP) and Children's Health Insurance Plan (CHIP). From 2019 to 2022, the Oregon Health Authority (OHA) generated reports using this data to support coordinated care organizations (CCOs), healthcare providers, and communities in their efforts to equip families with the necessary resources to help their children thrive. For more information, please visit https://www.oregon.gov/oha/hpa/dsitc/pages/child-health-complexity-data.aspx
Vital statistics, which provide data on birth, death, dissolution of domestic partnership, divorce, domestic partnership, fetal death, induced abortion, marriage, and teen pregnancy occurring to Oregon residents, are the compilation and analysis of information collected from vital event records reported in Oregon. For more information, please visit https://www.oregon.gov/oha/PH/BIRTHDEATHCERTIFICATES/VITALSTATISTICS/Pages/ProgramInformation.aspx.
Child Safety Data and Reports by the Oregon Department of Human Services produce annual reports of child abuse and neglect statistics. For more information, please visit https://www.oregon.gov/dhs/children/child-abuse/pages/data-publications.aspx.
This dashboard presents information about young people who are involved with different childserving systems. It brings together data from various sources such as Child Welfare, the Office of Developmental Disabilities Services, Oregon Health Authority, and juvenile justice. The data displays are being developed in consultation with the System of Care Advisory Council and state agencies. For more information, please visit https://www.oregon.gov/odhs/data/pages/cwdashboard-soc.aspx
AA African American
ACS American Community Survey
AI/AN American Indian/Alaska Native
AP Alternative Pathway
C2Q Commitment to Quality
CCR&R Child Care Resource and Referral
CDIS Combined Disadvantaged
COVID Coronavirus Disease
CPI The Consumer Price Index
CTE Career Technical Education
DACA Deferred Action for Childhood Arrivals
EI/ECSE Early Intervention/Early Childhood Special Education
EL Hub Early Learning Hub
ELA English Language Arts
EPI Economic Policy Institute
ERDC The Employment Related Day Care program
ESD Education Service District
FPL Federal Poverty Level
ID/SSID Identification/ Secure Student Identification System
IFSP Individualized Family Service Plan
IHN-CCO InterCommunity Health Network Coordinated Care Organization
IHV Integrated Home Visit
KG Kindergarten
LBCC Linn Benton Community College
LBL Linn Benton & Lincoln
NH/PI Native Hawaiian/Pacific Islander
OCCRP Oregon Child Care Research Partnership
ODE Oregon Department of Education
ODHS Oregon Department of Human Services
OHA Oregon Health Authority
OHP Oregon Health Plan
OMB Office of Management and Budget
OSU Oregon State University
PSP Preschool Promise
QRIS Quality Rating and Improvement System
SAIPE Small Area Income and Poverty Estimates
SD School District
SHS Student Health Survey
SNAP Supplemental Nutrition Assistance Program
SSI Supplemental Security Income
STEM Science, Technology, Engineering, and Mathematics
WIC Supplemental Nutrition Program for Women, Infants, and Children.