


MOHAMED NOOR AZMAN BIN BIDIN
Politeknik Sultan Haji Ahmad Shah POWER SYSTEM TRANSMISSION LINES
NOR SUKOR BIN ALI


Published by POLITEKNIK SULTAN HAJI AHMAD SHAH SEMAMBU 25350 KUANTAN
Copyright ©2022, by Politeknik Sultan Haji Ahmad Shah Materials published in this book under the copyright of Politeknik Sultan Haji Ahmad Shah. All rights reserved. No part of this publication may be reproduced or distributed in any form or by means, electronic, mechanical, photocopying, recording, or otherwise or stored in a database or retrieval system without the prior written permission of the publishers.
Power System Transmission Lines is a comprehensive text, designed for tertiary students in Electrical Engineering. Written in a simple, easy to understand manner, this eBook introduces the reader to electrical aspects of the High Voltage transmission systems, focusing on the transmission lines. Some key features of the eBook include the coverage on transmission line parameters, performance of short, medium and long transmission lines; calculation of voltage regulation and transmission efficiency. A step by step calculation also provided to enhance the reader’s understanding. The insulators explanations by photographs enable students to visualize the components of transmission systems.
Abstract i
Introduction 1 Main Components 2
Advantages of using HVAC 5
Transmission lines parameters 7
Classification of Overhead Transmission Lines 9
Phasor diagram of Short Transmission Lines 13
Effects of high voltage on transmission efficiency 14
Transmission efficiency 15
Performance of Single Phase Short Transmission Lines 16
Corona 30 Insulator 33 Properties of Insulators 33
Distributed Voltage Theory in Insulator Network 43
References 57
In the Name of Allah, the Most Compassionate, the Most Merciful. All praises to Allah and His blessing for all the opportunities, trials and strength that have been showered on us to finish writing this eBook. We experienced so much during this process, not only from the academic aspect but also from the aspect of personality.
We gratefully acknowledge the continued encouragement we received from our friends and colleagues especially from the Department of Electrical Engineering, Politeknik Sultan Haji Ahmad Shah, Kuantan, Pahang. Also to our friends and colleagues in education both past and present, we’ll never forget your willingness to help us, to encourage us, to believe in our ability to writing our eBook.
Finally, we would like to express our very profound gratitude to our parents and families for providing us with unfailing support and continuous encouragement throughout the process of completing this eBook.
Power system engineering is that branch of Electrical Engineering which concerns itself with the technology of generation, transmission and distribution of electrical energy. The power system growing into a vast and complex system represents one of the most vital systems in every modern nation.
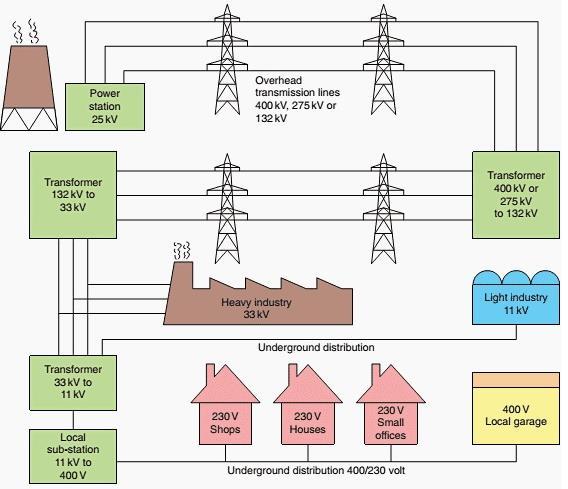
From figure 1.0, we can see that electrical energy, after being produced at generating stations is transmitted to the consumers for utilization. This is due to the fact that generating stations are usually situated away from the load centers. The network that transmits and delivers power from the producers to the consumers is called the transmission system. This energy can be transmitted in AC or DC form. Traditionally, AC has been used for years now, but HVDC (High Voltage DC) is rapidly gaining popularity.
The term transmission lines broadly refer to overhead transmission lines and underground cables. The key function of a transmission line is to transfer bulk power from generating plant sources and load centres which ultimately supplies the load. Transmission lines, when interconnected, become the transmission networks, typically referred to as the power grid. Transmission line also interconnects neighboring power utilities which allows not only economic dispatch of electrical power within regions during normal conditions, but also transfer the power between regions during emergencies.
Transmission lines are made up of various components namely towers, poles, lattice structures, conductors, cables, insulators, foundations and earthing systems. The successful transmission of power relies on the effectiveness of these components.
The main components of High Voltage (HV) electric transmission lines include:
1.1.1 Tower
1.1.2 Conductor
1.1.3 Insulator
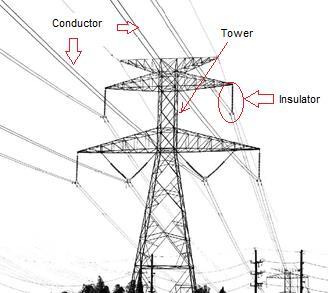
Fig. 1.1: Transmission Line
Transmission tower are the most visible component of the power transmission system. Their function is to keep the high voltage conductors (power lines) separated from their surroundings and from each other.
The overhead transmission line consists of a group of conductors running parallel to each other and carried on supports which provide insulation between the different conductors and between each conductor and earth.
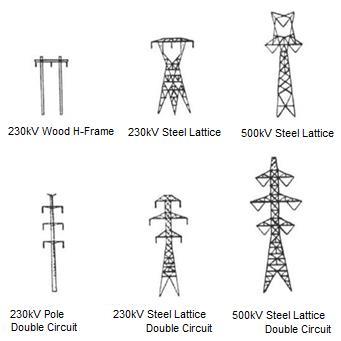
A variety of tower designs exist that generally employ an open lattice work or a monopole, but generally they are very tall metal structures. For example, a 500 kV tower with cross arms is higher than a 230 kV tower Figure 1.2 shows various types of transmission towers.
Fig. 1.2: Types of Transmission Towers
Conductors are the power lines that carry the electricity to and through the grid to consumers. Generally, several conductors are strung on a tower for each electrical circuit. In general, the types of conductors are solid, stranded and hollow conductors. Conductors are constructed primarily of twisted metalstrands, but newer conductors may incorporate ceramic fibers in a matrix of aluminum for added strength with lighter weight.
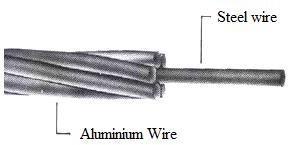
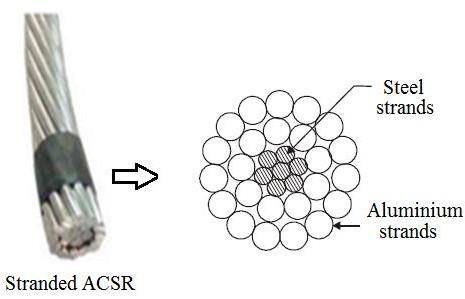
An overhead transmission line usually consists of three conductors or bundles of conductors containing the three phases of the power system. The bare conductors are suspended from a tower via insulators, usually made of Aluminium Conductor Steel Reinforced (ACSR), which are steel core (for strength) and aluminium wires (having low resistance) wrapped around the core. Other types of conductors are All Aluminium Conductor (AAC) and All Aluminium Alloy Conductor (AAAC).
Fig. 1.3: Cross-sectional view of ACSR conductor (7 steel strands and 24 aluminium strands)
Generally, insulators for overhead lines provide insulation to the power conductor from ground. The insulators are connected to the cross arm of the tower and the power conductor passes through the clamp of the insulator.
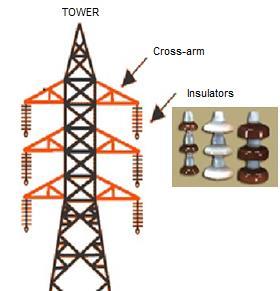
Fig. 1.4: Insulator on Transmission Tower
Fundamentally there are two systems by which electrical energy can be transmitted;
1.2.1 High Voltage DC (HVDC) Transmission System
1.2.2 High voltage AC (HVAC) Transmission System
Generally electrical power mainly transmitted by Three Phase High Voltage Alternating Current (HVAC) system because of certain reasons. Since power is the product of voltage and current, for a given load, the higher the supply voltage, the lower the load current. Reducing the current ensures (a) minimum voltage drop along the line, (b) minimum line losses, and (c) conductors of practical crosssectional areas. This is necessary to minimize the voltage drop along the transmission line, and to reduce energy losses which are proportional to current squared.
1.3.1
Electrical power is directly proportional to the product of electrical current and voltage of system. For a given amount of power, transmitting certain electrical power from one place to another, if the voltage of the power is increased then associated current of this power is reduced. The series resistance causes a real power loss (P= I2R) in the conductor. Reduced current means less energy losses, I2R loss in the system. Decreased current causes improvement in voltage regulation of power transmission system and improved voltage regulation indicates quality power
The advantage of transmitting electrical power at higher voltages is that smaller conductors can be used, since the current flow would be less for the same amount of power (Watts). Less cross sectional area of the conductor means less capital involvement.
1.3.3 The alternating voltages can be easily stepped up and down using transformers, which is not possible in DC transmission system.
1.3.4 Maintenance of AC substation is quite easy and economical compared to DC system.
1.3.5 The transforming in AC electrical substation is much easier than motor generator sets in DC system.
1.4.1 The volume of conductor used in AC system is much higher than that of DC.
1.4.2 The reactance of the line, affects the voltage regulation of electrical power transmission system
1.4.3 Problems of skin effects and proximity effects only found in AC system.
1.4.4 AC transmission system is more likely to be affected by corona effect than DC system.
1.4.5 Construction of AC electrical power transmission network is more complexes than DC system.
1.4.6 Proper synchronizing in AC transmission system if earth is utilized as return path of the system required before interconnecting two or more transmission lines together.
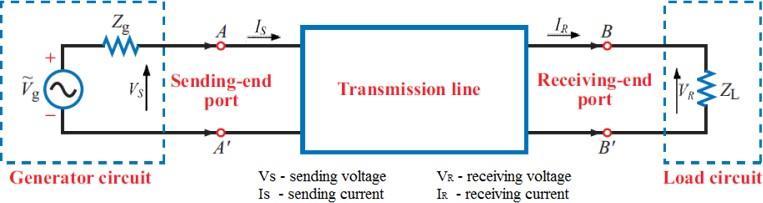
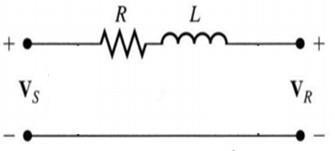
Transmission line is the long conductor with special design (bundled) to carry bulk amount of generated power at very high voltage from one station to another as per variation of the voltage level. The line is shown to have two ends: sending end (designated by the subscript S) at the generator, and the receiving end (designated R) at the load.
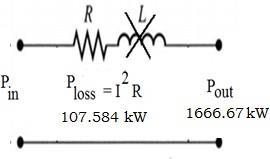
Fig. 1.5: Block diagram of Transmission Line
An electric transmission line has four parameters, namely resistance (R), inductance (L), shunt capacitance (C) and shunt conductance (G). The parameters can be modeled as shown in Figure 1.6 below.

Fig.
The series resistance causes a real power loss in the conductor. The resistance of the conductor is very important in transmission efficiency evaluation and economic studies. The power transmission capacity of the transmission line is mainly governed by the series inductance. The shunt capacitance causes a chargingcurrent to flow in the line and assumes importance of for medium and long transmission lines. These parameters are uniformly distributed throughout but can be lumped for the purpose of analysis on approximate basis. These parameters together with the load current and power factor determine the electrical performance of the line. The term performance includes the calculation of sending end voltage, sending end current, sending end power factor, power loss in line, efficiency of transmission, regulation and limits of power flow during steady state and transient condition.
The R in this element represents the “conductor loss”, mainly due to temperature, spiraling, frequency and skin effect.
The G in this element represents the “dielectric loss”, (due to loss in the insulator: dirt, salt, moisture, and other contaminants) and due to corona loss (meteorological conditions: particularly rain and conductor surface irregularities).

As mentioned earlier, a transmission line has three constants R, L and C distributed uniformly along the whole length of the line. The resistance and inductance form the series impedance. The capacitance existing between conductors and neutral forms a shunt path throughout the length of the line. Therefore, the capacitance effects introduce complications in transmission line calculations. Depending upon manner in which capacitance is taken into account, the overhead transmission lines are classified based on its length and rated voltage line as follows;
A short transmission line is classified as a transmission line with: A length less than 80km Voltage level less than 20 kV
Capacitance effect is neglected.
Only resistance and inductance are taken in calculation.
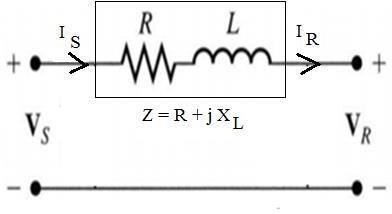
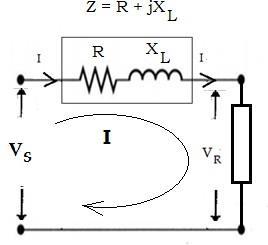
Due to smaller length and lower voltage, the capacitance effects are small and hence can be neglected. The equivalent circuit of a short transmission line is shown in the Figure 1 7 below. In the equivalent circuit short transmission line is represented by the lumped parameters R and L. R is the resistance (per phase) while L is the inductance (per phase) of the entire transmission line. As said earlier the effect of shunt capacitanceand conductance is not considered in the equivalent circuit.
Fig. 1.7: Equivalent circuit of a short transmission line
The total series resistance (RT) and total reactance (XT) for the entire transmission line can be calculated as; ���� = ����, ���� = ����
where r and x are the resistance and reactance per unit length (Ω/phase/km) and d is the length of transmission line (km).
Vs and Vr are the sending and receiving end voltages; IS and IR is the sending and receiving end currents.
According to KVL; ���� = ��(�� + ������)+ ��r ���� = ��Z+ ��r where �� = �� + ������
So the receiving voltage Vr can be calculated as; ∴ ��r = ���� ����
A medium transmission line is classified as a transmission line with:
A length more than 80km but less than 240km
Operational voltage level is from 20kV to 100 kV
Capacitance effect is present.
Distributed capacitance form is used for calculation purpose.
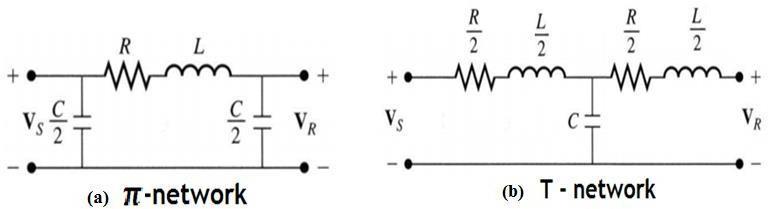
Due to sufficient length and voltage of the line, the capacitance effects are taken into account. For purposes of calculations, the distributed capacitance of the line is divided and lumped in the form of condensers shunted across the line at one or more points. It can be modeled as π network or T-network as depicted in Figure 1.8 (a) and (b) below;
Fig. 1.8: Equivalent circuit of a Medium transmission line
A long transmission line is classified as a transmission line with:
A length more than 80km but less than 240km
Operational voltage level is from 20kV to 100 kV
Capacitance effect is present.
Distributed capacitance form is used for calculation purpose.
The line constants are considered uniformly distributed over the whole length of the line and rigorous methods are employed for solution. All parameters R, L, C and G should be taken into account. The model shown as Figure 1.9 below;
Fig.1 9: Equivalent circuit of a long transmission line
In order to compensate the effect of long line series and shunt capacitance;
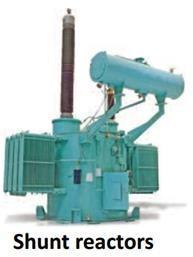
i. Shunt reactors are used to compensate the line shunt capacitance underlight load or no load to regulate voltage.
ii. Series capacitors are often used to compensate the line inductive reactance in order to regulate transfer more power.
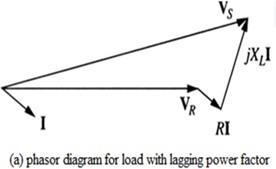
Phasor diagram for short transmission line carrying a load with lagging, unity (1.0) and leading power factor.
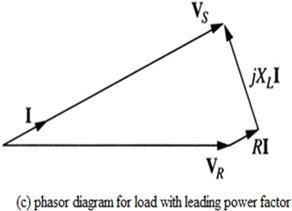
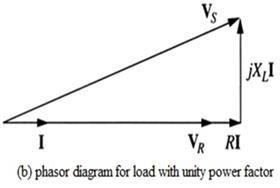
Figure 1.10: Phasor diagram of short transmission line with power factor (a) lagging (b) unity (c) leading
The primary reason that power is transmitted at high voltages is to increase efficiency. As electricity is transmitted over long distances, there are inherent energy losses along the way. High voltage transmission minimizes the amount of power lost as electricity flows from one location to the next. How? The higher the voltage, the lower the current. The lower the current, the lower the resistance losses in the conductors. And when resistance losses are low, energy losses are lowalso. Electrical engineers consider factors such as the power being transmitted and the distance required for transmission when determining the optimal transmission voltage.
There is also an economic benefit associated with high voltage transmission. The lower current that accompanies high voltage transmission reduces resistance in the conductors as electricity flows along the cables. This means that thin, light-weight wires can be used in long-distance transmission. As a result, transmission towersdo not need to be engineered to support the weight of heavier wires that would be associated with a high current. These considerations make high voltagetransmission over long distances an economical solution
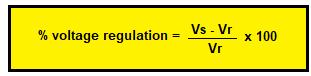
While studying the performance of a transmission line, it is desirable to determine its voltage regulation and transmission efficiency.
When a transmission line is carrying current, there is a voltage drop in the line due to resistance and inductance of the line. The result is that receiving end voltage (Vr) of the line is generally less than the sendingend voltage (VS). The difference in voltage at the receiving end voltage (Vr) between conditions of no load and full load is called voltage regulation and is expressed as a percentage of the receiving end voltage.
The power obtained at the receiving end of a transmission line is generally less than the sending end power due to losses in the line resistance.
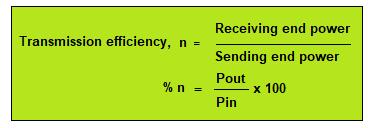
The ratio of receiving end power to the sending end power of a transmission line is known as the transmission efficiency of the line.
In three phase system, power can be calculated using correspond formula. Assuming that the load connection is in Star (Y), where the phase parameter designated as (ph) and line parameter designated as (L), power in three phase system is;
The three phase input and output of Apparent Power (S); (s) at sending end
(r) at receiving end
The three phase input and output of Real Power (P);
The three phase input and output of Reactive Power (Q);
where Vr, Ir and cos ør are the receiving end voltage, current and power factor while VS, IS and cos øS are the corresponding values at the sending end.
As stated earlier, the effects of line capacitance are neglected for a short transmission line. Therefore, while studying the performance of such a line, only resistance and inductance of the line are taken into account. Theequivalent circuit and phasor diagram of a single phase short transmission line is shown in Figure 1.11(i) and 1.11(ii) respectively. The total line resistance and inductance are shown as lumped instead of being distributed. The circuit is a simple AC series circuit.
Figure 1.11: (i) Equivalent circuit (ii) phasor diagram
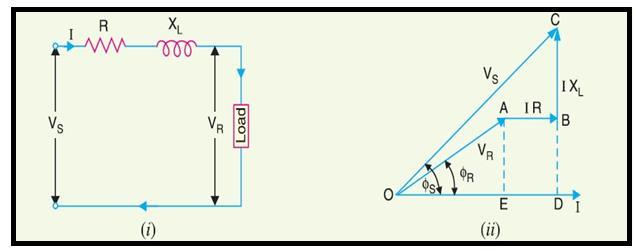
Let I = load current Vr = receiving end voltage R = total resistance VS = sending end voltage XL = total reactance ������∅r = receiving end power factor (lagging) ������∅��= sending end power factor
The phasor diagram of the line lagging load power factor as shown in Fig.1.11(ii). ����2 = ����2 + ����2 ���� 2 = (���� + ����)2 + (���� + ����)2 ���� 2 = (��r������∅r + ����)2 + (��r������∅r + ������)2
From the right angled triangle ODC, we can derive the value of sending voltage,VS; ∴
�� = √(��r������∅r +����)2+ (��r������∅r +������)2
It is often convenient and simpler using approximation expression in complex notation with reasonable accuracy for VS becomes;
���� = ����+���� ���� = ��(��+������)+ ����
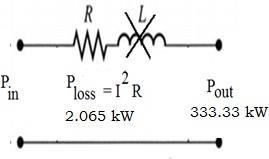
Single phase power delivered (Poutput) = V r I r cos∅r
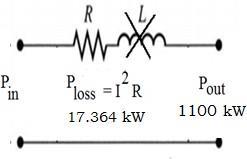
Single phase line losses (Ploss) = I2 R

Single phase Input Power, Pin = Poutput + Ploss
Pin = VR IR cos∅R + I2 R
Using approximation equation
Example 1
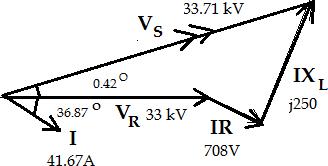
A single phase overhead transmission line delivers 1100kW at 33kV at 0.8 p.f lagging. The total resistance and inductive reactance of the line are 10Ω and 15Ω respectively. Determine; i. sending end voltage ii. sending end power factor iii. voltage regulation iv. transmission efficiency.
SOLUTION
i. Sending end voltage (����)
Load power factor, cos∅R = 0.8 lagging ∅R = ������ 10.8 = 36.87�� (������) Total line impedance, �� = �� + ������ = 10 + ��15 = 18.03 < 56.31��Ω
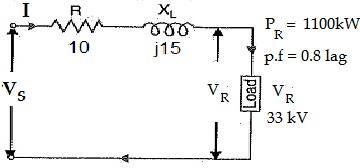
Receiving end voltage, VR = 33kV
Power , PR = VR IR cos∅R ∴ current, I = PR VR cos∅R I = 1100kW = 41.67 < 36.87��A 33kV X 0.8
iv.
Example 2
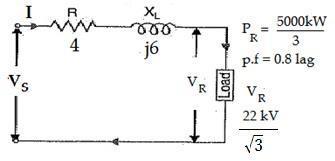
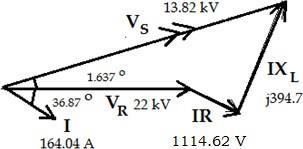
An overhead 3 phase transmission line delivers 5000kW at 22kV at 0.8 p.f lagging. The total resistance and reactance of each conductor is 4Ω and 6Ω respectively. Determine; i. sending end voltage ii. percentage of voltage regulation iii. transmission efficiency.
SOLUTION
iii.
efficiency.
Example 3
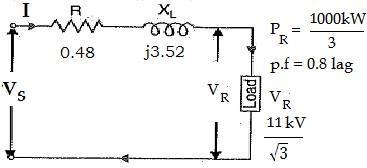
A 3 phase, 50Hz,16 km long overhead line supplies 1000kW at 11kV, 0.8 p.f lagging. The line resistance is 0.03Ω per phase per km and line inductance is 0.7mHper phase per km. Calculate the sending end voltage, voltage regulation and efficiency of transmission.
SOLUTION
i. Sending end voltage (����)
Transmission line length = 60 km
Total Resistance ��= 0.03Ω/phase/km x 16 km = 0.48Ω
Total Reactance ����= 2������ = 2��(50)(7����)/phase/km �� 16 ���� = 3.52 Ω Total Impedance �� = �� + ������ = 0.48 + ��3.52 = 3.55 < 82.24��Ω Load power factor, cos∅R = 0.8 lagging ∅R = ������ 10.8 = −36.87�� (������)
Single phase power, P1ph = P 1000kW 3 3 = 333.33 kW Sending end voltage/phase, VRph = 11k = 6,351V Line current, I = PR VR ph cos∅R 333.33kWI = = 65.6 < −36.87��A 6351 V X 0.8
1. A single phase overhead transmission line delivers 4000kW at 11kV at 0.8 p.flagging. If resistance and reactance per conductor are 0.15Ω and 0.02Ω respectively, calculate; i. percentage regulation ii. sending end power factor iii. line losses.
[ans: 19.83%, 0.77 lag, 620kW]
2. A single phase 11kV line with a length of 15 km is to transmit 500kVA.Theinductive reactance of the line is 0.5Ω/km and resistance is0.3Ω/km. Calculate the efficiency and regulation of the line for 0.8 lagging p.f. [ans: 97.74%, 3.34%]
3. A load of 1000kW at 0.8 lagging p.f. is received at the end of a 3 phase line 20 km long. The resistance and reactance of each conductor are the line is 0.25Ω and 0.28Ω per km. If the receiving end line voltage is maintained at 11kV, calculate;
i. sending end voltage (line-to-line) ii. percentage regulation iii. transmission efficiency.
[ans: 11.84kV, 7.61%, 94.32%]
4. A 3-phase line 3 km long delivers 3000kW at a p.f0.8 lagging to a load. The resistance and reactance per km of each conductor are 0.4Ω and 0.3Ω respectively. If the voltage at the supply end is maintained at 11kV, calculate;
i. receiving end voltage (line to line) ii. line current iii. transmission efficiency.
[ans: 10.46kV, 207A, 95%]
5. A short 3 ∅transmission with an impedance of (5 + j20)Ω per phase has sending end and receiving end voltages of 46.85kV and 33kV respectively for some receiving end load at a p.f0.8lagging. Determine;
i. Power output ii. Sending end power factor [ans: 22.86kW, 0.657 lag]
6. A 3 phase line delivers3600kW at 0.8 lagging p.f. to a load. If the sendingend voltage is 33kV, determine
i. receiving end voltage ii. line current iii. transmission efficiency.
The resistance and reactance of each conductor are 5.31Ω and 5.54Ωrespectively. [ans: 31.93kV, 81.36A, 97.15%]
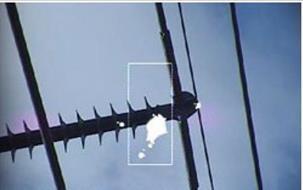
When an alternating potential difference is applied across two conductors whose spacing is large as compared to their diameters, there is no apparent change in the condition of atmospheric air surrounding the wires if the applied voltage is low. However, when the applied voltage exceeds a certain value, called critical disruptive voltage, the conductors are surrounded by a faint violet glow called corona. The phenomenon of violet glow, hissing noise and production of ozone gas in an overhead transmission line is known as corona.
The presence of corona can reduce the reliability of a system by degrading insulation. While corona is a low energy process, over long periods of time,it can substantially degrade insulators, causing a system to fail due todielectric breakdown. It has been seen that intense corona effects are observed at a working voltage of 33 kV or above. Therefore, careful design should be made to avoid corona on the sub stations or bus bars rated for 33kV and higher voltages otherwise highly ionized air may cause flash overin the insulators or between the phases, causing considerable damage to the equipment. The effects of corona are cumulative and permanent, and failure can occur without warning.
Corona causes:
i. Light, Ultraviolet radiation
ii. Sound (hissing, or cracking as caused by explosive gas expansions)
iii. Other chemicals, depending on the insulator material
iv. Heat (although generally very little, and primarily in the insulator)
1.12.2.1 Carbon deposits, thereby creating a path for severe arcing.
The phenomenon of corona is affected by the physical state of the atmosphere as well as by the conditions of the line. The following are the factors upon which corona depends:
As corona is formed due to ionization of air surrounding the conductors, therefore, it is affected by the physical state of atmosphere. In the stormy weather, the number of ions is more than normal and as such corona occurs at much less voltage as compared with fair weather.
The corona effect depends upon the shape and conditions of the conductors. The rough and irregular surface will give rise to more corona because unevenness of the surface decreases the value of breakdown voltage. Thus a stranded conductor has irregular surface and hence givesrise to more corona that a solid conductor.
If the spacing between the conductors is made very large as compared to their diameters, there may not be any corona effect. It is because larger distance between conductors reduces the electro-static stresses at the conductor surface, thus avoiding corona formation.
The line voltage greatly affects corona. If it is low, there is no change in the condition of air surrounding the conductors and hence no corona is formed. However, if the line voltage has such a value that electrostatic stresses developed at the conductor surface.
The corona effects can be reduced by the following methods:
1.12.4.1
Increasing conductor size.
By increasing conductor size, the voltage at which corona occurs is raisedand hence corona effects are considerably reduced. This is one of thereasons that ACSR conductors which have a larger cross-sectional area are used in transmission lines.
1.12.4.2
Increasing conductor spacing (distance between conductors).
By increasing the spacing between conductors, the voltage at which corona occurs is raised and hence corona effects can be eliminated. However,spacing cannot be increased too much otherwise the cost of supporting structure (e.g., bigger cross arms and supports) may increase to a considerable extent.
1.12.4.3 Surface treatment.
Corona inception voltage can sometimes be increased by using a surface treatment, such as a semiconductor layer, high voltage putty or corona dope.
1.12.4.4
Electric charges tend to form on sharp points; therefore, when practicable we strive to eliminate sharp points on transmission line components.
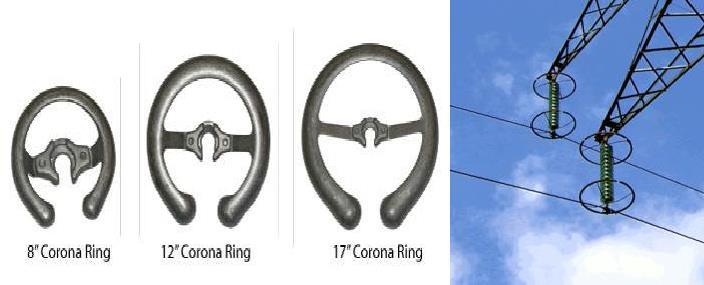
1.12.4.5
On certain new 345 kV structures, corona rings installed. These rings have smooth round surfaces which are designed to distribute charge across awider area, thereby reducing the electric field and the resulting coronadischarges.
It has been mentioned earlier that the overhead line conductors are bare without any insulating covering over them. While the metal structure in the form of towers is used to support such live conductors. To avoid the flow of current to the earth from live conductors through supports, there must be a safe clearancebetween live conductors and the supports. Thus the live conductors must beperfectly insulated from the supports. Hence the insulators are used between live conductors and the supports.
The main function of the insulators is to provide perfect insulation between the live conductors and the supports/tower and to prevent any leakage current from the live conductors to earth through the supports.
To provide necessary insulation, the insulators must have these following properties;
i. The insulators along with providing the insulation, also provide support to theconductors. Hence to withstand the conductor load along with wind pressure etc, the insulators must be mechanically very strong.
ii. The main function of the insulators is to resist any leakage current. Thus the insulators must have very high insulation resistance.
iii. The insulators must be free from internal impurities such as holes, cracks. laminations etc. This reduces the permittivity of the insulators.
iv. The dielectric strength of the insulators must be very high. To have high dielectric strength, the relative permittivity of the insulating material should be very high.
v. The insulating material should be nonporous.
vi. The insulators should not be affected by the changes in the temperature.
vii. Due to very high voltage of line conductors, there is possibility of flash over between line conductors and earth. The flashover means production of arc due to which extreme heat gets produced. This is the main cause of insulatorfailure. Hence the insulators must have high ratio of puncture strength to flash over voltage.
The commonly used insulating materials, satisfying the above mentioned properties are;
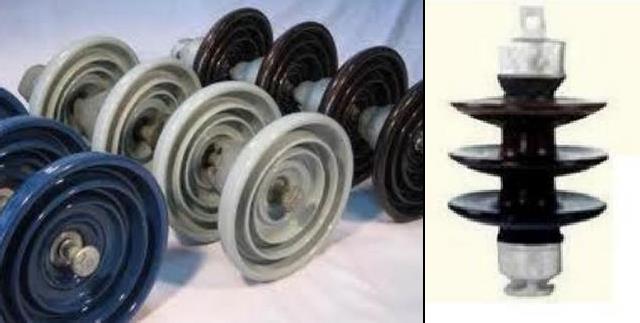
i. Porcelain ii. Glass
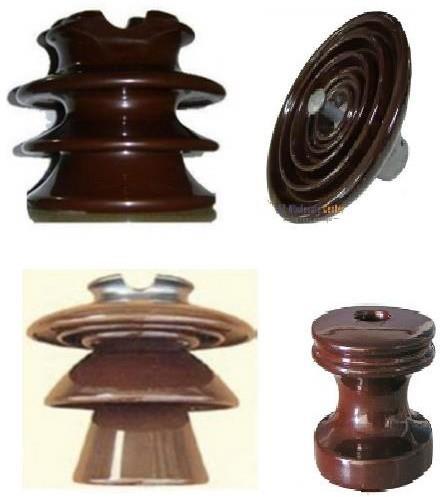
1.13.3.1.1 Porcelain
This is the most commonly used material for the insulators. It is a ceramic material, manufacturedfrom the china clay. The plastic clay ismixed with silicon and feldspar and heated at the controlled temperature. It has been given a particular shape and it is covered with glaze so that it remains clean from dust and moisture. Thedielectric strength of the porcelain insulator is about 60kV/cm.
Figure 3.15: Various shapes of porcelain insulators
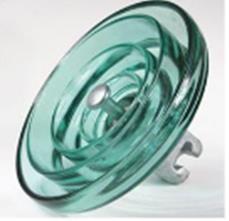
The glass also can be used instead of porcelain. The glass is madetough by heat treatment which is called annealing
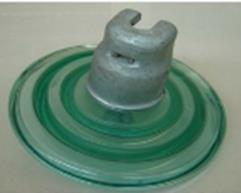
Figure 3.16: Single unit of glass insulators
The use of proper insulator is an important part of the mechanical design of the
overload lines. The various types of the insulators are;
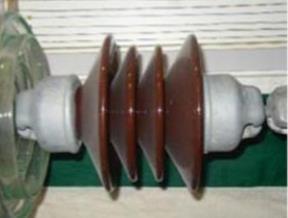
1.13.4.1 Pin type insulators
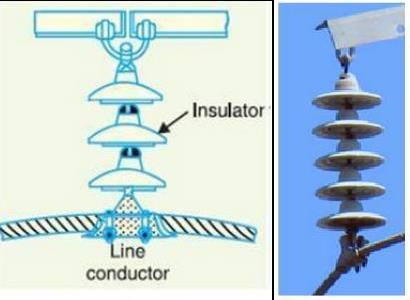
1.13.4.2 Suspension type insulators
1.13.4.3 Tension/String insulators
A typical pin type insulator is shown in Figure 3.17. For lower voltages up to 11kV, generally one-piece pin type insulator is used. But for higher working voltages like 33kV, 66kV and beyond it two piece, three piece, four piece insulators can be used. But its use is restricted up to 33kV as for higher voltages, the pin insulators are uneconomical.The pin insulators become very bulky for higher voltages.
Figure 3.17: Pin type insulator.
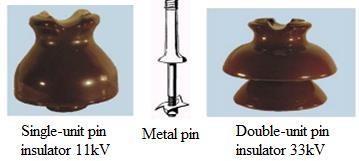
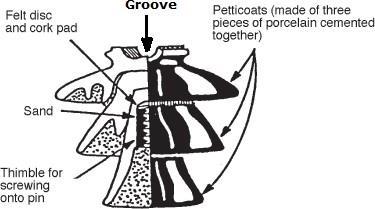
Figure 3.18: Pin type insulator installation.
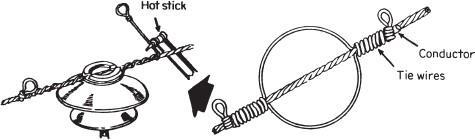
On the upper end, there is a groove for housing the conductor. The conductor passes through the groove on the upper end and is bound by the binding wireof soft copper or soft aluminium i.e the same material as that of conductor, as shown in Figure 3.18. The pin insulators are very firmly secured to the cross arm on the transmission pole with the help of steel bolts. To avoid the direct contact of hard metal with porcelain, the lead screws are used. In such case two methods are used to secure insulator to the bolt.
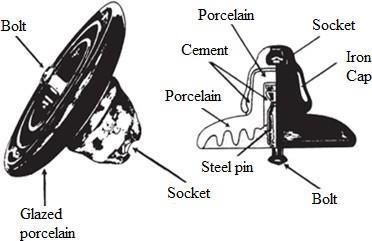
The suspension type insulator consists of a porcelain disk contained between a ball and socket (or clevis and pin, or other) arrangementso that the porcelain is in compression; each disk has certain electricaland mechanical characteristics. The ball and socket arrangement permits units to be added to each other in a string, thusaccommodating higher voltages. Several such strings can be connected mechanically in “parallel” to achieve necessary strength requirements. Discs vary in diameter from about 5 to 10 inches, with standard vertical distances between ball and socket (or other components) of 41 and 51 inches, and are rated for an allowable tension of 12,000 lb. See Figure 3.19 below.
Figure 3.19: Suspension type insulator
These insulators are used when there is dead end of the line or corner of line is at a sharp curve or the line is crossing the river etc. These insulators reduce the excessive tension on the line under such abnormal conditions. For low voltage lines below 11kV shackle insulators are used but for higher voltages strain insulators are used. Assembly of the suspension insulators is used as strain insulators. The discs of the strain insulators are in a vertical plane instead of the horizontal plane as in the suspension insulators. In case of conditions like crossing of the river, there is excessive tension on the line. In sucha case, two or more strings of the insulators are used in the parallel.
Figure 3.21(a): Strain insulator.
Figure 3.21 (b): Use of strain insulator.
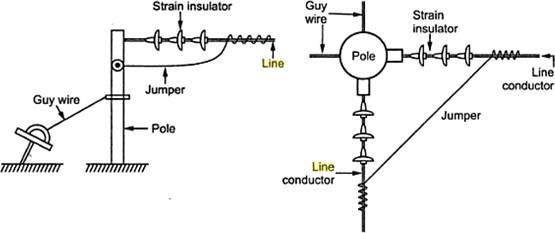
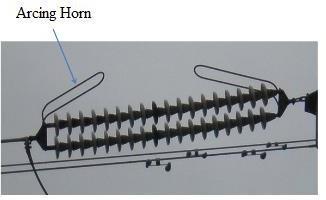
Figure 3.21 (c): Strain insulator with arcing horn.
Arcing horns are used to protect insulators on high voltage linesdamage during flashover. Over voltages on transmission lines, due to switching operations, lightning or electrical faults can cause arcs across insulators (flashover) that can damage them. The horns make the flashover to occur between them rather than across insulatorsurface. Horns are normally paired on either side of the insulator, one connected to the line and the other to ground.
1. These are costlier than the suspension type.
For higher voltages, these are cheaperthan the pin type.
2. Use is restricted up to 33kVonly. Each unit is designed for 11kV and string can be designed for any higher voltagelevel.
3. For higher voltages, these are bulky and heavy.
4. The replacement work is difficult.
For higher voltages, the string is not bulky.
Replacement work is easy as only faultyunit of the string is to be replaced.
5. Binding wire is used to hold the conductor. Binding wire is not used.
6. At later stage, unit cannot be modified for the higher voltages.
By adding an additional unit to the string,the insulator can be modified for the higher voltages.
7. It is not suspended but is fixed. The string is suspended and free to swing. So string takes position of minimum mechanical stress.
8.
Chances of getting affected by lightning are more.
Less affected by lightning.
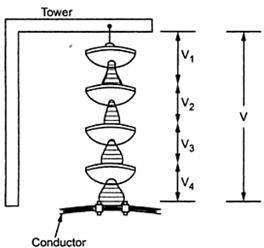
Consider a string of suspension insulators. The numbers of porcelain discs areconnected in series with the help of metal links. The Figure 3.9 shows string of 4 porcelain disc suspension insulators.
The porcelain portion which is an insulator is in between the two metal fittings. Thus it forms capacitor. This is called “self capacitance” or “mutual capacitance”.
Fig. 3.22: String of 4 porcelain disc suspension insulators
Hence the whole string shown in the Figure 3.22 will consists of 4 such self capacitors in series.
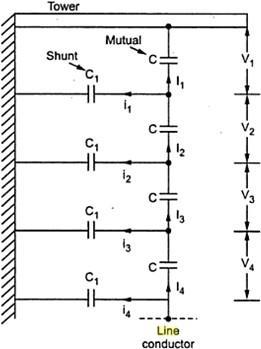
If only such self or mutual capacitors exist alone in series, the voltage across them would have been equal and series charging current through them would have been same. But in addition to the self capacitances, there will be capacitance between each metal fitting and the earth i.e tower. The air acts as the dielectric. Such a capacitance is called “shunt capacitance”. Due to shunt capacitors, the charging current no longer remains same.
The different currents, mutual capacitors and shunt capacitors are shown in the Figure 3.10. The mutual (self) capacitors are denoted as C whiles the shunt capacitors are denoted as C1 Assuming the design of each section of the string same, the mutualcapacitors are assumed equal. Similarly, all shunt capacitors are also assumed equal.
There will be capacitance between metal fittings and the line conductor also. But its value is very small and generally it is neglected.
��1= shunt capacitors
�� = mutual (self) capacitors
Fig. 3.23: Equivalent circuit for 4 string insulators
The currents I1, I2, I3 and I4 are charging currents flowing through mutual capacitors while i1, i2, i3 and i4 are charging currents flowing through shunt capacitors.
Due to the different charging currents, each capacitor will get charged to different potential. Hence the voltage across each section of the string will be different. It is shown as V1, V2, V3 and V4 in the Figure 3.23.
As the charging current is highest nearest to the line conductor, the voltage across the capacitor nearest to the line conductor will be maximum. Then V4 will be maximum, for the case considered. Hence the insulator adjacent to the line conductor is under maximum electrical stress and is liable to puncture.
We have seen the higher the value of the string efficiency, more uniform is the potential distribution over a string of suspension insulators. The line unit is always under the maximum electrical stress. To avoid possibility of puncture of line unit due to excessive stress, efforts are made to have uniform potential distribution. Hence some methods are used in practice to get higher efficiency. These methods are;
1.15.2.1 Cross arm (Reducing ratio of shunt capacitance to self capacitance).
1.15.2.2 Use of guard ring to provide static shielding.
1) Cross arm (Reducing ratio of shunt capacitance to self capacitance)
The voltage across the line unit depends on the value of k which is the ratio of shunt capacitance to self capacitance.
�� = ��ℎ���������������������������� = ��1 �������� ���������������������� ��
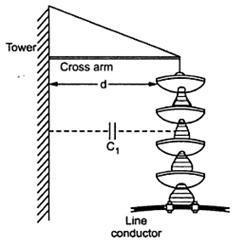
The string efficiency is dependent on voltage across the line unit. Lesser the value of k, higher is the string efficiency and more uniform is the potential distribution. The voltages across the various units of string are almost equal for very low values of k. So to reduce the value of k, ��1 must be reduced. This is possible by increasing the distance between the insulator and earth i.e tower.
Figure 3.24: Use of long cross arm
This can be achieved by increasing the length of cross-arm as shown in Figure 3.24.More the length d of the cross arm, less is the value of ��1 and less is the value of k. But this method has practical limitations such as;
Use of long cross-arm increases the cost.
Due to long cross arm overall strength of the tower reduces.
Hence in practice, the minimum value of k which can be achieved by this method is 0.1. And due to this limitation, this method is rarely used in practice.
In this method a large metal ring surrounding the bottom insulator unit and connected to the metal part of the line. Such a ring is called “guard ring” which gives a capacitance which will cancel the charging current of ground capacitance. The guard ring is shown in Figure 3.25. This is also called static shielding of the string.
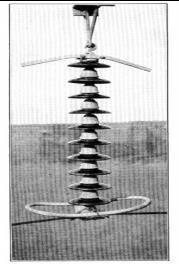
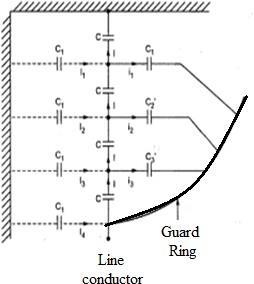
Figure 3.25: Guard Ring (a) Physical (b) schematic diagram
Guard ring serves two purposes;
Equalizing the voltage drop across each insulator unit.
Protects the insulator against flashover.
Let us consider 3 unit of insulators suspended on the cross-arm of tower. The distribution of voltage on each insulator is not uniform. So the string network distribution voltage can be determined as follows;
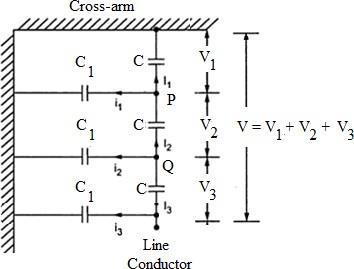
Applying Kirchhoff’s Current Law at node P, ��2 = ��1 + ��1 (1) The current through capacitor is the ratio of voltage across the capacitor and the capacitance reactance of the capacitor, ���� = ���� ����
���� 1 2������
= 2����������=
Using this in the equation (1), 2��������2= 2������1��1+ 2��������1
This is because the voltage across ��1 is ��1
����2=��1(�� + ��1) ��2= ��1(�� + ��1)/�� �� = �� (1 + ��1) 2 1 ��
Substituting the ratio of �� = ��1 �� ….. (2)
��2= ��1(1+��)
Similarly applying Kirchhoff’s Current Law at node Q, ��3 = ��2 + ��2 (3)Note that the voltage across the shunt capacitance ��1 carrying current ��2 is ��1 + ��2
2��������3= 2������1(��1 + ��2)+ 2��������2 ����3= ��1(��1 + ��2)+ ����1(1 + ��)
Substituting equation (2) where ��2= ��1(1 + ��), ����3= ��1[��1 + (1 + ��)��1]+ ����1(1 + ��) ����3= ��1��1(1 + 1 + ��)+ ����1(1 + ��)
Using = ��1 �� , ∴��1 = ����,
����3= ������1(2 + ��)+ ����1(1 + ��)
����3= ����1(2�� + ��2)+ ����1(1 + ��)
����3= ����1(2�� + ��2 + 1 + ��) (4)∴��3= ��1(��2 +3��+1)
��=��1 +��2 + ��3While …… (5)
Hence using equation (2), (4) and (5) all the voltages for given value of k can be calculated.
The efficiency of the string network can be determined


∴ String efficiency = x 100
More the value of k, greater is the non uniformity and lesser is the string efficiency. While as the number of units in a string increases, the string efficiency decreases and its calculation becomes much more tedious. Hence the string with less number of units is more effective.
Example 1
Each line of a three phase system is suspended by a string of three similarinsulators. If the voltage across the line is 20kV, calculate the line to neutral voltage and the string efficiency. Assume that the shunt capacitance between each insulator and earthed metal work of tower to be 1/10 of the capacitance of the insulator.
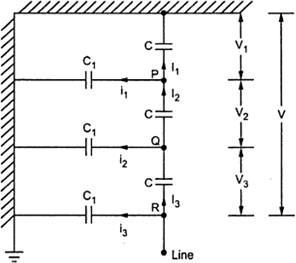
The string network arrangement is shown as below:
Similarly applying Kirchhoff’s Current Law at node Q, ��3 = ��2 + ��2 ….. (3)
Note that the voltage across the shunt capacitance ��1 carrying current ��2 is ��1 + ��2.
2��������3= 2������1(��1 + ��2)+ 2��������2 ����3= ��1(��1 + ��2)+ ����1(1 + ��)
Substituting equation (2) where ��2= ��1(1 + ��),
����3= ��1[��1 + (1 + ��)��1]+ ����1(1 + ��)
Using �� = ��1 , ∴ �� = ����,��
1
����3= ������1(2 + ��)+ ����1(1 + ��) ����3= ����1(2�� + ��2 + 1 + ��) ∴ ��3= ��1(��2 + 3�� + 1) (4)
While �� = ��1 + ��2 + ��3 …… (5)
Now ��3 is voltage across line unit which is closest to the line conductor,given as 20kV.
From equation (4); ��3= ��1(��2 + 3�� + 1) 20 �� 103= ��1 [(0.12 + 3(0.1) + 1] ���� = ���� ��������
From equation (2); ��2= ��1(1 + ��) ��2=15.2671(1 + 0.1) ���� ����=���� ���� ����
Total voltage from line to neutral voltage (phase voltage) is; �� = ��1 + ��2 + ��3 �� = 15.27�� + 16.79�� + 20��) �� �� = ���� ��������
String efficiency =
String efficiency =
�� �������� x 100 �� �������� x 100
String efficiency = 52.06���� 3 �� 20���� x 100
String efficiency = ����. ������%
A three phase overhead transmission line is supported by three discs insulators.The voltage across the top unit is 8.5kV while voltage across the middle unit is 10kV. Calculate; 1.17.1.1 Ratio of shunt capacitance to shunt capacitance 1.17.1.2 String efficiency 1.17.1.3 Line voltage.
Now ��1 = 8.5���� and ��2 = 10����.
From equation (1); ��2= ��1(1 + ��) 10�� 103=8.5�� 103(1 + ��) ��=�� ��������
ii. String efficiency = �� �������� x 100 �� = ��1 + ��2 + ��3
From equation (2); ��3= ��1(��2 + 3�� + 1) ��3= 10�� 103(0.17642 + 3(0.1764) + 1) ��3= 13.2626���� �� = ��1 + ��2 + ��3 = 10�� + 8.5�� + 13.2626�� = 31.76���� �� 31.76���� String efficiency = �������� x 100 = 3 �� 13.2626���� x 100 = 79.83%
iii. Line voltage.
Line voltage = √3 x Phase voltage ���� = √3�� 31.76���� ���� = ���� ��������