Mertins-Kirkwood & Hulse - Heads in the Sands (2024) PDF
HEADS IN THE SANDS
Understanding the social and economic risks of declining global demand for Alberta oil
MERTINS-KIRKWOOD & MATT HULSE
NOVEMBER 2024
HADRIAN
The Canadian Centre for Policy Alternatives is an independent, non-partisan research institute concerned with issues of social, economic and environmental justice.
Ecojustice is Canada’s leading charitable organization dedicated to using the law to defend Canadians’ right to a healthy environment.
About the authors
Hadrian Mertins-Kirkwood is a senior researcher with the Canadian Centre for Policy Alternatives. His work focuses on the social and economic dimensions of Canada's shift toward a net-zero economy, including the necessity of a just transition for vulnerable workers and communities across the country.
Matt Hulse is a lawyer at Ecojustice. His work involves litigation and law reform to address climate change, protect nature and fight for healthy communities.
Acknowledgements
Thank you to Ricardo Acuña, Kg Banjoko, Mitchel Bowers, Marc Lee and Julia Levin who provided invaluable feedback on earlier versions of this report.
The opinions and recommendations in this report, and any errors, are those of the authors, and do not necessarily reflect the views of the funders or reviewers of this report.
This report is available free of charge at www.policyalternatives.ca
Executive summary
This paper explores the potential social and economic consequences of a large-scale decline in oil sands production due to collapsing demand for Canadian oil exports. If global commitments to achieve net-zero emissions are realized, there will be significant and wide-ranging consequences for workers, communities and governments in Canada.
As unlikely as this scenario may first appear, it is both economically plausible and environmentally necessary and thus needs to be considered seriously. Canadian governments and the oil industry are focused on reducing upstream emissions from oil production, but they are not preparing for a world that no longer wants our oil.
The starting point for this paper is the finding of the Canada Energy Regulator (CER) that, in a global net-zero scenario, oil sands production could fall by 83 per cent by 2050. This report presents the results of a new economic model designed to expand on the CER’s findings. Our model considers how changes in oil production would play out at the level of individual oil sands projects, including for jobs, public revenues and environmental liabilities.
Our modelling exercise finds that collapsing global demand will force two dozen oil sands projects to shutter prematurely over the next few decades, with only a handful surviving to 2050 and at well below their maximum productive capacity. This involuntary wind-down of the sector will have dramatic effects, including:
• A decline in total revenues generated by the oil sands from more than $100 billion in 2023 to just $5 billion in 2050.
• A consequent collapse in public revenues collected from the oil sands through royalties and taxes from around $20 billion today to near-zero by mid-century.
• A drop in total employment connected to oil sands construction and production from roughly 100,000 workers today to around 5,000 by 2050.
• Stranded assets of nearly $70 billion from projects that shut down before paying off their debts.
• Unfunded environmental cleanup costs of at least $50 billion.
These enormous costs are primarily the consequences of a decline in global demand, not the imposition of domestic climate policies. Although the political debate in Canada tends to focus on government policy as the key driver of oil production, the reality is that international markets play a far more determinative role. No political party or government in Canada can save the oil sands from collapse if the rest of the world stops buying Canadian oil.
The main silver lining in this analysis is that the premature shut down and ensuing cleanup of oil sands projects could create significant benefits that offset some of the costs. Reduced oil sands extraction will immediately reduce greenhouse gas emissions, air pollution and freshwater use, resulting in widespread benefits for human health, ecosystem integrity and climate change. Reclaiming the oil sands would contribute to the restoration of the rights of Indigenous Peoples, upon whose lands the oil sands are situated. In addition, our model finds that a comprehensive cleanup program could create 15,000 jobs in environmental reclamation services by mid-century.
These new jobs will only be created if enough money is set aside for cleanup costs, which the current environmental liabilities regime is not set up to do. However, our model finds that the oil sands are expected to generate more than $200 billion in profits and $100 billion in provincial royalties between now and 2050—even in a global net-zero scenario— which suggests enough money could be made available for cleanup costs through changes to the regulatory regime.
In the context of the broader Canadian economy, the loss of jobs and revenues presented here are stark but not existential. The same cannot be said for the communities in Alberta that are deeply invested in oil sands production. For the workers, communities and governments who are most vulnerable, this paper offers three key lessons:
1. The stakes of an unmanaged decline in oil sands production are sky-high. Too many jobs and too much public revenue is at risk for this scenario to not be considered seriously. Proactive transition plans are necessary at the provincial, regional and community levels.
2. There is a short runway to prepare for decline. The oil sands will not shut down overnight, even in a net-zero scenario, but the costs of decline will be felt sharply within the next decade, which means transition and diversification efforts must begin as soon as possible.
3. Not enough money is being set aside to cover cleanup costs. Environmental reclamation of shuttered oil sands projects offers widespread benefits, but only if oil producers can be made to pay for it before their projects start losing money.
The modelling exercise presented in this paper is neither a prediction nor a recommendation. It is a warning—an illustration of a plausible future where the rest of the world follows through on their pledged climate commitments and the Canadian oil sands fail to proactively diversify away fossil fuel production. It is a future where the global community does what it must to address the climate crisis. It is a scenario that Canadian workers, communities and governments might be reluctant to entertain, but should prepare for nonetheless.
Introduction
The accelerating climate crisis is a product primarily of the combustion of fossil fuels, such as coal, oil and gas.1 Reducing greenhouse gas emissions to avoid the worst effects of climate change requires a rapid and drastic decline in the production and consumption of those fuels.
For a global economy that consumes 100 million barrels of oil every day, decarbonization is an inconvenient necessity. Nevertheless, governments around the world are slowly moving to tackle fossil fuel use in their economy.2 While progress has been insufficient to date, 149 countries representing 88 per cent of global emissions have committed to achieve net-zero emissions in the coming decades.3 The process of replacing coal, oil and gas with clean, renewable energy will have enormous benefits, not only for the climate and the environment, but also for public health and economic development around the world. However, for economies that are deeply invested in the production of these fuels, the prospect of winding them down presents a very real economic threat.
Canada produced a record-high six million barrels of oil per day in 2023—primarily from bitumen extraction in the oil sands—which placed it among the top five producers in the world.4 The fossil fuel industry generates hundreds of billions of dollars for the Canadian economy and employs hundreds of thousands of people.5 Most of those benefits are highly concentrated in Alberta, Saskatchewan and Newfoundland and Labrador.
The oil and gas industry also comes with great costs. More than 30 per cent of national greenhouse gas emissions are caused by oil and gas extraction alone, and the oil sands in
northeastern Alberta are especially emissions intensive. The oil sands also have widespread negative impacts on Indigenous rights, the environment and public health.
Nevertheless, given the significant economic costs and logistical challenges associated with decarbonization, no Canadian government has seriously considered efforts to proactively wind down production. Despite Canada’s legislated commitment to achieve net-zero greenhouse gas emissions by 2050, current climate policies, such as the federal carbon pricing backstop, are not intended to drive a sustained decline in oil production levels. Indeed, as public investments in projects such as the Trans Mountain pipeline expansion illustrate, current policies assume the oil and gas sector will continue producing at current or even higher levels well into the future.
Canadian governments are attempting to square this circle—to achieve the dream of a net-zero, fossil fuelproducing economy—by banking on a fanciful scenario where Canadian oil is produced with no upstream emissions and then exported for combustion elsewhere. To that end, the federal government has established a favourable regulatory regime, backed by enormous public subsidies, to incentivize investments in carbon capture, utilization and storage (CCUS) technologies. It is a costly approach that is unlikely to be effective from a climate perspective, but this concerted commitment to CCUS has allowed industry and government alike to claim they are taking climate action in the oil sands seriously.6
Yet even if this dubious strategy were technically and financially viable, it assumes continued demand for Canadian oil abroad. Indeed, there is a persistent belief within industry and governments that Canada will be the last global oil producer standing.7 What industry and governments have failed to confront is the troubling possibility—made increasingly likely by the proliferation of net-zero commitments and tangible efforts to reduce fossil fuel use around the globe—that international demand for our oil will dry up much faster than anticipated.
This paper explores the potential social and economic consequences of such a decline, with a view to inform discussion between governments, communities, workers and industry in Canada about the need to prepare for this eventual reality. Understanding the risks of declining demand is critical for determining what action is necessary to diversify our economy and implement programs to support affected workers and communities.
Why focus on the oil sands?
This paper focuses mainly on the Alberta oil sands, rather than the broader conventional oil and natural gas industries. Although all fossil fuels are relevant from a climate perspective, we narrowed our scope for two reasons.
First, the oil sands are the highest-cost and most polluting source of oil in Canada. Consequently, they will be impacted first and most significantly by a decline in global demand driven by climate considerations. The decline of conventional oil and natural gas will follow different trajectories, with longer timelines.
Second, there are a limited number of operational oil sands projects, which made it possible for us to model them independently and comprehensively. In addition, all of those projects are in Alberta, which allowed us to use the province’s extensive data sources to build a more robust model. In contrast, there are thousands of conventional oil and gas wells spread across the country, with varying degrees of data quality, which makes modelling them more challenging.
Since the oil sands represent more than half of overall Canadian oil production—and the vast majority of that production is exported to the U.S. and other international markets—we believe that our model captures the most relevant and timely impacts for Canadian workers and communities of declining global oil demand.
The paper takes as its starting point the finding of the Canada Energy Regulator (CER) that, in a global net-zero scenario, production levels in the Canadian oil sands would decline by 83 per cent by 2050, in response to falling global demand.8 Regardless of how likely this scenario may initially appear, it is both economically plausible—as laid out by the CER—and environmentally necessary. Therefore, it needs to be considered seriously. Notably, the massive production decline described in this scenario occurs largely independent of domestic efforts to reduce emissions. In other words, Canadian oil producers are far more vulnerable to changes in global markets than they are to domestic climate policies, which is all the more reason to be prepared for it.
This report takes the CER’s finding several steps further by exploring what might happen to workers and communities in Alberta if production in the oil sands does, in fact, decline by 83 per cent by 2050. We developed an economic model that offers a detailed look at the potential impacts of the decline on workers, public and Indigenous revenues, environmental liabilities and other variables. The scenario we present is not a prediction, since it depends on a wide variety of assumptions (detailed in the appendix), but it offers a plausible illustration of how such a decline might unfold over the next few decades.
The main takeaway from this exercise is that governments in Canada cannot afford to wait to prepare for a drop in global oil demand. There is a very short runway where production in the oil sands and all of its associated benefits remain relatively stable before a potentially catastrophic collapse in the 2030s. If economic diversification and worker retraining efforts have not been scaled up by then, the ultimate bust of the oil sands could lead to economic and social destitution for an unconscionable number of workers and their communities.
The oil sands in a global net-zero scenario
The Canada Energy Regulator is a federal agency reporting to the Minister of Energy and Natural Resources and it is responsible for overseeing, reporting on and advising the Canadian energy industry. Among other publications, its periodic Energy Futures reports are a critical reference for industry and policy-makers regarding future energy supply and demand.
In 2023, for the first time, the CER’s Energy Futures report considered how supply and demand for Canadian energy would change in two net-zero scenarios: first, a “Canada netzero” scenario where domestic emissions fall to net-zero by 2050 but emissions in the rest of the world do not, and, second, a “global net-zero” scenario where the whole world decarbonizes by mid-century. The latter scenario assumes all countries follow through on net-zero commitments with new climate policies that go far beyond anything in place today. These forecasts are contrasted against a “current measures” scenario that assumes no new efforts to reduce emissions, domestically or internationally, beyond policies that are already in effect.
In the current measures scenario, oil sands production rises steadily to about 10 per cent above current levels by 2050. In the Canada net-zero scenario, production only falls 30 per cent by 2050, as domestic oil producers face modest production constraints but continue to export their products to unchanged international markets. Finally, as mentioned above, in the global net-zero scenario, oil sands production falls by 83 per
cent from current levels by 2050, as international demand dries up.
The large gap between the domestic and global net-zero scenarios highlights a glaring oversight in much of the current political debate surrounding Canadian energy policy. While domestic regulation, taxation and subsidy regimes do influence the level of oil production in Canada, they ultimately play a smaller role than global oil demand. In other words, even if Canadian governments did absolutely nothing to curb oil emissions or regulate oil production, the industry could still be decimated by international efforts to decarbonize. No domestic political party or government can save the oil sands in the long term, with CCUS or otherwise, if the rest of the world continues to get more serious about addressing climate change.
Before proceeding, it should be noted that the CER makes several highly optimistic assumptions about emission reduction technologies.9 In particular, the CER assumes all oil sands projects are proactively retrofitted with relatively low-cost carbon capture technologies that succeed in capturing 90 per cent of emissions from those projects. If CCUS costs do not come down from their current levels and/or the technology does not reach the promised level of efficacy, the CER notes that the oil sands would be forced into a nearly 100 per cent production decline by 2050. Given the fact that CCUS is unlikely to ever be cost competitive without massive public subsidies (even if the technology delivers on its promises), it is not implausible that in a net-zero scenario the oil sands would be completely non-viable within 25 years.10
With this context in mind, this report takes the CER’s estimate of an 83 per cent decline in oil sands production as its starting point. We make no particular claim about the likelihood of this scenario occurring. From the CER’s perspective, it is one extreme on a spectrum of possible oil production trajectories. However, a decline of this magnitude is plausible from an economic perspective and necessary from a climate change perspective. For both of these reasons, it is a scenario that workers, communities and governments need to take seriously.
Social, economic and environmental dimensions of the oil sands
To understand the potential impacts of an 83 per cent decline in oil sands production on workers and communities in Canada, we need a baseline. This project is primarily concerned with the jobs, public revenues and environmental impacts associated with the Alberta oil sands. Data sources and additional calculations for figures in this section are available in the appendix.
Jobs
Determining the specific number of workers in the oil sands is a challenging task. While direct employment by oil companies is well reported, it is not so clear which workers in adjacent sectors of the economy should be included. To make matters more complicated, most published labour statistics do not disaggregate between conventional and unconventional oil workers. Any claim of the total number of jobs will therefore be, at best, an estimate.
Our model combines data from various sources to arrive at an estimate of approximately 100,000 workers working directly and indirectly in the oil sands (see Table 1), which accounts for about 0.5 per cent of total national employment and three per cent of jobs in Alberta. The roughly 27,000 direct jobs in
extraction make up a minority of the oil sands workforce. A comparable number of people work in indirect support activities, such as bitumen upgrading and pipeline transportation, that are clearly dependent on continued oil sands production.
We also include construction workers in our total. Although the construction industry is theoretically agnostic about reduced demand for oil infrastructure—those workers could keep their jobs building green infrastructure instead—in practice, many construction workers live around and depend on oil sands projects for their livelihood. As we shall see, construction workers are at the greatest immediate risk from declining oil demand because one of the first consequences is a reduction in project expansions.
The oil workforce is overwhelmingly white and male.11 Only 20 per cent of workers in the oil industry are women compared to 48 per cent among the general workforce. Only 14 per cent of oil sands workers are non-white compared to 26 per cent across the rest of the economy. Indigenous workers, however, are overrepresented in the industry. The approximately 7,000 Indigenous workers in the oil sands alone account for about one per cent of all Indigenous workers in Canada and close to seven per cent of Indigenous workers in Alberta, which is twice the rate of non-Indigenous workers.
Generally speaking, oil workers are exceptionally well paid. Average employment income in direct oil jobs was $140,000 per year in 2021.12 Average total compensation (i.e., inclusive of benefits) in the oil sands was over $200,000 in 2023.13
Table 1: Breakdown of estimated employment in the Canadian oil sands
Source: Authors’ calculations based on Statistics Canada data. See appendix for details.
Compensation in indirect oil jobs is lower, but still well above the average of all industries. However, there are large racial and gender gaps. Women in the oil industry are paid 26 per cent less than men, on average, and racialized workers are paid 10 per cent less than white workers, on average.
An important dimension of the oil workforce is its transience. There is a gap between the number of oil sands jobs reported by employers and the number of oil sands workers that are self-reported in population censuses. For example, while 91 per cent of oil jobs are in Alberta, only 79 per cent of oil workers report living there. Moreover, while nearly all oil sands infrastructure is in northern Alberta, the majority of oil sands workers report living in Calgary and Edmonton. These discrepancies reflect seasonal work and fly-in-fly-out arrangements, both within the province and within the country. They also capture the sizable amount of head office work connected to the industry.
Finally, these figures only capture work connected to the oil sands industry itself, but many more jobs in oil communities— referred to as “induced” jobs—depend on the income of oil sands workers. As we discuss further below, when an oil worker loses their job, that has knock-on effects for others in their community, especially lower-wage service workers, who are more likely to be women, racialized, immigrants or otherwise marginalized.14
Public and Indigenous revenues
As with the number of jobs, it is often difficult to disaggregate the taxes and royalty payments associated with oil sands projects from other parts of the fossil fuel industry. The figures also vary wildly from year to year depending on the price of oil, so we use multi-year averages to arrive at our baseline. Based on corporate filings and government reports, we estimate that the oil sands are currently responsible for around $17 billion per year in provincial royalty payments. In addition, oil sands projects pay about $1 billion in provincial taxes and $3.5 billion in federal taxes each year. For Alberta, these payments account for about a fifth of provincial revenues.
Although it is beyond the scope of our model, it should be noted that wages paid to oil workers generate substantial public revenues as well. An oil worker earning $150,000 per year will pay around $27,000 in federal income taxes and $12,000 in provincial income taxes, so the cumulative income tax
contribution of workers in the oil sands is in the billions of dollars.
The land that the oil sands sit on are the traditional homelands of various First Nations and Métis Nations. Oil companies often pay fees or make in-kind contributions to these groups (e.g., by building new public infrastructure such as parks and roads). However, the amounts are generally insignificant. We estimate that the payments made to Indigenous groups in Alberta specifically associated with oil sands projects amount to just $77 million per year. That sum is distributed among 30 to 40 First Nations and Métis Nations— there is some year-to-year variation in the recipients—with around a dozen receiving $1 million or more each year.
To put all of these numbers in context, we estimate that the oil sands generate more than $100 billion per year in gross revenues and upwards of $30 billion in profits per year. Again, there is significant year-to-year variation depending on the price of oil, but these figures assume a business-as-usual scenario and serve as our baseline.
Environmental liabilities
In 2022, greenhouse gas emissions from the Canadian oil and gas industry amounted to 217 megatonnes, which accounted for 31 per cent of the national total.15 Oil sands extraction specifically accounted for 87 megatonnes, or 12 per cent of all emissions in Canada. The oil sands are particularly emissions intensive, which is to say they produce more greenhouse gas emissions per barrel than many other fossil fuels.16 However, there is significant variation within the oil sands. Some older projects, such as the sprawling Syncrude facility, produce far more emissions per barrel than some newer projects, such as Suncor’s Fort Hills mine.
Besides their emissions, oil sands projects are enormously destructive to the environment. The damage these projects cause to ecosystems and waterways has been welldocumented.17 While the value of the natural world cannot be reduced to a dollar figure, for the purposes of our model, we can quantify these impacts using the framing of environmental liabilities.
Alberta’s Mine Financial Security Program (MFSP) requires oil sands mine operators to track and report on the costs of cleaning up their projects after they wind down (i.e., liability). The MFSP also requires operators to set aside money to cover
these cleanup costs (i.e., security). However, the amounts collected by Alberta to date fall well short of what is needed. MFSP filings indicate a liability of $47.3 billion with only $1.7 billion in securities held.18 Moreover, the MFSP underestimates the total liability because it only includes open-pit mines. In situ oil sands projects, which involve pumping oil from deep underground, are relatively less destructive than mines but still have cleanup costs. We estimate that there are approximately $4.8 billion in outstanding environmental liabilities associated with in situ projects, which means the total oil sands liability is closer to $52 billion. Shockingly, this estimate is likely optimistic. Leaked reports from within the Alberta Energy Regulator suggest that oil sands liabilities could be as high as $130 billion.19
Whatever the exact figure, it is clear that reclaiming the oil sands to a state that is both ecologically sound and acceptable to local Indigenous communities will be enormously costly and, to date, not nearly enough money has been set aside for it. A key issue is that operators are typically only required to start paying into liabilities funds as their projects are approaching their planned end dates. If a project shuts down prematurely, then no money will have been set aside and the mess is left for governments to clean up. This is an especially acute risk in the context of declining global demand that would force many projects offline well before the planned wind-down period.
An economic model of the oil sands
To understand the possible impacts of an 83 per cent decline in oil sands production, we built an economic model of every oil sands project and its associated economic, social and environmental impacts. Like all economic models, it represents an abstraction of the real world today and makes assumptions about how the world will change in the future. A full explanation of our methodology, including data sources and key assumptions, is available in the appendix.
In brief, the model starts with a picture of the oil sands in 2023. For each following year, the model figures out how changes in total oil production levels—consistent with the CER model—would play out at the individual project level. All of those results then become the baseline for the next year in the model. This iterative process is repeated through the year 2050.
Table 2 provides a summary of the projects in our model and some of their baseline variables. Note that the 32 projects we have identified are somewhat arbitrary. For example, some entries combine multiple related projects, which is usually due to the availability of data. Furthermore, while the figures in this table represent our 2023 baseline, they do not necessarily reflect accurate historical values for that year. To smooth out year-to-year variations, we have used multi-year averages in some places. In other situations, we make inferences from historical data sources to give us a plausible baseline.
Our model also includes estimates for the jobs, public revenues and environmental liabilities associated with each project. In each of these cases, we have taken the estimated total
Table 2: Summary of oil sands projects and key model variables
Source: Authors’ calculations based on public and industry data sources. See appendix for details.
values for the industry as a whole and distributed them among projects based on other known variables, such as production levels and capital expenditures.
With those caveats in mind, we used our model variables to generate a reference scenario that assumes indefinite demand for Canadian oil. Projects continue to increase production up to their planned capacity and then start to wind down toward their planned end dates (most of which are in the 2050s and 2060s). In this scenario, production peaks in the mid 2030s but remains near current levels in 2050.
With the reference case in place, we developed a scenario in which oil production declines in a manner consistent with the CER’s global net-zero scenario. We distributed foregone production (i.e., the difference between the reference case and the net-zero case) between projects based on their cost of production and their emissions intensity. In other words, if demand shrinks in part due to global climate policies (i.e., there is an explicit or implicit price on carbon), we assume the facilities that produce lower emission oil at a lower cost will be more competitive. If, as a result of falling demand, a project’s foregone production exceeds its baseline production, we consider the project no longer viable and it is shut down. The resulting pathway for Canadian oil sands production is relatively flat until the end of this decade, before declining sharply in the 2030s.
Once we had an estimate for a project’s production levels in a given year, we inferred how the number of jobs and the value of public payments might change. For jobs, we modelled direct, indirect and construction jobs separately. The first two categories are determined mainly by production levels and the latter category is determined mainly by the capital expenditures associated with each project. We also calculated an estimate of the number of jobs created by the reclamation of shuttered oil sands projects.
Public payments were calculated based on net revenues for each project and the relevant tax and royalty regimes. The Alberta royalty formula, for example, accounts for the price of oil and the outstanding debt on each project. Environmental liabilities are mostly static in our model but are assumed to increase if a project expands production above current levels.
While the model operates on a project-by-project level, the results presented below generally focus on the oil sands as a collective. There are simply too many variables to draw conclusions about any specific project with confidence. We do not know, for example, how many operators will actually invest
in CCUS, which could theoretically make their projects more competitive than they are now. We also cannot say with confidence how many workers are connected to individual projects and how those figures would change over time. Consequently, the aggregate results paint a more robust picture of a possible future for affected workers and communities.
Similarly, we tend to use approximate or rounded figures when presenting results. We do not want to offer a false sense of precision when the specific values produced by the model are sensitive to so many variables.
Model results
This section presents key outputs from our oil sands model in a global net-zero scenario. To be clear, these results are not a prediction. We do not know precisely how the global oil market will evolve or how domestic oil producers and policy-makers will respond. Instead, these results illustrate one possible scenario wherein global oil demand falls due to decarbonization efforts and the Canadian oil sands are forced to prematurely reduce production levels.
Oil production and project shutdowns
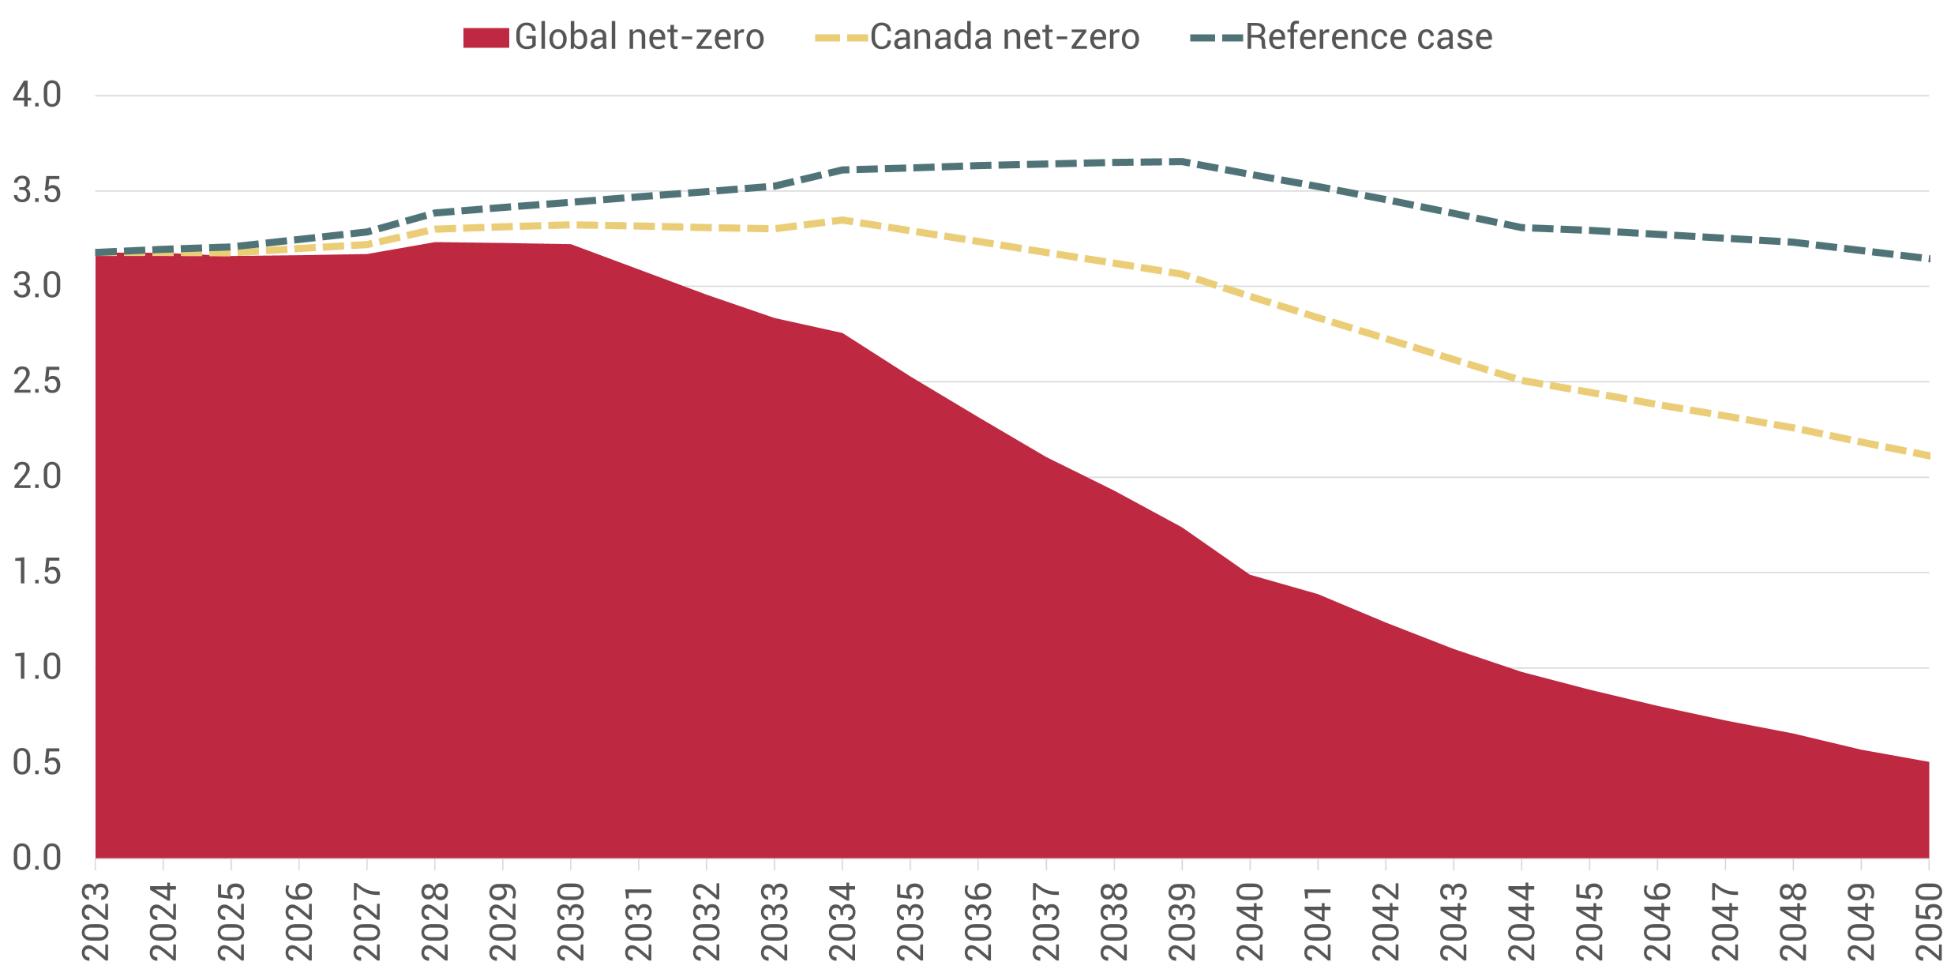
In our scenario, oil production remains relatively flat at around 3.2 million barrels per day (bbl/d) until 2030 and then begins falling precipitously until production levels reach around 500,000 bbl/d in 2050—a total decline of 83 per cent (see Figure 1). For context, the chart also includes the oil production trajectory in the reference case and in the CER’s Canada netzero scenario.
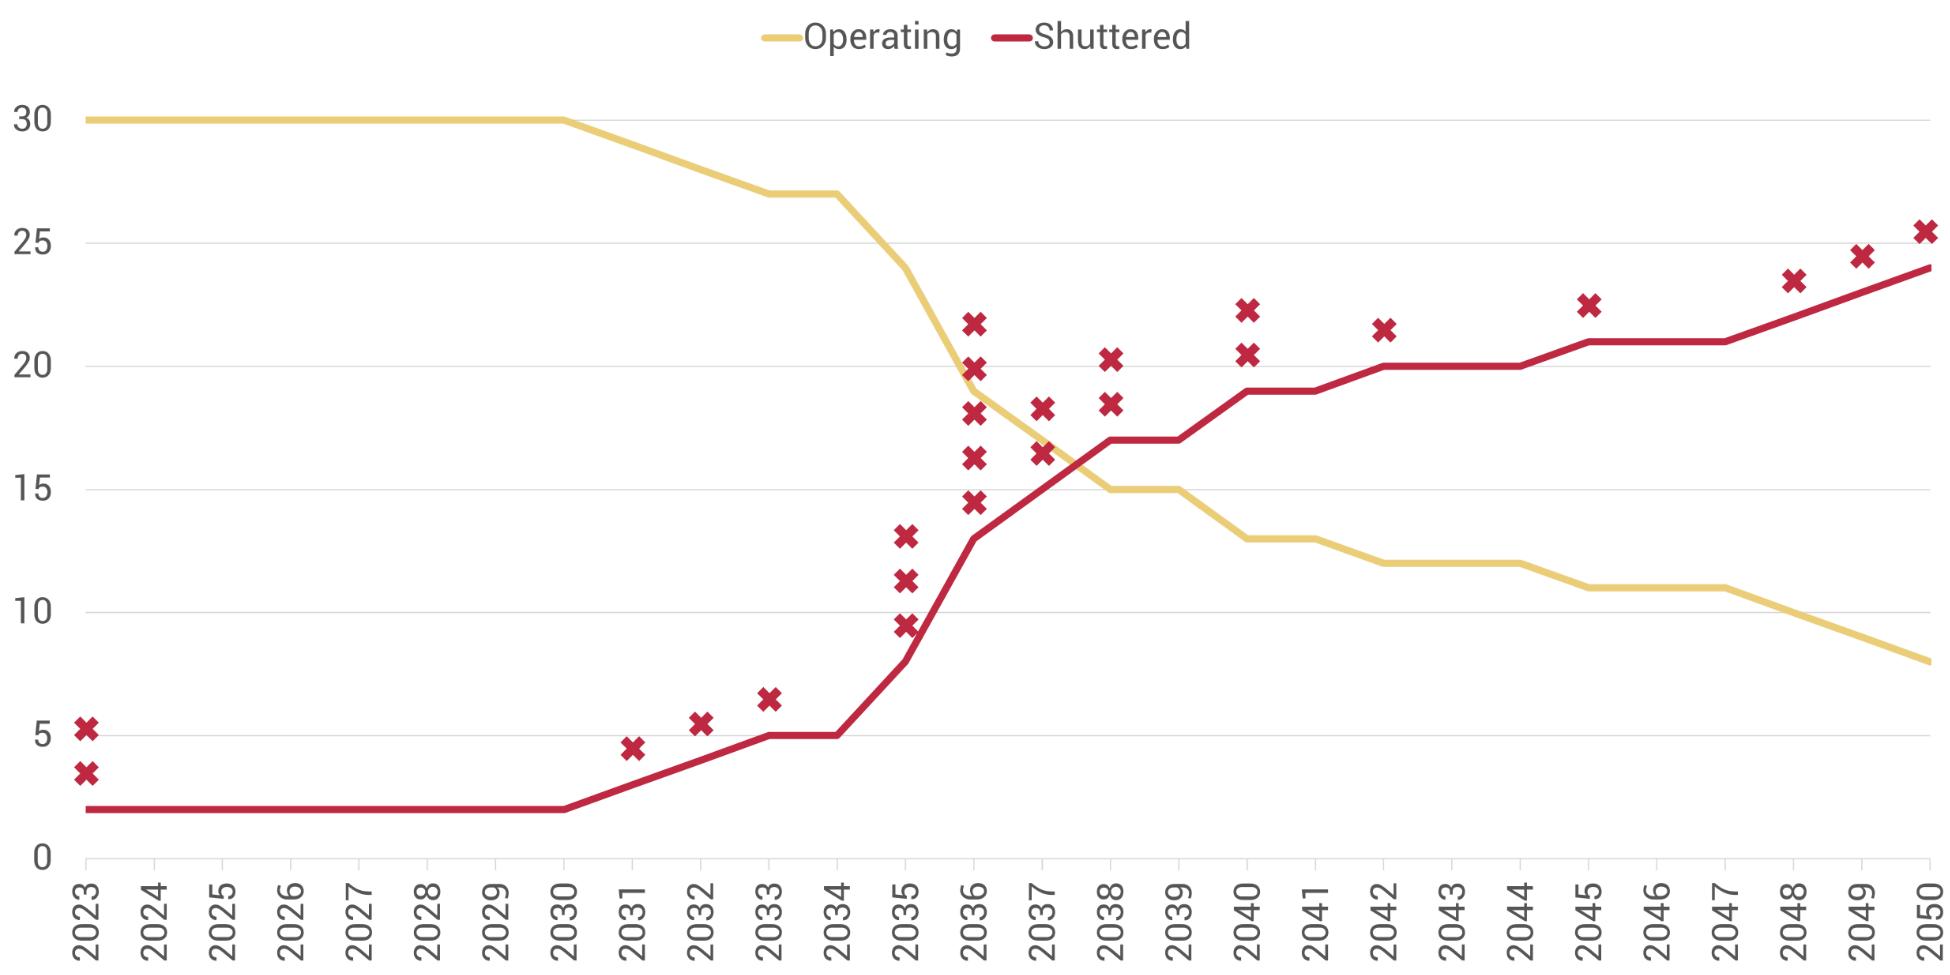
Given the lack of long-term demand in this scenario, two projects that are currently in the development stage do not proceed. There is simply not enough of a runway for these projects to get built and recoup their costs before shutting down. After that, there is a period of relative calm before demand declines significantly in the 2030s and the dominoes start to fall (see Figure 2). The model anticipates 15 projects shutting down over the course of the 2030s as they are squeezed out by lower cost, lower emitting producers. Another seven projects wind down in the 2040s. Many of these projects become stranded assets that never recoup their investment
Millions of barrels per day
Source: Authors’ calculations. See appendix for details.
Figure 2: Operating status of oil sands projects, global net-zero scenario
Total number of projects
Source: Authors’ calculations. See appendix for details.
Figure 1: Oil sands production by scenario
costs. By 2050, there are almost $70 billion in unrecovered losses associated with shuttered projects.
Only eight projects in our model are still operating after the world achieves net-zero in 2050. That assumes—consistent with the CER model—that they ultimately manage to capture the majority of upstream production emissions. If carbon capture technologies do not prove to be technically or commercially viable, then no projects survive to 2050.
In the CER model, the survivors are primarily major openpit mining operations that tend to have the lowest operating emissions. However, it is not clear how the CER accounts for emissions from bitumen upgrading. Our model includes those emissions and finds that a handful of low-cost, in situ projects manage to outlast the competition. Either way, any project that does make it to 2050 limps across the finish line, producing at well below its maximum capacity.
Job loss and job creation
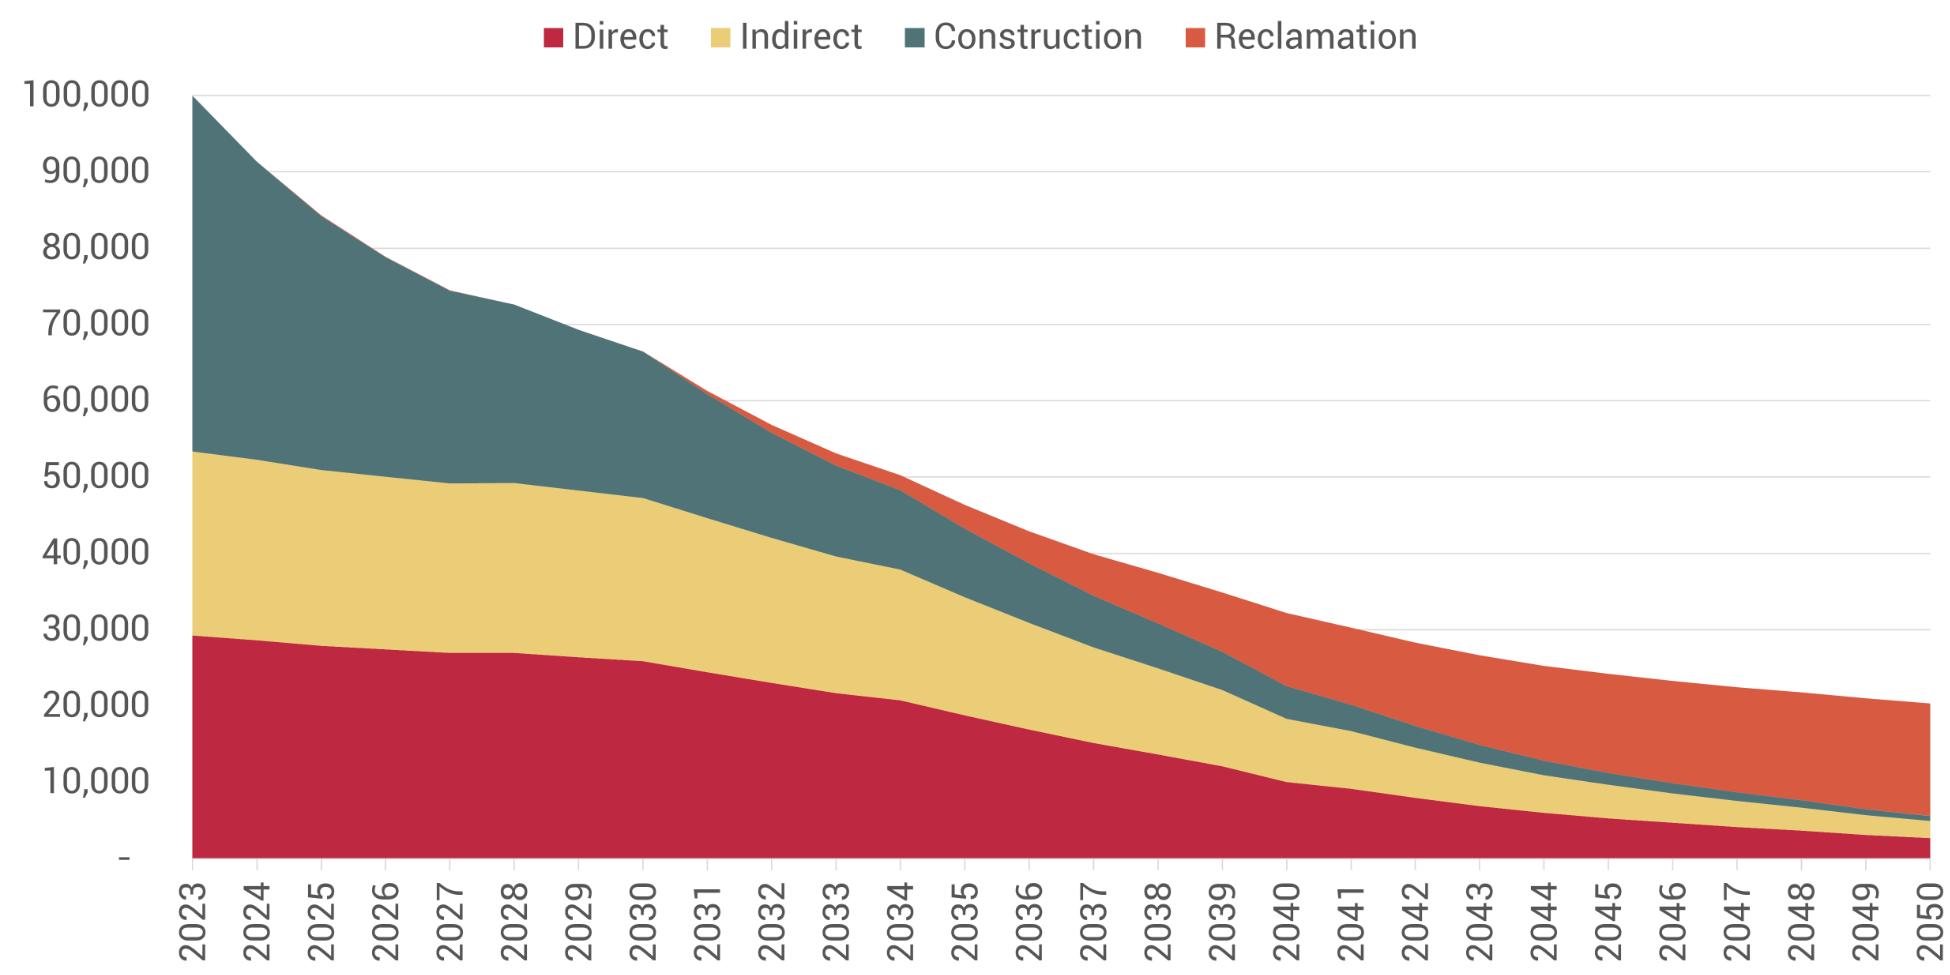
At first glance, the outlook for oil sands jobs is predictably dour. Because new oil sands projects are not being built and old ones are not being expanded, construction jobs are cut in half within a decade and fall to less than a thousand by 2050 (see Figure 3). Direct and indirect extraction jobs decline more slowly, but still fall from a total of 53,000 in 2023 to fewer than 5,000 by midcentury.
Notably, independent of production declines, oil workers are at risk of employers’ efforts to automate the workforce. Our model assumes that oil sands automation alone will reduce employment by 30 per cent by 2040, although some estimates suggest the impact could be twice as large.20 By 2050, the number of jobs in the oil sands could be cut in half due to automation, even before the impacts of a decline in production are considered.
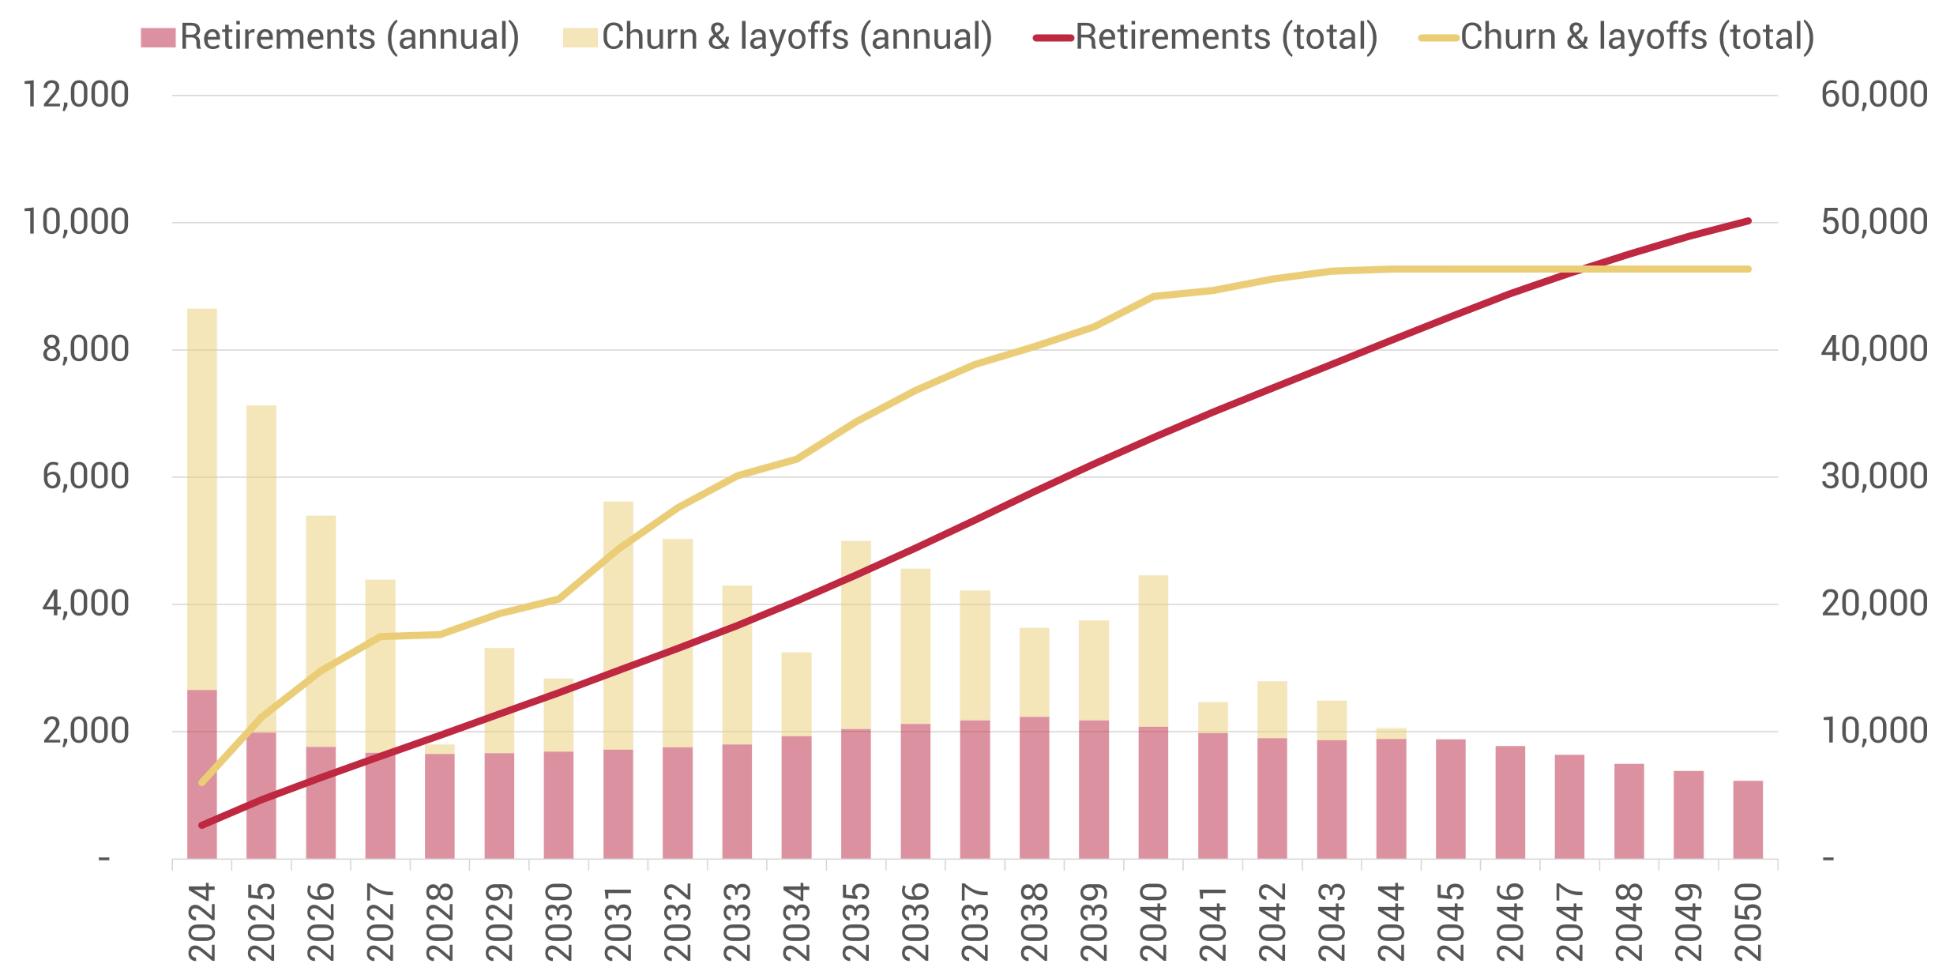
One silver lining is that the net loss of more than 90,000 jobs in the 2023-2050 period does not necessarily mean that all of those workers lose their jobs against their will. Since the wind-down period takes multiple decades, many workers over the age of 40 might simply keep their job until retirement age. Our model finds that more than half of job losses in the oil sands in a net-zero scenario could theoretically be absorbed through retirements (see Figure 4). The remainder would be lost to layoffs and regular job churn (i.e., people quitting of their own volition), most of which would occur in the
Figure 3: Jobs supported by oil sands projects, global net-zero scenario
Total number of jobs
Source: Authors’ calculations. See appendix for details.
4: Composition of oil sands job losses, global net-zero scenario
Net change in number of jobs by category of change, annual (left axis) and total (right axis)
Source: Authors’ calculations. See appendix for details.
Figure
construction sector. The net effect for our model is that only 2,000-3,000 jobs would be truly “lost” each year, on average. In practice, of course, the transition is unlikely to be so smooth. Workers will not always retire at the right time and some will be replaced with new hires who are then later laid off. However, these findings illustrate the potential for mitigating job loss through thoughtful transition plans that consider worker age and discourage new hires.
A second potential silver lining in all of these shutdowns is the ensuing boom in environmental reclamation jobs (see Figure 3). Cleaning up old oil sands sites and restoring the ecological and cultural function of the land is a long and labour-intensive process that could create new jobs in precisely the communities that need them most. In our model, these jobs start to take off in the 2030s and by 2050 there are approximately 15,000 people working in the sector. Funding this work, however, depends on enough money being set aside in advance. As discussed above, Alberta’s current regulations do not require operators to pay into liabilities funds until their projects approach their planned end dates. For most of the oil sands, that is well beyond 2050. As these projects go prematurely offline in a global net-zero scenario, they leave behind billions of dollars in unfunded environmental liabilities. These potential reclamation jobs will never be created if there is not a concerted regulatory and/or fiscal effort to provide for them.
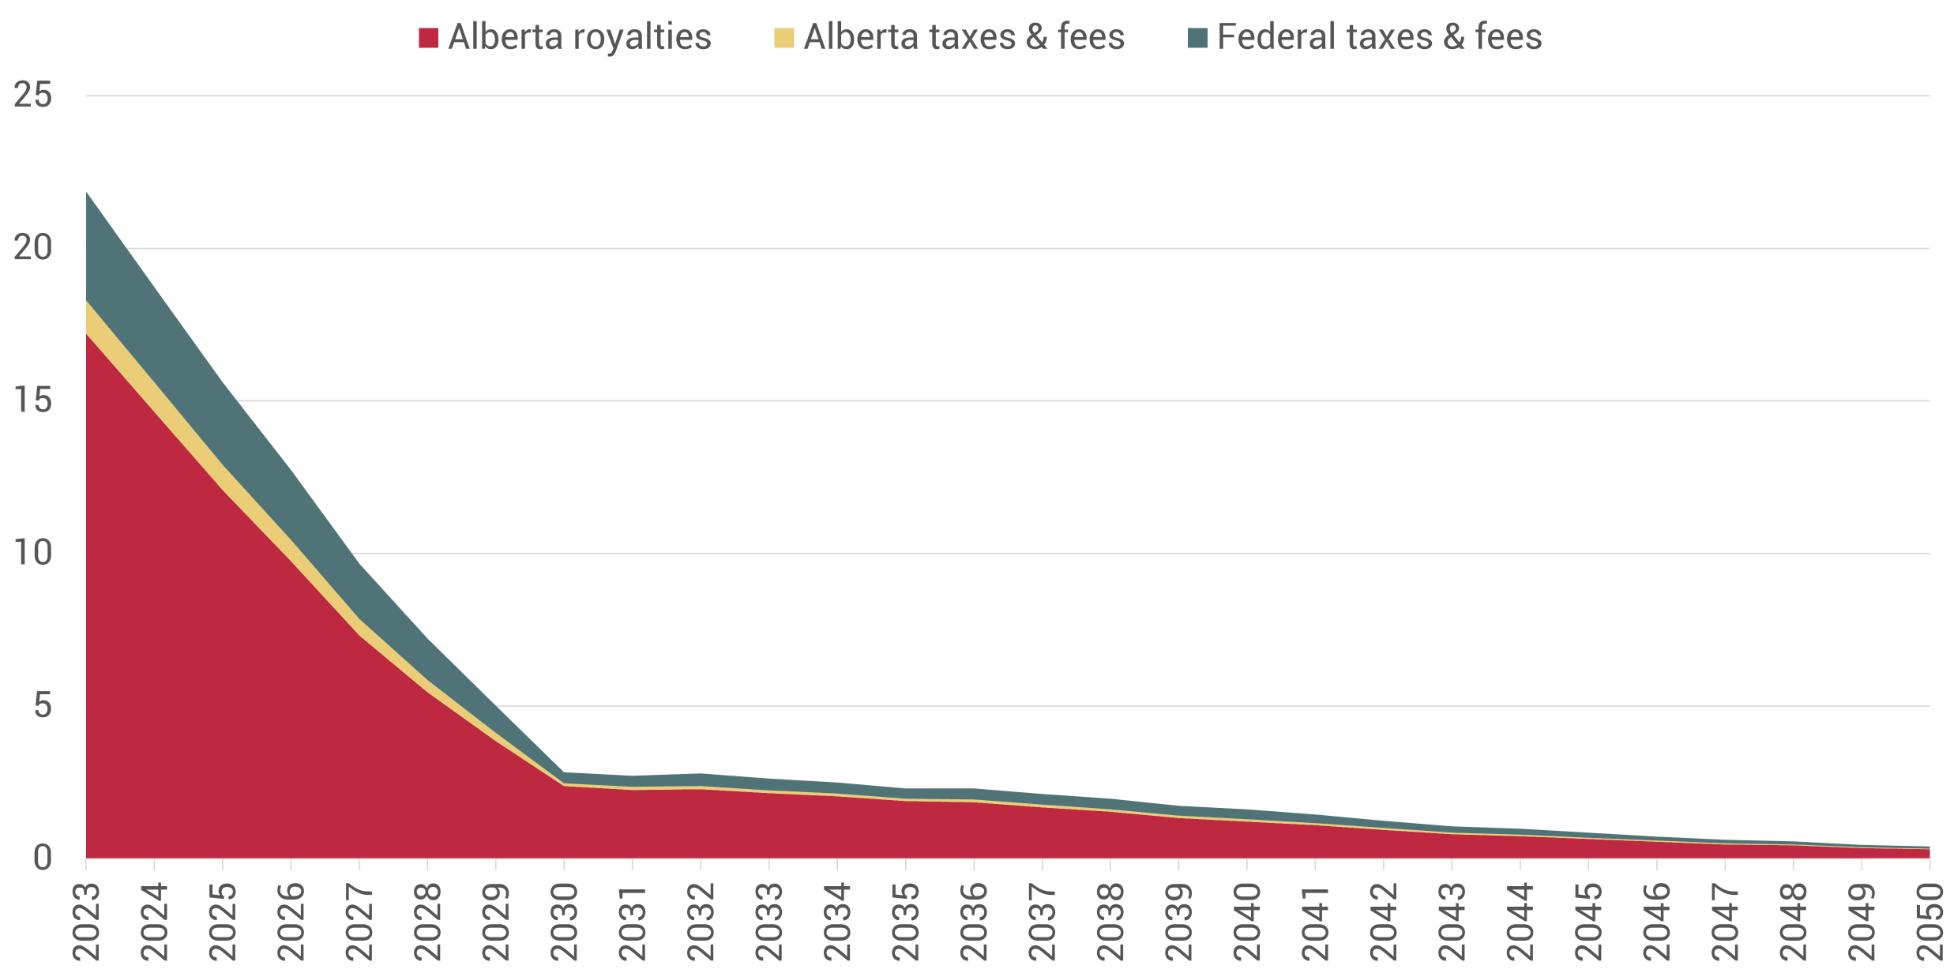
Revenues and public payments
Revenues generated by the oil sands fall dramatically as production declines in our model. Not only are fewer barrels of oil sold over time, but the barrels are worth less with each passing year. In the model, total annual revenues for the industry fall from over $110 billion today to $50 billion in 2030 and just $5 billion in 2050. Active projects still make a profit or they wouldn’t be operating, but total annual profits for the sector—after accounting for operating expenses, capital expenses, outstanding debts, royalties and taxes—fall from around $28 billion today to $7 billion in 2030, to around $1 billion in 2050.
As a result, the royalties, taxes and fees paid to governments and Indigenous groups fall dramatically as well (see Figure 5). In the model, royalty payments fall from around $17 billion today to less than $3 billion by 2030. Federal and provincial taxes and fees fall from a total of almost $5 billion to less than a
Billions of dollars
Source: Authors’ calculations. See appendix for details.
billion dollars in the same time frame. By 2050, public revenues generated by the oil sands in a global net-zero scenario approach zero. In addition, as noted above, these losses will be compounded by falling income and sales tax revenues collected from oil workers.
Fees paid to First Nations and Métis Nations in the model stay relatively flat, at around $77 million per year until 2030, before falling to $32 million by 2040 and then to under $3 million by 2050—a more than 90 per cent decline overall. The amounts paid to Indigenous communities are so small that they would not even be visible on Figure 5. The details in these agreements are rarely public, so we cannot say with certainty if fee contracts will be honoured even if projects are shut down, but eventually these payments will dry up. Perhaps more importantly, Indigenous communities will lose all of the spinoff benefits associated with oil sands extraction, such as job creation and indirect local economic development.
Figure 5: Public revenues generated by oil sands projects, global net-zero scenario
Discussion
The decline of oil sands production in the CER’s global netzero scenario will not be smooth or evenly distributed. In our model, major projects start to fall like dominoes in the 2030s and by mid-century fewer than 10 projects are still operating— and at well-below their maximum productive capacity. The shuttering of projects in response to external price shocks will trigger rounds of layoffs and sudden drops in taxes, royalties and other public payments. Workers, communities and governments will experience far more volatility than the smooth lines in the preceding charts suggest.
Our model finds a net loss of more than 90,000 oil jobs in this scenario. Half of those jobs are lost to automation that is independent of changes in global oil demand. At least half of the jobs lost could be absorbed through retirements rather than layoffs. Based on our model, only 2,000-3,000 jobs are lost involuntarily per year, on average, between now and 2050, which would hardly be catastrophic in itself. As previous research in this area has found, from the perspective of the broader Canadian economy, those workers can realistically be transitioned to new jobs.21
However, oil sands jobs are highly concentrated in specific Albertan communities. In Fort McMurray, for example, the oil industry accounts for a third of direct employment. The cities of Grande Prairie, Lloydminster, Okotoks and Strathmore are also highly dependent on oil jobs, not to mention countless rural communities situated near specific projects. A decline in oil jobs in these communities—even if modest in terms of the broader Canadian economy—will have significant local and regional impacts. Oil jobs indirectly support many other jobs in their communities, from nurses to mechanics to food service workers. In the absence of a proactive transition plan, a sudden decline in oil sands production will have more widespread impacts on workers and households than the numbers in our model might suggest.
Oil sands projects produce significant public revenues that will also dry up as production declines. While a decline in taxes paid to the federal government—a loss of $3.5 billion per year by 2050—is relatively immaterial, the same cannot be said for provincial revenues. Our model finds that taxes and royalties paid to Alberta could fall from a total of about $18 billion in 2023 to only a few hundred million dollars in 2050, which represents a nearly 20 per cent hit to the provincial budget. Indeed, net taxes could even turn negative, as both the federal
and provincial governments have a history of offering favourable tax treatment to oil producers during downturns.
First Nations and Métis Nations, many of whom benefit, to some extent, economically from oil sands development, will bear the brunt of both job losses and falling revenues, though the specifics vary by community.
If this seems like a fate Alberta would do well to avoid, it is crucial to remember the primary driver of decline in our model is not any choice made by governments in Canada. Instead, our model assumes a world that gets serious about the net-zero pledges that most countries have made and that the dirtiest fuels lose market share the fastest. Moreover, even if production levels remain at current levels, half of current jobs could be lost to automation by mid-century. These are forces very much outside Alberta and Canada’s control.
There are some important silver linings in this analysis. In addition to lower domestic greenhouse gas emissions, declining oil sands production means Canada would be responsible for fewer downstream emissions from oil being burned elsewhere.22 Declining production from the oil sands will also have immediate environmental and health benefits in the Lower Athabasca region, including reductions in fresh water use, air and water pollution, habitat destruction and tailings waste production—costs currently borne disproportionately by the Indigenous communities whose traditional territories are the sites of oil sands development.
Cleaning up shuttered oil sands projects and reclaiming the land to a state that is ecologically functional and acceptable to local Indigenous communities could also create many new jobs to replace a portion of the jobs that are lost. Our model finds that a comprehensive reclamation program could create 15,000 net new jobs by 2050. That figure could be two or three times higher depending on the ultimate cost of cleaning up these projects.
Very little money has been set aside to cover the estimated $52-130 billion cost of oil sands reclamation to date, but regulatory and/or fiscal changes could make up the gap. Even in a global net-zero scenario, our model finds that the oil sands will generate a cumulative $1 trillion in total revenues between now and 2050, of which roughly $100 billion will be paid in provincial royalties and more than $200 billion will be pocketed by the industry as profits. Capturing a portion of that economic value could ensure that workers and communities aren’t left to clean up a catastrophic, unfunded mess on their own.
Conclusion
We developed an economic model to try to better understand the potential social and economic impacts of an 83 per cent decline in oil sands production driven mainly by declining global demand. Our model presents one possible scenario for how that decline could manifest in the Alberta oil sands. It is neither a prediction nor a recommendation, but rather a warning of what may come to pass should the global community do what it has committed to do and transition away from oil in the coming decades.
Specific policy recommendations about how to respond to these social and economic impacts are beyond the scope of this report; however, our analysis offers three key lessons for the workers, communities and governments implicated in oil sands production:
1. The stakes of an unmanaged decline in oil sands production are sky-high for Alberta. If the market for oil sands exports shrinks and no proactive economic diversification, worker transition and community support measures are taken by the provincial and federal governments, the costs for affected workers, local communities and public revenues will be dramatic and potentially catastrophic. Tens of thousands of jobs and dozens of communities depend on the oil sands. A collapse of oil sands royalty payments would also create an enormous budgetary shortfall for the province.
2. There is a runway to prepare for decline, but it is short. In no scenario does the oil sands industry shut down overnight, but, in a world moving rapidly to decarbonize, the dominoes start to fall in the 2030s. If
communities and governments at all levels do not have plans in place before projects shut down, the associated drop in public revenues will make managing the transition even more difficult.
3. Not enough money is being set aside to cover cleanup costs. Alberta requires oil producers to set aside money to clean up their own projects, but only as those projects approach the end of their expected lifespans. In a world where projects are forced to shut down prematurely, not nearly enough money will have been set aside in advance. Besides being necessary for environmental integrity and reconciliation with Indigenous Peoples, reclamation is also a promising job creation opportunity, but only if it is adequately funded.
Whatever the solutions to these problems are, it is crucial that they be led by the communities in question. Declining oil sands production will be experienced differently by every community, depending on the nature of their relationship with the oil sands and on the shutdown timeline for particular projects. Any transition plans and processes, including worker support and economic diversification initiatives, must be developed by, with and for those workers and communities.
Appendix
We created a bespoke economic model of the oil sands to attempt to reproduce the results of the Canada Energy Regulator’s Canada’s Energy Future 2023 report. We did not have access to the CER’s actual model, nor is our model reviewed by or endorsed by the CER. To the extent possible, we aligned our model with the available information in the CER report (e.g., their oil price trajectory) and filled in the gaps independently. We then added dimensions to the model that were not addressed by the CER, such as jobs and revenues.
Model inputs
For each of the 32 projects outlined in Table 2, we collected and/or inferred the data points summarized in Table 3. Key sources are included in the table, although additional sources were incorporated wherever possible to corroborate data. While we used 2023 as our baseline year, some of the data sources we drew from were only updated through 2021 or 2022. Moreover, some figures (especially those connected to revenues and public payments) vary widely from year to year. To account for these discrepancies, we used multi-year averages in some cases to arrive at a “middle ground” baseline.
Baseline jobs estimates
To generate our estimate for total oil sands employment, we started by identifying the number of workers in the 2021 census
Table 3: Key variables and data sources for
CCPA-Ecojustice oil sands model
Name, operator, project type, start date, location, production capacity
Alberta Energy Regulator, “ST44: Active Oil Sands Schemes Quarterly Edition,” May 2024.
Alberta Energy Regulator, “ST102: Facility List,” December 2023.
Oil Sands Magazine, “Facilities and Infrastructure,” accessed April 2024.
Planned end date
Offshore Technology, “Analysis: Projects,” accessed April 2024.
Crude oil production
Alberta Energy Regulator, “ST39: Alberta Mineable Oil Sands Plant Statistics Monthly Supplement,” November 2023.
Alberta Energy Regulator, “ST53: Alberta In Situ Oil Sands Production Summary,” December 2023. Canadian Association of Petroleum Producers, The Economic Impact of Canadian Oil and Gas, December 2023.
Emissions intensity
Government of Alberta, Alberta Oil Sands Greenhouse Gas Emission Intensity Analysis, January 2024.
Janetta McKenzie, Scott MacDougall & Eyab Al-Aini, Survival of the Cleanest: Assessing the cost and carbon competitiveness of Canada’s oil, Pembina Institute, November 2023.
Revenues, expenditures, royalties, taxes, fees
Alberta Energy Regulator, “Alberta Energy Outlook (ST98),” June 2023.
Government of Alberta, “2023 Oil sands project data,” August 2024.
Statistics Canada, “Extractive Sector Transparency Measures Act Data Portal,” Government of Canada, accessed May 2024.
Statistics Canada, “Table 25-10-0065-01: Oil and gas extraction revenues, expenses and balance sheet (x 1,000,000),” 2024.
Environmental liabilities
Alberta Energy Regulator, “Liability Management Rating (LMR) Results Report,” July 2024.
Alberta Energy Regulator, “Mine Financial Security Program – Security and Liability,” 2023.
Jobs
Careers in Energy, Canada’s Energy Workforce: National Labour Market Outlook to 2035, March 2024.
Statistics Canada, “Table 36-10-0489-01: Labour statistics consistent with the System of National Accounts (SNA), by job category and industry,” Government of Canada, May 2024.
Statistics Canada, “Table 36-10-0595-01: Input-output multipliers, provincial and territorial, detail level,” Government of Canada, December 2023.
Statistics Canada, “Table 98-10-0448-01: Industry groups by class of worker including job permanency, labour force status, age and gender: Canada, provinces and territories, census metropolitan areas and census agglomerations with parts,” Government of Canada, 2022.
Statistics Canada, “Table 98-10-0588-01: Employment income statistics by industry sectors, Indigenous identity, highest level of education, work activity during the reference year, age and gender: Canada, provinces and territories, census metropolitan areas and census agglomerations with parts,” Government of Canada, 2023.
that fell into the following North American Industry Classification System (NAICS) sectors:
• Oil and gas extraction (211)
• Support activities for mining, and oil and gas extraction (213)
• Construction (23)
• Petroleum and coal product manufacturing (324)
• Pipeline transportation of crude oil (4861)
• Petroleum and petroleum products merchant wholesalers (412)
We then used the System of National Accounts (SNA) and other data sources to estimate the share of each sector associated specifically with the oil sands. For example, according to the SNA, 37 per cent of direct oil and gas extraction jobs in Alberta are connected to the oil sands, so we can use that figure to infer the share of indirect jobs (e.g., in pipelines and refining) that are also tied to the oil sands. We started with the census rather than the SNA itself because the census provides additional information about each worker, such as their age, gender, Indigenous status and place of residence, that is not otherwise available.
Estimating construction jobs was somewhat more complicated. Based on the SNA, oil and gas engineering construction accounts for 10 per cent of overall construction jobs in Canada and 33 per cent of construction jobs specifically in Alberta. We narrowed down the category further by looking at the share of capital expenditures in conventional versus unconventional oil production to arrive at an estimate for oil sands jobs at three per cent of national construction employment (about 46,000 workers), which includes about a fifth of construction workers in Alberta.
We corroborated these figures using Careers in Energy’s estimate, based on Statistics Canada’s input-output tables, that “5,400 indirect [and construction] jobs are created for every $1 billion spent on energy capital projects.”23 Using that formula with oil sands capital spending gave us 72,000 indirect and construction jobs associated with the oil sands in 2023, which is very close to the 73,000 baseline we arrived at through our model.
The input-output tables also came into play when we estimated reclamation jobs. Approximately six jobs are created for every $1 million spent on environmental remediation
services (NAICS code 562910), which becomes relevant when modeling oil sands cleanup (see below).
To determine per-project job numbers, we distributed total direct and indirect jobs among the 32 projects based on their share of total oil production. We distributed construction jobs based on each project’s share of total capital expenditures.
Finally, for the purpose of mapping retirements, we estimated the share of oil sands workers of each age—from 15 to 75 years old—using age cohort data from the census.
Oil production model
For our reference case, we assumed that projects will gradually increase production levels each year until they reach their maximum planned capacity. We assumed projects will maintain maximum production levels until they enter the final quarter of their planned lifespan, at which point production levels decline gradually until they reach zero.
For our global net-zero case, we constrained total production until it aligned with the CER model output. Specifically, we modified output relative to the reference case by –1 per cent per year in the 2024-30 period, –5 per cent per year in the 2030-35 period and –9 per cent per year in the 2035-50 period. These changes represent falling global demand for oil based on changes to the benchmark price of oil (Brent Crude). In the CER’s scenario, the price falls from US$80 per barrel in 2023 to US$35 in 2030 and then to US$24 in 2050.
For each year in the model, we took the difference in total production between the reference case and net-zero case (i.e., excess supply) and distributed it among all oil sands projects as foregone production. For each project, we determined how emissions intensive it was relative to all active projects and how much it costs to produce a barrel of oil relative to all active projects. If the average of these indices was greater than the average of all projects, we tagged the project as being in “hard decline.” Alternatively, if the benchmark price of oil ever fell below a project’s breakeven price, the project automatically entered hard decline. All other active projects were marked as being in “soft decline” for the year.
Eighty per cent of annual foregone production was assigned to projects in hard decline and the remainder was assigned to projects in soft decline. Note that production levels could still go up for individual projects in a given year if growth in the
reference case exceeded foregone production in the net-zero case.
If, in any given year, foregone production for a specific project exceeded its baseline production, we marked the project as “shut down.” Once a project was shut down it could not resume operating and we began the reclamation process.
Revenues, expenditures and payments model
Gross revenues for each project were calculated by multiplying the amount of oil produced in a given year by the projected price of oil in that year.
Initial operational expenses (OPEX) were based on historical values and then assumed to change in response to two other variables: total oil production and the number of jobs associated with the project. Note that the automation of employment (see below) reduced operational expenses—and therefore increased net revenues—independent of changes in oil production.
To model capital expenditures (CAPEX), we started with historical values then adjusted up or down in a given year based on the project’s production trajectory. If a project was in “hard decline,” as noted above, we assumed CAPEX fell by 25 per cent per year. Projects in soft decline saw CAPEX fall by 10 per cent per year. These figures are somewhat arbitrary but are intended to reflect shuttered expansions as well as reduced demand for maintenance of non-producing assets.
Net revenues were calculated as gross revenues less operating and capital expenditures. For projects with “unrecovered losses” (i.e., outstanding debt), all net revenues were assumed to pay down those losses.
The Alberta royalty regime distinguishes between projects in the “pre-payout” and “post-payout” phases based on their unrecovered losses and the current price of oil. We applied the relevant formula to each project to calculate the amount of royalties paid in a given year.
Federal and provincial taxes were estimated based on a simple formula that applied the historical average tax rate for each project to that project based on their net revenues in a given year.
For the fees paid to First Nations and Métis Nations, we assumed a linear relationship between the gross revenues
generated by each oil sands project and the payments made to Indigenous groups. We mapped specific projects to individual Indigenous groups through a combination of historical payments (as reported under the Extractive Sector Transparency Measures Act) and geographic proximity.
Liabilities model
If a project increased oil production from year to year, its environmental liabilities were assumed to increase proportionally. Otherwise, reclamation activities were assumed to ramp up as projects entered their “hard decline” phase and to accelerate once projects were fully shut down.
We assumed the complete reclamation of an oil sands site takes 20 years on average, with the costs distributed evenly over that period. We assumed liabilities are paid down each year until they reach zero, which in almost every case was beyond 2050.
Jobs model
Before addressing the impact of production levels on job levels, we considered the impact of automation. We took the low-end estimate offered by the consultancy Ernst & Young of a cumulative 30 per cent reduction in oil and gas employment by 2040 due to automation.24 For our model, we assumed a two per cent per year decline in jobs in the 2024-2040 period and a three per cent per year decline thereafter.
After the effects of automation were applied, modeled changes in direct and indirect jobs were proportional to changes in oil production. For example, if production from a given facility fell by five per cent in a given year, the number of associated jobs was also assumed to fall by five per cent.
Changes in construction jobs were calculated in direct proportion to changes in capital expenditures for each project. For reclamation jobs, we multiplied annual reclamation spending (i.e., the payoff of environmental liabilities) by the sixjobs-per-million-dollars figure discussed above.
To estimate retirements, we took our baseline age cohorts and shifted them forward each year. Half of workers 65 or older were assumed to retire each year, and no new young workers were assumed to be hired. We attributed the difference between retirements and net losses to layoffs and churn.
Notes
1 See “Figure 2.1: The causal chain from emissions to resulting warming of the climate system” in: Intergovernmental Panel on Climate Change, Climate Change 2023: Synthesis Report, March 2023, p. 43.
2 International Energy Agency, Oil 2024: Analysis and forecast to 2030, June 2024.
3 Net Zero Tracker, Net Zero Stocktake 2023: Assessing the status and trends of net zero target setting across countries, sub-national governments and companies, NewClimate Institute, Oxford Net Zero, Energy & Climate Intelligence Unit & Data-Driven EnviroLab, June 2023.
4 International Energy Agency, Oil 2024
5 Canadian Centre for Energy Information, Energy Fact Book, 2023-2024, Government of Canada, 2023.
6 Angela Carter & Laura Cameron, Why Carbon Capture and Storage Is Not a Net-Zero Solution for Canada’s Oil and Gas Sector, International Institute for Sustainable Development, February 2023.
7 Aaron Cosbey, Why Canada Is Unlikely to Sell the Last Barrel of Oil, Pembina Institute, December 2022.
8 See “Figure R.28: Oil sands production by type, all scenarios” in: Canada Energy Regulator, Canada’s Energy Future 2023: Energy Supply and Demand Projections to 2050, Government of Canada, June 2023, p. 84.
9 Various other limitations of the CER’s model are discussed in: David Hughes, Getting to Net-Zero in Canada: Scale of the Problem, Government Projections and Daunting Challenges, Canadian Centre for Policy Alternatives & Corporate Mapping Project, February 2024.
10 Katrin Sievert, Laura Cameron & Angela Carter, Why the Cost of Carbon Capture and Storage Remains Persistently High, International Institute for Sustainable Development, September 2023.
11 Statistics Canada, “Table 98-10-0599-01: Employment income statistics by industry groups, visible minority, highest level of education, work activity during the reference year, age and gender: Canada, provinces and territories,” Government of Canada, 2022.
12 Ibid.
13 Statistics Canada, “Table 36-10-0489-01: Labour statistics consistent with the System of National Accounts (SNA), by job category and industry,” Government of Canada, May 2024.
14 Hadrian Mertins-Kirkwood & Zaee Deshpande, Who Is Included in a Just Transition? Considering Social Equity in Canada’s Shift to a Zero-Carbon Economy, Canadian Centre for Policy Alternatives & Adapting Canadian Work and Workplaces to Respond to Climate Change, August 2019.
15 Environment and Climate Change Canada, National Inventory Report, 1990–2022: Greenhouse Gas Sources and Sinks in Canada, Government of Canada, May 2024.
16 Eyab Al-Aini, Chris Severson-Baker & Jan Gorski, Getting on Track: A primer on challenges to reducing carbon emissions in Canada’s oilsands, Pembina Institute, March 2022.
17 See, for example: Andrew Nikiforuk, Tar Sands: Dirty Oil and the Future of a Continent, Greystone Books & David Suzuki Foundation, 2009.
18 Alberta Energy Regulator, “Mine Financial Security Program – Security and Liability,” 2023.
19 Drew Yewchuk, Shaun Fluker & Martin Olszynski, “A Made-in-Alberta Failure: Unfunded Oil and Gas Closure Liability,” School of Public Policy Research Papers vol. 16 (no. 31), October 2023.
20 Lance Mortlock et al., Preparing for the future now: Rethinking the oil and gas workforce in 2040, Ernst & Young LLP & PetroLMI, August 2020.
21 Jim Stanford, Employment transitions and the phase-out of fossil fuels, The Centre for Future Work, 2021.
22 Marc Lee, Extracted Carbon: Re-Examining Canada’s Contribution to Climate Change through Fossil Fuel Exports, Canadian Centre for Policy Alternatives & Corporate Mapping Project, January 2017.
23 Careers in Energy, Canada’s Energy Workforce: National Labour Market Outlook to 2035, March 2024, p. 7.