Injection Moulding Asia Automotive
100
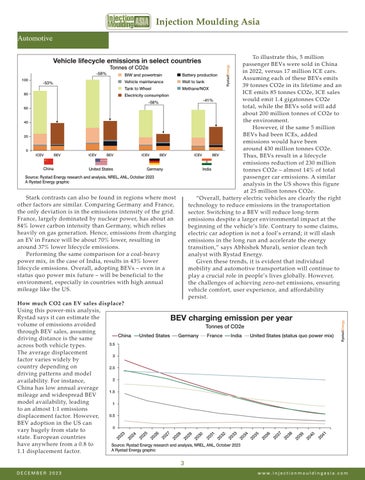
BIW and powertrain Vehicle maintenance
-53%
Tank to Wheel 80
Electricity consumption -58%
60
40
20
0 ICEV
BEV
China
ICEV
BEV
United States
ICEV
BEV
Germany
Source: Rystad Energy research and analysis, NREL, ANL, October 2023 A Rystad Energy graphic
Stark contrasts can also be found in regions where most other factors are similar. Comparing Germany and France, the only deviation is in the emissions intensity of the grid. France, largely dominated by nuclear power, has about an 84% lower carbon intensity than Germany, which relies heavily on gas generation. Hence, emissions from charging an EV in France will be about 70% lower, resulting in around 37% lower lifecycle emissions. Performing the same comparison for a coal-heavy power mix, in the case of India, results in 43% lower lifecycle emissions. Overall, adopting BEVs – even in a status quo power mix future – will be beneficial to the environment, especially in countries with high annual mileage like the US.
How much CO2 can EV sales displace? Using this power-mix analysis, Rystad says it can estimate the BEV charging emission per year volume of emissions avoided Tonnes of CO2e through BEV sales, assuming China United States Germany France India United States (status quo power mix) driving distance is the same 3.5 across both vehicle types. The average displacement 3 factor varies widely by country depending on 2.5 driving patterns and model 2 availability. For instance, China has low annual average 1.5 mileage and widespread BEV model availability, leading 1 to an almost 1:1 emissions 0.5 displacement factor. However, BEV adoption in the US can 0 vary hugely from state to 41 31 032 033 034 035 036 037 038 039 040 23 024 025 026 027 028 029 030 state. European countries 2 2 20 2 20 2 2 2 20 2 2 2 2 2 2 2 2 2 2 have anywhere from a 0.8 to Source: Rystad Energy research and analysis, NREL, ANL, October 2023 A Rystad Energy graphic 1.1 displacement factor.
RystadEnergy
Tonnes of CO2e
-58%
RystadEnergy
To illustrate this, 5 million passenger BEVs were sold in China in 2022, versus 17 million ICE cars. Battery production Assuming each of these BEVs emits Well to tank 39 tonnes CO2e in its lifetime and an Methane/NOX ICE emits 85 tonnes CO2e, ICE sales would emit 1.4 gigatonnes CO2e -41% total, while the BEVs sold will add about 200 million tonnes of CO2e to the environment. However, if the same 5 million BEVs had been ICEs, added emissions would have been around 430 million tonnes CO2e. ICEV BEV Thus, BEVs result in a lifecycle emissions reduction of 230 million India tonnes CO2e – almost 14% of total passenger car emissions. A similar analysis in the US shows this figure at 25 million tonnes CO2e. “Overall, battery electric vehicles are clearly the right technology to reduce emissions in the transportation sector. Switching to a BEV will reduce long-term emissions despite a larger environmental impact at the beginning of the vehicle’s life. Contrary to some claims, electric car adoption is not a fool’s errand; it will slash emissions in the long run and accelerate the energy transition,” says Abhishek Murali, senior clean tech analyst with Rystad Energy. Given these trends, it is evident that individual mobility and automotive transportation will continue to play a crucial role in people’s lives globally. However, the challenges of achieving zero-net emissions, ensuring vehicle comfort, user experience, and affordability persist.
Vehicle lifecycle emissions in select countries
3 DECEMBER 2023
www.injectionmouldingasia.com