 Undergraduate Research at the Swanson School of Engineering
University of Pittsburgh Swanson School of Engineering Undergraduate Research
Benedum Hall, 3700 O’Hara Street, Pittsburgh, PA 15261 USA
Spring 2023
Please note that neither Ingenium nor the Swanson School of Engineering retains any copyright of the original work produced in this issue. However, the Swanson School does retain the right to nonexclusive use in print and electronic formats of all papers as published in Ingenium
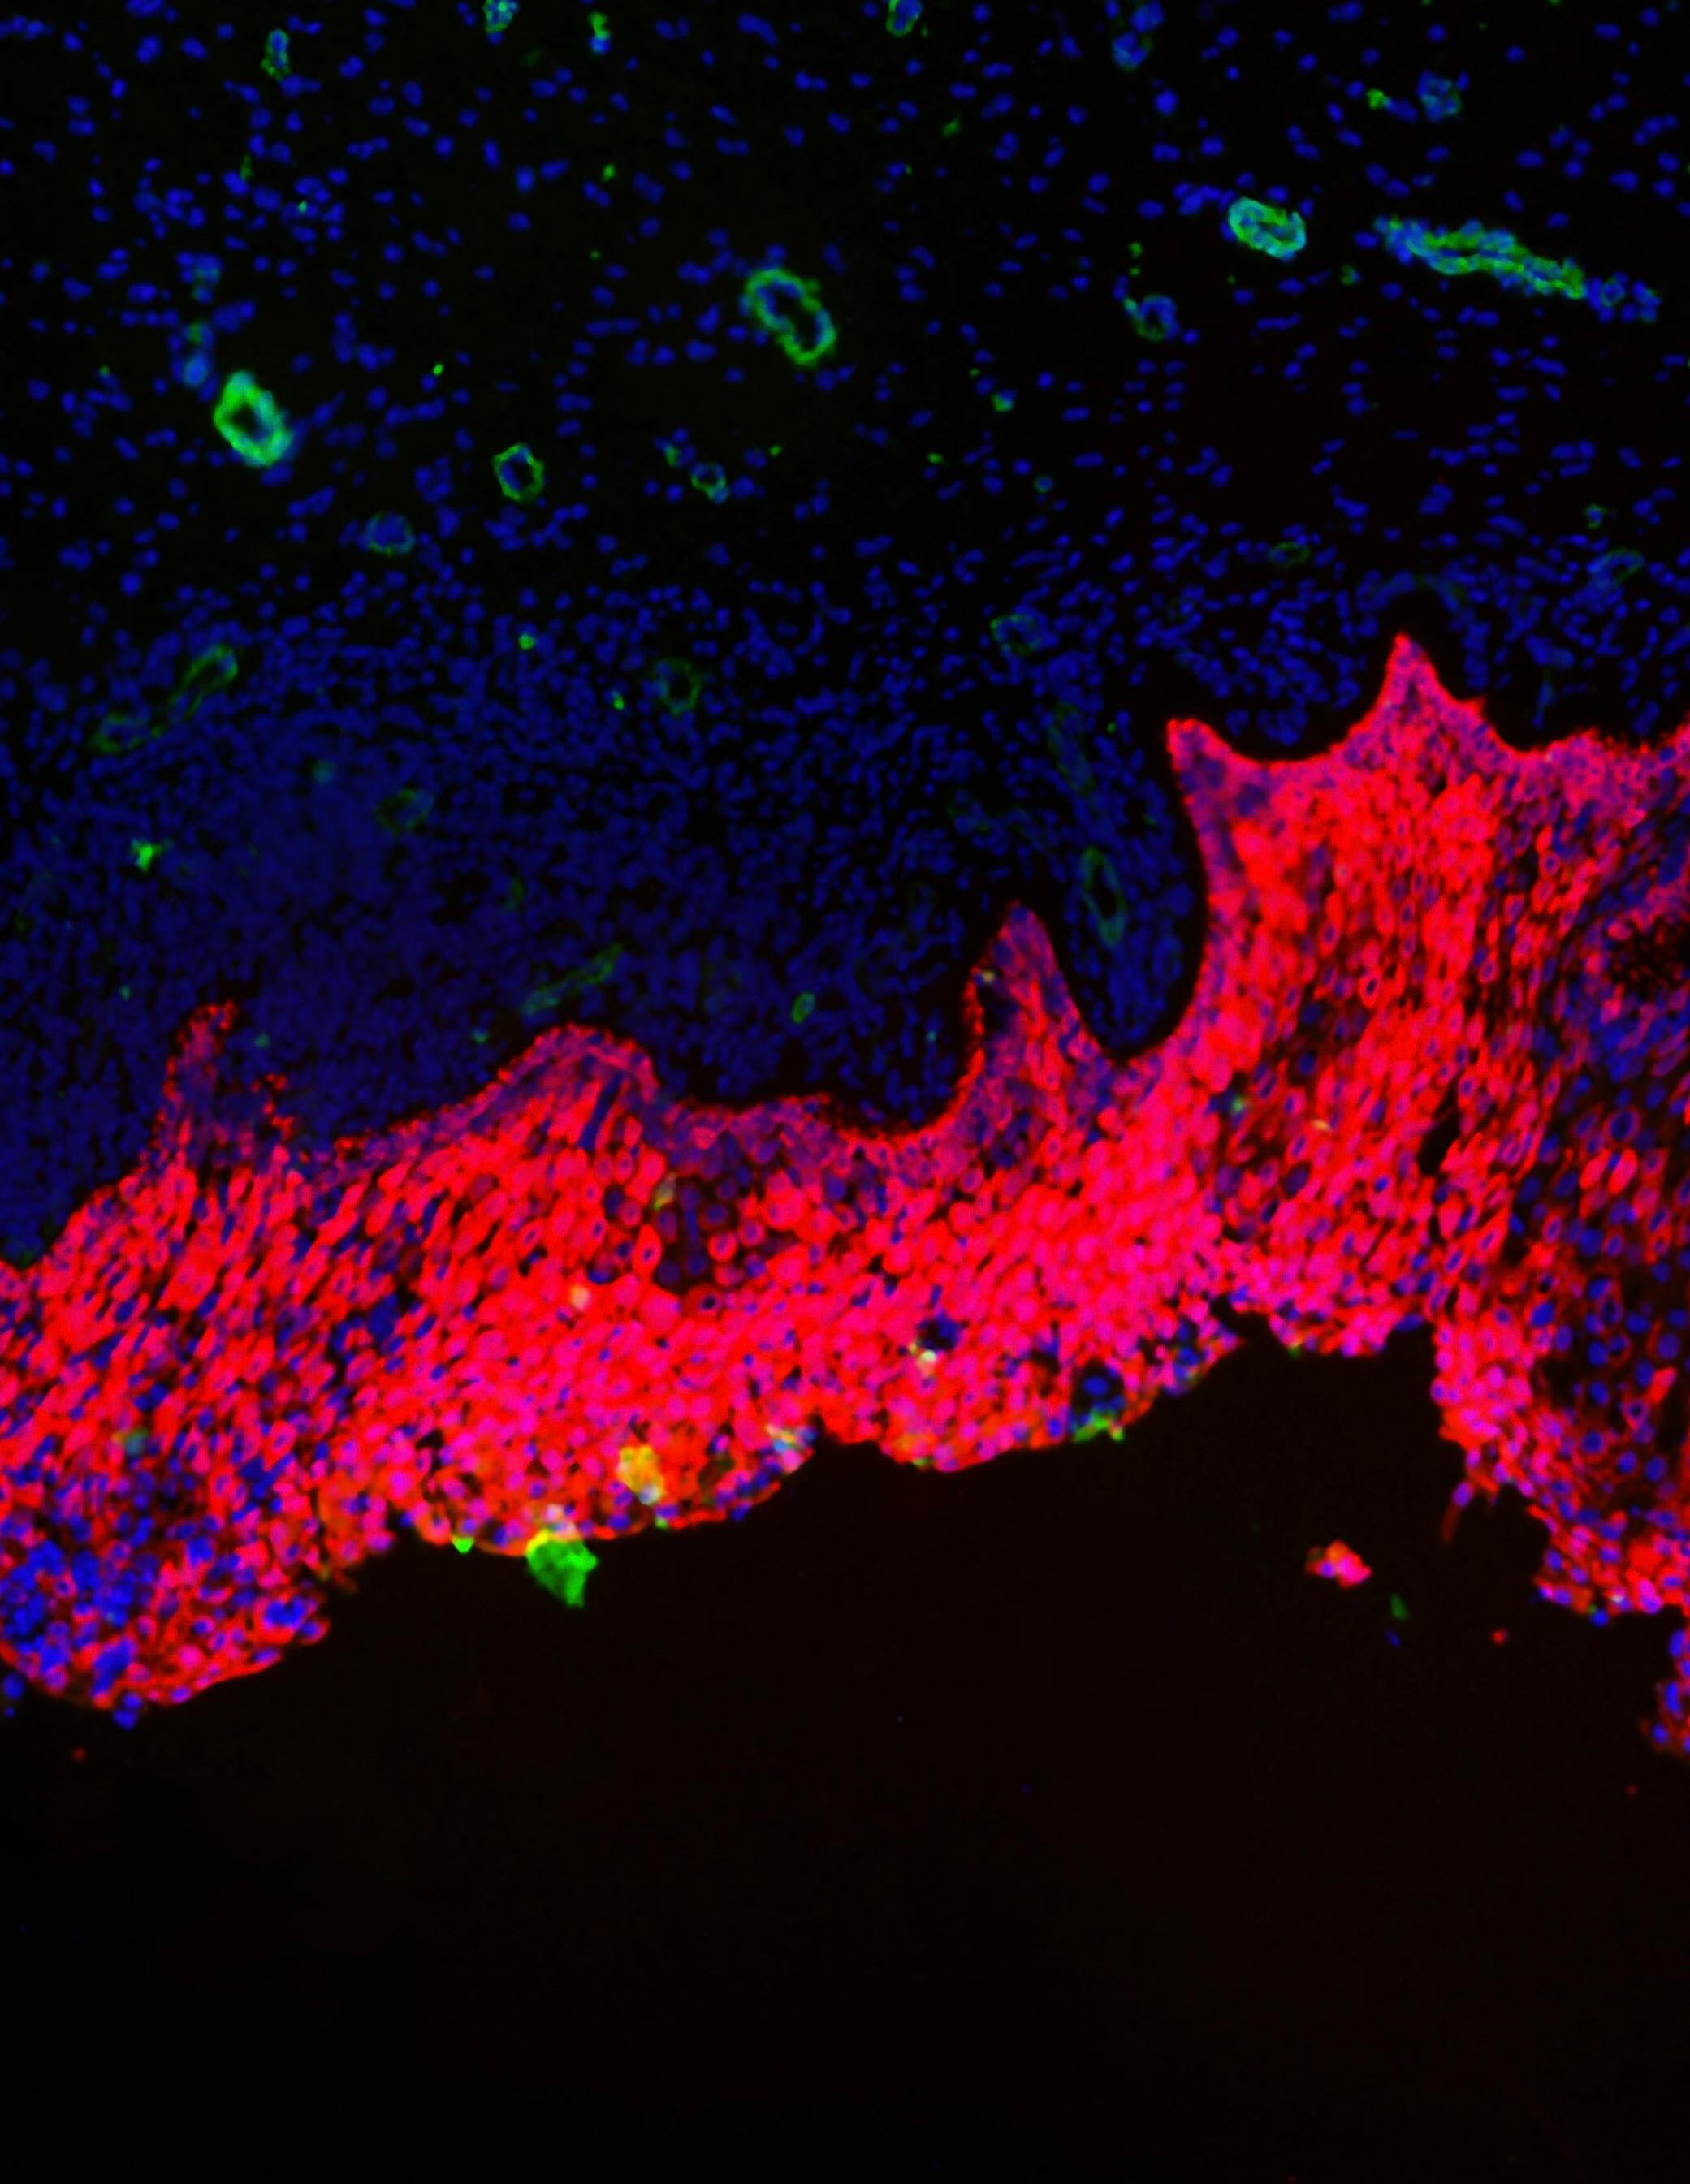
 The image on the cover shows immunofluorescence image showing labeling of Cannabinoid type 1 (CB1, red) receptors in the basal and upper layers of the NHP vaginal epithelium. (See page 67 by Rachel Shaw.)
Table of Contents
Dry Eye Disease Replication in Rabbits: An Evaluation Comparing a Surgically Induced to a Chemically Induced Dry Eye Model*
Cambell T. France1,2 , Alexis L. Nolfi1,2 , Mangesh Kulkarni1,2 , Vishal Jhanji3 and Bryan N. Brown1,2
1Department of Bioengineering, University of Pittsburgh.
2McGowan Institute for Regenerative Medicine, University of Pittsburgh.
3Department of Ophthalmology, University of Pittsburgh. 9
PEG-reinforced Gelatin Scaffold Promotes Uniform Chondrogenesis of Human MSCs
Alyssa Aguglia1,2 , Kanyakorn Riewruja2,3 and Hang Lin2
1Department of Bioengineering, University of Pittsburgh.
2Department of Orthopaedic Surgery, University of Pittsburgh.
3Osteoarthritis and Muscoskeletal Research Unit, Chulalongkorn University.
THP-1 Macrophages Influence SNAP CAR-T Cell Infiltration in the Tumor Microenvironment
Jacob Antonello1,2 and Ioannis Zervantonakis1,2
1Tumor Microenvironment Engineering Laboratory,
2Department of Bioengineering, University of Pittsburgh
14
FVIII Gene Restoration in Hemophilia A patient Stem Cells Using CRISPR Editing
Michael P. Haugh1,2 , Robert Barndt 2 and Haodi Wu2
1Department of Bioengineering, University of Pittsburgh.
2Vascular Medicine Institute, Department of Medicine, University of Pittsburgh. 39
Biomaterials Design for Bioengineered Meat
Cara Klinger1, Ashley Koenig 2 , Faris Hazwan 3 , Yu Hanry3 and Jennifer L. Young 3
1Department of Bioengineering, University of Pittsburgh.
2Department of Bioengineering, Johns Hopkins University.
3Mechanobiology Institute, Department of Bioengineering, National University of Singapore 43
Mechanisms of Macrophage Recruitment and Infiltration in HER2+ Breast Cancer
Laurel Koehler1, Youngbin Cho1, and Ioannis Zervantonakis1,2
19
Directivity of Focused Shear Wave Beams in Soft Elastic Media
Yu-hsuan Chao1, John M. Cormack 2 and Kang Kim1,2
1Department of Bioengineering, University of Pittsburgh.
2Department of Medicine, University of Pittsburgh. 23
Impact of Surgical Prolapse Mesh Implantation on Vaginal Collagen Network
Abigail Fisk 1 and Rui Liang 2,3
1Department of Bioengineering, University of Pittsburgh.
2Department of Obstetrics and Gynecology, University of Pittsburgh.
3Magee-Womens Research Institute, University of Pittsburgh. 28
u Expansion and Optimization of an Artificial Intelligence Framework to Predict Wall Stresses in Abdominal Aortic Aneurysms
Christian N. Hangey 1, Nathan L. Liang 2,3 , David A. Vorp1 and Timothy K. Chung1
1Department of Bioengineering, University of Pittsburgh.
2Department of Surgery, University of Pittsburgh. 3UPMC
33
Pore Size and Mechanical Strength of Silk Fibroin-based Tissue Engineered Vascular Grafts
Connor La Marca1, Isabelle Chickanosky 1, Cyrus Darvish1 , Justin Weinbaum1, David A. Vorp1
Epidural Spinal Cord Stimulation Can Modulate Bladder Activity in an Awake Environment Andres Leon-Vargas1,2 , Maria Jantz1,2,3 , Alaina McCumber2 , Chaitanya Gopinath2,4 and Robert Gaunt1-4
1Department of Bioengineering, University of Pittsburgh. 2Rehabilitation
u Quantifying and Minimizing the Error in 3D Printing the Human Lamina Cribrosa
Brock Pemberton1, Remi Shittu2 , Jonathan Vande Geest1-3
* Reviewers’ Choice
Category Definitions
u Computational Research—using computational techniques to address a scientific question
Device Design—focusing on the development of a product or device
Experimental Research—using laboratory methods to achieve a novel overarching experimental aim
Methods—developing new techniques and tools for research and design
4 Undergraduate Research at the Swanson School of Engineering
Message from Dr. Vorp 6 Message from Co-Editors-in-Chief 7 Graduate Student Review Board – Ingenium 2023 8
Division of
Surgery.
Vascular
Department of
2UPMC Hillman Cancer Center. 48
1Tumor Microenvironment Engineering Laboratory,
Bioengineering, University of Pittsburgh.
Bioengineering Laboratory, Department of Bioengineering, University of Pittsburgh. 52
1Vascular
Neural
for the Neural Basis of Cognition, University of Pittsburgh. 4Department of Physical Medicine and Rehabilitation, University of Pittsburgh. 57
Engineering Labs, University of Pittsburgh. 3Center
2McGowan Institute for Regenerative
of Pittsburgh. 3Department of Ophthalmology, University of Pittsburgh. 62
1Department of Bioengineering, University of Pittsburgh.
Medicine, University
Visualizing CB1 Receptors in Vaginal Epithelium of Nonhuman Primates
Rachel Shaw 1, Katrina Knight1,2 and Pamela Moalli1,2
1Department of Bioengineering, University of Pittsburgh.
2Magee-Womens Research Institute & Foundation.
Non-Toxic DOPA-Based Polymers Improve Healing of Severe Wounds
65
Erica Taylor1,2 , Jianying Zhang 2 , Michael Copeland2 , James H-C. Wang 2
1Department of Bioengineering, University of Pittsburgh.
2Mechanobiology Laboratory, Department of Orthopedic Surgery, University of Pittsburgh.
70
Spinal Cord Stimulation for Bladder Function Evokes Sporadic Nerve Activity
Savannah C. Waymer 1,2 , Maria K. Jantz1,2,3 , Chaitanya Gopinath2,4 and Robert A. Gaunt1-4
1Department of Bioengineering, University of Pittsburgh.
2Rehab Neural Engineering Labs, University of Pittsburgh.
3Center for the Neural Basis of Cognition, University of Pittsburgh.
4 Department of Physical Medicine and Rehabilitation, University of Pittsburgh.
Fundamentals of Silica Scaling on Nanofiltration Membrane
Alexandra Fuller1, Savanna Maynard1, Ritesh Pawar1 and Radisav D. Vidic1,2
1Department of Chemical and Petroleum Engineering, University of Pittsburgh.
2Department of Civil and Environmental Engineering, University of Pittsburgh.
u Calibrating Discrete-time Markov Chain Models of Disease
Progression with Gradient Descent
Nathan Carney 1 and Jourdain Lamperski1
78
u Structural Drivers of Polarization in Social Networks
Zhaohan Xing1, and M. Amin Rahimian1
1Sociotechnical Systems Research Lab, Department of Industrial Engineering, University of Pittsburgh. 98
Toward Using an Equilibrium System Theory to Describe Non-equilibrium Systems
Tianyi Bi1, and Lei Fang 2
1Department of Mechanical Engineering and Materials Science, University of Pittsburgh.
2Department of Civil and Environmental Engineering, University of Pittsburgh. 102
u Analysis of Vortex-generating Fences on a Formula Student Multi-element Rear Wing
Dane A. Sabo1, and Matthew M. Barry 1
1Department of Mechanical Engineering and Materials Science, University of Pittsburgh. 106
Development of a Reduced Area Build-box for a Commercial Binder Jet 3D Printer for Minimized Powder Utilization for Printing of Magnetocaloric Materials
Emma Spatz1, Pierangeli Rodríguez De Vecchis1, and Markus Chmielus1
1AM3 Lab, Department of Mechanical Engineering and Materials Science, University of Pittsburgh. 112
Designing a Haptic Shape Display to Assist Blind Individuals
Joshua M. Summers1 and Samuel J. Dickerson2
83
1Department of Mechanical Engineering and Materials Science, University of Pittsburgh.
2Department of Electrical and Computer Engineering, University of Pittsburgh. 117
1Department of Industrial Engineering, University of Pittsburgh. 89
u A Spatial Clustering Algorithm for Community Detection in Social Networks
Andrew R. Polar1, Jourdain Lamperski1, and Clarence Worrell1
1Department of Industrial Engineering, University of Pittsburgh. 94
* Reviewers’ Choice
Category Definitions
u Computational Research—using computational techniques to address a scientific question
Device Design—focusing on the development of a product or device
Experimental Research—using laboratory methods to achieve a novel overarching experimental aim
Methods—developing new techniques and tools for research and design
5 Ingenium 2023
A Message from the Senior Associate Dean for Research & Facilities
In his commentary on the “Discourse on the Method” by Rene Descartes, Etienne Gilson distinguishes three senses of Ingenium as used by Descartes in the period before 1630: thought, memory and imagination, and spirit. In such, he remarks that “Ingenium spoken most properly is the constitution of the rational faculty of the rational soul for understanding something or discovering or teaching. Or ingenium is the natural aptitude of faculty by which we teach, and through which we ourselves think, or discover something.” He references letters between Descartes and his friends and colleagues, noting that through these letters, we can see that ingenium “is the greatest part of the human being; it engages science, more generally in intellectual projects, and is the power by which we make discoveries.” And this is precisely why we chose the name Ingenium for this publication.

On behalf of the Swanson School of Engineering and Interim U.S. Steel Dean of Engineering Sanjeev G. Shroff, I proudly present the ninth edition of Ingenium: Undergraduate Research at the Swanson School of Engineering, a compilation of articles representing the achievements of our exceptional undergraduate students and their 2022 summer research projects. Despite another year of turbulence and uncertainty, our students once again showed that engineering is at the forefront of leading the way to change, adaptability, and flexibility. Going on more than three years of life during a pandemic, they have continued to thrive and have shown great resilience and perseverance in the face of adversity. They rose to the challenging way of life that we have grown to endure and embrace.
As with each year and each edition of Ingenium, one thing remains the same—the notable and impressive academic and professional growth and development in our outstanding undergraduate students when given the opportunity to engage in scientific research. As always, our students took their skills, knowledge, resources, and information that they learned in their course work and applied it in a thoughtful way outside of the classroom. These students, the future of both our institution and our world, will go on to become engineers, scientists, academics, physicians, or whatever else they set out to accomplish. They will, without a doubt, make incredibly significant impacts in the fields of technology, medicine, travel, space, and communication, just to mention a few.
The student authors of the articles in this issue of Ingenium studied mostly under the guidance of faculty mentors in the Swanson School. At the conclusion of the summer research program, students were asked to submit abstracts summarizing the results of their research. The abstracts were reviewed by the Graduate Student Review Board (GSRB), and the authors of the highest-ranking abstracts were invited to submit full manuscripts for peer review by the GSRB for inclusion in this edition of Ingenium. Therefore, Ingenium serves as more than a record of our undergraduate student experience in research; it is also a practical experience for them in scientific writing and in the author’s perspective of the peer-review process. Additionally, it provides graduate students with an opportunity to experience the editorial review process and the reviewer’s perspective of the peer-review process.
I would like to acknowledge the hard work and dedication of the coeditors in chief of this issue of Ingenium, Zeineb Bouzid, Pierangeli Rodriguez De Vecchis, and Rafael Rodriguez De Vecchis, as well as the design team at Alphagraphics, the team in the Office of University Communications and Marketing, and Jaime Turek in my office. This issue would not have been possible without the hard work of the graduate student volunteers who constitute the GSRB and who are listed by name in this issue. It is also altogether fitting to thank the faculty mentors and other coauthors of the reports included in this issue.
I hope that you enjoy reading this edition of Ingenium and that the many talents of our students inspire the engineers of the future.
Hail to Pitt!
David A. Vorp, PhD Associate Dean for Research Swanson School of Engineering University of Pittsburgh

6 Undergraduate Research at the Swanson School of Engineering
David A. Vorp, Ph.D.
Message from the Co-Editors-in-Chief


Greetings!

We are excited to present the ninth edition of Ingenium: Undergraduate Research at the Swanson School of Engineering (SSOE). Ingenium provides undergraduate students with an introduction to the scientific peer-review process and allows them to gain experience in communicating their research through written manuscripts. All manuscripts were reviewed by SSOE graduate students who kindly volunteered to provide detailed feedback, in a reciprocally rewarding experience of understanding the reviewer’s perspective and learning new topics while sharing their expertise. This volume features 23 articles from undergraduate students at the University of Pittsburgh’s Swanson School of Engineering (SSOE). This year’s articles show how the talents and hard work of these students provide new perspectives in relevant scientific topics being developed today.
This year’s edition of Ingenium displays a sample of the diverse research that can be found in SSOE labs, and the opportunities undergraduate students are exposed to. We are so proud of all participating students for their creativity, critical thinking, hard work, and commitment to their research. We hope all authors, mentors and reviewers share our excitement and pride and that you enjoy all articles as much as we did!
We would like to thank everyone in the production team of this year’s Ingenium volume. We deeply thank Dr. David Vorp, Senior Associate Dean for Research and Facilities, for his vision and continued commitment to this publication. We are also extremely grateful to Jaime Turek, for her advice, guidance, and continued support throughout the entire year. We also deeply appreciate all the mentors who guided the students’ research and the graduate students on the GSRB, for dedicating so much of their not-so-free time and sharing their knowledge to advice the authors. Finally, we would like to thank everyone in the Office of University Communications and Marketing and the AlphaGraphics team, especially, Rich Cichoski and John Kasunic for their amazing work with the production and design of this Ingenium edition.

We have learned so much from everyone involved in this year’s Ingenium edition, and we are honored to have served as Co-Editors-in-Chief. It was truly a most rewarding experience to continue this Pitt SSOE tradition and to be part of a remarkable research community that invests in students and their academic and personal development. We hope that as you read this year’s articles, you let yourself be submerged in the wonderful research developments, as well as the passion and hard work shown by the authors.
Congratulations to the authors and happy reading!
7 Ingenium 2023
Pierangeli Rodriguez De Vecchis
Rafael T. Rodriguez De Vecchis
Zeineb Bouzid
Zeineb Bouzid Co-Editor-In-Chief
Rafael T. Rodriguez De Vecchis Co-Editor-In-Chief
Pierangeli Rodriguez De Vecchis Co-Editor-In-Chief
Graduate Student Review Board – Ingenium 2023
*Co-Editors-in-Chief
Name
Gilgal Ansah
Elizabeth Bentley
Saket Bikmal
Tia Calabrese
Pooja Chawla ............................................................................................
Isabelle Chickanosky
Neharika Chodapaneedi
Lily Farmerie .............................................................................................
Abigail Gondringer
Pete Gueldner
Dorota Jazwinska
Julie Kobyra
Diana Kulawiec
Lucy Liang
Jennifer Mak
Ande Marini
Katarina Martinet
Alireza Mohammadzadeh
Sharada Narayanan .................................................................................
Ahlad Neti
Andrew Orenberg
May Yoon Pwint........................................................................................
Julie Rekant
Andrea Sajewski
Rinu Sebastian
Yucheng Shen
Megan Darnell
Kathryn Kennebeck
Ping Lyu
Isaiah Spencer-Williams ..........................................................................
Mona Abdelgaid
Sanjana Karpe
Zeineb Bouzid*.........................................................................................
Jorge Torres Quinones
Gaoxiang Zhou
Hanie Eskandari
Soumalya Ghosh
Yingze Hou
Fatemeh Azari
Andrew Baker
Grace De Leon Nope
Qifeng Hu
Iza Lantgios
Stephanie Liu ............................................................................................
Preston Nguyen
Tyler Paplham
Pierangeli Rodriguez De Vecchis* ..........................................................
Rafael Rodriguez De Vecchis*
Mo’ath Yousef
Ziyu Zhou
Department
Department of Bioengineering
Department of Bioengineering
Department of Bioengineering
Department of Bioengineering
Department of Bioengineering
Department of Bioengineering
Department of Bioengineering
Department of Bioengineering
Department of Bioengineering
Department of Bioengineering
Department of Bioengineering
Department of Bioengineering
Department of Bioengineering
Department of Bioengineering
Department of Bioengineering
Department of Bioengineering
Department of Bioengineering
Department of Bioengineering
Department of Bioengineering
Department of Bioengineering
Department of Bioengineering
Department of Bioengineering
Department of Bioengineering
Department of Bioengineering
Department of Bioengineering
Department of Bioengineering
Department of Civil and Environmental Engineering
Department of Civil and Environmental Engineering
Department of Civil and Environmental Engineering
Department of Civil and Environmental Engineering
Department of Chemical and Petroleum Engineering
Department of Chemical and Petroleum Engineering
Department of Electrical and Computer Engineering
Department of Electrical and Computer Engineering
Department of Electrical and Computer Engineering
Department of Industrial Engineering
Department of Industrial Engineering
Department of Industrial Engineering
Department of Mechanical Engineering and Materials Science
Department of Mechanical Engineering and Materials Science
Department of Mechanical Engineering and Materials Science
Department of Mechanical Engineering and Materials Science
Department of Mechanical Engineering and Materials Science
Department of Mechanical Engineering and Materials Science
Department of Mechanical Engineering and Materials Science
Department of Mechanical Engineering and Materials Science
Department of Mechanical Engineering and Materials Science
Department of Mechanical Engineering and Materials Science
Department of Mechanical Engineering and Materials Science
Department of Mechanical Engineering and Materials Science
Dry Eye Disease Replication in Rabbits: An Evaluation Comparing a Surgically Induced to a Chemically Induced Dry Eye Model
Cambell T. France1,2 , Alexis L. Nolfi1,2 , Mangesh Kulkarni1,2 , Vishal Jhanji3 , Bryan N. Brown1,2
1 McGowan Institute for Regenerative Medicine, University of Pittsburgh
2 Department of Bioengineering, Swanson School of Engineering, University of Pittsburgh
3 Department of Ophthalmology, University of Pittsburgh
Cambell France is a senior at the University of Pittsburgh, and she is from Pittsburgh, PA. She is passionate about regenerative medicine studies and tissue engineering, and is excited to explore these passions in her future career.

ABSTRACT
Dr. Bryan Brown is an Associate Professor in the Department of Bioengineering with secondary appointments in the Department of Obstetrics, Gynecology, and Reproductive Sciences and the Clinical and Translational Science Institute at the University of Pittsburgh. He is also a core faculty member of the McGowan Institute for Regenerative Medicine where he serves as the Director of Educational Outreach, and Chief Technology Officer of Renerva, LLC, a Pittsburgh-based start-up company.
Significance Statement
Dry eye disease (DED) is a chronic inflammatory disease that creates an unstable tear film and causes pain in the affected person’s eye [1]. Current treatment is unreliable, so an accurate DED model is necessary for testing new treatment. A partial dacryoadenectomy produced a milder form of DED that will be useful for evaluating new treatments in future studies.
Category: Experimental Research

Keywords : Dry eye disease, partial dacryoadenectomy, benzalkonium chloride, epithelium
Dry eye disease (DED) is a common eye condition that can cause inflammatory response symptoms, such as redness, swelling, and pain. DED has been diagnosed in millions of people across the globe [1], and current eye drop remedies are insufficient for effective treatment. In order to provide the anti-inflammatory drug that patients need, a more reliable treatment with a controlled delivery method will be synthesized and evaluated, but a model for testing any novel treatments must be obtained. Two potential models of DED were compared: a partial dacryoadenectomy and a consistent benzalkonium chloride (BAK) administration. Fluorescein and lissamine green dyes were sufficient in vivo tests for this study, and histological stains, such as periodic acid Schiff and Hematoxylin and Eosin, were performed after sacrifice. All parameters measured in the histological models were analyzed through image analysis program QuPath. Careful analysis of obtained data revealed that, in comparison to the chemical model, the surgical model showed milder damage to the ocular surface, a milder reduction in epithelial thickness, and less cellular invasion into the epithelium. Therefore, it can be concluded that the surgical model produces a milder form of DED that is a more accurate representation of the DED for which new treatments will be evaluated.
1. INTRODUCTION
Dry eye disease (DED) is an extremely common eye condition that is reported to affect more than 16 million people in the United States alone [1] and is caused from either an inability to produce sufficient tears or a lipid deficiency within the tears that causes excessive evaporation off the ocular surface [2]. Lack of tears or a lipid deficiency produces an overly dry environment that leads to tear film instability, surface desiccation, and hyperosmolar stress on the surface. Desiccation has been identified as a potent stressor to the ocular surface that initiates an immune response, and hyperosmolar stress has a direct proinflammatory response on the ocular surface [3]. The innate immune response is physically reflected by symptoms of swelling, pain, and redness [3]. These irritable symptoms can develop into more serious eye conditions without proper treatment, such as corneal ulcers, abrasions of the corneal surface, and vision loss [4]. However, current eye drop treatments are unreliable and ineffective, so there is dire need for an effective and safe therapy. To test new therapies, an appropriate DED model is needed.
This study was aimed to determine the most effective DED model for future evaluations of new therapeutics, specifically evaluating a surgically induced and chemically induced model. Currently, there are multiple DED models with surgical or chemical induction [2]. Of these, a partial dacryoadenectomy procedure
9 Ingenium 2023
Cambell T. France
Bryan N. Brown
successfully induces aqueous deficiency that leads to DED [5]. On the other hand, a chemical model with direct administration of 0.1% benzalkonium chloride (BAK) also successfully induces tear film instability and a hyperosmolar surface [6]. To determine which model produces the DED severity that is most similar to the severity experienced in humans, the two aforementioned models were compared. From our initial literature review, it is clear that a partial dacryoadenectomy would lead to a milder case of DED than the complete dacryoadenectomy, as the palpebral and orbital lacrimal glands remain fully functional to provide tear film stability [6]. The direct chemical administration produced a severe case of DED, which was concluded based on the significant decrease in conjunctival goblet cell count and significant increases in fluorescein scores [6]. With this knowledge, we hypothesized that daily administration of 0.1% BAK to the ocular surface would result in a more severe DED case than performing a partial dacryoadenectomy.
2. METHODS
2.1 Animals
Four New Zealand White rabbits weighing between 2.70 kg and 3.95 kg were used, and all experiments were conducted under approved IACUC protocol 21027993. The rabbit model was chosen because the size of a human eye is comparable to a rabbit eye, and because the surgical procedure will be performed more accurately on larger animals. The surgical model and the chemical model served as the experimental groups. Naïve and healthy corneal tissue served as the negative control.
2.2. Induction of DED
2.2.1 Induction via Surgical Model
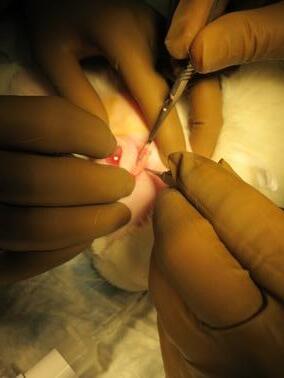
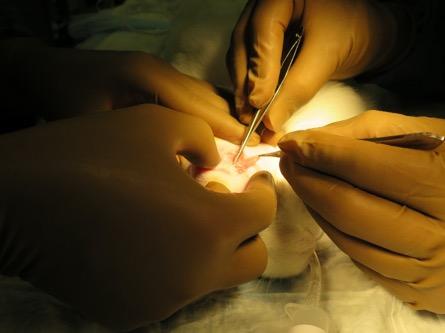
The surgical model involved the removal of the inferior lacrimal gland and the nictitating membrane by a partial dacryoadenectomy. Preserving the two superior glands, the palpebral and orbital glands, spares the rabbit from experiencing a severe case of DED [5]. DED developed fully in the ocular surface at three weeks post-surgery. Two rabbits endured the surgically induced method, and one rabbit had the partial dacryoadenectomy in its right eye, and the other had it in its left eye.
2.2.2 Induction via Chemical Model
The chemical model involved daily administration of 0.1% BAK directly into the eye [6]. The BAK was diluted in sterile saline. DED developed fully after one week of BAK application, and drop treatment continued until sacrifice at two weeks following the first BAK administration. Two rabbits endured the chemically induced dry eye, and the drops were administered to the right eye of one rabbit and to the left eye of the other.
2.3 Ocular Assessments
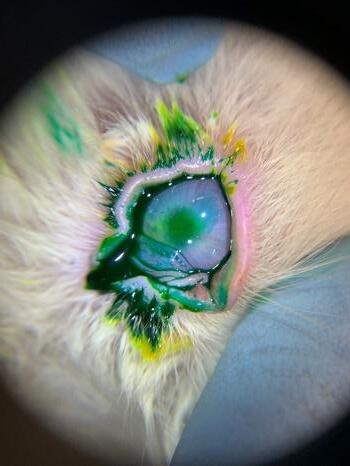
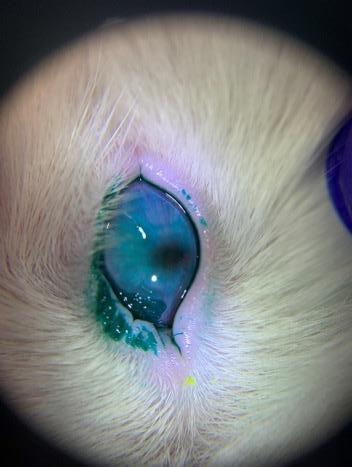
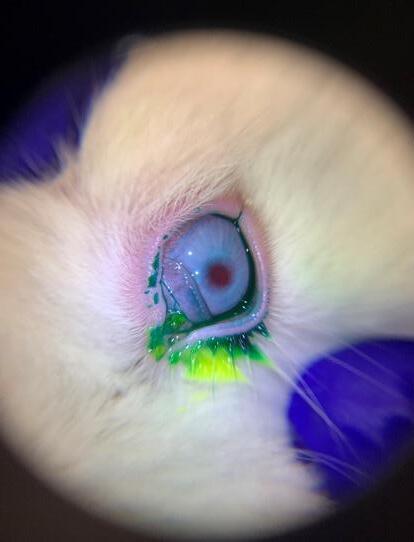
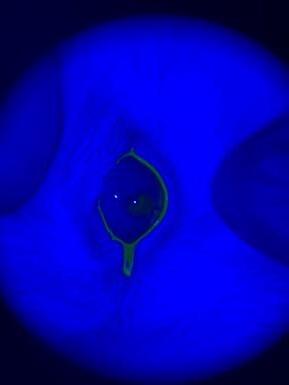
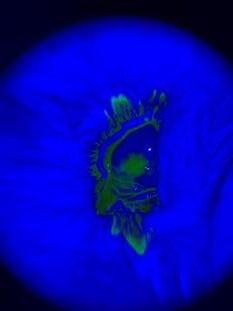
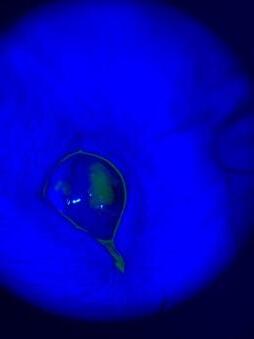
For both models, a baseline ocular assessment was taken before DED was induced. Further ocular assessments were taken to evaluate the severity of DED, which began at the time point at which DED had fully developed, and assessments continued every 3-4 days until the sacrifice. Fluorescein and lissamine green dyes were used to detect corneal damage (Figure 2). BioGlo Fluorescein Sodium Ophthalmic Strips (impregnated with 1 mg of fluorescein sodium) were used for the fluorescein stain, Green Glo Lissamine Green ophthalmic strips (impregnated with 1.5 mg of lissamine green) were used for the lissamine green stain. Both sets of ophthalmic strips were distributed by HUB Pharmaceuticals LLC. One drop of the dye was applied to each eye. The dye remained on the eye for one minute, and we manually blinked the rabbit’s eye to ensure that the dye evenly dispersed across the full surface area. After one minute, images were taken with a blue light for the fluorescein or white light for the lissamine.
10 Undergraduate Research at the Swanson School of Engineering
(a) Initial incision to remove glands and (b) inferior
a. b.
Naïve eye (a), eye with surgical method (b), eye second ocular assessment after baseline. Naïve eye (d), eye with surgical method (e), eye with chemical method (f) stained with lissamine green dye at the second ocular assessment after baseline.
2.4 Histological & Immunofluorescence Stains
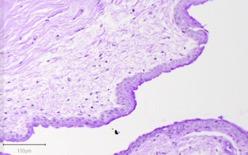
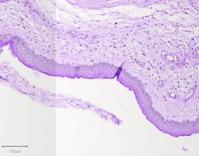
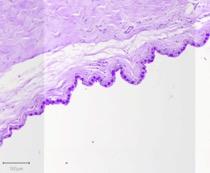

Immediately after sacrifice, the cornea was extracted from each eye to be used for histological assessments. The tissue was fixed in 10% Neutral Buffered Formalin (distributed by Epredia), embedded in paraffin, and sectioned appropriately before staining. Periodic acid Schiff was a key stain in this study that was used to detect the goblet cells in the conjunctiva.
Images were taken using a Motic EasyScan slide scanner, and the goblet cells were counted in QuPath, a bioimage analysis program. A simple cell counting tool was used to manually quantify the goblet cells. Furthermore, the tissue was stained with Hematoxylin & Eosin to evaluate the thickness of the central cornea epithelium and to evaluate the cellular invasion (Figure 4). Richard-Allan Scientific Modified Mayer’s Hematoxylin was used to stain the nuclei, and Shandon Eosin Y was used as the counterstain. Both stains were distributed by Thermo Fisher Scientific. Images were taken using a Motic EasyScan slide scanner. The thickness was measured by quantifying all the stratified epithelial cells in the central cornea normalized to unit length, and all measurements were performed in QuPath. A cell detector was used in the appropriate region of interest – the central cornea – to quantify the number of stratified epithelial cells, and the length was measured using the polyline tool. Cellular invasion was measured by determining the length by which the cells invaded the epithelium, and the polyline tool was used to take this measurement.
3. RESULTS
3.1 Corneal Damage
In both the surgical and chemical models, there was an intense green stain from the fluorescein and lissamine green dye (Figure 5a). A stronger stain intensity signifies corneal damage on the ocular surface, which suggests the presence of DED. Moreover, the cornea from the chemical model exhibited a more intense and more widely spread stain than the surgical model in both the fluorescein and lissamine green tests. On the other hand, naïve cornea exhibited a much less intense stain compared to both DED models, for both the fluorescein and lissamine green stain.
3.2 Goblet Cell Analysis

There was a loss in goblet cells in conjunctiva that experienced either of the DED inducing treatments when compared to the naïve conjunctiva (Figure 5b). The surgical model had a greater reduction of goblet cells than the chemical model.
11 Ingenium 2023
tear
Figure 3. PAS stain of goblet cells in naïve conjunctiva (a), surgical model (b), and chemical model (c).
a.
c.
b.
Figure 4. H&E stain of central cornea in surgical (left) and chemical (right) models.
a.
a.
d.
b.
e. c.
f.
b.
3.3 Central Cornea Thickness
In the chemical model, the thickness of the central corneal epithelium was thinner than that in the surgical model and naïve cornea (Figure 5c). However, the data suggests a less significant difference in central epithelium thickness in the naïve compared to the surgical model. Images also revealed that the epithelium from the chemical model looked torn apart.
3.4 Cellular Invasion
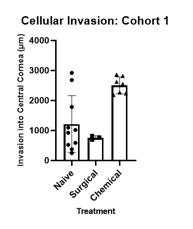
The chemical model experienced greater cellular invasion than the naïve and surgical model. This was determined by measuring the length to which the invading cells infiltrated into the central cornea. The invading cells extended about twice as far into the central cornea in the chemical model than the central cornea in the naïve or surgical model.
4. DISCUSSION
The increase in fluorescein dye intensity on the DED induced cornea correlates with the severity of a damaged cornea that would arise from DED. Because the chemical model had a more robust stain than the surgical model, it can be inferred that the chemical model produces a more severe DED than the surgical. Additionally, a more widely spread lissamine green stain was noticed on the rabbit eyes that experienced the chemical model. A more widely spread stain indicates significant corneal damage across a larger percentage of the total area of the ocular surface, which is indicative of a more severe case of DED.
The loss of conjunctival goblet cells correlates with an aqueous deficient ocular environment, thus can be used as a parameter for measuring the severity of DED. Innate immunity mediators combined with exposure to autoantigens leads to the T cell adaptive immune response, and T helper 1 cytokine, interferon gamma, promotes the death and disfunction of goblet cells [3]. A depletion of goblet cells causes a loss of mucin in the ocular surface, which is imperative to the stability of the tear film, as the lack of a tear film perpetuates the symptoms of DED. Both the surgical and chemical models exhibited a significant loss of goblet cells; therefore, DED is present in both models.
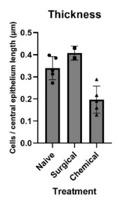


A much thinner central epithelium seen in the chemical model compared to the surgical suggests that a more severe DED develops from the chemical model. A reduced epithelial thickness in DED could be caused by the mechanical friction that the epithelial cells experience from excessive blinking [7]. Deficient tear production in the ocular surface eliminates the natural lubricant protecting the surface, thus enhancing the frictional damage that the epithelial cells endure as they interact with the eyelid. Therefore, an accurate measure of the perpetuation of DED on the ocular surface can be obtained by the epithelial thickness. An increase in cellularity signifies a severe case of DED in the chemical model. Additionally, the H&E images show cells invading the epithelium, and those are currently hypothesized to be immune cells. All epithelial changes that were analyzed contribute to the deterioration of the tear film stability and amplification of the inflammatory response [3].
Figure 5. (a) Fluorescein intensity comparison between naïve, surgical, and chemical model. (b) Goblet cell count between naïve, surgical method, and chemical method. (c) Thickness of the central cornea epithelium in the naïve cornea, surgical model, and chemical model. (d) Cellular invasion into the central cornea in the naïve, surgical, and chemical model.
12 Undergraduate Research at the Swanson School of Engineering
(a.) (b.) (c.) (d.)
5. CONCLUSION
By analyzing the corneal damage, goblet cell count, epithelial thickness, and differences in infiltrating cells, we found that the chemical model produces a more severe DED than the surgical model. With this data, we know to continue with the surgical model for the duration of this study. The chemical model caused excessive corneal damage and a deteriorating epithelium, which is too extreme for our purposes. A model that is too severe will have more difficulty responding to the new treatments, and we need to see this response to assess the effects of the new treatment on the ocular surface within a reasonable time range. Removing the inferior lacrimal gland by a partial dacryoadenectomy on the rabbit eyes will be the best animal representation of DED in humans.
6. ACKNOWLEDGEMENTS
I would like to acknowledge team members Clint Skillen and Arijit Dutta for their guidance and help throughout the process. Funding was provided by the Swanson School of Engineering and the Office of the Provost at the University of Pittsburgh.
REFERENCES
[1] S. Aggarwal, A. Galor. “What’s new in dry eye disease diagnosis? Current advances and challenges,” National Library of Medicine, F1000Res. 7, F1000 Faculty Rev-1952, 2018. [Online]. Available: https:// www.ncbi.nlm.nih.gov/pmc/articles/PMC6305205/. [Accessed August 10, 2022].
[2] N. Li, et al. “Establishment of the mild, moderate, and severe dry eye models using three methods in rabbits,” BMC Ophthalmology, 13, 50, 2013. [Online]. Available: https://bmcophthalmol.biomedcentral. com/articles/10.1186/1471-2415-13-50. [Accessed August 15, 2022].
[3] S. Pflugfelder, C. de Paiva. “The Pathophysiology of Dry Eye Disease: What We Know and Future Directions for Research,” PMC Ophthalmology, 124(11S), S4-S13, 2017. [Online]. Available: https:// pubmed.ncbi.nlm.nih.gov/29055361/. [Accessed November 4, 2022].
[4] “Dry Eyes,” Mayo Clinic. [Online]. Available: https:// www.mayoclinic.org/diseases-conditions/dry-eyes/ symptoms-causes/. [Accessed November 8, 2022].
[5] D. Bhattacharya, et al. “Tear Production After Bilateral Main Lacrimal Gland Resection in Rabbits,” Invest Ophthalmology, Vis Sci. 56, 7774–7783, 2015. [Online]. Available: https://iovs.arvojournals.org/ article.aspx?articleid=2474988. [Accessed August 15, 2022].
[6] C. Xiong, et al. “A rabbit dry eye model induced by topical medication of a preservative benzalkonium chloride,” Invest Ophthalmology, Vis Sci. 49(5), 1850-6, 2008. [Online]. Available: https://pubmed.ncbi.nlm. nih.gov/18436819/. [Accessed August 15, 2022].
[7] X. Cui, et al. “Assessment of Corneal Epithelial Thickness in Dry Eye Patients,” Optometry and Vision Science, 91(12), 1446-54, 2014. [Online]. Available: https://pubmed.ncbi.nlm.nih.gov/25279779/. [Accessed August 16, 2022].
13 Ingenium 2023
PEG-reinforced Gelatin Scaffold Promotes Uniform Chondrogenesis of Human MSCs
Alyssa Aguglia1,2 , Kanyakorn Riewruja2,3 , Hang Lin2
1 Department of Bioengineering, University of Pittsburgh.
2 Department of Orthopaedic Surgery, University of Pittsburgh.
3 Osteoarthritis and Muscoskeletal Research Unit, Chulalongkorn University.
Alyssa Aguglia is a senior bioengineer with a minor in chemistry. She is currently working as an undergraduate research assistant in Dr. Lin’s lab in the Department of Orthopaedic Surgery. After graduating in Spring 2023, Alyssa hopes to apply her research experience and engineering background to a career in the biotechnology industry.

Dr. Lin is an assistant professor (tenure track) working in the Department of Orthopaedic Surgery. His research interests are to understand the relationship between aging and osteoarthritis (OA), develop diseasemodifying drugs to treat OA, and regenerate articular cartilage through tissue engineering strategy. Currently, Dr. Lin is supported by both internal and external grants, including several ones from the NIH.

Significance Statement
Current treatments for articular cartilage damage do not completely restore the original structure and function. In this study, we used tissue engineering approaches to create cartilage constructs from adult stem cells, which display a mechanical strength similar to native cartilage as well as uniform matrix distribution. The engineered cartilage from this study represents a robust method for the repair of chondral injury.
Category: Experimental Research
Keywords : chondrogenesis, migration, cartilage, scaffolds
Abbreviations: polyethylene glycol (PEG), human bone marrow-derived mesenchymal stem cell (hBMSC), gelatin methacrylate (GelMA), hyaluronic acid (HA), GelMA+HA (GH), immunohistochemistry (IHC), glycosaminoglycan (GAG)
ABSTRACT
Articular cartilage damage causes pain, inflammation, and immobility to those who suffer from it. Current treatments are limited and remain unpredictable. As a result, our lab previously used gelatin methacrylate (GelMA) combined with hyaluronic acid (HA) in a 9:1 ratio to make cartilage constructs as a potential solution. However, there is a limited deposition of glycosaminoglycans (GAG) in the central areas of these constructs compared to the margin areas. To correct this, we investigated using polyethylene glycol (PEG) to reinforce the scaffolding while promoting robust chondrogenesis of the human bone marrow-derived mesenchymal stem cells (hBMSCs) throughout the scaffold. This finding is significant because GAGs contribute to the material’s mechanical strength as well as assist in biological processes. We hypothesized that the impregnation of PEG would promote GAG production in the central areas of GH scaffolds. Results showed that infiltration of PEG at the beginning of chondrogenesis significantly increased the deposition of GAG in the central area. To explore the mechanism, we compared the cell migration and proliferation in the margin and central areas of GH and PEG-infiltrated GH scaffolds (GH+PEG). Limited cell migration was noticed in both groups, but more proliferating cells were observed in GH than in GH+PEG. This study furthers the research being conducted to create cartilage constructs that are compatible with native cartilage in order to further articular cartilage damage treatment.
1. INTRODUCTION
Articular cartilage damage is typically caused by injury or degenerative diseases such as osteoarthritis. It affects thousands of Americans [1]. People suffering from articular cartilage damage typically suffer from chronic pain and inflammation [2]. Due to the nature of articular cartilage damage, it can even cause decreased mobility. Current treatment options such as autologous chondrocyte implantation (ACI), microfracture, and osteochondral transplants are unable to completely repair the cartilage’s structure and function [2]. ACI repair, specifically, has become increasingly popular due to more favorable outcomes than other methods; however, it is limited by cell availability and injury to the donor site. Tissue engineering introduces the possibility of making cartilage constructs that could be used to treat articular cartilage damage because it would deliver cells directly to the injury site while adhering to the environmental conditions of articular cartilage. This would provide a solution similar to ACI repair without its limitations. An ideal scaffold would provide the proper microenvironment for cell growth and proliferation as well as promote tissue integration.
Previously, a gelatin-based scaffold was used to induce chondrogenic differentiation of human bone marrowderived mesenchymal stem cells (hBMSCs) [3]. Studies
Ingenium 2023
Alyssa Aguglia
14
Hang Lin
done in our lab, have shown that gelatin supports hBMSC differentiation, which makes it a desirable material for the scaffold. hBMSCs were chosen as an alternative to native chondrocytes because they are easier to isolate, have greater proliferation potential, and provide more advantages in terms of trophic effects for chondrocyte regeneration. In these studies, hBMSCs underwent robust chondrogenesis and generated a cartilage matrix. However, this newly formed cartilage matrix displayed a non-uniform distribution of cells. This was shown by decreased glycosaminoglycan (GAG) staining in the center of the scaffold when compared to the margin. GAGs are an important component of the extracellular matrix (ECM), making this finding significant. In cartilage, GAGs contribute to the tissue’s mechanical strength as well as tissue hydration, cell proliferation, cell signaling, and regulation of growth factors and inflammatory factors. The possible reason for decreased staining in the center was cellular migration from central areas toward margin areas. In this study, we aimed to inhibit this cell migration while still allowing cells to undergo chondrogenesis. To do this, polyethylene glycol (PEG) was infiltrated into hBMSC-laden gelatin-hyaluronic acid (GH) scaffolds and then photo-crosslinked. The constructs were then cultured in chondrogenic medium to form cartilage. We expected the encapsulation of PEG to reinforce the mechanical properties of gelatin hydrogel and promote uniform chondrogenesis.
2. MATERIALS AND METHODS
2.1 Preparation of Scaffold Materials
PEG was purchased (AdvancedBiomatrix, Carlsbad, CA). Phosphate buffered saline (PBS) (Invitrogen) was used to make 20% PEG solution. 0.15% (w/v) lithium phenyl2,4,6-trimethylbenzoylphosphinate (LAP) was added as the photoinitiator. Gelatin methacrylate (GelMA) was synthesized according to a procedure previously developed in our lab [4]. Gelatin (Sigma-Aldrich, St. Louis, MO) was fully dissolved in deionized H2O in a shaker at 37°C, and methacrylic anhydride was then added. The mixture was placed in a 37°C shaker at 150 rpm for 24 hours and dialyzed for 4 days against H2O at room temperature using 2,000 NMWCO dialysis tubing (Sigma-Aldrich). After lyophilization, the GelMA product was stored in a desiccator for future use. Photocrosslinkable Hyaluronic acid (HA, 100-150 kDa) powder was purchased (AdvancedBiomatrix). Previous studies showed that when used in a 9:1 ratio with GelMA, HA was shown to stimulate chondrogenesis while also increasing the scaffold’s mechanical properties [5]. Hybrid hydrogel (GelMA/HA or GH) was created by dissolving in Hank’s Balanced Salt Solution (HBSS) at (GelMA:HA,w/v) 9:1. The photoinitiator, LAP, was then added (0.15% w/v) and mixed until fully dissolved [6].
2.2 Preparation of Scaffolds
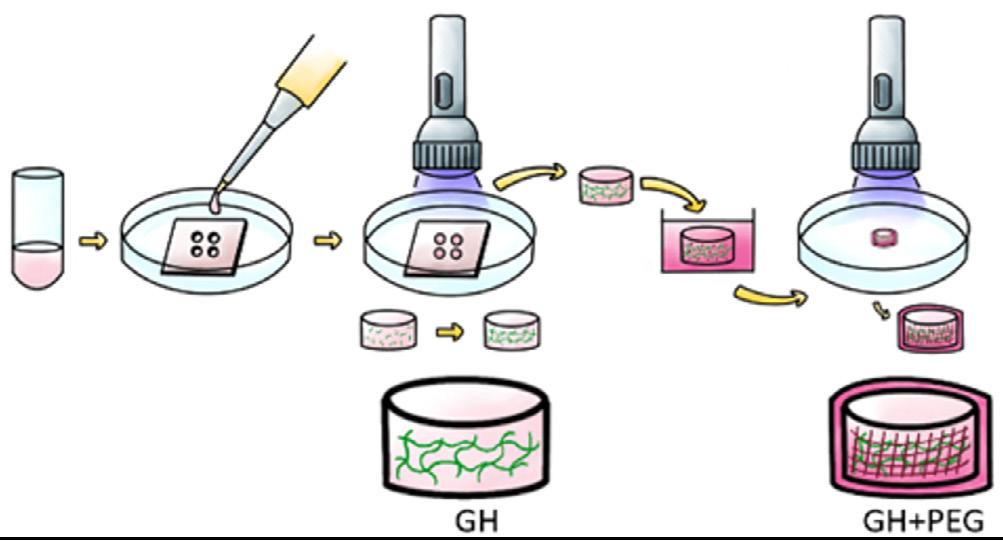
The process of impregnating PEG into GH is shown in Figure 1.
To generate cartilage tissues, hBMSCs were first encapsulated into GH scaffold through photocrosslinking both sides of the scaffold and then subjected to chondrogenic medium culture (DMEM with high glucose, 1% penicillin-streptomycin, 0.1 mM dexamethasone, 50 mg/mL ascorbate-2-phosphate, 40 mg/mL L-proline (Sigma-Aldrich), 1×insulintransferrin-selenium (Invitrogen), and 0.5 ng/mL TGF-β3). Previous studies showed that when used in a 9:1 ratio with GelMA, HA was shown to stimulate chondrogenesis while also increasing the scaffold’s mechanical properties [6]. At different time points, the constructs were soaked into uncured 20% PEG solution for 5 minutes and crosslinked for 1.5 minutes from just the top of the scaffold [1]. This amount of time is long enough to cure the entire scaffold, and we do not expect structural differences between the two sides. The scaffolds were collected, fixed, and then embedded in SurgiPath Cryo-Gel on day 28 for histological analyses.
2.3 Histological Analysis
The embedded scaffolds were cryo-sectioned using a cryotome to obtain 12 um sections, and the slides were stained using immunohistochemistry and Safranin O staining. To measure proliferation, immunohistochemistry staining was performed for the commonly used proliferation marker ki67.
The samples were counter-stained with hematoxylin. Images of the central and margin areas of the sections were taken.
15 Ingenium 2023
Figure 1. Process of making scaffolding. Cells are first suspended in GH solution. They are then added to the proper mold and crosslinked on the top and bottom using UV light to make GH scaffolds. To make GH+PEG scaffolds, GH scaffolds are then dipped in PEG solution for 5 minutes and then crosslinked again from just the top.
2.4 Cell Migration
To examine cell migration, hBMSCs were then labeled separately in DiO (green) and DiI (red). Fluorescent dye was introduced to the cells in culture at least 1 day before the creation of the scaffolds. The cells labeled with DiI dye were suspended in GH, added into a 5 mm circular mold, and then photocrosslinked using ultraviolet (UV) light for 1.5 minutes on the top of
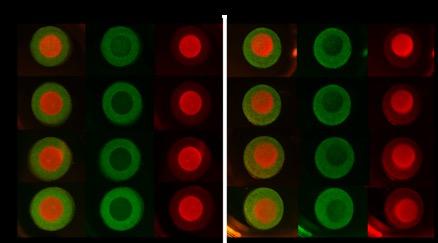
Half of the constructs were dipped into PEG solution and formed or GH+PEG mold
loaded with DiO dye-labeled hBMSCs were added and photocrosslinked. Live images were taken on days 0, 7, 14, and
3. RESULTS
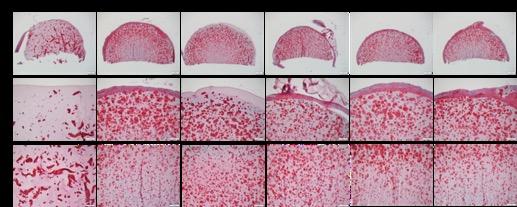
After 28 days of chondrogenesis, an equal amount of GAG staining was observed in both the edge and central areas of the PEG-GH groups when compared to the control as shown in Figure 2. This is indicated by the uniform distribution of red GAG signal in both the central and margin areas of the GH+PEG scaffold in Day 0. In contrast, significantly more matrix was deposited in the margin area of GH scaffolds than in the central area. This is also seen in Figure 2 where the GH group has a greater concentration of red staining in the margin area compared to the center.
We next examined whether more cells migrated from the central area to the margin area. To observe this, we expected to see movement of red fluorescently labeled cells into the marginal area of green fluorescently labeled cells over the course of the experiment. Surprisingly, in the cell migration model that we created here, we did not observe cells crossing from the disc to the ring, or vice versa (Figure 4).
Next, we examined if the difference in cell proliferation accounted for the variable GAG distribution in different scaffolds. As shown in Figure 3, cells positive for ki67 display a red/brown signal. Cells in the margin and central areas of GH samples displayed high and similar proliferation potential, indicated by ki67 IHC. In the GH+PEG group, there were fewer ki67 positive cells in the center area than the margin area.


16 Undergraduate Research at the Swanson School of Engineering
Figure 2. PEG was incorporated into GH scaffolding at different days. The red indicates the presence of GAGs. PEG infiltration on DAY0 displays uniform GAG distribution whereas the GH group has a greater signal in the margin. The scale bar = 500 um in the top row and 200 um in the middle and bottom row.
Figure 3. IHC staining of ki67. Red/brown coloring indicates ki67 signal. The GH group displays high proliferation in the margin and the center. The GH+PEG group has less signal in the central area than the margin, indicating less proliferation in the center. The scale bar = 50 um.
Figure 4. Live images from Part 2 of the study. Both the GH and the GH+PEG group saw little migration of red labeled cells into the outer ring of green labeled cells. Magnification is 4x.
4. DISCUSSION
The goal of this study was to produce cartilage constructs that could potentially be used in the treatment of articular cartilage damage. Tissue engineering requires that the artificial tissue meet the mechanical and environmental requirements of the native tissue. The GH+PEG group shows a more uniform distribution of cells while still promoting chondrogenesis. This finding is supported by Kuang et al in which the use of PEG to supplement scaffolding was investigated [1]. These findings are promising for a future tissue engineering-based treatment option. In addition to producing viable cartilage constructs, we also wanted to investigate the reason for decreased cell density in the center of the GH scaffolding. Our initial results from the GH scaffolding were consistent with Wu et al in which they found that a hollow cavity formed in scaffolding larger than 2 mm [7]. Infiltrating with PEG improved this issue leading us to hypothesize that migration from the central areas to the margin areas of the scaffolding was responsible. From our current migration models, we saw minor indications of cell migration but they were not significant enough to conclude that there was migration. IHC staining for ki67, also showed minor differences between the GH and GH+PEG groups. To assert that proliferation is responsible, we would have needed to observe less proliferation in the center of the GH scaffold, providing an explanation for the decreased GAG staining. Instead, we saw decreased proliferation in the center of the GH+PEG group. This observation leads us to believe that migration is still behind decreased cell density in the center of the scaffolding. In order to demonstrate this, we aim to modify our migration model. In the current model, we made the ring and disc separately in order to label cells with different colors to track their potential movement. Therefore, there was a physical barrier between the two scaffolds, which may have potentially limited cell migration.
5. CONCLUSIONS
Infiltration with PEG, especially on Day 0, demonstrated a more uniform matrix deposition compared to just the GH group. Increased matrix deposition indicated a more uniform distribution of cells which led us to investigate the cause of this observation. IHC staining indicated that there was more proliferation in the center of the GH scaffolds than the center of the GH+PEG scaffolds which led us to conclude that the decreased GAG staining in the GH group was not a result of decreased proliferation. There was not a significant amount of migration in our model. The physical barrier between the green labeled cells and the red labeled cells along with the results from the proliferation tests, led us to believe that migration may still be the cause of decreased GAG staining. To further support this, we will also perform IHC staining for degradation markers to rule out other causes of decreased matrix deposition. While we do acknowledge that the scaffolds may prevent a certain level of migration, we do believe if we modify our migration model, we will be able to observe the cellular migration from the center of the scaffolding to the margin areas. In order to observe this, we will use live-cell-imaging to monitor the cell movement in the scaffolds.
6. ACKNOWLEDGEMENTS
Funding was provided by the Swanson School of Engineering at the University of Pittsburgh, the Office of the Provost, the Department of Bioengineering, and Hang Lin.
17 Ingenium 2023
REFERENCES
[1] B. Kuang, Y. Yang, H. Lin, “Infiltration and in-tissue polymerization of photocross-linked hydrogel for effective fixation of implants into cartilage – an in vitro study,” in ACS Omega. National Library of Medicine, [online document], 2019. Available: National Library of Medicine, https://www.ncbi.nlm. nih.gov/pmc/articles/PMC6854571/ [Accessed Nov. 5, 2022].
[2] A. Vahdati, Y. Zhao, T. Ovaert, D. Wagner, “Computational investigation of fibrin mechanical and damage properties at the interface between native cartilage and implant,” ASME. Journal of Biomechanical Engineering, vol. 134, no. 11, November, 2012. [Online Serial]. Available: https:// doi.org/10.1115/1.4007748. [Accessed Oct. 30, 2022].
[3] S. Xiang, Z. Li, M. Fritch, L. Li, S. Velankar, Y. Liu, J. Sohn, N. Baker, H. Lin, R. Tuan, “Caveolin-1 mediates soft scaffold-enhanced adipogenesis of human mesenchymal stem cells,” Stem Cell Research & Therapy, vol. 347, no. 12, April, 2021. [Online Serial]. Available: https://rdcu.be/cZygb. [Accessed Oct. 30, 2022].
[4] H. Lin, A. W. Cheng, P. G. Alexander, A. M. Beck, R. S. Tuan, “Cartilage tissue engineering application of injectable gelatin hydrogel with in situ visible-lightactivated gelation capability in both air and aqueous solution,” Tissue Eng Part A, vol. 20, no. 17-18, Apr., pp. 2402-2411, 2014. https://www.ncbi.nlm.nih.gov/ pmc/articles/PMC4161187/ [Accessed Jan. 8, 2022].
[5] H. Lin, A. Beck, K. Shimomura, J. Sohn, M. Fritch, Y. Deng, E. Kilroy, Y. Tang, P. Alexander, R. Tuan, “Optimization of photocrosslinked gelatin/hyaluronic acid hybrid scaffold for the repair of cartilage defect,” J Tissue Eng Regen Med. National Library of Medicine, [online document], 2019. Available: National Library of Medicine, https://www.ncbi.nlm. nih.gov/pmc/articles/PMC6739828/ [Accessed Nov. 2, 2022]
[6] H. Lin, A. M. Beck, K. Shimomura, J. Sohn, M. R. Fritch, Y. Deng, E. J. Kilroy, Y. Tang, P. G. Alexander, R. S. Tuan, “Optimization of photocrosslinked gelatin/ hyaluronic acid hybrid scaffold for the repair of cartilage defect,” J Tissue Eng Regen Med, vol. 13, no. 8, Aug., pp. 1418-1429, 2019. https://pubmed.ncbi. nlm.nih.gov/31066519/ [Accessed Jan. 10, 2022].
[7] Y. Wu, L. Zhu, H. Jiang, W. Liu, Y. Cao, G. Zhou, “Engineering cartilage substitute with a specific size and shape using porous high-density polyethylene (HDPE) as internal support,” Journal of Plastic, Reconstructive, & Aesthetic Surgery, vol. 63, no. 4, April, 2010. [Abstract]. Available: National Library of Medicine, https://pubmed.ncbi.nlm.nih. gov/19945928/. [Accessed Nov. 11, 2022].
18 Undergraduate Research at the Swanson School of Engineering
THP-1 Macrophages Influence SNAP CAR-T Cell Infiltration in the Tumor Microenvironment
Jacob Antonello1,2 , Ioannis Zervantonakis1,2
1 Tumor Microenvironment Engineering Laboratory,
2 Department of Bioengineering, University of Pittsburgh
Jacob Antonello grew up in Blue Bell, PA, just outside of Philadelphia. His research interests include cellular and tissue engineering, biomaterials, and cancer biology. He plans to pursue a PhD in bioengineering after graduation.


ABSTRACT
Ioannis Zervantonakis was born in Athens (Greece), completed his BS in Mechanical Engineering, PhD in Mechanical/Biological Engineering and postdoc fellowship in Cancer Biology. His lab is interested in developing microfluidics- and systems biology-based approaches to understand how cancer cells interact with their environment.
Significance Statement
Improved prognosis has been demonstrated in ovarian cancer patients who have an increased T cell presence in the tumor microenvironment (TME). Since tumorassociated macrophages are known to influence T cell function, determining their effect on T cell migration is beneficial. These experiments investigated the ability of macrophages to elicit T cell infiltration into the TME.
Category: Experimental Research
Keywords: Ovarian cancer, T cell, tumor associated macrophages, tumor microenvironment, immune infiltration
Abbreviations: chimeric antigen receptors (CAR), tumor-associated macrophages (TAMs), tumor microenvironment (TME)
The National Cancer Institute estimates that approximately 20,000 cases of ovarian cancer will be diagnosed in the United States in 2022, with over 12,000 deaths resulting from the disease. Clinical research has demonstrated that the presence of CD8+ T cells in the tumor microenvironment (TME) leads to improved prognosis in ovarian cancer patients. Additionally, tumor-associated macrophages are known to affect T cell cytotoxicity and migration. These experiments evaluated the ability of macrophages to elicit SNAP CAR-T cell infiltration into the TME and analyzed SNAP CAR-T cell infiltration towards M0/M1/ M2 polarized macrophages. SNAP CAR-T cells are used in these experiments since they can be used as a model for T cell migration. M1 macrophages are polarized to be pro-tumorigenic while M2 macrophages are polarized to be anti-tumorigenic. M0 macrophages are unpolarized. The study found an increased infiltration of T cells towards THP-1 macrophages indicating that THP-1 macrophages may secrete a chemokine responsible for attracting T cells. This research also indicates that a high number of M2 macrophages compared to M0 and M1 macrophages could lead to fewer CD8+ T cells infiltrating into the TME.
1. INTRODUCTION
In the United States, the National Cancer Institute estimates that approximately 20,000 new cases of ovarian cancer will be diagnosed in 2022, with over 12,000 deaths resulting from the disease. The most current statistics demonstrate a 5-year relative survival rate of 49.7% for women diagnosed with ovarian cancer [1].
Research on ovarian cancer has indicated the prognostic importance of CD8+ T cells in the tumor microenvironment (TME), with intratumoral T cell presence associated with improved clinical outcomes in advanced epithelial ovarian cancer patients [2]. T cell function is greatly influenced by crosstalk with other immune cells, particularly macrophages [3]. Circulating monocytes and tissue-resident macrophages recruited into the TME are often differentiated to tumorassociated macrophages (TAMs) and can become polarized towards an M1 “anti-tumorigenic” or M2 “pro-tumorigenic” phenotype that influences their chemokine release profiles [4].
Tumor-associated M2 macrophages have been shown to enhance tumor progression and inhibit CD8+ cell cytotoxicity and proliferation [3]. On the other hand, M1 macrophages can induce tumor cell killing by upregulating the release of cytotoxic molecules by T cells [5]. The effect of macrophages on T cell function may also include increased or decreased T cell migration, due to altered chemotactic signaling profiles for different macrophage polarization phenotypes. [3]. SNAP CAR-T cells are a population of CD8+ and CD4+ T cells containing a receptor capable of
19 Ingenium 2023
Jacob Antonello
Ioannis Zervantonakis
targeting a specific antigen. They are utilized without a specific antigen in these experiments to simulate the T cells found within the human body. Here, we aim to investigate the ability of macrophages to elicit T cell migration into the TME. Understanding the mechanism of how macrophage polarization affects T cell infiltration can help inform future cancer treatments utilizing the cytotoxic ability of T cells.
2. METHODS
2.1 Cell Culture
THP-1 monocytes were differentiated into macrophages by exposure to 25 ng/mL PMA over 24 hours. Macrophages were allowed to recover for 48 hours in fresh 10% FBS RPMI 1640 media to normalize their chemokine profiles. Ovarian cancer cell lines (OVCA432, OVCAR3, OVCAR8) and THP-1 macrophages were seeded into a 3D collagen type I matrix droplet assay to simulate the extracellular matrix in the TME. Macrophages were seeded at densities of 0.2e6 cells/ mL, 1e6 cells/mL, and 5e6 cells/mL in monoculture. Cancer cells were seeded in monoculture at a density 1e6 cells/mL and were also seeded in co-culture with macrophages, with both cells at a density of 1e6 cells/ mL. Collagen was prepared with NaOH, PBS, and water for optimal stiffness and pH as defined by previous experiments studying SNAP CAR-T cell infiltration. After seeding, collagen droplets were then incubated for 30 minutes at 37°C to acquire stiffness. SNAP CAR-T cells were stained with CellTracker CMFDA dye (Thermo Fisher Scientific Inc., Waltham, MA). Each droplet was surrounded with media containing 25,000 stained T cells that were allowed to infiltrate into the collagen for 24 hours (Fig 1).
An experiment was also performed to analyze SNAP CAR-T cell infiltration towards M0/M1/M2 polarized macrophages seeded into collagen droplets. THP-1 macrophages were polarized towards an M1 phenotype via exposure to 20 ng/mL IFN-γ and 100 ng/mL LPS over 48 hours. Macrophages were polarized towards an M2 phenotype via exposure to 20 ng/mL IL-4 and 20 ng/mL IL-13 over 48 hours. M0 macrophages were exposed to media only. All conditions were seeded at a density of 1e6 cells/mL. All experiments seeded 25,000 T cells into each well and included three technical replicates.

2.2. Time-Lapse Imaging
Time-lapse images were taken using the Zeiss LSM700 confocal microscope (Zeiss, Germany) and live cell incubation system (Tokai Hit USA Inc, Bala Cynywd, PA). T cell infiltration after 24 hours was quantified using ImageJ TrackMate software.
2.3 Data Processing
One-way ANOVA followed by Tukey’s multiple comparison test was performed using GraphPad Prism version 9.4.0 for Windows to assess differences between conditions.
3. RESULTS
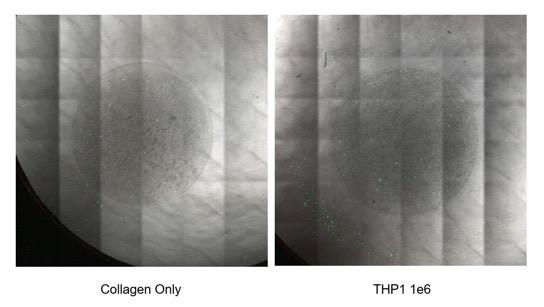
Time-lapse images of the collagen droplets taken via confocal microscope show T cell infiltration after 24 hours (Figure 2). A greater number of T cells, appearing in green, are seen within the boundary of the collagen droplet when THP-1 macrophages were seeded in the droplet.
20 Undergraduate Research at the Swanson School of Engineering
Figure 1. Schematic illustrating collagen droplet infiltration assay procedure utilizing a 96-well plate. T cells are allowed to adhere to the bottom of the plate and infiltrate into the collagen droplet over a 24-hour period.
Figure 2. Time-lapse images taken via confocal microscope show T cells, which appear in green, infiltrated more towards THP-1 cells than gel only.
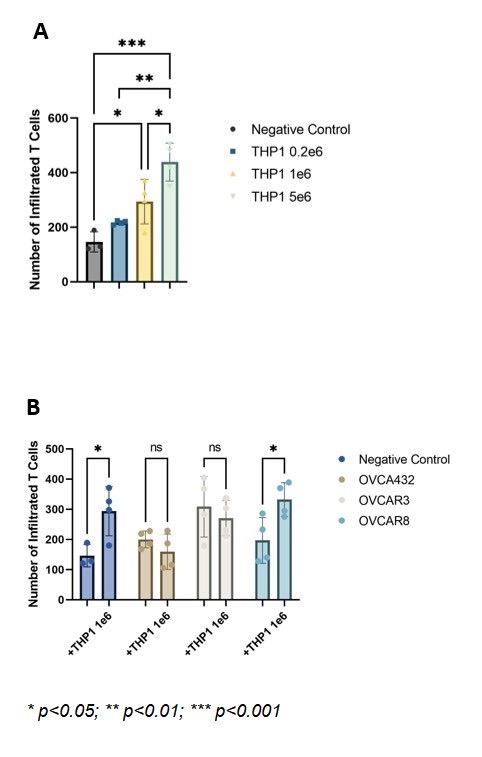
SNAP CAR-T cell infiltration increased significantly when THP-1 cells were added to the collagen droplet at a density of 1e6 cells/mL compared to negative control (Figure 3A, 3B). Furthermore, there was a significant increase in infiltrated T cells when this density was increased fivefold. T cell infiltration was also slightly increased towards cancer cells seeded in the collagen droplet (Figure 3B). The combination of macrophage and cancer cell seeding had differing results depending on the cancer cell line used, with OVCA432 and OVCAR3 displaying no increase in infiltration compared to cancer cells alone and OVCAR8 having significantly increased infiltration compared to cancer cells alone (Figure 3B).
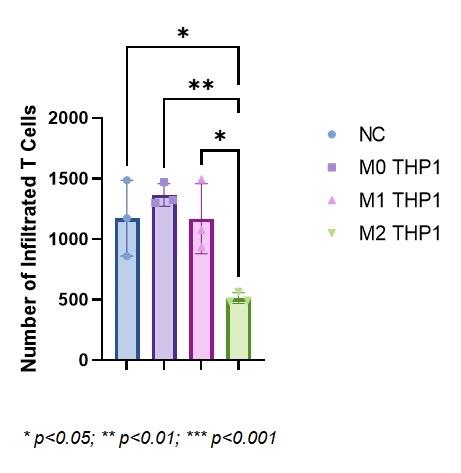
Droplets containing M2 macrophages displayed a significant decrease in infiltration compared to negative control droplets, droplets containing M0 macrophages, and droplets containing M1 macrophages (Figure 4). There was no significant difference between M0 and M1 macrophage conditions. This experiment was quantified to have higher infiltration overall, particularly for the negative control condition.
Figure 3. A) T cell infiltration increases with THP-1 seeding density with highest number of infiltrated T cells for 5e6 cells/ mL macrophage density. B) T cell infiltration increases when adding THP-1 macrophages to OVCAR8 cells. There is no significant difference in T cell infiltration when macrophages added to OVCA432, OVCAR3 cells. Experiments conducted with four technical replicates.
Figure 4. SNAP CAR-T cell infiltration is decreased towards M2-polarized macrophages compared to M0/M1 macrophages and negative control. Experiments conducted with three technical replicates.
4. DISCUSSION
Experiments demonstrated an increased infiltration of T cells as the density of THP-1 macrophages within the collagen droplet increased, indicating that macrophages display a role in encouraging T cell infiltration into the TME. THP-1 macrophages may secrete a chemokine responsible for attracting T cells which leads to increased infiltration. Macrophages in co-culture with OVCAR8 cancer cells resulted in increased T cell infiltration, which could be due to secretion of chemokines by both cell types enhanced by crosstalk between macrophages and cancer cells. Macrophages in co-culture with OVCA432 and OVCAR3 cancer cells did not result in increased infiltration. This result could be due to factors inhibiting T cell migration released by cancer cells or macrophage polarization towards an M2 phenotype. M2 TAMs could in turn lower T cell recruitment into the TME.
21 Ingenium 2023
This research also indicates that a high number of M2 macrophages compared to M0 and M1 macrophages could lead to fewer CD8+ T cells infiltrating into the TME. This may lead to reduced cancer cell killing ability and worse clinical outcomes. M1 macrophages did not increase T cell recruitment as might be expected. Experiment should be repeated due to high infiltration of control. Additional experiments should be done to verify the polarization state of M1 and M2 macrophages using current polarization protocol.
5. CONCLUSIONS
The results of this research demonstrate that macrophages are a key regulator of T cell migration, providing a potential pathway that macrophage polarization towards a pro-tumorigenic phenotype leads to worse clinical outcomes. Specifically, tumorassociated macrophages polarized towards an M2 phenotype might reduce T cell migration into the TME, hindering the ability of the immune system to target and destroy cancer cells. Future treatments could focus on preventing pro-tumorigenic polarization of macrophages or upregulating expression of chemokines that lead to T cell migration in tumorassociated macrophages. However, further investigation is needed to isolate the chemokine(s) released by macrophages that attract T cells and to study the effect of macrophage polarization on chemokine expression. Furthermore, experiments should be repeated with primary T cells to normalize negative control of T cell infiltration between experiments.
6. ACKNOWLEDGEMENTS
Funding for this project was provided by the Swanson School of Engineering, the Office of the Provost, and the Department of Bioengineering at the University of Pittsburgh. Special thanks to Diana Kulawiec, Ruxuan Li, and the other members of the Zervantonakis lab for their support. Schematic created using BioRender.
REFERENCES
[1] National Institute of Health, National Cancer Institute. Surveillance, Epidemiology, and End Results Program (SEER). “Cancer Stat Facts: Ovarian Cancer”. [Online].Available: https://seer.cancer.gov/ statfacts/html/ovary.html [Accessed Oct. 27, 2022].
[2] Gimotty PA, Massobrio M, Regnani G, Makrigiannakis A, Gray H, Schlienger K, Liebman MN, Rubin SC, Coukos G. “Intratumoral T cells, recurrence, and survival in epithelial ovarian cancer”, N Engl J Med. 348(3):203-213, 2003.
[3] DeNardo DG, Ruffell B. “Macrophages as regulators of tumour immunity and immunotherapy”, Nat Rev Immunol. 19(6):369-382, 2019.
[4] Nowak M, Klink M. “The Role of TumorAssociated Macrophages in the Progression and Chemoresistance of Ovarian Cancer”, Cells. 9(5):1299, 2020.
[5] Pan Y, Yu Y, Wang X, Zhang T. “Tumor-Associated Macrophages in Tumor Immunity”, Front Immunol. 11:583084, 2020.
22 Undergraduate Research at the Swanson School of Engineering
Directivity of Focused Shear Wave Beams in Soft Elastic Media
Yu-hsuan Chao1, John M. Cormack 2 , Kang Kim1,2

1 Department of Bioengineering, University of Pittsburgh
2 Department of Medicine, University of Pittsburgh
Yu-hsuan Chao is a senior bioengineering student at the University of Pittsburgh with a concentration in image processing. She aspires to study the biomechanics of soft tissue in the future. Yu-hsuan plans to pursue her education and bioengineering research by attending graduate school.

John Cormack is a research faculty member in the Department of Medicine at the University of Pittsburgh, where he works in the Multi-modality Biomedical Ultrasound Imaging Laboratory. His research interests include ultrasound elasticity imaging, cardiac and skeletal muscle biomechanics, shear wave elastography, and nonlinear acoustic and elastic wave propagation.

Kang Kim, PhD is an Associate Professor of Bioengineering and Medicine at the University of Pittsburgh. Dr. Kim directs the Multimodality Biomedical Ultrasound Imaging Laboratory focused on basic science, pre-clinical studies and clinical translation of medical instrumentation, signal/image processing algorithms and imaging contrast/therapeutic agents.
Significance Statement
Nonalcoholic fatty liver disease (NAFLD) is prevalent in our population. Noninvasive assessment of NAFLD using ultrasound shear wave elastography is limited by penetration depth of the shear wave. Our new technology of focused shear waves directs the wave energy deep into the tissue, thus increasing imaging depths compared to current clinical technology.
Category: Experimental Research
Keywords : Ultrasound elasticity imaging, Focused shear wave elastography, Directivity index, Nonalcoholic fatty liver disease
Abbreviations: Ultrasound shear wave elastography (uSWE), Directivity factor (Di ), Directivity index (DI), Nonalcoholic fatty liver disease (NAFLD)
ABSTRACT
Ultrasound shear wave elastography (uSWE) is employed in medicine because shear wave propagation reveals variations in the viscoelastic properties of soft tissue which are often associated with disease pathology. Liver fibrosis results in increased liver tissue stiffness and is a key indicator for patient outcomes in nonalcoholic fatty liver disease (NAFLD). The gold standard for assessment of liver fibrosis is invasive biopsy. Current noninvasive techniques based on uSWE have limited penetration depth due to the mechanism for shear wave generation using low frequency vibration of the skin with a small piston. Thus, the region of liver stiffness assessment is constrained and excludes a significant patient population, as obesity and increased waist circumference are often associated with NAFLD. Presented here is an experimental pilot study demonstrating that focused shear waves generated with a concave piston have the potential to increase the penetration depth of uSWE compared to current clinical technology that employs unfocused shear waves generated by a small flat piston. Measurements show the focused shear wave has more confined energy in the propagation direction, as quantified by the directivity index, and so loses less energy to spreading than current technology. The directivity index of focused shear wave generated at 200 Hz is 3.2 times greater than unfocused shear waves currently used in practice. Experimental observations are compared with simulation based on an equivalent source model.
1. INTRODUCTION:
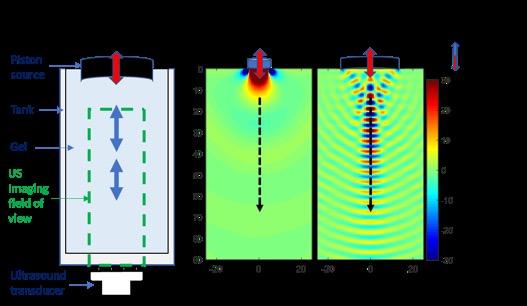
About 30% of the U.S. population suffers with nonalcoholic fatty liver disease (NAFLD) [1]. NAFLD is characterized by hepatic steatosis and fibrosis. In addition, fibrosis is the most predictive measure of patient outcome [1, 2]. Fibrosis of the liver is known to associate with increased mechanical stiffness of the liver tissue as characterized by the shear modulus. Transient elastography (TE) is an ultrasound-based technique currently used in some clinics to assess liver stiffness upon admission [3]. TE creates a shear wave for ultrasound Shear Wave Elastography (uSWE) of the liver by vibrating a small flat piston at the tissue, as shown in Fig. 1(b). TE produces a shear wave with displacement along x and z directions traveling in the z direction that experiences rapid amplitude loss resulting from omnidirectional spreading of the shear wave [4]. Thus, the maximum depth of liver stiffness assessment using TE is limited by maximum propagation distance of the shear wave produced by the small flat piston vibration [5], and patients that have pathology deep inside their body cannot benefit from TE. However, NAFLD is a chronic liver disease that is associated with obesity and diabetes, and increased circumference of the patient limits the interpretability of TE [3] such that only 4 out of 5 TE measurements are
23 Ingenium 2023
Yu-hsuan Chao
John M. Cormack
Kang Kim
interpretable [6]. Other methods for liver elastography based on magnetic resonance imaging have full-body imaging capabilities, but lack the patient comfort, ease-of-use, and spatial and temporal resolution of ultrasound-based techniques like TE that can be administered at the bedside with real-time results [3]. We aim to demonstrate that our new technology of focused shear wave beams, produced by vibration of a concave piston, has increased penetration depth compared to TE that employs a flat unfocused piston. Focusing the beam confines the shear wave energy in the propagation (z) direction, thereby reducing amplitude loss from spreading compared to TE, and resulting in deeper penetration depths of the shear wave for liver stiffness assessment. Measurements of focused shear wave beams are obtained in a tissuemimicking gel phantom. We evaluate the hypothesis that focused shear wave beams increase elasticity imaging depth compared to current clinical technology by directing the wave to propagate deeper into the tissue, as quantified by the directivity index of measured beams. Overcoming this limitation of shear wave elastography will benefit patients with NAFLD and other deep tissue pathology diagnoses noninvasively.
2. METHODS:
The experimental configuration schematic for observing the focusing effect on a longitudinal shear wave beam is presented in Fig. 1(a). The focused longitudinal shear wave beam is excited at the surface of a gel phantom by vibration of a spherically concave piston perpendicular to the gel surface. The piston is designed in Fusion 360 with the radius a of 25 mm and the concavity with the radius of curvature d (i.e., focal length) equal to 40 mm. It is printed by Creality Ender3 printer with 0.28 mm layer height and 40 percent infill. The gel phantom is made with the piston embedded near the face of the gel with 85 X 95 X 95 mm volume in a 5 walled tank with 3 mm-thick acrylic walls. The gel is composed of 5% gelatin and 1% cellulose by weight in DI water, which produces a material with ultrasonic and shear properties very close to those of soft tissue (ultrasound propagation speed near 1500 m/s and shear wave speed near 2 m/s).
Figure 1. (a) Schematic representing the generation of a focused longitudinal shear wave beam by a spherically concave piston in a gelatin phantom and observation by a high-frame rate linear ultrasound (US) transducer. Simulations in (b) and (c) show the displacement polarized along the z-direction for unfocused and focused shear wave fields, respectively, propagating in the z-direction, which is oriented normally to the piston surface where it touches the tissue [10]. (b) is the field produced by a flat piston vibrating at the tissue surface, modeled after the Fibroscan XL. (c) is the field produced by a concave piston at the tissue surface. Red-block and black-dashed arrows indicate forcing motion of piston and propagation direction of shear wave, respectively. All waves propagate at the shear wave speed proportional to shear stiffness.
24 Undergraduate Research at the Swanson School of Engineering
The piston is fixed to an electromechanical shaker (ET132, LabWorks Inc.) that drives the piston perpendicular to the gel surface (Fig. 2). A function generator sends a pulse of 5 cycles at different frequencies such as 200Hz, 300Hz, and 400Hz to an audio amplifier (Dayton Audio) to drive the electromechanical shaker. A large piston diameter (50mm here compared to 12mm for TE) and high frequency (>200 Hz here compared to 50 Hz in TE) is needed in order to achieve significant focusing gain, which is proportional to the ratio of piston diameter to shear wavelength [7]. High frame rate ultrasound (US) imaging with a linear array (Philips ATL L7-4, 5 MHz center frequency, 50 MHz sampling rate, 128 elements, 0.298 mm pitch) controlled by a programmable ultrasound platform (Vantage 128, Verasonics) records the shear wave propagation. The imaging array captures the images through the back of the tank (along the -z direction) at a rate of ten times the shear wave frequency (Fig. 3).

Recorded ultrasound images are processed for calculation of the shear wave field as a function of space and time. Each frame of the raw ultrasound data is beamformed with simple delay-and-sum. Then speckle tracking is used to calculate the displacements along the z axis, i.e., towards or away from the imaging array, in each frame using 1D normalized cross correlation and kernel size of approximately λ/5. A bandpass filter is applied in time to reject unwanted signals based on the spectrum of the driving signal: 200 Hz shear wave data retains content within 50 and 350 Hz, 300 Hz shear wave data retains content within 130 and 500 Hz, 400 Hz shear wave data retains content within 200 and 600 Hz. Then, the filtered signal is timegated to eliminate further unwanted signal from the compressional wave, which is also generated by the piston motion, and reverberation of the shear wave in the tank [8]. Thus, shear wave propagation is measured to a distance of 75 mm in order to assess the directivity properties of the focused beam for comparison to those of the unfocused shear wave used in TE.
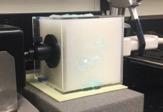
After isolating the shear wave signal, a beam pattern plot is generated at an imaging depth z using the maximum displacement amplitude within the time window at each r location. Energy confinement along the propagation axis is quantified by the directivity factor and directivity index. The directivity factor is commonly used to characterize acoustic sources (e.g., loudspeakers), where it is defined as the ratio of maximum radiated intensity to the average intensity radiated in all directions. The directivity factor (Di ) is calculated using the generated beam plot data along with a paraxial assumption, sin θ ≈ θ, where tan θ = r/z, [9],
(1)
Figure 3. Block diagram of the experimental configuration. A programmable Ultrasound (US) Imaging platform triggers the Function Generator (FG), which generates a short 200, 300, or 400 Hz pulse that passes through the Amplifier (AMP) before exciting the Shaker that drives the piston into the gel phantom. The resulting focused shear waves are observed with US imaging (5 MHz linear array) at a frame rate of 2, 3, or 4 kHz. The diagram in the bottom-middle shows the ultrasound imaging field of view for measurement of the displacement field in the z-direction. Shear wave (blue arrow) produced by the focused piston (black cylinder on the left) travel toward the ultrasound transducer on the right. Red arrow indicates shaker movement.
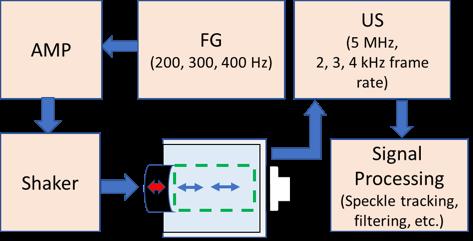
where D(r) = uz (r)/umax , uz (r) is the shear wave displacement versus r at a given distance z from the piston, and umax is the maximum amplitude of u z (r) The paraxial assumption is justified as borne out in the Results section (Fig. 5) as almost all shear wave signal is confined to the z axis. Focused shear wave beams are compared to the field generated in TE by a small unfocused piston. We compare with the Fibroscan XL® that has piston radius of 6 mm, which is assumed to be much smaller than the shear wavelength (approximately 32 mm at the clinical operating frequency of 50 Hz). Therefore, we can obtain its directivity factor analytically by assuming that for the Fibroscan XL piston D = cos θ [9]
(2)

25 Ingenium 2023
Figure 2. Photograph of the experimental configuration.
Lastly, the directivity factor is used to calculate the directivity index (DI) [9]:

Experimental observations are validated by comparison with an analytical model for focused shear wave propagation based on the angular spectrum approach of a planar source condition [10]. Equivalent source radius and focal length for the model, which assumes a planar source distribution, are found from curvefitting simulated axial propagation curves (shear wave amplitude along the axis r = 0 ) to the measured values (MATLAB). The best fit parameters used in the simulations are a = 25 mm and d = 60 mm. Equivalent source parameters differ from those of the actual piston due to the high degree of curvature of the piston (F# = d/2a = 0.8 ) [11]. The directivity index is computed for the simulated beams using Eq. (1).
3. RESULTS
Overall, the measured focused shear wave beams have higher directivity index (DI) than the Fibroscan XL piston (Fig.4). Our DI measurements are 25.1 dB, 27.6 dB, and 27.2 dB for 200, 300, and 400 Hz, respectively, compared to 7.8 dB for the Fibroscan XL. These indicate that a greater proportion of the shear wave energy is confined to the beam ( z) axis and propagates deep into the medium.
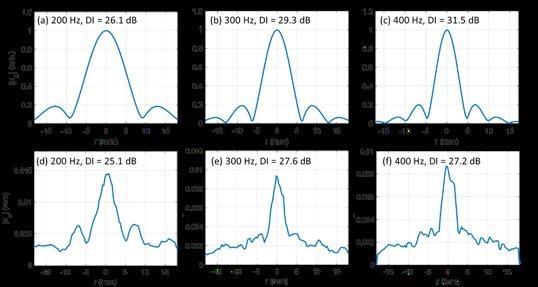
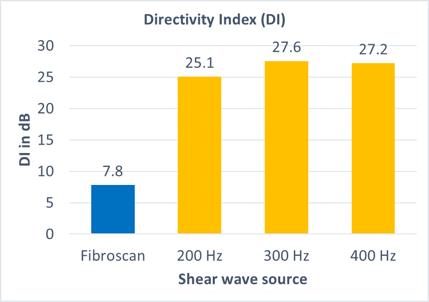
High similarity between beam plots and similar values for DI are found between the simulated and experimental data (Fig.5). The simulations exhibit increasing DI with increasing frequency, increasing 12.2% from 200 to 300 Hz, and 7.51% from 300 to 400 Hz. It matches our expectations based on the apparent narrowing of the beam with increasing frequency. The experimentally measured DI value increases 9.97% from the 200 Hz to 300 Hz field but decreases slightly by 1.32% from 300 Hz to 400 Hz.
4. DISCUSSION
The increased directivity index in focused shear waves means there is less amplitude lost to spreading of the wavefield. Thus, the focused wave allows for higher signal amplitude in the region of imaging and can potentially enable elasticity imaging in deeper tissue. This can potentially improve elastography measurement for assessment of liver elastography in NAFLD, for which maximum propagation distance of the shear wave is the major limiting factor in clinical practice.
Figure
shear wave sources. DI value of the unfocused shear wave generated by the Fibroscan XL piston is calculated from Equation (2). Measured DI values of focused shear wave beams (in yellow) generated by spherically concave piston with 200, 300, or 400 Hz short pulse.
This conclusion adheres with the simulation data in Figs. 1(a) and (b). Figure 5 shows that the trend of increasing DI with increasing frequency seen in simulated beam patterns is also seen in the measured data, apart from the measurement at 400 Hz. The decrease in measured DI from 300 Hz to 400 Hz can be explained by the relatively low SNR in the 400 Hz measurement, such that the noise outside of the main central lobe of the beam artificially lowers the DI for data at that frequency.
Comparison of the measurement and simulation reveals two qualitative differences between the two. The first is that the effective focal length (60 mm) used in simulation to best match observations differs significantly from the actual radius of curvature of the piston source (40 mm). This is explained by analogous observations in similar modeling of high frequency focused ultrasound (HIFU) fields, where it is known [9] that modeling of highly curved sources with planar
26 Undergraduate Research at the Swanson School of Engineering
(3)
4: Directivity index (DI) compared across various
Figure 5: Beam pattern plot generated at an imaging depth z = 50 mm. Top row shows simulation results and bottom row shows experimental data. Each graph is labeled with its source pulse frequency and its directivity index (DI).
source model leads to the same mismatch between effective and actual focal lengths. A second difference between measurement and simulation is seen in Fig. 5, where the measured beams are noticeably narrower than the corresponding simulations. Future work can employ detailed finite element simulations to elucidate shear wave generation by vibration of a concave piston. The main limitation of our experiment is that calculation of the beam DI value is used as a proxy for the penetration depth. Measurement of the true maximum imaging depth is not feasible with our experimental set up due to relatively high frequency US (5 MHz) that cannot image deep enough, and our tank being too shallow to allow for sufficient propagation distance. In the future, we will develop a better experiment setup to enable greater imaging depth. Additionally, our experiment uses a gel that is homogeneous, isotropic, and has relatively low shear wave attenuation. In real in vivo applications the imaging region is heterogeneous, including layers of skin, muscle, and fat as well as the rib cage in between the piston and the liver. Further, real tissues typically exhibit higher shear wave attenuation than the gel used in the present study. Future experiments will embed animal liver in the gel to make the phantom that allow us to obtain more realistic uSWE measurement.
5. CONCLUSION
Focused shear waves exhibited higher directivity index compared to currently used clinical devices for ultrasound elasticity imaging of the liver, which means less amplitude lost to beam spreading in all directions, implying increased SNR in the imaging region and increased penetration depths for ultrasound elasticity imaging. This can potentially improve localized elastography measurement for assessment of liver elastography and NAFLD. Future work will employ more realistic experiments and detailed simulations in order to elucidate focused shear wave propagation, with the ultimate goal of clinical translation of the new technology.
6. ACKNOWLEDGEMENTS:
Funding was provided by the Swanson School of Engineering and the Office of the Provost at the University of Pittsburgh.
JMC was supported by NIH grant no. F32HL160051.
REFERENCES
[1] M. Rinella, “Nonalcoholic Fatty Liver Disease: A Systematic Review,” J Am Med Assoc, vol. 313, pp. 2263-2273, 2015.
[2] P. Angulo, D. Kleiner, S. Dam-Larsen, L. Adams, E. Bjornsson, P. Charatcharoenwitthaya, P. Mills, J. Keach, H. Laffery, A. Stahler, S. Haflidadottir and F. Bendtsen, “Liver fibrosis, but no other histologic features, is associated with long-term outcomes of patients with nonalcoholic fatty liver disease,” Gastroenterlogy, vol. 149, pp. 389-397, 2015.
[3] A. Furlan, M. Tublin, L. Yu, K. Chopra, A. Lippello and J. Behari, “Comparison of 2D shear wave elastography, transient elastography, and MR elastography for the diagnosis of fibrosis in patients with nonalcoholic fatty liver disease,” Am J Roentgen, vol. 214, pp. W20-W26, 2020.
[4] L. Sandrin, M. Tanter, J.-L. Gennisson, S. Catheline and M. Fink, “Shear elasticity probe for soft tissues with 1-D transient elastography,” IEEE Trans Ultrason, Ferr, and Freq Contr, vol. 49, pp. 436-446, 2002.
[5] V. d. Lédinghen, J. Vergniol, J. Foucher, F. El-Hajbi, W. Merrouche and V. Rigalleau, “Feasibility of liver transient elastography with FibroScans using a new probe for obese patients,” Liver International, vol. 30, no. 7, pp. 1043-1048, 2010.
[6] L. Castéra, J. Foucher, P.-H. Bernard, F. Carvalho, D. Allaix, W. Merrouche, P. Couzigou and V. de Lédinghen, “Pitfalls of liver stiffness measurement: A 5-year prospective study of 13,369 examinations,” Hepatology, vol. 51, pp. 828-835, 2010.
[7] K. Spratt, Second-Harmonic Generation and Unique Focusing Effects in the Propagation of Shear Wave Beams with Higher-Order Polarizations, PhD Dissertation, The University of Texas at Austin, Austin, TX, 2014.
[8] S. Catheline, F. Wu and Fink, “A solution to diffraction biases in sonoelasticity: The acoustic impulse technique,” J. Acoust. Soc. Am., vol. 105, pp. 29412950, 1999.
[9] D. T. Blackstock, in Fundamentals of Physical Acoustics, New York, Wiley, 2000, pp. 495-499.
[10] B. Archer, Y.-H. Chao, J. Cormack, K. Kim, K. Spratt and M. Hamilton, “Surface excitation of focused shear wave beams in soft elastic media: Theory,” J. Acoust. Soc. Am., vol. 152, p. A46, 2022.
[11] P. Rosnitskiy, P. Yuldashev, O. Sapozhnikov, A. Maxwell, W. Kreider, M. Bailey and V. Khokhlova, “Design of HIFU Transducers for Generating Specified Nonlinear Ultrasound Fields,” IEEE Trans Ultrason Ferroelectr Freq Control, vol. 64, no. 2, pp. 374-390, 2017.
27 Ingenium 2023
Impact of Surgical Prolapse Mesh Implantation on Vaginal Collagen Network
Abigail Fisk 1, Rui Liang 2,3
1 Department of Bioengineering, University of Pittsburgh
2 Department of Obstetrics and Gynecology, University of Pittsburgh
3 Magee-Womens Research Institute, University of Pittsburgh
Abigail Fisk is a bioengineering senior whose research focuses on vaginal prolapse mesh. Following graduation, she plans to continue conducting research in the field of women’s health by pursuing a doctoral degree.

ABSTRACT
Rui Liang is an Assistant Professor in the Department of Obstetrics and Gynecology. Her research interest is to investigate the negative impact of diabetes on women’s health, focusing on the innate immune response to wounds and implants.

Significance Statement
For the first time, a dynamic change of collagen network in the vagina following synthetic mesh implantation is demonstrated under normal and diabetic conditions, suggesting an underlying mechanism for diabetesassociated increased risk of mesh complications. The methodology is optimized to enable quantification of collagen organization using Matlab programming.
Category: Experimental Research
Keywords : Prolapse Mesh, Diabetes, Collagenic Network
Synthetic mesh-augmented surgeries are often used in the treatment of pelvic organ prolapse and stress urinary incontinence; however, they are associated with mesh complications. Diabetes has been identified as an independent risk factor for the development of mesh complications, the mechanisms of which remain largely unknown. As the tissue’s natural collagenic network provides mechanical integrity to the vaginal wall, we hypothesize that collagenic remodeling occurs following mesh implantation. As a decrease in collagen is commonly associated with this pathology, we further hypothesize that collagenic remodeling is dysregulated by diabetic conditions, resulting in a weakened collagen architecture in the vagina [1]. Vaginal tissue with or without (Sham) mesh implantation was harvested from diabetic and nondiabetic rats at 7- and 42-days postsurgery. Grafted vaginal tissue pieces were stained utilizing a picrosirius red and Masson’s trichrome staining protocol. Picrosirius red-stained tissue was imaged using a polarized light microscope, causing collagen to appear red or green based on the collagenic organization. Utilizing a customized Matlab script, the ratio of organized (red) to disorganized (green) collagen was quantified. Mesh implantation was found to induce collagenic remodeling resulting in an increase in collagen organization at both time points under both diabetic and nondiabetic conditions. Diabetes was found, however, to dysregulate the collagen network resulting in the collagenic architecture appearing more disorganized compared to the nondiabetic rats at 42-days. This dysregulation, in the long-term, may contribute to the increased risk of mesh complications in patients with diabetes.
1. INTRODUCTION
Implantation of polypropylene mesh in the surgical treatment of pelvic floor disorders such as pelvic organ prolapse (POP) has been associated with more positive surgical outcomes when compared to native tissue repairs. However, the application has been limited by several mesh-associated complications, including chronic pain and exposure into the vaginal cavity [2]. Notably, diabetes has previously been identified as an independent risk factor for developing mesh complications. Diabetes is a prevalent condition in postmenopausal women, who are also most likely to receive mesh-augmented surgeries to treat pelvic floor disorders. However, the mechanisms surrounding the increase in mesh complications within this demographic are understudied [3].
Collagen architecture provides the morphological and mechanical integrity of the vaginal wall. While it is known that mesh implantation negatively impacts the vaginal tissue composition, including thinning of the vaginal smooth muscle layer and reduction in key extracellular matrix (ECM) molecules including total collagen content [4], it is unknown how the collagenic
Ingenium 2023
Abigail Fisk
28
Rui Liang
network alignment changes following mesh-augmented surgery under either nondiabetic or diabetic conditions. Further, previous literature indicates that induction of diabetes results in a decrease in collagen production, however, work investigating how the collagenic network is impacted by diabetes following mesh implantation is minimal [1]. We hypothesized that collagenic remodeling will occur in response to mesh implantation but that this remodeling will be dysregulated due to diabetic conditions decreasing collagenic organization and resulting in a weaker vaginal collagenic structure. This study aims to identify how mesh implantation impacts collagen organization and how diabetes impacts the collagenic response to mesh implantation utilizing a diabetic and nondiabetic rat model.
2. METHODS
2.1 Surgery and Picrosirius Red Staining
Diabetes was induced utilizing a single dose of streptozotocin (STZ) (45 mg/kg of body weight) in female Wistar rats aged 9-12 months, with nondiabetic rats being used as controls [5]. Mesh was implanted onto the anterior vagina following a supracervical hysterectomy and bilateral ovariectomy (OVX) prior to mesh implantation to simulate surgical menopause. Sham-operated nondiabetic (7-days n = 5, 42-days n = 6) and diabetic groups (7-days n = 6, 42-days n = 5) were also included. Vaginal tissue was then collected at 7-days (nondiabetic n = 9, diabetic n = 8) and 42-days (nondiabetic n = 10, diabetic n = 9) post-implantation. The number of diabetic and nondiabetic rats utilized in this study were determined via power analysis, as shown in our previous work [5]. Harvested tissue was embedded in OCT and cryosectioned (7 μm) prior to staining. Tissue was stained utilizing a picrosirius red and Masson’s trichrome staining protocol. Picrosirius red dye sulfonic acid groups react with basic amino acids within collagen causing the picrosirius red molecules to align parallel to the collagen. This results in organized collagen fibers to appear red and disorganized collagen fibers to appear green following imaging under polarized light. Rabbit tendon tissue stained with the same picrosirius red protocol acted as a positive control and was utilized for thresholding purposes during image analysis.
2.2 Matlab-Based Collagen Quantification
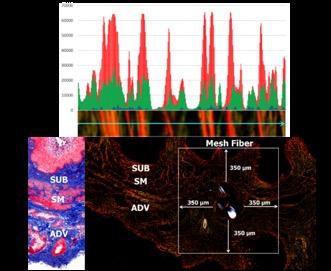
Utilizing a customized Matlab (MATLAB R2019a, The MathWorks, Inc., Natick, MA, United States) -based program, the intensity profile in each image is measured pixel-by-pixel to quantify the amount of organized (red), intermediate (yellow), and disorganized (green) collagen. Each color is defined by the ratio of red intensity to green intensity. The collagenic structure of the positive control appeared heavily organized, and through sampling red and green areas within the controls, the criteria for
categorizing the intensity ratios into red (<1.7), yellow (1.7-2.3), and green (>2.3) was determined (Figure 1a). Green and red pixels were used to represent disorganized and organized collagen, respectively. The ratio of organized to disorganized fibers (R/G ratio) representing fibrotic status was calculated.
identify the sub-epithelium (SUB), smooth muscle (SM), adventitia (ADV), and mesh-tissue interface (MESH).
The full samples were analyzed as well as each layer of the vaginal wall including the Sub-epithelium (SUB), Smooth muscle (SM), and Adventitia (ADV) (without mesh). Previous work quantifying the overall inflammation in histological samples indicated that, on average, inflammation occurs approximately 350 μm from the mesh fiber [5]. Therefore, areas measured 350 μm away from the edge of the mesh fiber(s) were also analyzed and used to represent the meshtissue interface. Vaginal layers and mesh fibers were identified via trichrome staining. (Figure 1b). As the data was found to be non-parametric, comparative analysis was done using Kruskal-Wallis testing in JMP pro (version 16.1.0 SAS Institute Inc., Cary, NC) with p-values less than 0.10 indicating a trend and significance set at p < 0.05.
29 Ingenium 2023
Figure 1. Image Analysis and Processing Methodology. (a) Intensity profile of a control sample utilized to define collagen categorization criteria. (b) Trichrome (left) and picrosirius (right) histology stains labeled to
3. RESULTS
3.1 Mesh Implantation Under Nondiabetic Conditions
In nondiabetic rats, when compared to Sham, mesh implantation at 7-days results in a significantly increased R/G ratio in the overall sample (p=0.014), predominantly in the SM and SUB layers (p=0.072,0.039). At 42-days, the R/G ratio remained significantly increased in the overall sample following mesh implantation (p=0.0017), as well as in the SM and SUB layers of the vaginal wall (p=0.0067,0.0067) (Figure 2). Interestingly, at the 42-day time point compared to the 7-day time point, the R/G ratio tends to be increased at the mesh-tissue interface and in the SUB layer (p=0.086,0.085).
3.2 Mesh Implantation Under Diabetic Conditions
Under diabetic conditions following mesh implantation, similarly, the overall R/G ratio is increased at both 7-days and 42-days (p=0.0045,0.072) when compared to Sham. The R/G ratio in the SM, SUB, and ADV layers is again significantly increased in mesh-treated diabetic rats (p=0.039,0.0045,0.0030) at 7-days but not at 42days (Figure 2).
3.3 Impact of Diabetes
When comparing the diabetic and nondiabetic groups, no differences between diabetic and nondiabetic Sham rats are observed at 7-days. At 42-days, however, there is a significant decrease in the R/G ratio in the full tissue sample of diabetic rats (p=0.017). In rats with post-mesh implantation, diabetes also significantly decreased the R/G ratio in the overall tissue at 42-days (p=0.009). At 7-days, the R/G ratio in the SUB layer is significantly increased, while at 42-days, the R/G ratio is significantly decreased under diabetic conditions (p=0.001,0.020). At 7-days in diabetic rats, the R/G ratio in the SM layer tends to be increased and is significantly decreased at 42-days (p=0.068,0.020). The ADV layer also tends to be increased at 7-days and decreased at 42-days (p=0.054,0.085). In areas surrounding mesh, the R/G ratio was significantly increased in diabetic rats at 7-days and tended to be decreased at 42-days (p=0.020,0.060) (Figure 3).
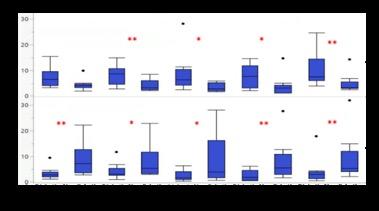
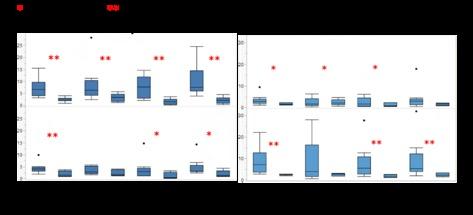
how the collagen network is impacted by mesh implantation at the short-term time frame (left) and longterm time frame (right) under diabetic (top) and nondiabetic (bottom) conditions. The mesh rats are compared to the Sham rats both for the overall samples (FULL) and each layer of the vaginal wall (ADV, SM, SUB).
Figure
Shows the impact of induction of diabetes at the short- (top) and long-term (bottom) time frames following mesh implantation. The diabetic rats are compared to the nondiabetic rats both for the overall samples (FULL), tissue-mesh interface (MESH), and each layer of the vaginal wall (ADV, SM, SUB).
4. DISCUSSION
This study identified and quantified collagenic remodeling following mesh implantation under diabetic and nondiabetic conditions. Mesh implantation results in a more organized network of collagen in the vaginal tissue at both the short- and long-term times frame, with or without the impact of diabetes. This indicates that mesh implantation induces an overall collagen network remodeling in the vaginal wall starting early following mesh-augmented surgery. Diabetes, however, results in a more disorganized collagenic architecture at the 42-day time frame showing a dysregulation of the fibrogenic response in the long term (Figure 4).
30 Undergraduate Research at the Swanson School of Engineering
Figure 2. Impact of Mesh Implantation on Collagenic Network. Shows
3. Impact of Diabetes on Collagenic Network.
These observations support previous studies indicating that stress shielding effect might be one of the mechanisms impacting vaginal tissue following mesh implantation leading to maladaptive remodeling of the vaginal tissue [4] [6]. Stress shielding occurs when stiffer materials, in this case, vaginal mesh, interact with the soft tissue. Due to the high differences in mechanical properties, stresses occurring upon tissue at the mesh-tissue interface are “shielded” by the mesh implant. This results in less stress working on the vaginal tissue contributing to tissue degeneration following mesh implantation. Tissue degeneration in this context is reported to cause the loss of key ECM molecules, including collagen, and a decrease in the mechanical integrity of the tissue [4] [7]. The observations made in this study support the effect of stress shielding on the collagenic network as we hypothesize that the disorganized collagen degrades quickly following implantation resulting in the collagenic network becoming more aligned from the short- to long-term time frames. We found that diabetes results in a less organized collagenic network in the long-term, which could be induced partially by a dysregulated tissue remodeling which occurs over time. The decrease in collagenic organization at this time point has the potential to negatively affect the mechanical integrity of the vaginal tissue leading to mesh complications. Future work will focus on understanding the mechanisms which could lead to the observations regarding collagenic alignment made in this study.
There are several limitations of this study that should be noted. The methodology, while overall repeatable and can be utilized to quantify picrosirius red staining in tissues outside of the applications demonstrated in this study, is limited due to variations in histologic staining and polarized imaging. Differences in tissue
thickness, while often minimal and random, can occur during cryosectioning tissue prior to staining. The inclusion of positive controls during staining helps ensure that variation resulting from human error in the staining protocol remains minimal. However, imaging utilizing polarized light can impact results as well. Rotation of the microscope stage has been proven to impact the coloration of the collagen fibers following picrosirius red staining [8]. Future work will include the inclusion of different imaging angles to address this concern. Further, analysis of the angles of orientation of the collagen fibers, total collagen content, and studies utilizing biochemical methods to quantify collagen content would support the observations reported in this study.
5. CONCLUSIONS
This study investigated the impact of surgical mesh on the collagen architecture in the vagina under nondiabetic vs. diabetic conditions. We conclude that mesh implantation induces an increase in collagenic network alignment under both glycemic conditions, while diabetes negatively impacts the collagenic network at the long-term time frame, which may contribute to the increased rate of mesh complications in patients with diabetes. Further studies are warranted with the end goal of developing therapeutic strategies for the management of mesh complications in this patient population.

6. ACKNOWLEDGEMENTS
Funding was provided by NIH/NICHD 1R21HD099549, the Swanson School of Engineering and the Office of the Provost at the University of Pittsburgh.
31 Ingenium 2023
Figure 4. Vaginal Collagenic Remodeling. Following mesh implantation, under nondiabetic conditions, the collagenic network becomes more organized over time, while under diabetic conditions, the organization increases initially before becoming significantly disorganized in the long-term time frame.
REFERENCES
[1] R. Spanheimer. “Decreased collagen production in diabetic rats,” Diabetes vol 37, no. 4, p. 371-376, April 1988 doi: https://doi.org/10.2337/diab.37.4.371
[2] R. Liang, “Exploring the basic science of prolapse meshes,” Curr Opin Obstet Gynecol. vol. 28, no.5, p. 413-9, Oct 2016. doi: 10.1097/ GCO.0000000000000313
[3] EA. Frankman, “Mesh exposure and associated risk factors in women undergoing transvaginal prolapse repair with mesh,” Obstet Gynecol Int. vol. 2013, Sept 2013. doi: 10.1155/2013/926313
[4] R. Liang, “Vaginal degeneration following implantation of synthetic mesh with increased stiffness,” BJOG. vol. 120, no. 2, p. 233-243, Jan 2013. doi: 10.1111/1471-0528.12085
[5] R. Liang, “Characterization of vaginal immune response to a polypropylene mesh: Diabetic vs. normoglycemic conditions,” Acta Biomater. vol. 143, p. 310-319, Apr 2022. doi: 10.1016/j. actbio.2022.03.007
[6] A. Feola, “Deterioration in biomechanical properties of the vagina following implantation of a highstiffness prolapse mesh.” BJOG. vol. 120, no. 2, p. 224-232, Jan 2013. doi: 10.1111/1471-0528.12077
[7] A. P. Rumian, “The influence of the mechanical environment on remodelling of the patellar tendon.” The Journal of Bone and Joint Surgery. Vol. 91, no. 4, p. 557-564, Apr 2009. https://doi.org/10.1302/0301620X.91B4.21580
[8] R. Lattouf, “Picrosirius red staining: a useful tool to appraise collagen networks in normal and pathological tissues,” J Histochem Cytochem vol. 62, no.10, p. 751-8, Oct 2014. doi: 10.1369/0022155414545787
32 Undergraduate Research at the Swanson School of Engineering
Expansion and Optimization of an Artificial Intelligence Framework to Predict Wall Stresses
in Abdominal Aortic
Aneurysms
Christian N. Hangey 1, Nathan L. Liang 2,3 , David A. Vorp1 and Timothy K. Chung1
1 Department of Bioengineering, University of Pittsburgh.
2 Department of Surgery, University of Pittsburgh.
3 UPMC Division of Vascular Surgery.
Christian Hangey hails from Quakertown, Pennsylvania, and his career aspirations have led him to pursue a degree in bioengineering at Pitt. He became interested in research and has been involved with projects involving artificial intelligence and computational simulations to analyze vascular diseases. After completing his degree, he plans to work in the medical device industry.

Timothy K. Chung, PhD is a Department of Bioengineering Research Assistant Professor at the Swanson School of Engineering. Dr. Chung’s research focuses on the development of experimental testing apparatus for biomechanical analyses, computational simulation of diseased vasculature, medical device design and manufacture, and artificial intelligence.

Significance Statement
Abdominal aortic aneurysms are a leading cause of death, and current methods for determining when surgical intervention is necessary are ineffective. Using artificial intelligence to predict wall stresses and therefore when rupture may occur enables patient specific determinacy of whether and when surgical intervention is necessary. This method takes much less time than current methods, while requiring less expertise.
Category: Computational Research
Keywords : Abdominal Aortic Aneurysm, machine learning, artificial intelligence, stress prediction
ABSTRACT
This study aims to expand on a previous method of using artificial intelligence (AI) to predict wall stresses in abdominal aortic aneurysms (AAA). Normally, clinical intervention (surgery) occurs once the diameter reaches 5.5 cm, but this approach neglects the ruptures that occur below this threshold, where 75% result in death [1]. AAA is the 13th leading cause of death in the United States [2], and over 175,000 people globally die annually due to AAA rupture [3]. This AI technique will allow for a patient specific analysis of whether rupture is imminent, and surgery is necessary by predicting wall stresses. While the pilot study used only 10 patients, this study involves 274. To obtain wall stress predictions, five machine learning (ML) models were trained in MATLAB using predictor variables as inputs and the predictions were then plotted against the ground truth stresses obtained through finite element analysis (FEA). The difference between the ground truth stresses and the model predicted values were analyzed by tabulating the RMSE, R 2 , and slope values. Further model optimization was performed through removal of node neighbors for curvature and intraluminal thrombus (ILT) thickness followed by model retraining. Residual plots of the stress predictions for the models with and without these predictive variables showed ILT thickness as the more important stress predictor variable. To see a qualitative and visual comparison of the predictions versus actual stresses, stress values were mapped to x, y, and z coordinates to generate a heat map showing 3D variation in the stresses. Our results found that the stresses were underpredicted by the models, but the models still appeared successful. This shows that artificial intelligence can be used as a predictor for wall stresses and therefore rupture in AAA. Overall, this study shows that AI will allow for expedited stress analysis, will enable future large-scale studies, and can be applied in the analysis of other diseases.
1. INTRODUCTION
Abdominal aortic aneurysms (AAA) are a localized dilatation of the terminal aorta that begins to balloon abnormally. If left untreated AAA can continue to grow and suffer from rupture events, where upwards of 75% of these cases result in death, making it imperative to prevent rupture at all costs [1]. Subsequently, AAA is the 13th leading cause of death in the United States [2] and globally, over 175,000 people die annually due to AAA rupture [3]. Historically, clinical intervention occurs once the aneurysm reaches a diameter greater than 5.5 cm [4], but this one size fits all approach is insufficient as 1% to 7% of AAAs with diameters of 4 cm to 5 cm still rupture [5]. The biomechanics of these aneurysms has been previously investigated in depth using a traditional approach to perform stress analysis from medical images using patient-specific material properties that were experimentally measured. Stress
33 Ingenium 2023
Christian Hangey
Timothy Chung
analysis has been used to understand the forces interacting on the aneurysm wall due to systolic blood pressure that serves as a potential biomarker to understand the risk of rupture. Historically, this involves performing manual segmentation of regions of interest (ROI) from medical images and performing stress analysis, which require expertise in addition to substantial time (>4 hours per aneurysm) and significant computing power, preventing adoption in a clinical setting. To overcome these limitations, Chung et al. [6] proposed an artificial intelligence (AI) framework that first automatically segments CTs using a U-NET ML model and then predicts wall stresses using an Extra Tree Regressor model. This was compared to the ground truth results obtained via traditional FEA to judge the potency of the predictions. It was found that the peak and mean wall stress predictions from the Extra Tree Regressor model using the manually segmented AAA images had R 2 values of 0.99 and 0.997 respectively when compared to the ground truth stress values [6]. This shows the apparent success of the model in making accurate predictions. However, this analysis used only ten unique AAA patient image sets and there was not a separate testing dataset for validation during the training phase. This study expands on previous work to increase the number of patients (n = 274) to develop trained ML models to predict wall stresses using the Neocortex supercomputer hosted by the Pittsburgh Supercomputing Center. We obtained CT images from these patients with AAA from a retrospective dataset pulled by the Health Research Record Request, a service of the department of bioinformatics at the University of Pittsburgh and University of Pittsburgh Medical Center. There were several CT images taken per patient at more than one time point with a minimum of 200 axial slices per image stack. The primary goal of this study was to interrogate and compare multiple models to find the most effective (i.e., best at predicting wall stresses). A secondary goal was to perturb the input variables during the training phase to optimize the wall stress predictive models by removing ILT thickness and nodal neighbors to see their effect on wall stress predictions.
2. METHODS:
CT images of AAA patients were manually segmented to generate point cloud and surface meshes. From there, a dataset was prepared to create predictor variable columns and an output stresses column with values obtained through the FEA technique. Five different ML models within MATLAB Regression Learner were trained using these predictor variables and output stresses. Statistical analysis using RMSE, R 2 , and slope was performed to judge the models, and upon finding the three most successful, node neighbors for curvatures and ILT thickness were removed as predictors, and the models were retrained and compared to further optimize the models.
2.1 Medical Imaging Database

Deidentified imaging data was taken from 274 patients that were diagnosed with AAA and included ILT with a minimum slice thickness of 2.5 mm. If the slice thicknesses were greater than 2.5 mm, the boundary of the aneurysm wall could not be reliably segmented. Manual segmentation of each patient’s CT image set was performed to generate a point cloud and surface mesh, where morphological features were then used as inputs to ML models.
Figure 1. Stress analysis pipeline for AAA CT scans. Pathway B was first proposed in Chung et al. [4] and offers much quicker analysis than Pathway A. The first step in Pathway B involves using a U-Net model to segment the CT scan images. From there, a point cloud and surface mesh are created. Finally, the models trained using the morphological features as described above will be used to generate stress predictions for each point in the mesh, and these values can be used to create a 3D wall stress map.
Point cloud geometries for the lumen and wall were converted into a preliminary mesh using triangular elements and Laplacian surface-preserving smoothing (Sousa et al., 2007) was applied [7]. The resulting surfaces were then used to perform wall stress analysis in Abaqus Standard using a previously published model from Vande Geest et al. [8]. The stress analysis results from this process and database were reserved later for the ground truth stress values used to train various ML models.
34 Undergraduate Research at the Swanson School of Engineering
2.2. Data preparation
The manually segmented surface reconstructed geometries were used as inputs for the ML models. Additional inputs were calculated by using the wall surface nodes as a reference frame relative to the lumen surface nodes and centerline of each AAA [6]. Cartesian coordinates, ILT thickness, maximum circumferential radii, maximum and minimum principal curvatures, and principal curvatures of the six closest nodal neighbors were also calculated to be used as predictors for the ML models. The principal curvatures, radii, and neighbors serve as a boundary region for a single point on the surface of an aneurysm in attempts to reduce the level of variability (i.e., a clustering method to relay surface information for the training algorithms). ILT thickness attenuates the stresses on the wall and is a potential factor to improve the accuracy of stress predictions. The wall surfaces were labeled to find the proximal and distal displacement boundaries, and the distance to the closest nodal boundary. The last column of the prepared dataset was the wall stress values tabulated using Abaqus FEA.
2.3. Model Selection
Various regression and ML models were selected due to their representation of broad categories of approaches that include random forest, ensemble boosted trees, and neural networks. (Boosted and Bagged Trees were ensemble boosted trees models, while Coarse Tree was a random forest model.) The random forest model was picked because its method of using multiple decision trees that each make their own prediction using random predictor variables and then averaging all the predictions together often produces plausible predictions for regression data [9]. The ensemble boosted trees models were picked because they combine multiple decision trees, thereby making more compelling predictions than using individual trees by themselves [10]. The neural network was selected because of their ability to learn the complex, non-linear relationship between the features and target that goes beyond simple linear regression [11].
2.4 Machine Learning Training and Testing
A Linear Regression, Bagged Trees, Coarse Trees, Neural Network, and Boosted Trees model were trained utilizing 9-fold cross validation from MATLAB Regression Learner (MathWorks Inc., Natick, MA) and using 30 predefined morphological parameters to predict wall stresses [9]. Further, 75% of the dataset was used for training, and the remaining 25% of the dataset was reserved exclusively for testing. In other words, 75% of the subjects were used for training and 25% were used for testing, meaning samples from the same subject were not seen in both training and testing. Trained models were exported and reserved to input a testing dataset for evaluation. The predicted
stress values were mapped to x, y, and z coordinates using Tecplot (Tecplot Inc., Bellevue, WA) to generate wall stress heat maps for one AAA case, highlighting the spatial variation in stresses using colors.
2.5. Statistical Analysis
The stress values predicted in the testing set (from each model) were plotted against the actual stress values using MATLAB to gauge the effectiveness of the models. This was done by comparing the linear fit trendlines from each model to the line of unity representing perfect predictions by the models. Additional metrics were calculated to further assess the efficacy of each model that included the mean ± standard deviation (SD), root-mean-square error (RMSE), R 2 , and linear fit trendline equation (with an intercept placed at the origin). The RMSE value provides information on whether the model makes accurate predictions, or small residuals, between predicted and actual values. The R 2 value provides information on how important the predictor columns are in determining the stress values [12]. The slope of the trendline further tells whether the model under or overpredicts the stresses. A model with perfect predictions would have a RMSE of 0 with a R 2 and slope of 1, so the models with the lowest RMSE, and R 2 and slope closest to one were selected for further optimization.
2.6. Model Optimization
Using the metrics discussed above to find the three best models, the five models above were narrowed down to the Neural Network, Bagged Trees, and Coarse Trees to undergo model optimization. The variables that were incorporated for training were separately evaluated to understand the overall effect and importance. For example, in the ILT models where the ILT thickness was a predictor variable, the ILT thickness column was removed, and predictions were made again with new models to compare these predictions to the originals. It was expected that these non-ILT thickness columns would not be as reasonable and would serve as a negative result to compare to the positive result of the original predictions. This process was done again when removing node neighbors for curvatures, and for removing both the node neighbors and ILT. Residual plots were constructed from model predictions using the testing dataset without ILT thickness included, without node neighbors included, and without either ILT thickness or node neighbors included. Comparison between these plots was used to determine the relative importance of these variables in making the stress predictions.
35 Ingenium 2023
3. RESULTS
The ground-truth wall stresses were plotted against predicted wall stresses. Figure 2 shows several examples of these predictions for each model.
Predicted wall stresses with corresponding Cartesian coordinates were used to generate heat maps showing the relative stress at various locations on one AAA case with ILT thickness and neighbors included. Figure 3 shows the stress maps generated from the model predictions in comparison to the ground truth map.
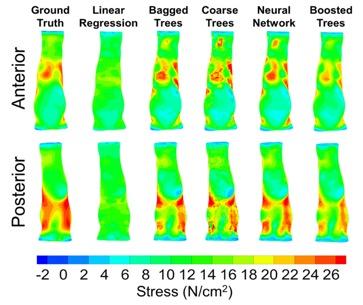
Figure 2. Predicted wall stress (N/cm2) for the Linear Regression, Bagged Trees, Coarse Trees, Neural Network, and Boosted Trees models vs. ground truth wall stresses. A line of unity (dotted black) is shown with the respective linear fits (colored trendlines).
The contrast between these linear fit trendlines and the line of unity was analyzed using the metrics discussed above. The RMSE, R 2 and slope values for the initial model training are displayed in Table 1.
Table 1: Reporting mean ± standard deviation wall stresses, RMSE, R 2 , and linear trendline slope of stress predictions vs. ground truth.
Figure 3. Anterior and posterior views of the Ground Truth stress map and the predicted wall stress maps for the Linear Regression, Bagged Trees, Coarse Trees, Neural Network, and Boosted Trees models.
Figure 4A shows the difference between ground truth values and predictions when no neighbors were included for the three best models. Figure 4B shows the difference between ground truth values and predictions when no ILT was included for the three best models. Figure 4C shows the difference between ground truth values and predictions when no neighbors nor ILT thicknesses were included for the three best models.
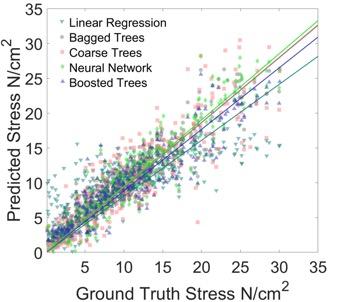
36 Undergraduate Research at the Swanson School of Engineering
Model Name Mean Stress (N/cm2) RMSE R2 Slope Ground Truth 2.65 ± 5.63 - -Linear Regression 3.21 ± 5.13 3.41 0.558 0.804 Bagged Trees 3.28 ± 5.72 3.16 0.695 0.931 Coarse Trees 3.28 ± 5.84 3.34 0.673 0.934 Neural Network 3.33 ± 5.86 3.23 0.695 0.95 Boosted Trees 3.16 ± 5.40 2.99 0.692 0.883
Training time for the no ILT thickness models was 4.4 hours for the Neural Network, 2.2 hours for the Bagged Trees, and 1.2 hours for the Coarse Tree. Training time for the no neighbors models was 3.7 hours for the Neural Network, 3.1 hours for the Bagged Trees, and 1.1 hours for the Coarse Tree. Training time for the models without ILT thickness or neighbors was 3.9 hours for the Neural Network, 3.8 hours for the Bagged Trees and 1 hour for the Coarse Tree.
4. DISCUSSION
Upon initial model analysis, the calculated RMSE, R 2 , and slope values showed a positive correlation between the AI predictions and calculated wall stresses. This demonstrates that the ML models were effective at making predictions even though they slightly underestimated the wall stresses. It was found that the Neural Network performed especially well as the stress predictions were closest to the groundtruth FEA results (i.e., it had the highest slope, but slightly underestimated the wall stresses by 5% on average). The Bagged Trees and Coarse Trees models also appeared effectual because they had low RMSE values and slopes above 0.9. The Linear Regression model had the lowest slope and highest RMSE, establishing it as the worst wall stress predictor. It is also qualitatively noted that the Neural Network mimicked the stress banding found on the simulation as seen in the ground truth stress map patterns from Figure 3. The strength of predictions in the models trained with no neighbors compared to the models trained with no ILT is visualized in a comparison of Figure 4A and Figure 4B. The residuals were clustered around zero when no neighbors were included in the trained model, while the residuals are more variable for the no ILT trained model. This means that the no neighbors models had stronger predictions, or less noise, than the no ILT model. Therefore, ILT thickness appears to be a more important feature in determining wall stresses than the node neighbor’s curvatures. There is further evidence for this seen when comparing

Figure 4A and Figure 4C. The noise within the residuals plot increased when no ILT thickness and no neighbors were included for training as opposed to when there were solely no neighbors included for training. Altogether, these models exemplify that AI can be used to effectively predict the wall stresses on AAA, but it is recommended that ILT thickness and the neighborhood of nodes remain intact.
In this study, we provide a robust methodology to predict the wall stresses onto 3D surfaces of AAA without the need to perform computational analysis. We explored the influence of the model by including/excluding various parameters used to predict wall stress and found that ILT thickness remained a key contributor to reduce variability of the stress predictions. In the future, the Neocortex supercomputer will be used to train additional U-NET models to perform automatic segmentation. Creating these stress maps will enable a patient specific visualization of wall stresses in patients with AAA without the need of a computational or imaging expert. The predictions made by the Neural Network, Bagged Trees, and Coarse Trees models show that artificial intelligence can be used instead of traditional stress analysis which takes an average of 45 minutes to an hour in comparison to the AI-based stress predictions (< 2 seconds). This analysis can provide accessibility for clinicians to determine the risk of rupture in AAA and whether surgical intervention is necessary. Future work will include an advanced visualization system using augmented reality, that is currently under development.
There were still some limitations in this study that can be improved upon in subsequent research. This includes the fact that manual segmentation was still used instead of automatic segmentation, which takes much longer. Moreover, all the models underestimated the wall stresses, so future studies should try to improve the efficacy of model predictions by including more data for the training dataset.
37 Ingenium 2023
Figure 4. Residual plot (ground truth minus predictions) for stress predictions from the Coarse Trees, Bagged Trees, and Neural Network models without neighbors (A), without ILT (B), and without either ILT or neighbors (C).
5. CONCLUSIONS
The Neural Network, Bagged Trees, and Coarse Trees models were judged credible at predicting wall stresses. Additionally, ILT thickness was found to be a more important variable than node neighbor curvatures in determining wall stresses. This study shows that the artificial intelligence framework introduced in Figure 1 allows for expedited and simplified stress analysis. The outdated maximum diameter criteria used to determine whether surgical intervention is necessary could potentially be replaced by AI-enabled biomechanical analysis using this AI and machine learning pipeline with the goal of reducing AAA rupture rates for smaller-diameter aneurysms, thereby decreasing the risk of death for these patients. In addition, this methodology will enable future largescale studies and can be applied in the analysis of other diseases such as cerebral aneurysms.
6. ACKNOWLEDGEMENTS
Funding was provided by the Swanson School of Engineering, the Office of the Provost, and the Department of Bioengineering at the University of Pittsburgh. Access to the Neocortex supercomputer was hosted by the Pittsburgh Supercomputing Center.
REFERENCES
[1] R;, Jeanmonod D;Yelamanchili VS;Jeanmonod. (2022) National Center for Biotechnology Information
[2] Kuivaniemi, H., Platsoucas, C. D., & Tilson III, M.D. (2008). Circulation, 117(2), 242-252.
[3] Howard, Dominic P J, et al. (2015). Journal of the American Heart Association, 4(8): e001926.
[4] Papakonstantinou, N. A., & Rorris, F. P. (2021). European Journal of Cardio-Thoracic Surgery, 59(3), 554-561.
[5] Aggarwal, S., Qamar, A., Sharma, V., & Sharma, A. (2011). Experimental & Clinical Cardiology, 16(1), 11.
[6] Chung, T. K., Liang, N. L., & Vorp, D. A. (2022). Applications in Engineering Science, 10, 100104.
[7] F.S. Sousa, A. Castelo, L.G. Nonato, N. Mangiavacchi, J.A. Cuminato, Local volume-conserving free surface smoothing, Commun. Numer. Methods Eng., 23 (2007), pp. 109-120.
[8] J.P. Vande Geest, D.E. Schmidt, M.S. Sacks, D.A Vorp, The effects of anisotropy on the stress analyses of patient-specific abdominal aortic aneurysms, Ann. Biomed. Eng., 36 (2008), pp. 921-932.
[9] Pedregosa, F. et al. Scikit-learn: Machine Learning in Python. Journal of Machine Learning Research (2011).
[10] Chang, W. et al. A Machine-LearningBased Prediction Method for Hypertension Outcomes Based on Medical Data. Diagnostics (Basel, Switzerland) 9, 178-178, doi:10.3390/ diagnostics9040178 (2019).
[11] Greenes, Robert A. Clinical Decision Support the Road to Broad Adoption. Second edition. Amsterdam: Elsevier/AP, 2014. Print.
[12] Chicco, Davide, Matthijs J Warrens, and Giuseppe Jurman. “The Coefficient of Determination R-Squared Is More Informative Than SMAPE, MAE, MAPE, MSE and RMSE in Regression Analysis Evaluation.” PeerJ. Computer Science 7 (2021): e623–e623. Web.
38 Undergraduate Research at the Swanson School of Engineering
FVIII Gene Restoration in Hemophilia A Patient Stem Cells Using CRISPR Editing
Michael P. Haugh1,2 , Robert Barndt 2 and Haodi Wu2
1 Department of Bioengineering, University of Pittsburgh
2 Vascular Medicine Institute, Department of Medicine, University of Pittsburgh
Michael Haugh is a senior bioengineering student from Ford City, Pennsylvania. He has a passion for cellular engineering geared toward genome-editing techniques. After graduation he will pursue a medical degree at the University of Massachusetts and intends to specialize in Oncology.
Dr. Haodi Wu is an assistant professor in the Vascular Medicine Institute, Department of Medicine at the University of Pittsburgh. Wu’s lab combines cutting-edge stem cell, physiology, genetics, and molecular approaches to dissect the mechanisms of cardiac dysfunction related to mutation, aging, and environmental risk factors, and ultimately, to develop novel strategies to target these pathological remodeling.
Significance Statement
For individuals suffering from severe Hemophilia A, the financial burden of recurrent FVIII replacement therapy is an ongoing issue. Recent scientific developments of iPSCs and CRISPR/Cas9 have the potential to develop a safe, effective, and affordable novel Hemophilia A therapy that would be accessible to a wider range of patients.
Category: Experimental Research
Keywords : Hemophilia A, Factor VIII, CRISPR/Cas9, genome editing, induced pluripotent stem cell


Abbreviations: induced pluripotent stem cell (iPSC), peripheral blood mononuclear cell (PBMC), endothelial cell (EC), clustered regularly interspaced short palindromic repeats (CRISPR), polymerase chain reaction (PCR)
ABSTRACT
Hemophilia A is a clotting abnormality due to a chromosomal inversion of the Factor VIII gene on the X chromosome. It is one of the most common genetic disorders, and symptoms include increased bleeding, progressive joint damage, and critical hemorrhage events. Current Hemophilia A therapies such as FVIII replacement are unaffordable and require lifelong intravenous infusion 2-3 times per week. To address the issue, this project focuses on the development of an affordable and sustainable novel therapy for Hemophilia A. The project’s aim is to employ modern genome-editing technology to correct the FVIII gene mutation in the patient’s own induced pluripotent stem cells (iPSCs), which can be further differentiated into endothelial cells (ECs) to restore the production of functional FVIII and improve the coagulation function in Hemophilia A patients. Blood samples were collected from severe Hemophilia A patients, and the isolated peripheral blood mononuclear cells (PBMCs) were reprogrammed into induced pluripotent stem cells (iPSCs). CRISPR/Cas9 genome editing technology was used to correct the FVIII mutation within the iPSCs. Moving forward, the corrected stem cells will be differentiated into endothelial cells and transplanted back into the patient, where they will produce functional FVIII and correct the disorder.
1. INTRODUCTION
Hemophilia A is one of the most common genetic disorders, affecting 1 in 5,000 male births in the United States [1]. The disorder results from a chromosomal inversion of the Factor VIII gene on the X chromosome. Because this mutation is X-linked, Hemophilia A affects primarily male patients. The Factor VIII protein is responsible for proteolytic activation of Factor X in the coagulation cascade [2]. Factor X is required for prothrombin activation to thrombin and resulting fibrinogen activation to fibrin. Fibrin polymers are the primary structure in blood clot formation when blood vessels become damaged. Thus, an inversion in the FVIII gene that hinders wild
Ingenium 2023
Figure 1. Hemophilia A severity characterization based upon FVIII level
Michael P. Haugh
Haodi Wu
Hemophilia A patients suffer from increased bleeding, progressive joint damage, and critical hemorrhage events. However, the mainstay FVIII replacement treatment requires life-long intravenous infusion for 2-3 times per week, which is burdensome and significantly reduces the life quality of these patients. Moreover, the cost of Factor VIII therapy for Hemophilia A is ~$500,000 per year, and it is unavailable to those with limited financial and medical resources. As a result, many patients die from serious intracranial bleeding episodes before adulthood. Thus, there is an urgent need to develop novel Hemophilia A therapies that are more affordable and require only limited interventions to sustain the physiological level of FVIII. Today, many therapies are under clinical application and development, such as mainstay FVIII replacement therapy, extended half-life factor products (EHLs), Emicizumab (a humanized monoclonal antibody that mimics activated FVIII), and virus-based gene therapy. However, these methods are greatly limited by high cost and adverse side effects. In the proposed novel Hemophilia A therapy, the mutated FVIII gene will be corrected in its original location, which minimizes the risks identified in other therapies. Moreover, the corrected patient-specific induced pluripotent stem cells (iPSCs) can proliferate indefinitely, which will provide an unlimited source for cell therapy and bypass most of the side effects in other competitive strategies. Because the corrected endothelial progenitor cells will proliferate within the patient’s body, this therapy will be delivered in a limited number of transplantations. The elimination of ongoing FVIII replacements will significantly drive down patient treatment costs overall.
iPSCs are stem cells derived from human somatic cells, which hold great potential in disease modeling and clinical applications. However, there is a major lack of knowledge and clinical application regarding the use of iPSCs as a source of cell therapy to restore FVIII expression in Hemophilia A patients. To bridge this gap in clinical application, it is hypothesized that modern genome-editing technology can be employed to correct the FVIII gene mutation in the patient’s own iPSCs, which can be further differentiated into endothelial cells (ECs) to restore the production of functional FVIII and improve the coagulation function in Hemophilia A patients. The project can be broken down into three main steps: 1) collect patient blood samples and generate iPSC lines; 2) correct the FVIII gene mutation with CRISPR tool; 3) differentiate corrected patient iPSCs into ECs and validate FVIII production.
2. METHODS
2.1 iPSC reprogramming and maintenance
PBMCs were isolated from hemophilia patient blood samples using SepMateTM 50 mL spin columns (StemCell Technologies) and grown in RPMI-1640 medium (Thermo Fisher Scientific). After 2 weeks of PBMC culture and expansion on 24 well plates, the cells were reprogrammed into patient-derived iPSCs via Sendai virus transduction of the four Yamanaka factors. The human iPSC lines were maintained with daily Essential 8 (E8) media change (Thermo Fisher Scientific) on Matrigel-coated plates (Corning) at 37°C with 5% CO2 and 5% O2 . For passaging, iPSCs were dissociated using 0.5 µM EDTA in DPBS (Life Technologies) and were split 1:10 in E8 with 10 μM Y-27632 dihydrochloride (Med Chem Express).
2.2 Inversion correction of FVIII gene with CRISPR/Cas9
The sgRNA oligos were designed using online CRISPR designing tools. The sgRNAs were chosen to target both loci around the inverted DNA region and then were introduced into hemophilia patient-derived iPSCs along with the CRISPR vector using the NucleofectorTM 2b Device (Lonza). After nucleofection, cells were recovered for 1~2 days and then reseeded at a low density in 10cm dishes. After about 1~2 weeks, single iPSC colonies were manually picked and transferred to 24-well plates. The colonies with successful gene editing were identified via PCR with inversion-specific primers.
2.3 DNA extraction and genotyping
Genomic DNA was isolated using QuickExtract DNA Extraction Solution (Lucigen). The FVIII gene inversion site was amplified using two primer sets corresponding to the inverted and wild-type gene and Q5 High-Fidelity 2X Master Mix (NEB).
2.4 Differentiation of three germ layers
The patient-derived iPSCs and hemophilia-corrected iPSCs were differentiated into three germ layers (ectoderm, mesoderm, endoderm) using STEMdiff™ Trilineage media (StemCell Technologies) and labeled with germ-layer specific antibodies.
2.5 Immunofluorescence labeling
Cells were fixed with 4% PFA (Sigma) and primary antibodies were incubated with 0.1% TritonX-100/1% BSA overnight at 4°C, followed by the incubation with secondary antibodies for 1.5 h at room temperature. Nuclei were stained with 500 ng/ml Hoechst 33342 trihydrochloride trihydrate (Invitrogen). Samples were mounted with ProLong Diamond Antifade mountant (Invitrogen) and were imaged with a Nikon 1A confocal microscope (Plan Apo OIL 60× oil, 1.40NA).
40 Undergraduate Research at the Swanson School of Engineering
3. RESULTS
PBMCs isolated from the hemophilia patient blood sample were successfully reprogrammed into iPSCs using techniques listed above. Brightfield imaging the course of the 28-day differentiation process reflect a steady transition in morphology from PBMCs to iPSCs (Figure 2). The distinct spatial separation between individual PBMCs gradually diminished, producing iPSC clusters without observable separation between cells.

CRISPR/Cas9 were employed to induce double-stranded breaks at the loci of inversion [3], and the success of the inversion correction was verified through PCR (Figure 3). Two primer pairs were designed to test the success of the gene inversion correction. The primers utilized directional specificity of DNA amplification in PCR to determine the orientation of the gene of interest. The primer pair compatible with the inverted FVIII gene (1F/1R) produced a negative PCR result (band absent), while the primer pair compatible with the inversion-corrected FVIII gene (1F/2F) produced positive PCR result (band present) in corrected clones 12 and 17. In lanes 8 and 9, mixed cell populations both corrected and uncorrected iPSCs produced a positive result from each of the primer pairs. Further isolation and amplification of individual cells from populations 8 and 9 can be utilized to refine pure populations of inversion corrected iPSCs.
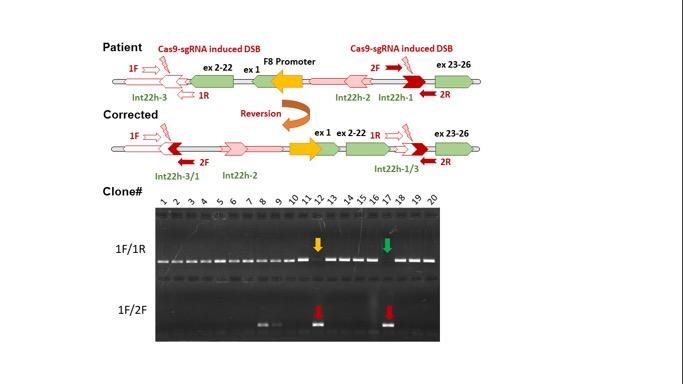
Characterization of both the patient-derived iPSC line as well as the corrected iPSC line included differentiation of both lines into three germ layers and subsequent fluorescence immunostaining to verify successful differentiation (Figure 4). Additionally, fluorescence immunostaining of pluripotency markers conducted to verify iPSC production (Figure 5).
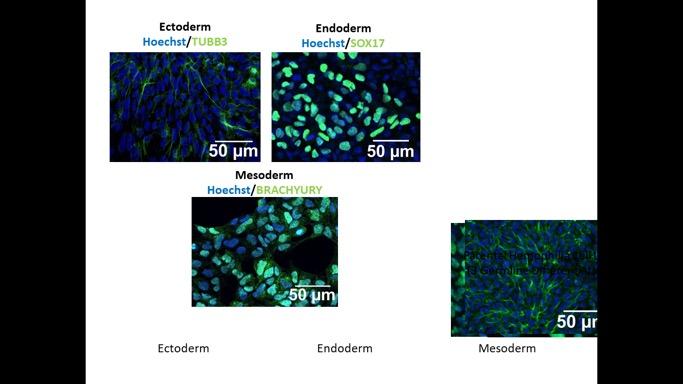
41 Ingenium 2023
Figure 2. Reprogramming of new iPSC lines. Phase contrast image of PBMCs and iPSC clones during reprogramming.
Figure 3. Verification of inversion correction. Top: FVIII gene layout with inverted and corrected primer orientations. Bottom: PCR results indicating overall FVIII inversion correction in Clones 12 and 17.
Figure 4. Differentiation of three germ layers. Fluorescence immunostaining indicate successful differentiation of Hemophilia-corrected iPSC cell line into Ectoderm, Endoderm, and Mesoderm germ layers due to presence of characteristic protein markers TUBB3, SOX17, and BRACHYURY, respectively.
4. DISCUSSION
The results indicate successful development and characterization of a new hemophilia-corrected cell line. Thus, the next step moving forward will be to quantify the effects of the inversion correction on FVIII production. To do so, the corrected and uncorrected iPSCs will be differentiated into ECs and several FVIII analyses will be conducted, including RT-PCR, Western Blotting, and chromogenic assays. Prior to clinical application, potential off target effects must be taken into consideration and mitigated through improved sgRNA specificity and optimized dosage of Cas9sgRNA complex. FVIII production is expected to be increased at least 3-fold in patients receiving corrected EC transplants [4], and continued research with this project has the potential to produce a tangible and affordable therapy solution to Hemophilia A.
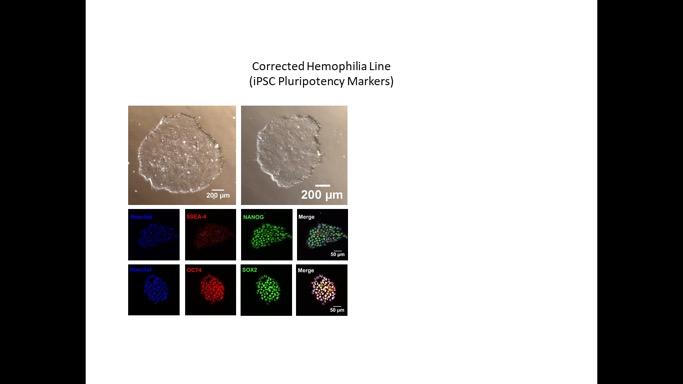
5. CONCLUSION
In this project, mutated PBMCs were isolated from severe Hemophilia A patient blood samples and reprogrammed into iPSCs via Sendai Virus transduction of the Yamanaka factors. CRISPR/Cas9 genome editing techniques were used to correct the FVIII gene inversion, and PCR was used to verify the success of the genome-editing process. Fluorescence immunostaining and germline differentiation techniques successfully verified the pluripotency of both cell lines, allowing for continuation of the project to EC differentiation. Investigation into the quantitative effects of FVIII
production between inversion corrected and uncorrected endothelial cells will provide further insight into the treatment’s efficacy. The applications of this therapy extend beyond the confines of mainstay FVIII replacement therapy in terms of affordability, sustainability, and safety.
6. ACKNOWLEDGEMENTS
Funding was provided by the University of Pittsburgh Swanson School of Engineering, the Wu Lab at UPMC’s Vascular Medicine Institute, and the University of Pittsburgh School of Medicine. Patient samples were provided by the Hemophilia Center of Western Pennsylvania.
REFERENCES
[1] Y. Wu, Z. Hu, Z. Li, J. Pang, M. Feng, X. Hu, X. Wang, S. Lin-Peng, B. Liu, F. Chen, L. Wu, and D. Liang, “In situ genetic correction of F8 intron 22 inversion in hemophilia a patient-specific ipscs,” Scientific Reports, vol. 6, no. 1, 2016.
[2] B. G. M. N. RK; “Blood coagulation factor VIII: An overview,” Journal of biosciences [Online]. Available: https://pubmed.ncbi.nlm.nih. gov/14660878/#:~:text=Factor%20VIII%20 (FVIII)%20functions%20as,most%20commonly%20 inherited%20bleeding%20disorder. [Accessed: 12Nov-2022].
[3] A. V. Anzalone, L. W. Koblan, and D. R. Liu, “Genome editing with CRISPR–Cas nucleases, base editors, transposases and prime editors,” Nature Biotechnology, vol. 38, no. 7, pp. 824–844, 2020.
[4] C.-Y. Park, D. H. Kim, J. S. Son, J. J. Sung, J. Lee, S. Bae, J.-H. Kim, D.-W. Kim, and J.-S. Kim, “Functional correction of large factor VIII gene chromosomal inversions in hemophilia a patient-derived ipscs using CRISPR-Cas9,” Cell Stem Cell, vol. 17, no. 2, pp. 213–220, 2015.
[5] R. J. Barndt, N. Ma, Y. Tang, M. P. Haugh, L. S. Alamri, S. Y. Chan, and H. Wu, “Modeling of dilated cardiomyopathy by establishment of isogenic human IPSC lines carrying Phospholamban C25T (R9C) mutation (UPITTI002-A-1) using CRISPR/Cas9 editing,” Stem Cell Research, vol. 56, p. 102544, 2021.
[6] A. V. Anzalone, P. B. Randolph, J. R. Davis, A. A. Sousa, L. W. Koblan, J. M. Levy, P. J. Chen, C. Wilson, G. A. Newby, A. Raguram, and D. R. Liu, “Searchand-replace genome editing without double-strand breaks or donor DNA,” Nature News, 21-Oct-2019. [Online]. Available: https://www.nature.com/articles/ s41586-019-1711-4. [Accessed: 12-Nov-2022].
42 Undergraduate Research at the Swanson School of Engineering
Figure 5. Characterization of new iPSC line. Top panel: phase contrast image of Hemophilia-corrected iPSCs. Bottom panel: fluorescence immunostaining confirmed the pluripotency of Hemophilia-corrected iPSCs due to presence of characteristic pluripotency markers NANOG, SSEA-4, OCT4, and SOX2.
Biomaterials Design for Bioengineered Meat
Cara Klinger 1, Ashley Koenig 2 , Faris Hazwan3 , Yu Hanry3 and Jennifer L. Young 3
1 Department of Bioengineering, University of Pittsburgh
2 Department of Bioengineering, Johns Hopkins University
3 Mechanobiology Institute, Department of Bioengineering, National University of Singapore
Cara Klinger has always had an interest in medicine and the idea of expanding and improving medical treatments is what drew her to biomedical research. Her main interests are in biomaterials and its application to regenerative medicine.


Jennifer Young got her PhD in Bioengineering (UCSD), did her postdoc at the Max Planck Institute for Medical Research (Heidelberg, DE), and is currently an Asst. Prof. in the Biomedical Engineering Dept. and Mechanobiology Institute at the National University of Singapore. Her main interests are in ECM mechanobiology and biomaterials.
Significance Statement
Traditional methods of meat production require massive amounts of natural resources and energy. Bioengineered meat products are being investigated as a less resource-intensive and more sustainable method of meeting growing demands for meat. To better mimic the structure of real meat, this study used different substrate topographies to promote better cell alignment. Grooved topographies seem to promote better cell alignment compared to flat 2D substrates.
Category: Experimental Research
Keywords : polyacrylamide hydrogels, cultured meat, myoblasts, 3D printed
ABSTRACT
The traditional method for producing meat uses a large percentage of natural resources, including land and water, and is responsible for a sizeable share of greenhouse gas emissions. A more sustainable method of producing meat, bioengineered meat is being evaluated as a less resource-intensive solution is needed. In producing cell-based meat, substrate stiffness and topographical cues have been proven to influence cell growth and differentiation. In this study, polyacrylamide hydrogels with varying stiffnesses and ridges were used as the substrate to culture C2C12 myoblast cells with the expectation that a ridged substrate design would help induce cell alignment in the sample, resulting in better textured meat. The degree of cell alignment was evaluated using immunofluorescent stains and confocal microscopy. The results were unexpected with softer hydrogels showing higher levels of cell alignment, while others aligned in the perpendicular direction of the ridges of the hydrogels instead of parallel to the ridges. Although this project supports the idea that micro-grooved substrates promote more cell alignment in myoblasts, these topographical cues do not control the direction of alignment which poses an additional challenge for the development of bioengineered meat products.
1. INTRODUCTION
The high global demand for meat is projected to progressively increase each year, especially in developing countries [1,2]. As environmental problems arise due to climate change and population growth, more sustainable ways to support the nutrition needs of society are becoming increasingly important. Current methods of meat production are limited to the natural resources available that may not sustain the growing demand for meat [1]. Cultured meat using tissue engineering and biomaterials has the potential to be a more sustainable and ethical way to meet the growing demand for meat as well as optimize its nutritional value.
The traditional method for meat production poses multiple challenges. The massive number of natural resources consumed is one main cause of concern. Large quantities of land are required to raise not only the animals but the food to feed them. An estimated 70% of total freshwater and arable land is consumed in meat production as well as a large portion of energy. About 40% of grains and 75% of soya produced globally is used for animal rearing [1]. This constraint will prevent traditional meat production from being further scaled up in the future as the global population grows. According to the Food and Agriculture Organization of the United Nations (FAO), animal husbandry has contributed to 9% of anthropogenic carbon emissions while emitting 37% of anthropogenic methane, and 65% of anthropogenic nitrous oxide [3]. It is important to note that the two major emissions from husbandry, methane and nitrous oxide, are far more potent than
43 Ingenium 2023
Cara Klinger
Jennifer L. Young
carbon dioxide with the latter being labelled as one of the most potent greenhouse gases by the World Bank [4]. Meat and dairy animals represent 14.5% of all GHG emissions globally [1]. These data have raised red flags about society’s role in climate change. The world also faces a food safety challenge with the emergence of antibiotic resistant bacterial strains from the constant usage of antibiotics in the agricultural industry. Additionally, ethical concerns have been voiced regarding how animals are raised, including but not limited to, the animals’ confinement, behavioral deprivation, and subjection to painful procedures such as dehorning in cattle. [5]. Producing meat in vitro would eliminate the large amount of land and resources required to ethically raise animals as well as the use of antibiotics due to the ease of maintaining sterile environments. Cultured meat would largely reduce the amount of land needed for agriculture, the amount of greenhouse gas emissions released, as well as ethical concerns.
In producing cell-based meat, substrate stiffness and topographical cues have been proven to influence cell growth and differentiation. For example, naïve mesenchymal stem cells (MSCs) will differentiate into neurons on softer substrates and myoblasts on stiffer substrates [6]. Skeletal muscle cells proliferate, fuse along a predetermined axis, and form fascicles composed of striated myofibers. This process can be mimicked by establishing the axis they fuse along through topographical cues. Microchannels with a width ranging from 5-200μm has been shown to induce alignment of myoblasts and channels within 20 to 100μm wide induced optimal myotube maturation. The depth of the channels has also been shown to play a role in cell alignment. Cells cultured on 2μm deep microgrooves had a lower efficacy in induction of cell alignment compared to ones cultured on 7μm deep grooves [7]. Various microchannel scaffolds have been used to culture tissues, including decellularized tissues from plants and animals and synthetic hydrogels. Scaffolding with microchannels is a popular method for guided cell alignment due to tunability and reproducibility. In one study, decellularized celery tissue was used as scaffolding for C2C12 myoblasts. The highly aligned vascular bundle found in celery promoted the alignment of C2C12 cells [7].
Although the usage of scaffolds can create a topographical environment that mimics the in vivo more closely, there is a lack of technology to scale up the process affordably. Bioreactors, which take ideas from other industries such as breweries and their fermentation processes and translate them to mammalian cells, has the potential to merge established technology to commercialize meat production to a necessary scale. Large-scale stirred tank bioreactors (STRs) are an established technology for therapeutic protein production that provide some technical expertise parallel to that needed in meat culture production. The key challenge with this reactor is the shear stress caused from the bioreactor’s impeller-driven mixing and air sparging which detaches cells from scaffolds. The cell lines used in these bioreactors do not need scaffolds like the myocytes used for meat culture [8].
In this study, polyacrylamide hydrogels with varying stiffnesses and ridges were used as the substrate to culture C2C12 myoblast cells to assess the hypothesis that a ridged substrate design would help induce cell alignment in the sample, resulting in better textured meat.
2. METHODS
Two different hydrogel molds were designed in Autodesk Inventor, a computer-aided design (CAD) software (Fig. 1) and 3D printed. Once printed, the molds were coated with a hydrophobic coating using Dichlorodimethylsilane (DCDMS) along with glass microscope slides that acted as the control. Coverslips were treated under a UV-ozone generator and then coated with a methacrylate solution.
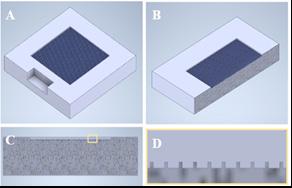
44 Undergraduate Research at the Swanson School of Engineering
Figure 1. 3D Printed Hydrogel Mold. Isometric view of the hydrogel mold including a cross sectional view (C) of the mold and a close up of the cross section showing the ridges (D).
The hydrogel solutions were prepared with various percentages of acrylamide and bis-acrylamide in 10mL of 10X PBS based on the desired stiffnesses. These solutions were then aliquoted and vacuumed. Next, ammonium persulfate (APS) and Tetramethylethylenediamine (TEMED) were added (1/100 and 1/1000 of the total volume of polyacrylamide solution respectively) and the solutions were pipetted onto the molds and covered with the treated coverslips. Once they polymerized, the hydrogels were removed from the molds and were functionalized with collagen.
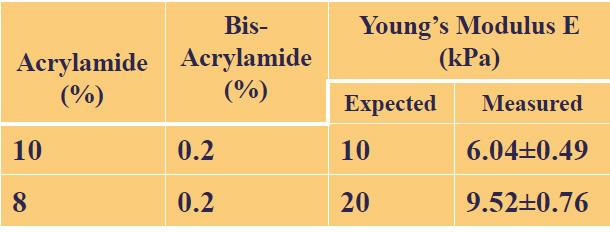
percentages of
based on values from experimental data for the intended hydrogel stiffnesses as well as the actual stiffnesses.
C2C12 myoblasts were cultured in growth media. Once the cells reached 90% confluency, they were resuspended in media and seeded at 100,000 cells per hydrogel. After incubating for 7 days, the samples were fixed with formaldehyde and stained. Immunofluorescence staining of nuclei, actin, collagen, and tubulin was used. The samples were imaged using a Nikon A1R confocal microscope with a 20x lens. The image processing was done using FIJI-ImageJ and CellProfiler.
3. RESULTS
The hydrogels had clear ridges for the 100-micron size in the preliminary images taken (Fig. 3A), but cross-sectional images (Fig. 3B) show that the widths of the ridges were not the exact sizes designed due to the limitations in precision of the 3D printer used. Additionally, it was hard to discern if the ridges were intact for the smaller 25-micron hydrogels, hence the omission of the imaging results. Using nanoindentation technology, the stiffnesses of the hydrogels were measured. The resulting elastic moduli are softer than the expected stiffnesses (Fig. 2).
Quantitative and qualitative results did not support the expected ideal substrate stiffness that should be the group with the closest elastic modulus to that of muscle tissue found in vivo. In Fig. 4C, the 6.5kpa control substrate displays a higher level of alignment compared to that of the 10kpa control substrate. This does not support other literature stating the ideal stiffness for myotube formation as one that mimics the stiffness of muscle tissue which is about 12kpa for C2C12 cells [8,9]. Another unexpected outcome was the cell alignment that was perpendicular to the ridges on the 100-micron 10kpa hydrogel shown in Fig. 4A-C with 2 replicates of each gel except for the control group. Literature only reports cell alignment parallel to the longitudinal direction of microgrooves in the context of patterned 3D substrates [7,9,10].

45 Ingenium 2023
Figure 2. Polyacrylamide Hydrogel Formulations. The table shows the
acrylamide and bis-acrylamide
Figure 3. Polyacrylamide (PAA) Hydrogel. (A) Preliminary images of the gels. (B) The ridges were not precisely 100μm and they were not square. (C) The graph and table indicate the stiffnesses of the PAA hydrogels used in this study.
fixed
of the nuclei was used to measure the cell alignment under the assumption that they are parallel to the rest of the cell shape. (D) A peak at 90° indicates alignment parallel to the ridges while peaks at 0° and 180° indicate cell alignment perpendicular to the ridge orientation. The cell orientation was quantified using Cell Profiler and the graphs were normalized by cell count.
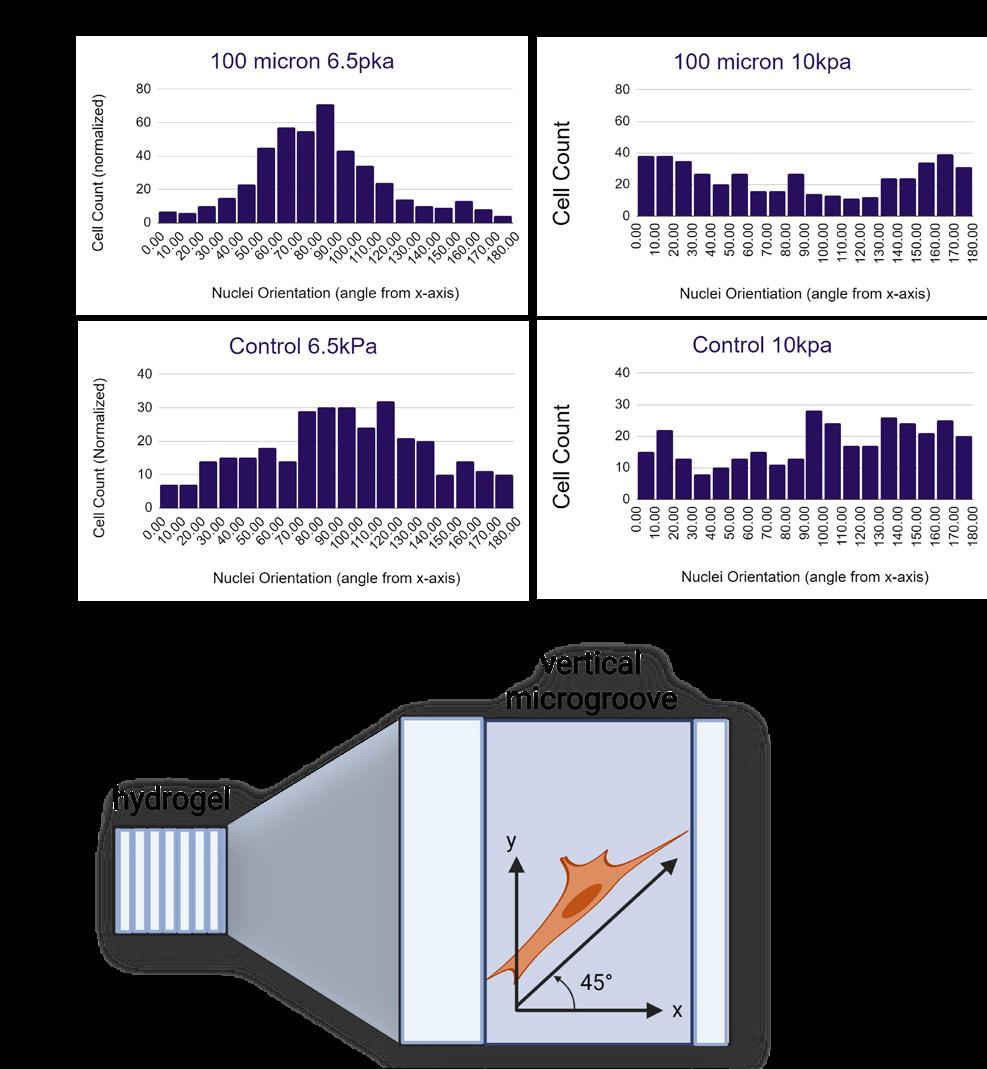
4. DISCUSSION
Although the ridges were clearly present on the 100-micron hydrogels in Fig. 3A-B, there were deformities in the edges that may have been due to sheer stress from taking the hydrogels out of the molds. In the future, we would let the molds set for a longer period to decrease the likelihood of creating deformities in the ridges. Similar variations in the microgroove dimensions are seen in previous work with hydrogels due to the fabrication process [11]. The results produced unexpected outcomes regarding the 100-micron 10kpa hydrogels. Based on Fig. 4, the cells are highly aligned perpendicular to the direction of the ridges. Previous work has shown similar microgroove topography to result in alignment parallel to the longitudinal direction of the ridges, not perpendicular [7,9,10]. Campuzano et al. reported unimodal distribution with a peak of 90 degrees (parallel direction to the ridges) using decellularized celery tissue with similar microgroove topography while the 100-micron 10kpa hydrogel in Fig. 4C has bimodal distribution with a peak of zero and 180 degrees, indicating perpendicular alignment [7]. The data (Fig. 4) was normalized to account for different cell counts. Additionally, the ridges look smaller than the original dimensions. This could be due to deformities created when releasing the hydrogels from the mold or due to tension produced by the cells in this sample.
Fig. 4 also shows the 6.5kpa control group and 6.5kpa 100-micron sample to be more aligned parallel to the ridges than any of the 10kpa samples. This does not follow the trend that a stiffness closer to 12kpa produces ideal results for myoblast differentiation on a 2D scale [10,9]. The reported optimum cell alignment with substrates that are within 25% of 12kpa, the elastic modulus of muscle tissue found in mice [9]. Using a wide range of substrate stiffnesses, the hydrogels at opposite spectrums of 1kpa and glass. Despite the 6.5kpa hydrogels being less than optimum stiffness, the data (Fig. 4) indicates more optimal results than the 10kpa hydrogels [9]. Although Engler et al. state that ridges with widths greater that 5-10 cell widths results in decreased cell alignment, this does not address these results as the ridge widths were constant across the board with slight variation due to the fabrication process and does not explain high cell alignment in an unexpected direction [9].
5. CONCLUSION
Overall, these data support the idea that micro-grooved substrates promote more cell alignment in myoblasts that better mimics the highly aligned muscle fibers of meat. The micro-grooved hydrogels had higher levels of organized cell alignment compared to the 2D substrates with the caveat of the 10kpa micro-grooved sample organizing perpendicular to the longitudinal direction of the grooves. These data are still preliminary. Thus,
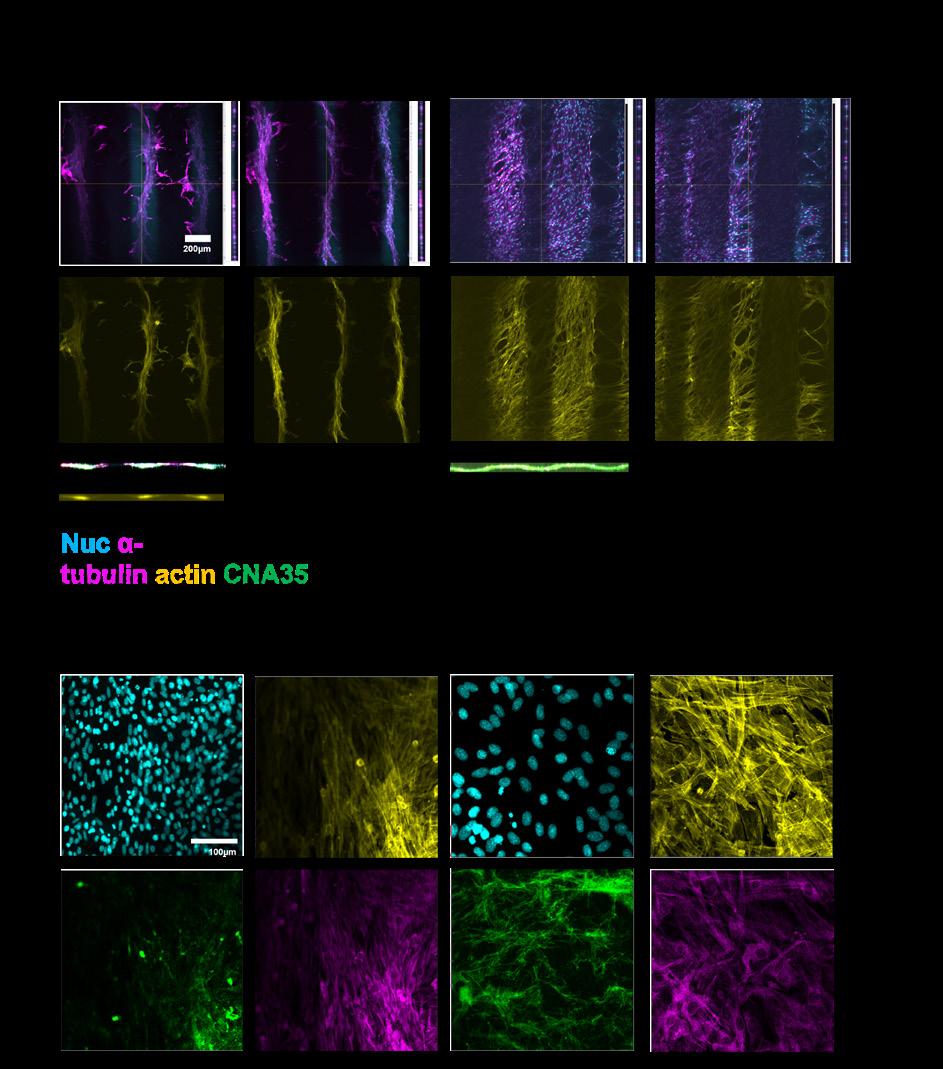
46 Undergraduate Research at the Swanson School of Engineering
Figure 4. Myoblast Cell Alignment Results. (A, B) Images taken with the Nikon A1R confocal microscope and processed in ImageJ. Four different immunofluorescent stains were used after the samples were
and incubated for a week. (C) The shape
further testing and a more detailed quantitative analysis are required to support these results. In the future, the intensity of the beta tubulin could be measured as a proliferation marker and as an indicator that the myotubes have fused. Cell shape, length, and aspect ratio could also be quantified. Further investigation into different stiffnesses, depths and widths of microgrooves, topographies, and materials should be carried out as well. To better simulate meat, future experiments could be co-cultured with adipocytes on Poly(N-isopropylacrylamide) (PNIPAM)based hydrogels. This would allow for proper fat to muscle ratios seen in meat. In addition, PNIPAM hydrogels have thermosensitive properties making the substrates easily removeable so that they would not be consumed in the final product. Micro-grooved scaffolds have promising potential in creating cultured structured meat that would maintain, if not improve, the experience of consuming meat. Fiber alignment is a key morphologic feature of muscle cells, and you can control the percentages of fat specific to individual preferences. Successful implementation of in vitro meat into the food industry would have substantial environmental benefits through the elimination of animal husbandry which is a major contributor to anthropogenic methane and nitrous oxide emissions as well as significantly decrease the square footage of land required for agriculture due to the elimination of livestock feed. This would also reduce the ethical concerns around animal welfare and diminish food safety issues.
6. ACKNOWLEDGEMENTS
Funding was provided by the Swanson School of Engineering, the Bioengineering Department, and the Office of the Provost at the University of Pittsburgh as well as the Mechanobiology Institute at the National University of Singapore. The project was carried out under the guidance of Professor Jennifer Young, Ph.D.
REFERENCES
[1] P. Kumar, N. Sharma, et al., “In-vitro meat: a promising solution for sustainability of meat sector.” Journal of Animal and Science Technology. vol. 60, no. 4, pp. 693-724, 2021. [2055-0391]. Available: https:// doi.org/10.5187/jast.2021.e85. [Accessed Oct. 2022].
[2] M. Font-i-Furnols, L. Guerrero, “Understanding the future meat consumers,” Meat Science, vol. 193, November 2022. [0309-1740]. Available: https://doi. org/10.1016/j.meatsci.2022.108941. [Accessed Jan. 2023].
[3] R. Shi, M. Irfan, G. Liu, X. Yang, X. Su, “Analysis of the Impact of Livestock Structure on Carbon Emissions of Animal Husbandry: A Sustainable Way to Improving Public Health and Green Environment,” Frontiers in public health, vol. 10, 2022. [2296-2565]. Available: https://doi.org/10.3389/ fpubh.2022.835210. [Accessed Jan. 2023].
[4] S. Sharma, et al., “In vitro meat production system: why and how?” Journal of Food Science and Technology, vol. 52, pp. 7599-7607, 2015. Available: https://doi.org/10.1007/s13197-015-1972-3. [Accessed Jan. 2023].
[5] J.O. Hampton, T.H. Hyndman, et al., “Animal Harms and Food Production: Informing Ethical Choices,” Animals (Basel), vol. 11, 2021. Available: https://doi. org/10.3390/ani11051225. [Accessed Jan. 2023].
[6] A. J. Engler, S. Shen, H. L. Sweeney, and D.E. Disher, “Matrix Elasticity Directs Stem Cell Lineage Specification,” Cell, vol. 126, no. 4, pp. 677-689, 2006. Available: https://doi.org/10.1016/j.cell.2006.06.044. [Accessed May 2022].
[7] S. Campuzano, N. B. Mogilever, A. E. Pellin, “Decellularized Plant-Based Scaffolds for Guided Alignment of Myoblast Cells,” bioRxiv, 2020.
[8] A. J. Scott, P. A. De Bank, Ellis Marinanne J., “Bioprocess Design Considerations for Cultured Meat Production with a Focus on the Expansion Bioreactor.” Frontiers in Sustainable Food Systems, vol. 3, 2019.
[9] A. Engler, M, Griffin, et al., “Myotubes differentiate optimally on substrates with tissue-like stiffness : pathological implications for soft or stiff microenvironments,” Journal of Cell Biology, vol. 166, no. 6, pp. 877-887, 2004. [0021-9525]. Available: https://doi.org/10.1083/jcb.200405004. [Accessed May 2022].
[10] S. Constantini et al., “Engineering Muscle Networks in 3D Gelatin Methacryloyl Hydrogels: Influence of Mechanical Stiffness and Geometrical Confinement,” Frontiers in Bioengineering and Biotechnology, vol. 5, no. 22, 2017. [2296-4185]. Available: https://doi. org/10.3389/fbioe.2017.00022. [Accessed May 2022].
[11] S. Hume, S. Hoyt, et al., “Alignment of multi-layered muscle cells within three-dimensional hydrogel macrochannels,” Acta Biomaterialia, vol.8, no. 6, pp. 2193-2202, 2012. [1742-7061]. Available: https://doi. org/10.1016/j.actbio.2012.02.001. [Accessed Jan. 2023].
47 Ingenium 2023
Mechanisms of Macrophage Recruitment and Infiltration in HER2+ Breast Cancer
Laurel Koehler 1, Youngbin Cho1, and Ioannis Zervantonakis1,2
1 Tumor Microenvironment Engineering Laboratory, Department of Bioengineering, University of Pittsburgh
2 UPMC Hillman Cancer Center
Laurel Koehler was born and raised in East Greenwich, Rhode Island. Her passion for living things and biology has lead to her majoring and doing research in bioengineering and she hopes to go into veterinary school post graduation.

Youngbin Cho completed his BS in Mechanical Engineering in Korea University, and PhD in Mechanical Engineering at KAIST, South Korea. He is currently investigating the breast cancer/immune cell interaction in microfluidic system in Dr. Zervantonakis’s lab as a postdoctoral trainee.

Ioannis Zervantonakis was born in Athens (Greece), completed his BS in Mechanical Engineering, PhD in Mechanical/Biological Engineering and postdoc fellowship in Cancer Biology. His lab is interested in developing microfluidics- and systems biologybased approaches to understand how cancer cells interact with their environment.
Significance Statement
In cancer patients, therapy resistance is a major challenge, causing increased tumor growth and metastasis. Though an understudied part of the immune system, macrophage recruitment to tumors has been shown to increase cancer growth as well as contribute to treatment resistance. Therefore, by discovering the exact mechanisms behind which chemical gradients cause macrophage recruitment, we can come a step closer to preventing cancer therapy resistance and improving clinical outcomes overall.
Category: Experimental Research
Keywords : breast cancer, macrophage, tumor microenvironment, therapy resistance
ABSTRACT
Despite cancer treatments drastically improving over the last few decades, therapeutic resistance continues to be an ongoing challenge. However, there are links being studied between the immune response to treatment and resistance development. More specifically, macrophage recruitment and infiltration into tumors has shown to affect therapy resistance in many different forms of cancer treatment. In this study, we looked at HER2+ cancer, which is a particularly aggressive form of breast cancer that tends to have poor clinical outcomes as well as drug resistance to antibody treatments. We looked at different factors that cause increased macrophage infiltration into a simulated tumor microenvironment (TME) in the form of a collagen gel solution. We particularly focused on determining whether co-cultured monocytes and cancer cells within the droplet would recruit more macrophages than the only cancer cell condition. Overall, we found that the co-cultured condition causes significantly increased macrophage recruitment, which will allow us to continue to break down the mechanisms of this phenomena in future research.
1. INTRODUCTION
Human Epidermal Growth Factor Receptor 2-positive (HER2 overexpressing or HER2+) breast cancer is a particularly aggressive subtype of breast cancer with a five-year survival rate of 30% for stage 4 patients [1]. HER2 is a tyrosine kinase transmembrane protein within the cancer cell that is responsible for the activation of downstream signaling pathways, PI3K and MAPK, which promote cell proliferation, migration, invasion, and survival [2]. Therefore, an overexpression of HER2 typically results in worse clinical outcomes. In recent decades, monoclonal antibody treatment has become an increasingly effective way at treating HER2+ cancer as well as other aggressive forms of cancer. However, researchers are finding that adverse immune responses can be triggered and cause drug resistance to develop [3].
The number of tumor associated macrophages (TAMs) within the TME is often associated with certain clinical outcomes in cancer patients and offers a predictive role in therapy response. Macrophages are an incredibly important aspect of the innate immune system and maintain homeostasis within the body by attacking foreign invaders and triggering a more comprehensive immune response. However, in many states of disease, including within the TME, macrophages can become dysregulated and produce a pro-tumorigenic affect as well as promoting cancer treatment resistance. In HER2+ breast cancer, some studies are finding a connection between the amount of macrophage recruitment and negative clinical outcomes in patients, particularly due to treatment resistance [4]. Past research specifically focused on monocyte polarization into TAMs and concluded that
Ingenium 2023
Laurel Koehler
Youngbin Cho
48
Ioannis Zervantonakis
the negative regulatory immune molecules within the TME cause said adverse clinical outcomes mentioned above [5]. Therefore, by researching specific chemical factors that attract macrophages to the TME, as we do in this study, we can determine the mechanistic methods of action of these TAMs.
We believe that in showing that monocytes co-cultured within a cancer TME cause an increase in further macrophage recruitment, we can continue to research chemical factors that cause this to occur. Ultimately, understanding the mechanisms that aid macrophage recruitment and infiltration into the TME may lead to not only increased therapy response, but better clinical outcomes overall.
2. METHODS 2.1 Cell Culture
Two different human HER2+ breast cancer cell lines, HCC1954 and SKBR3, and THP-1, a human leukemia monocytic cell line, were used within the study. Each cell line was cultured in 10% Fetal Bovine Serum and 1% Pen Strep in RPMI culture media.
For cancer cell detachment from the plates, they were washed with PBS and treated with 2 mL of trypsin. After five minutes of incubation, the cells were sprayed with 5 mL of RPMI media to complete the detachment.
2.2 Collagen Optimization
Within the collagen concentration optimization process, the collagen gel solution was made using a mixture of PBS, NaOH, pure collagen, and cell culture water created by distillation. Then, 1 mg/mL, 1.5 mg/ mL, and 2 mg/mL collagen concentrations were used to determine the best baseline infiltration for the macrophages within a control droplet with no seeded cancer or THP-1 cells. The same experiment was then recreated with a cancer cell seeded droplet to further confirm the results of the control droplet.
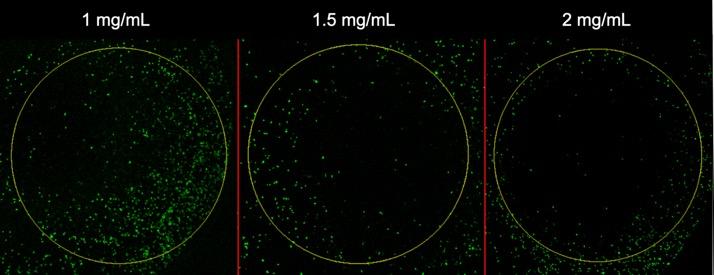
2.3 Co-Culture Experiments
Within the co-culture experiments, the HER2+ cells and undifferentiated THP-1 monocytes were seeded into an in vitro collagen droplet to model the TME. We used four different conditions to seed into the collagen droplet including a control with no cells seeded, only monocyte cells, only cancer cells, and monocytes co-cultured with cancer cells. The cells were seeded into the collagen at 40E6 cells per mL, pipetted into the 96-well plate at 2.5 µL per droplet, and put in the incubator at 37ºC for 25 minutes to solidify the droplets. 200 µL of RPMI media was put into each well and then the plate was incubated for 48 hours before seeding the macrophages.
Figure 1. Macrophage Seeding Methodology. This figure presents a visual representation of the PMA differentiated macrophages being seeded on top of a cancer-containing collagen droplet and the subsequent infiltration of the macrophages into the droplet.
To seed the macrophages on top of the droplet, the undifferentiated THP-1 monocytes were seeded into a 6-well plate at 2E6 cells per well. They were treated with 25 mg/mL PMA for 24 hours, washed, and recovered for 48 hours for macrophage differentiation. The macrophages were then scraped and stained with CellTrackerTM Green CMFDA dye. They were seeded into the media surrounding the collagen droplet and left to infiltrate for 48 hours. In subsequent experiments, CD14 primary monocyte cells from patient donors were used in conjunction with the THP-1 cells to test primary vs. cell line infiltration. Primary cell lines, while more time consuming to experiment with, typically yield more accurate biological results in comparison to cell lines.

After 48 hours, the plates were fixed with 100 µL formaldehyde, endpoint imaged using a confocal microscope, and analyzed using the TrackMate software within ImageJ. The TrackMate software allowed us to count each individual macrophage that infiltrated into the collagen droplet, and we divided that number by the total area of the droplet to get normalized data.
3. RESULTS
In our collagen gel solution optimization process, the overall THP-1 infiltration decreased as collagen concentration increased with 1 mg/mL having the most infiltration and 2 mg/mL having the least.
decrease in the amount of macrophage infiltration into the collagen droplet can be seen.
49 Ingenium 2023
Figure 2. Baseline Collagen Concentration Optimization. Baseline macrophage infiltration into 1 mg/mL (left-hand image), 1.5 mg/mL (middle image), and 2 mg/mL (righthand image) collagen gel. As the collagen gel concentration increases, a visable
We determined 2 mg/mL to be the ideal experimental condition based on it having the least amount of baseline macrophage infiltration. By lowering the infiltration of our control condition, we can see a more distinct result in our experimental condition results. In following experiments, we used the same collagen concentration (1 mg/mL, 1.5 mg/mL, and 2 mg/mL) and included a condition with the SKBR3 cell line seeded within the collagen droplet to further confirm that 2 mg/mL would yield the results that would be most
in
representation of macrophage infiltration into SKBR3 containing collagen gel for 1, 1.5, and 2 mg/ mL concentrations. Displays similar results as Figure 2, confirming that 2 mg/mL collagen concentration yields the lowest macrophage infiltration.
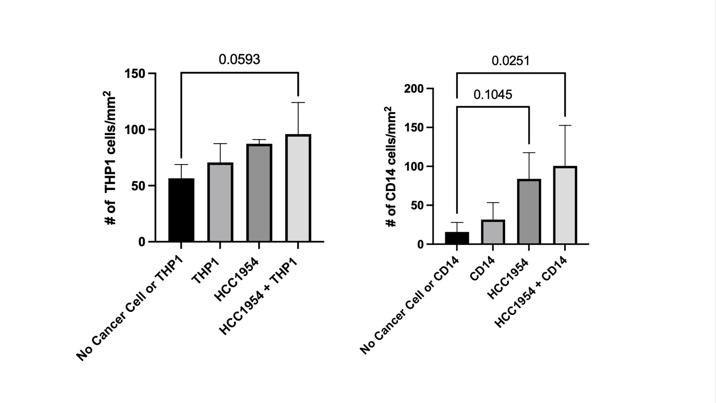
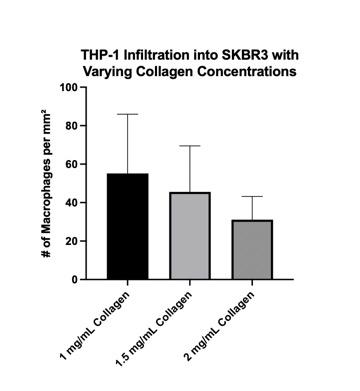
This condition yielded the same results as the control condition in that the 1 mg/mL gel had the highest infiltration and 2 mg/mL had the lowest, which can be observed in the decreasing trend in the graph as collagen concentration increases. This was effective in further confirming our choice in using the 2 mg/mL as the optimal condition to receive more distinct results. Within our co-cultured monocyte and cancer cell experiment, both THP-1 and CD14 infiltration increased in the combined HCC1954 cancer cell and monocyte co-culture condition. However, primary CD14 showed significantly lower baseline infiltration than THP-1 cells with about 70% less CD14 infiltration than THP-1. As THP-1 are very mobile cells, this was an expected result.
While the figure represents an upward trend in the THP-1 infiltration, statistical analysis reveals that only the difference between the control and the co-culture was statistically significant. This suggests that while the THP-1 monocyte and cancer co-culture effectively attracts macrophages, further research must be done to confirm this result. We may be able to attribute this due to a high THP-1 passage number at the time of the experiment. However, for the CD14 conditions, an ANOVA statistical analysis revealed a statistically significant difference for the cancer cell and monocyte co-culture with a p value of 0.0251 when compared to the control condition. Since only the co-culture condition yielded significant results, it furthered the conclusion that the monocyte and cancer cell co-culture causes increased macrophage infiltration.
4. DISCUSSION
Within non-cancerous, healthy tissue and blood vessels, there are both tissue resident macrophages responsible for maintaining tissue integrity and recruited macrophages that migrate from marrow. Tumors within the TME have macrophages similar to the tissue macrophages in that they function to maintain and promote tumor growth [6]. In our experiment results, the combined co-cultured monocytes and HCC1954 cells recruited significantly more macrophages than the other conditions, especially in regard to the primary monocyte cell line, CD14. Therefore, when applied in a clinical situation, this suggests that TAMs are in part responsible for the recruitment of outside macrophages from different parts of the body. While there could be several cytokines and chemical factors released by the TAMs to cause this recruitment, confirming that TAMs play a part in recruiting outside macrophages gives us reason to continue to investigate the specific gradients responsible for the recruitment.
50 Undergraduate Research at the Swanson School of Engineering
Figure 3. Collagen Optimization
SKBR3. A graphical
Figure 4. +/- HCC1954 and Monocyte Co-Culture. Total macrophage infiltration increases with the presence of co-cultured cancer and undifferentiated monocytes in comparison to the control, only monocyte, and only cancer cell conditions.
5. CONCLUSION
The higher infiltration of THP-1 and primary CD14 cells into the collagen droplet containing co-cultured HER2+ and monocyte cells show that undifferentiated monocytes seeded within the droplets play a role in increased macrophage recruitment. This suggests that macrophages already contained within the TME are aiding in the recruitment of outside macrophages and therefore eliciting a stronger immune response.
Additional steps to the continuation of this research can continue in multiple directions. One of which is to include conditions with varying macrophage secretion factors to determine specific chemical gradients that may be attracting the non-tumor associated macrophages to the TME. Another path that can be taken is the addition of a specific monoclonal antibody immunotherapy drug, trastuzumab, which is an effective cancer therapy that often sees drug resistance development in HER2+ breast cancer. Both directions may reveal more about the mechanisms of macrophage infiltration and recruitment and help to overcome cancer immunotherapy resistance.
6. ACKNOWLEDGEMENTS
Thank you to the Bioengineering Department within the Swanson School of Engineering and the Office of the Provost at the University of Pittsburgh for funding this study. I would like to include a special thank you to Youngbin Cho, Ioannis Zervantonakis, and other members of the Tumor Microenvironment lab for offering their help and expertise.
REFERENCES
[1] R. Gupta et al., “Therapeutic landscape of advanced HER2-positive breast cancer in 2022,” Med Oncol 2022 Oct 12;39(12):258. doi: 10.1007/s12032-02201849-y. [Accessed November 6, 2022].
[2] C. Marchiò et al., “Evolving concepts in HER2 evaluation in breast cancer: Heterogeneity, HER2-low carcinomas and beyond,” Seminars in Cancer Biology, Volume 72, 2021, Pages 123-135, doi: 10.1016/j.semcancer.2020.02.016. [Accessed November 6, 2022].
[3] Kreutzfeldt J, Rozeboom B, Dey N, De P, “The trastuzumab era: current and upcoming targeted HER2+ breast cancer therapies,” Am J Cancer Res. 2020 Apr 1;10(4):1045-1067. PMID: 32368385; PMCID: PMC7191090. [Accessed November 14, 2022].
[4] Rasheed A, Rayner KJ, “Macrophage Responses to Environmental Stimuli During Homeostasis and Disease,” Endocr Rev. 2021 Jul 16;42(4):407-435. doi: 10.1210/endrev/bnab004. [Accessed November 10, 2022]
[5] Honkanen, T.J., Tikkanen, A., Karihtala, P. et al. “Prognostic and predictive role of tumour-associated macrophages in HER2 positive breast cancer,” Sci Rep 9, 10961 (2019). https://doi.org/10.1038/s41598-01947375-2. [Accessed January 12, 2023].
[6] Cotechini T, Atallah A, Grossman A, “Tissue-Resident and Recruited Macrophages in Primary Tumor and Metastatic Microenvironments: Potential Targets in Cancer Therapy,” Cells. 2021 Apr 20;10(4):960. doi: 10.3390/cells10040960. [Accessed November 11, 2022].
51 Ingenium 2023
Pore Size and Mechanical Strength of Silk Fibroinbased Tissue Engineered Vascular Grafts
Connor La Marca1, Isabelle Chickanosky 1 , Cyrus Darvish1, Justin Weinbaum1, David A. Vorp1
1Vascular Bioengineering Laboratory, Department of Bioengineering, University of Pittsburgh.
Connor La Marca was born and raised in Milford, PA. He wishes to implement tissue engineering and regenerative medicine techniques to treat vascular diseases. He is also excited to employ his passion for human-centered design and rapid prototyping in his future career.

ABSTRACT
Isabelle K. M. Chickanosky is a PhD CATER T32 and Berenfield Fellow in the Department of Bioengineering. Her passion for materials engineering began in her undergraduate degree, and she continues to pursue related research at the intersection of polymeric biomaterials and endometriosis-related research, namely machine learning diagnosis and microfluidic modeling.

David A. Vorp, PhD, is the Associate Dean for Research at the Swanson School of Engineering. He is also a professor of Bioengineering, with secondary appointments in the Departments of Cardiothoracic Surgery, Chemical and Petroleum Engineering, and Mechanical Engineering and Materials Science at the University of Pittsburgh.

Significance Statement
Tissue engineering as a field is working to make available off-the-shelf vascular grafts for surgical intervention in the context of cardiovascular disease, but these grafts need to be further developed before becoming more widely accepted. One embodiment of our lab’s tissue engineered vascular graft (TEVG) is comprised of a silk scaffold, and this work demonstrated that decreasing the freezing temperature during fabrication had no significant effect on pore size, but significantly decreased the circumferential strength of the scaffold.
Category: Experimental Research
Keywords : Tissue Engineered Vascular Grafts, Silk Fibroin, Pore Size, Mechanical Strength
Cardiovascular disease (CVD) is the leading cause of death worldwide. With almost 700,000 deaths in the United States alone, CVD caused over 20% of total deaths in 2021 making it vital to develop a treatment. Vascular bypass surgery using native tissue is currently the optimal treatment for patients requiring surgery, but 50% of autologous grafts fail within 10 years. The CDC additionally states that autologous grafts are not available to many patients. Synthetic grafts are one alternative that can be mass produced, but they are not replaced by native tissue and cannot heal or grow with the patient. TEVGs, as engineered by our lab, degrade as they are replaced by native tissue, which can grow with the patient. Our lab fabricates bi-layered TEVGs from silk fibroin, in which the inner layer is porous, allowing for cell infiltration, and the outer layer is electrospun, providing additional strength and sealing the graft. The purpose of this work was to compare the circumferential strength of TEVGs with different pore sizes, controlled by fabricating the inner porous layer using different freezing temperatures. We hypothesized that lower freezing temperatures would decrease pore size and increase scaffold strength. This result is commonly observed in other polymeric scaffolds fabricated in a similar method to our technique. However, SEM imaging determined that pore size and porosity did not significantly change at different freezing temperatures. Additionally, uniaxial tensile testing and burst pressure testing determined that scaffold burst pressure and circumferential strength decreased at the lower freezing temperature.
1. INTRODUCTION
Cardiovascular disease (CVD) is the leading cause of death worldwide [1], and with almost 700,000 deaths in the United States alone, CVD caused over 20% of total deaths in 2021 [2]. Coronary artery disease is the most common CVD and causes over half of the deaths caused by CVD. With about 7.2% of adults 20 years of age and older presenting coronary artery disease, it is vital to develop a treatment [2]. Vascular bypass surgery using native tissue is currently the optimal treatment for patients requiring surgery, but autografts have limited availability to patients and 50% of implants fail within 10 years. The prevalence of cardiovascular disease as the leading cause of death in the world has driven the development of improved tissue engineered vascular grafts (TEVGs) [3]. TEVGs are emerging as an alternative for arterial bypass surgery and can be fabricated using native-derived or synthetic materials [4]. Synthetic grafts are one alternative and can be mass produced. However, they do not degrade or allow for cell infiltration so they cannot heal or grow with patients as TEVGs do. [5]. Our lab has previously fabricated bi-layered scaffolds consisting of an inner porous layer and an outer electrospun layer consisting of silk fibroin derived from Bombyx mori
Ingenium 2023
David A. Vorp
Isabelle K. M. Chickanosky
52
Connor La Marca
cocoons [6]-[8]. Silk fibroin is a biocompatible and FDAapproved natural polymer used for its low antigenicity, biodegradability, and tunable mechanical properties [9]. The inner layer is the porous region of the scaffold, which makes up most of the thickness of the scaffold and is meant to support infiltration of host cells that will ultimately guide remodeling of the scaffold into native tissue. The outer electrospun layer mainly contributes to the strength of the graft [10], but the inner layer of other bi-layered scaffolds has also been shown to influence the mechanical strength of the scaffold [11].
During our fabrication process, aqueous silk fibroin is frozen in a tubular mold to form the porous layer. In other polymeric materials, namely poly(L-lactideco-glycolide-co-ε-caprolactone), decreasing the freezing temperature of the porous layer has been demonstrated to decrease pore size and porosity and increase compressive strength [11]. We test the circumferential strength of our scaffolds through tensile testing instead of compressive testing as performed by this previous group. However, we anticipate that the overall material strength of the scaffolds will increase when fabricated with smaller pore sizes, and that a smaller pore size can be achieved using a lower freezing temperature.
Increasing the circumferential strength of silk fibroin scaffolds is vital to advance towards a viable implant for large animal models and eventually for human patients. This work aimed to identify changes in mechanical properties of bi-layered silk fibroin TEVGs by manipulating the pore size of the inner layer of the scaffolds. We hypothesized that lower freezing temperatures would decrease pore size in silk fibroin scaffolds, resulting in an increase in burst pressure and circumferential strength of the scaffold.
2. METHODS
2.1 Scaffold Fabrication
Scaffolds were fabricated by isolating aqueous silk fibroin and freezing the solutions in custom steel molds. 8% aqueous silk fibroin solution was injected into tubular molds consisting of 3D printed caps, a steel tube outer mold (8 mm internal diameter, 4 cm long), and a stainless-steel rod inner mold (4 mm diameter, 5 cm long) based on previously published processes [12]. Scaffolds were frozen for 1.5 hours at -20° C or -80° C, lyophilized for 24 hours, and electrospun with a 10% polycaprolactone and 10% fibroin in hexafluoro2-propanol solution. Both the -20° C and -80° C groups have n=4 scaffolds. Scanning electron microscopy (SEM) images were taken of each scaffold, yielding pore size and porosity of each batch. Mechanical tests consisted of ring testing and burst pressure testing, characterizing the scaffold’s stiffness and circumferential strength, respectively (Figure 1).
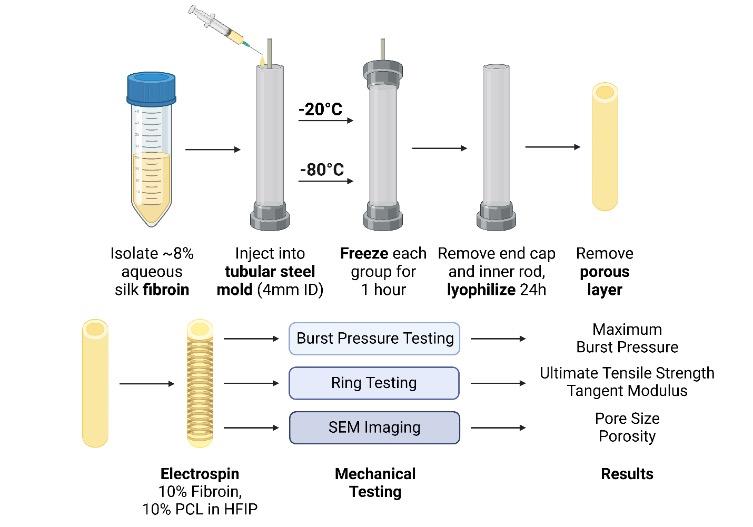
2.2 Scaffold Characterization
2.2.1 Burst Pressure Testing
Cylindrical burst pressure testing determined the scaffold’s ability to withstand transmural pressure. 30-40 mm sections (n=4) of the scaffolds were cut and a cylindrical latex membrane was drawn through the center. The sample was then mounted to stainless steel tubes in a custom burst chamber and submerged in water. A syringe increased the hydraulic pressure in the membrane until the scaffold burst, and the maximum pressure was recorded by a digital manometer (pressure range 0-60 psi, Weisz).
2.2.2 Ring Testing
Ring testing was performed to determine the scaffold’s circumferential strength and stiffness. 4 mm wide slices of each scaffold (n=4) were cut, and two steel wires were placed through the lumen of the ring for clamping. Each sample was placed in a uniaxial tensile testing device (Instron model 5543A) and tested at a constant speed of 2 mm/min. The cross-sectional area, average thickness, and length of the section were calculated by taking pictures of each section next to a ruler and analyzing the images with ImageJ software (National Institutes of Health Laboratory for Optical and Computational Instrumentation, Madison, WI ) [13]. Raw data was recorded as force-displacement and was analyzed using a MATLAB (MathWorks, Natick, MA) [14] script to calculate stress. To account for the change in cross-sectional area of the scaffold as it deforms, the Cauchy stress was calculated using the following equation: s =(F/a 0)(1+ d/ l 0), where s is stress, F is load, a 0 is initial cross-sectional area, d is displacement, and l 0 is the initial outer diameter of the scaffold. The maximum Cauchy stress value prior to failure was recorded as
53 Ingenium 2023
Figure 1. Fabrication method for silk scaffolds with two different freezing temperatures.
ultimate tensile strength (UTS). Elastic tangent modulus was calculated from the slope of the linear section of the stress-strain curve.
2.2.3 SEM Imaging
Scanning electron microscopy (SEM) was used to determine pore size and porosity. Images were taken of 4 mm long sections of each scaffold using a JEOL JSM 6335F. After being cut, sections were vacuum dried and coated in 10 nm of an Au/Pd alloy. Three 100X images were taken of each section (n=4), and the average pore size and porosity was measured for each batch using ImageJ. Threshold analysis was used to identify each pore size, determine the percent area of pores (porosity), and quantify the average number of pores in the area of interest.

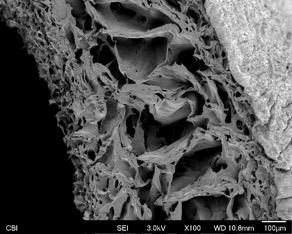
2.3 Statistical Analysis
For statistical analysis, all measurements between groups were compared using a 2-sample t-test. Outlier analysis was performed on all strength test measurements to verify that all scaffolds were fabricated uniformly by analyzing the results for burst pressure, tangent modulus, and UTS. For each metric, the results from each scaffold were verified to be within a two standard deviation range of the mean for the respective batch.
3. RESULTS
The pore size of the scaffolds frozen at -80° C, 718 ± 77 μm2 (mean ± standard deviation), was not significantly different (p=0.64) than the pore size of the scaffolds frozen at -20° C, 754 ± 99 μm2 (Figure 2). There was also negligible difference (p=0.42) in porosity between the -80° C and -20° C scaffolds (63.2 ± 2.32% vs 60.7 ± 4.42%). However, analysis found that for scaffolds frozen at -20° C vs -80° C, the burst pressure was 852 ± 101 mmHg vs 580 ± 38.4 mmHg, the tangent modulus was 0.62 ± 0.10 MPa vs 0.26 ± 0.04 MPa, and UTS was 0.42 ± 0.10 MPa vs 0.14 ± 0.02 MPa (Figure 3). All mechanical tests were statistically significant (p<0.05), so all measured metrics of strength decreased at lower freezing temperatures.
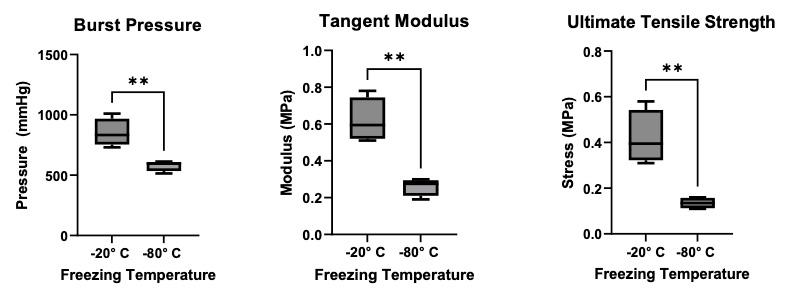

54 Undergraduate Research at the Swanson School of Engineering
(A) (B) (C) (D)
Figure 2 Representative images of n=4 samples frozen at (A) -20° C and (B) -80° C; scale bar = 100 μm. The average pore size (C) and porosity (D) of scaffolds at each freezing temperature.
(A) (B) (C)
Figure 3. (A) The maximum hydraulic pressure in each batch of scaffolds before rupture. (B) The tangent modulus of elasticity of ring samples. (C) The maximum circumferential stress exhibited by ring samples before failure. ** indicates p<0.05 using a 2-sample t-test.
4. DISCUSSION
We hypothesized that decreasing freezing temperature would decrease pore size and increase mechanical strength in fibroin-based scaffolds. However, decreasing freezing temperature had no effect on pore size and porosity, and the decreased temperature significantly decreased the mechanical strength of the scaffolds in each test. One potential reason for this observation could be that the silk may develop weaker microstructures when frozen in solution at lower temperatures. Byette et al. found that silk fibroin solutions frozen at -22° C formed interconnected, porous structures, while solutions frozen at -73° C formed stacked leaflet structures with decreased compressive strength and modulus [15]. In our study, freezing at -20° C occurs slowly, with the entire mold and solution uniformly changing temperature. At -80° C, however, rapid cooling effects cause outer surfaces of the mold to cool before the inner solution [16]. Rapid cooling results in directional water crystallization that pushes fibroin solutes into sheets that freeze as parallel leaflets between ice walls. Conclusions based on the formation of these leaflets are qualified by the limited research on this phenomenon, as leaflets are not commonly abundant and normally present themselves intermittently throughout solution [17], [18]. Finally, all data is limited by the small sample size, and a more robust test of silk fibroin frozen at different temperatures is necessary to make a decisive conclusion on changes in silk fibroin strength at lower freezing temperatures.
5. CONCLUSION
This study investigated the effect of freezing temperature on pore size of the inner layer of silk fibroin based TEVGs and the scaffold’s change in mechanical properties. Scaffolds were prepared with porous layers frozen at -20° C and -80° C, before being electrospun, mechanically tested, and imaged. Ultimate tensile strength and tangent modulus were obtained from ring testing, characterizing circumferential strength and stiffness. The maximum endurable transmural pressure was determined by burst pressure testing. It was hypothesized that a lower freezing temperature would decrease pore size and increase mechanical strength. However, SEM imaging demonstrated that freezing temperature did not significantly change the pore size of the scaffolds, and mechanical testing demonstrated that all three measured metrics of strength decreased for the lower freezing temperature. In the future, we will investigate mechanical and material properties at other ranges of freezing temperatures. Additionally, we could examine patency of grafts implanted in vivo. Lastly, to compare the microstructures of the different fabrication temperatures we could use cryogenic focused ion beam milling with SEM (cryoFIB-SEM), which is used to precisely analyze the microstructure of fragile natural fibers.
6. ACKNOWLEDGEMENTS
This work was supported by the Swanson School of Engineering, the Office of the Provost, and the Department of Bioengineering to CLM and NIH grant R61HL154102 to DV.
55 Ingenium 2023
REFERENCES
[1] S. Murphy, K. Kochanek, J. Xu, and E. Arias, “Mortality in the United States, 2020 key findings data from the national vital statistics system,” Dec. 2021. Accessed: Oct. 28, 2022. [Online]. Available: https://www.cdc. gov/nchs/data/databriefs/db427.pdf
[2] M. S. Shiels, A. T. Haque, A. Berrington de González, and N. D. Freedman, “Leading Causes of Death in the US During the COVID-19 Pandemic, March 2020 to October 2021,” JAMA Internal Medicine, vol. 182, no. 8, Jul. 2022, doi: 10.1001/jamainternmed.2022.2476.
[3] CDC, “Heart disease Facts,” Centers for Disease Control and Prevention, Sep. 27, 2021. https://www. cdc.gov/heartdisease/facts.htm (accessed Oct. 28, 2022).
[4] J. Patterson, Regenerative Medicine, vol. 7, pp. 409–419, 2012.
[5] C. E. T. Stowell and Y. Wang, “Quickening: Translational design of resorbable synthetic vascular grafts,” Biomaterials, vol. 173, pp. 71–86, Aug. 2018, doi: 10.1016/j.biomaterials.2018.05.006.
[6] E. M. Cunnane et al., “Development of a SemiAutomated, Bulk Seeding Device for Large Animal Model Implantation of Tissue Engineered Vascular Grafts,” Frontiers in Bioengineering and Biotechnology, vol. 8, Oct. 2020, doi: 10.3389/fbioe.2020.597847.
[7] D. G. Haskett et al., “An exploratory study on the preparation and evaluation of a ‘same-day’ adipose stem cell-based tissue-engineered vascular graft,” The Journal of Thoracic and Cardiovascular Surgery, vol. 156, no. 5, pp. 1814-1822.e3, Nov. 2018, doi: 10.1016/j.jtcvs.2018.05.120.
[8] K. L. Lorentz et al., “CCL2 loaded microparticles promote acute patency in silk-based vascular grafts implanted in rat aortae,” Acta Biomaterialia, vol. 135, pp. 126–138, Nov. 2021, doi: 10.1016/j. actbio.2021.08.049.
[9] J. Hu, Chinese Journal of Polymer Science, vol. 30, pp. 1661–1671, 2015.
[10] A. Nieponice et al., “In Vivo Assessment of a Tissue-Engineered Vascular Graft Combining a Biodegradable Elastomeric Scaffold and MuscleDerived Stem Cells in a Rat Model,” Tissue Engineering Part A, vol. 16, no. 4, pp. 1215–1223, Apr. 2010, doi: 10.1089/ten.tea.2009.0427.
[11] P. Ping, Journal of Macromolecular Science: Physics, vol. 59, pp. 427–439, 2020.
[12] M. K. DeBari and R. D. Abbott, “Microscopic considerations for optimizing silk biomaterials,” WIREs Nanomedicine and Nanobiotechnology, vol. 11, no. 2, Jun. 2018, doi: 10.1002/wnan.1534.
[13] National Institute of Health, ImageJ. Madison, WI: Laboratory for Optical and Computational Instrumentation, 2006.
[14] MathWorks, MATLAB. Natick, MA: MathWorks, 2012.
[15] F. Byette, F. Bouchard, C. Pellerin, J. Paquin, I. Marcotte, and M. A. Mateescu, “Cell-culture compatible silk fibroin scaffolds concomitantly patterned by freezing conditions and salt concentration,” Polymer Bulletin, vol. 67, no. 1, pp. 159–175, Jan. 2011, doi: 10.1007/s00289-010-0438-z.
[16] H. Zhang and A. I. Cooper, “Aligned Porous Structures by Directional Freezing,” Advanced Materials, vol. 19, no. 11, pp. 1529–1533, Jun. 2007, doi: 10.1002/adma.200700154.
[17] R. Nazarov, H.-J. Jin, and D. L. Kaplan, “Porous 3-D Scaffolds from Regenerated Silk Fibroin,” Biomacromolecules, vol. 5, no. 3, pp. 718–726, May 2004, doi: 10.1021/bm034327e.
[18] K. Hu et al., “Preparation of fibroin/recombinant human - like collagen scaffold to promote fibroblasts compatibility,” Journal of Biomedical Materials Research Part A, vol. 84A, no. 2, pp. 483–490, Jul. 2007, doi: 10.1002/jbm.a.31440.
56 Undergraduate Research at the Swanson School of Engineering
Epidural Spinal Cord Stimulation Can Modulate Bladder Activity in an Awake Environment
Andres Leon-Vargas1,2 , Maria Jantz1,2,3 , Alaina McCumber2 , Chaitanya Gopinath2,4 and Robert Gaunt1-4
1 Department of Bioengineering, University of Pittsburgh
2 Rehabilitation Neural Engineering Labs, University of Pittsburgh
3 Center for the Neural Basis of Cognition, University of Pittsburgh
4 Department of Physical Medicine and Rehabilitation, University of Pittsburgh
Andres Leon-Vargas is a bioengineering student on the bio mechanics track and does research at RNEL on the use of spinal cord stimulation for restoration of bladder function. He plans to pursue a career in research focusing on neural engineering for rehabilitation purposes.
Maria Jantz is a PhD candidate at the University of Pittsburgh studying electrical stimulation for lower urinary tract control. She is interested in neural stimulation for rehabilitation of sensorimotor systems.

ABSTRACT
Epidural spinal cord stimulation (SCS) can modulate bladder function, but current studies have been limited to acute, anesthetized trials. SCS effectiveness could vary from anesthetized trials when performed in an awake setting [2], and here we evaluate SCS targeted to restoring both continence and voiding in awake animals. Furthermore, in order to ensure that bladder function generated with SCS approximates healthy voiding, we evaluated the signatures of healthy bladder activity.
A wireless SCS device was implanted on the epidural surface of a cat over the lumbosacral spinal cord, along with pressure and electromyographic (EMG) sensors in the bladder and abdomen and a scale for collection of voided fluid. We found that SCS was able to modulate bladder function for both voiding and continence in an awake animal. SCS resulted in bladder pressure changes indicative of a voiding-like response, as well as increased bladder capacity and delayed voiding times indicating continence effects. Furthermore, we evaluated natural voiding patterns that may provide a basis for improving SCS to restore bladder function by identifying voiding onset for continence and improving efficacy of stimulation evoked voiding.
1. INTRODUCTION
Robert Gaunt is an Associate Professor in Physical Medicine and Rehabilitation at the University of Pittsburgh. His primary research interests are in sensorimotor control of the hand and bladder and developing advanced devices to restore function to these systems after injury and disease. Active research topics include developing bidirectional implantable brain computer interfaces to restore movement and sensation to people with upper-limb paralysis as well as creating novel neural interfaces to regulate bladder function.

Significance Statement
Bladder dysfunction affects about one in five people worldwide. Our lab has successfully used epidural spinal cord stimulation to evoke both voiding and continence under anesthesia, and here we show that this stimulation can also modulate bladder function in long-term implants with animals awake, setting the stage for clinical translation.
Category: Experimental Research
Keywords : Spinal Cord Stimulation (SCS), Bladder, Electrophysiology
Spinal cord injury (SCI) affects thousands of people each year, and the loss of bladder control is one of the most common resulting impairments. People with SCI are typically treated with self-catheterization, which is difficult to keep sterile and frequently leads to irritation and infection [1]. Therefore, restoring bladder function is of particular significance to people with SCI, who prioritize it equally or greater than recovery of locomotion [2]. Epidural spinal cord stimulation (SCS) is widely used to treat other conditions such as chronic back pain [3], and our lab has shown in anesthetized SCS experiments in cats that it can be used to evoke both aspects of bladder function: voiding and continence. However, such experiments are inherently limited due to the acute nature of the studies, and anesthesia is known to affect bladder function [4]. Furthermore, studies have shown that responses to SCS vary in awake animals, and that it is possible for animals to volitionally modulate outcomes of SCS [5]. For SCS to be translated into clinical practice, we must first investigate its use in long-term implants during natural behavior.
In this work, we aimed to characterize SCS-evoked and voluntary voiding behavior in awake animals. We developed a novel, automated system to enable data collection in the animals’ home cage, allowing us to collect data during natural behaviors. An effective bladder neuroprostheses must effectively control both voiding and continence. Therefore, we aim to apply SCS with the intent to selectively control micturition. We hope to produce changes in bladder pressure
57 Ingenium 2023
Andres Leon-Vargas
Robert Gaunt
Maria Jantz
resembling those seen in voluntary voiding and produce continence effects such as delayed voiding onset and increased bladder capacity. We hypothesize that epidural stimulation can effectively produce both continence and voiding in cats in a chronic setting. Additionally, in order to produce maximally effective bladder function with SCS, we seek a method to determine natural voiding onset, which will help determine when to activate SCS for continence, as well as factors that result in larger voided volumes, which will guide our choice of SCS parameters to improve stim evoked voids. Successful SCS-evoked voiding and continence in awake, behaving animals is a critical next step towards clinical translation.

2. METHODS
All procedures in this study were approved by the University of Pittsburgh Institutional Animal Care and Use Committee. One cat was implanted with a wireless SCS device, consisting of a 5x8 electrode array implanted over the lumbosacral spinal cord
spanning the cord under the L6 vertebra to the S1 vertebra. Pressure sensors were placed in the bladder and abdomen and electromyographic (EMG) sensors were placed on the pelvic floor and left abdominal wall. The cat had a 1-week recovery period from the implant surgery, and post-recovery the animal is not expected to have significantly changed voiding behavior. The bladder pressure sensor enabled us to determine voiding characteristics while abdominal EMG data allowed us to observe off-target effects from stimulation. The automated cat caging system enabled the recording of pressure and voiding data continuously during voiding with a time-synced scale placed underneath the litter box to detect voided urine volume (Figure 1a). Pressure data were recorded at a sample rate of 100 Hz while EMG data were sampled at 500 Hz (Figure 1b). We assumed that urine had the same density as water to calculate voided volumes from the weigh scale. Data was recorded for 20 hours with a 3-hour upload time to a data server. Linear regression models were made for several features in comparison to the volume voided.
58 Undergraduate Research at the Swanson School of Engineering
Figure 1. Overview of the automated cat caging experimental setup. A) Data recorded during the experiment. B) Void volume (top) over time was determined from the scale data. Pressure (middle) and EMG data (bottom) from the bladder and abdomen was wirelessly received from the implanted sensors.
Finally, we applied SCS in the cat both under Dexdomitor anesthesia and while awake. Previous research has shown that bladder function can be evoked during stimulation on the pudendal nerve, with 3 Hz stimulation resulting in continence and 33 Hz resulting in voiding [6]. In our anesthetized acute experiments, we have demonstrated that the pudendal nerve is directly recruited during SCS [7], and our anesthetized experiments suggest that these frequencies are equally effective when applied during SCS. Therefore, in the behaving experiments described here, we used 3 Hz SCS with the aim of improving continence and 33 Hz to produce voiding.
Stimulation for continence was started from 9 – 10 am on four separate days at 150 uA, which was below the amplitude that would evoke lower limb muscle contractions. Each stimulation train lasted 20 minutes and was repeated five times with 40-minute breaks between stimulation trains. High-frequency stimulation for voiding was conducted on the same cat in both anesthetized and awake trials, with varying amplitudes in the anesthetized trial. 33 Hz stimulation was applied at 50 uA in the awake trials, with stimulation lasting 30 seconds.
The data were analyzed in MATLAB (MathWorks Inc, Natick, MA) for initial data collection and Python for all other analysis conducted.
3. RESULTS
3.1 Voluntary voiding
The first aim of the study was to identify features that may be able to predict voiding onset. An analysis of typical bladder pressure in the 30 seconds immediately prior to voiding demonstrated a characteristic rampup in pressure immediately prior to voiding across all voluntary voiding trials. We evaluated the changes in bladder pressure throughout the monitored time period in 1 second bins. The increasing trend that precedes voiding was described by locating time
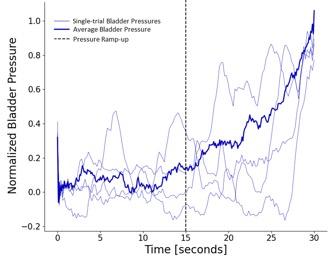
periods in which there were positive changes between two windows that exceeded a threshold of 0.01 in normalized pressure, and that positive trend was constant across subsequent bins. The duration of this increasing trend was approximately 15 seconds.
We also evaluated features relating to voided volume. Proper voiding requires that a maximum amount of fluid be expelled from the bladder to prevent undesired urine retention and subsequent infection. Neither peak abdominal pressure nor bladder pressure yielded a significant correlation with voided volume, resulting in linear regression models with R 2 values less than 0.05 (Figure 3). Instead, void duration was strongly correlated with void volume, resulting in a linear regression model with an R 2 value of 0.720 (Figure 3).

59 Ingenium 2023
Figure 3. Effects of pressure and time on voided volume. Correlation between voided volume and abdominal pressure (left), bladder pressure (middle), and void duration (right).
Figure 2. Bladder pressure prior to voluntary void. Average bladder pressure immediately prior to void shows characteristic ramp-up. Thin blue lines denote examples of single-trial recorded bladder pressure. Thick blue line denotes average of all recorded bladder pressure traces.
3.2 SCS-evoked changes in bladder pressure
We assessed the potential effectiveness of SCS stimulation when the animal was awake. We found that 3 Hz SCS produced a stimulation-evoked void delay, with all stimulation trials showing a minimum of 1 hour between the beginning of stimulation and any void. We observed a shift in hourly voiding patterns compared to the typical peak morning void time of 10 am – 12 pm to 12 – 2 pm, suggesting that this stimulation could be used to improve continence. Furthermore, SCS showed evidence of increasing bladder capacity. Voids between SCS trains or following the SCS window were on average 5.98 mL larger than the voluntary voiding volumes at the corresponding hour (Figure 4) in comparison to an average deviation of 0.73 mL within voluntary voids.
Voiding volumes after continence stimulation were generally higher than the average and median void volume of the corresponding hour.
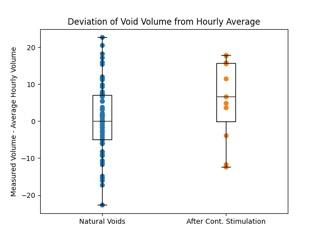
In anesthetized trials, we successfully produced voiding at 33 Hz, with the most physiologically similar bladder pressure produced at 300 uA. Conducting a 33 Hz experiment in an awake setting at 50 uA produced initial, irregular changes in bladder and EMG activity, as well as abdominal activity (Figure 5). Within a few seconds of the stimulation, bladder pressure visually developed the characteristic trace associated with voiding without producing any observable changes in abdominal pressure.
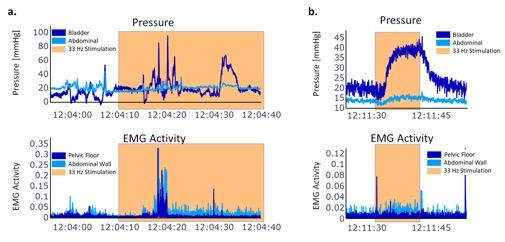

60 Undergraduate Research at the Swanson School of Engineering
Figure 4.
Figure 5. 33Hz stimulation in anesthetized and awake trials. Pressure in the awake trial (a) was not as readily modulated as in the anesthetized trial (b) but still produced characteristic bladder pressure trace.
4. DISCUSSION
The automated caging system provided a means of collecting relevant information on voluntary void features and patterns in an awake animal using a chronic epidural SCS implant. Bladder pressure proved to be an effective method of voiding onset detection and could be used to develop a closed-loop system to improve urinary continence in overactive bladders. In stimulation-evoked voids, one factor that is difficult to precisely control is the maximum amplitude of a bladder contraction. It is important that stimulationevoked voiding results in complete emptying of the bladder to prevent infection from urinary retention. We found that the bladder pressure is not the primary driver of how much the animal voided, and instead, the void duration was the primary factor. This is promising, as it strongly suggests that volume voided in a stim-evoked void could be controlled by using longer stimulation trains, which is significantly easier than attempting to achieve specific peak bladder or abdominal pressures.
Improving continence may come in the form of either delaying a void, or increasing bladder capacity, and thereby ultimately increasing the volume of voids. We observed both increased bladder capacity during SCS and evidence of stimulation-delayed voiding onset when compared to standard probability of voiding at a given hour. This suggests that 3 Hz stimulation has the potential to be effective for evoking continence in a clinical setting by increasing bladder capacity during stimulation, as is observed by the increased void volumes after stimulation.
In high-frequency SCS trials, we successfully evoked voiding in anesthetized trials and bladder pressure changes in an awake environment. Stimulation at 33 Hz in an awake trial was able to produce changes in bladder pressure without resulting in a void. Because SCS activates reflexes, the effects of SCS can be modulated based on changes in task and intention [8], and it is therefore possible that the animal volitionally suppressed the voiding reflex. This would be supported by the fact that the bladder contracted after a delay during stimulation, suggesting that the stimulation is producing an afferent-driven reflexive response rather than directly recruiting surrounding motor neurons. Volitional control may have been attempted through movement, as the cat was observed becoming particularly playful with toys during the stimulation period resulting in bladder changes. Furthermore, these changes in bladder pressure were evoked without concurrent increases in abdominal pressure. It is also possible that higher stimulation amplitudes would have evoked voiding, but the high-frequency SCS trials were completed at a very low amplitude to ensure the cat’s comfort.
5. CONCLUSION:
A chronic implant provided insight to both the typical features of a voluntary void and the effects of stimulation. SCS is a promising therapy for improving bladder dysfunction, and trials should be conducted in animals with bladder dysfunction to lay the groundwork for future clinical trials.
6. ACKNOWLEDGEMENTS
I would like to thank Rachel Pitzer, Alaina McCumber, Tyler Simpson, and David Weir for their help in this project. This project was funded by the NIH (OT2OD024908).
REFERENCES:
[1] Y. Igawa, J.-J. Wyndaele, and O. Nishizawa, “Catheterization: Possible complications and their prevention and treatment,” International Journal of Urology, vol. 15, no. 6, pp. 481–485, Apr. 2008
[2] K. D. Anderson, “Targeting Recovery: Priorities of the Spinal Cord-Injured Population,” Journal of Neurotrauma, vol. 21, no. 10, pp. 1371–1383, Oct. 2004
[3] D. J. Anderson et al., “Intradural Spinal Cord Stimulation: Performance Modeling of a New Modality,” Frontiers in Neuroscience, vol. 13, Mar. 2019
[4] K. Axelsson, K. Möllefors, J. O. Olsson, G. Lingårdh, and B. Widman, “Bladder function in spinal anaesthesia,” Acta Anaesthesiologica Scandinavica, vol. 29, no. 3, pp. 315–321, Apr. 1985
[5] F. B. Wagner et al., “Targeted neurotechnology restores walking in humans with spinal cord injury,” Nature, vol. 563, no. 7729, pp. 65–71, Oct. 2018
[6] J. W. Boggs, B. J. Wenzel, K. J. Gustafson, and W. M. Grill, “Frequency-dependent selection of reflexes by pudendal afferents in the cat,” The Journal of Physiology, vol. 577, no. 1, pp. 115–126, Nov. 2006
[7] M.K Jantz, C. Gopinath, R. Kumar, C. Chin, L. Wong, J.I. Ogren, L.E. Fisher, B.L McLaughlin, and R.A Gaunt, “High-density spinal cord stimulation selectively activates lower urinary tract nerves,” Journal of Neural Engineering, vol. 19, no. 6, pp. 066014, Nov. 2022
[8] G. Courtine, S. J. Harkema, C. J. Dy, Y. P. Gerasimenko, and P. Dyhre-Poulsen, “Modulation of multisegmental monosynaptic responses in a variety of leg muscles during walking and running in humans,” The Journal of Physiology, vol. 582, no. 3, pp. 1125–1139, Jul. 2007
61 Ingenium 2023
Quantifying and Minimizing the Error in 3D Printing the Human Lamina Cribrosa
Brock Pemberton1, Remi Shittu2 , Jonathan Vande Geest1-3
1 Department of Bioengineering, University of Pittsburgh
2 McGowan Institute for Regenerative Medicine, University of Pittsburgh
3 Department of Ophthalmology, University of Pittsburgh
Brock Pemberton grew up in King of Prussia, PA before coming to Pitt to pursue his passion in genetics and bioengineering. He first became interested in biomanufacturing when he researched it in his freshman engineering paper, eventually landing him a position at the Soft Tissue Biomechanics Laboratory.


Remi Shittu was born and raised in Chicago, IL. Her passion for understanding rare diseases motivates her to become a bioengineering researcher.

ABSTRACT
Primary open angle glaucoma results in blindness and remodeling of the lamina cribrosa. In order to investigate how this remodeling occurs, models of the lamina were created via two photon polymerization using a custom two photon laser and script. Images of these models were taken using the laser’s builtin camera. A custom MATLAB script was written to process images of the models, overlay them onto the input image used in the script, and calculate the similarity of the two images using the Sørensen–Dice coefficient. Dice coefficients of obviously accurate and inaccurate models were compared. Inaccurate models had low Dice coefficients (0.27 and 0.58) while accurate models had high Dice coefficients (0.82 and 0.9). “Accuracy” was qualitative and based on visual inspection, and the quantitative Dice coefficient values agreed with these assessments. Therefore, we concluded that this statistic is effective at quantifying the error of two photon polymerized lamina cribrosa models. In addition, the results show that two photon polymerization can be used to create accurate models of microstructures.
1. INTRODUCTION
Dr. Johnathan Vande Geest is a professor in the Department of Bioengineering, Mechanical Engineering and materials Science, Department of Ophthalmology, The McGowan Institute for Regenerative Medicine, the Louis J. Fox Center for Vision Restoration, and the Vascular Medicine Institute at the University of Pittsburgh.
Significance Statement
To study the progression of diseases with in vitro models, accuracies must be quantified to ensure they are similar to their in vivo counterparts. The Sørensen–Dice coefficient is an acceptable statistic for measuring the error of models of the lamina cribrosa (and potentially other structures) made via two photon polymerization.
Category: Computational Research
Keywords : 3D printing, two photon polymerization, lamina cribrosa, Sørensen–Dice coefficient.
One of the leading causes of blindness is primary open angle glaucoma (POAG), which is expected to affect 110 million people by 2040 [1]. A patient with POAG will experience significant remodeling of the lamina cribrosa (LC), a porous collagenous disc located in the optic nerve head (ONH) [2]. The LC plays a critical mechanical role in protecting retinal ganglion cell (RGC) axons as they exit the eye through the ONH [3]. It is suspected that remodeling of the LC contributes to RGC death, resulting in blindness. There are not many methods to combat this remodeling, aside from lowering intraocular pressure (IOP), but even this does not always prevent the progression of the disease [4]. Due to this ambiguity, it would be extremely beneficial to have patient-specific models of the LC for study. Models, if made with biocompatible materials, such as IP-S, could be seeded with cells and be subjected to glaucomatous conditions to investigate what occurs in the LC region of the eye and what methods may be used to prevent the progression of the disease. IP-S is a biocompatible, non-cytotoxic photoresin designed for Dip-in Laser Lithography (DiLL) and can be used for cell scaffolds and models. These models must be very accurate at the microscale. The goal of this project was to determine if the error of a Two Photon Polymerized (TPP) LC in IP-S can be accurately quantified using the Sørensen–Dice coefficient. Although the accuracy of TPP has been evaluated in many prior studies, there does not appear to be a study that directly uses the Dice coefficient to evaluate the accuracy of a TPP model to its binary input image.
Ingenium 2023
Brock Pemberton
Remi Shittu
62
Jonathan Vande Geest
2. METHODS
An Olympus BX51 upright laser-scanning microscope (Insight DS+, Spectra Physics, Santa Clara, CA) was used to polymerize Nanoscribe™ IP-S, a biocompatible photoresin, at a wavelength of 780nm. The laser was controlled with a Python script that used a binary image of a human LC as an input (Figure 1A). Following successful polymerization, the construct was imaged under 4X magnification. The image was taken with the laser’s built-in camera.
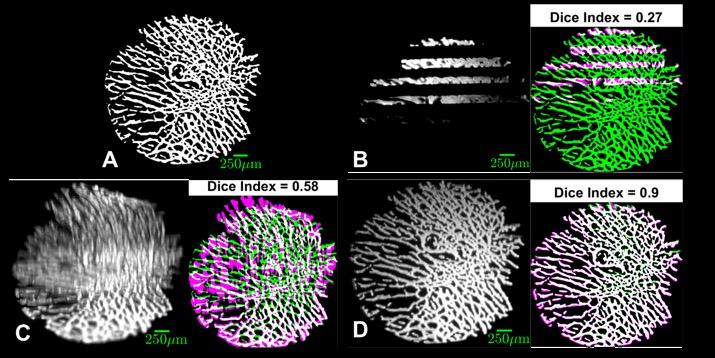
Error represents how different the resulting polymerized LC is to its binary input image. The code uses a similarity coefficient to quantify this error. A high similarity represents a low error, and a low similarity indicates a high error. Once a similarity coefficient was determined for a particular LC, the code and parameters of the laser were modified. How the parameters were modified for each model to improve the similarity is beyond the scope of this paper. Eventually, models of high accuracy were created, and these were also imaged and run through the script.
2.1 DATA PROCESSING
The images of the polymerized LCs were processed using a custom MATLAB script. The script adjusted the contrast of the images before binarizing them using a binarization function. This function would convert all pixels in the image to either 1s or 0s based on a fixed sensitivity. Darker pixels would be assigned a value of 0 while lighter pixels would be assigned a value of 1. When this image is displayed, each pixel will be black if its value is 0, and white if 1. To remove sharp
and jagged edges, the images were smoothed using a majority morphological operation function. This function scans each pixel of the image, and if five or more of its surrounding pixels are 1, the target pixel would be converted to 1. Otherwise, the pixel was set to 0. The image was then cropped and resized to the same dimensions of the input LC image. This is necessary for the similarity function, since it compares each pixel of the images and, therefore, cannot compare two images of different shapes and sizes. Finally, the output image was overlaid onto the original binary input image and the Sørensen–Dice coefficient was calculated. This index returns a single value between 0 and 1 that quantifies the similarity of the input and output images. A value closer to 1 represents a higher similarity (lower error). It is calculated by doubling the area of the overlap between the two images and dividing this value by the sum of the areas of both images. This value is used to evaluate the accuracy of the TPP process, especially when visual inspection is not adequate to determine an improvement in similarity.
3. RESULTS
The first polymerized LC had a Dice’s coefficient of 0.27, which represents an extremely low similarity (high error), as can be seen in Figure 1B. Another LC was polymerized with a Dice’s coefficient of 0.58 (Figure 1C). Finally, an LC with a Dice’s coefficient of 0.82 was able to be polymerized. Following this success, an additional 17 LCs were produced with an average similarity coefficient of 0.851, with the highest similarity achieved being 0.9 (Figure 1D).
63 Ingenium 2023
Figure 1. Dice Coefficient Overlays. (A) Binary image of LC, used as input. (B) First LC attempt (4X) with overlay and similarity coefficient. Input image is in green, output image is in pink, overlap is in white. (C) Improved polymerized LC (4X) with overlay and similarity coefficient. (D) Highest similarity coefficient LC (4X) with overlay and coefficient.
4. DISCUSSION
These results show that the Dice coefficient is able to quantify the error of TPP LCs. This can be visually confirmed with the images in Figure 1. Clearly, Figure 1B has higher error than Figure 1C. Similarly, Figure 1C has higher error than Figure 1D. The Dice coefficient follows this trend, where the LC with the highest error has the lowest Dice coefficient (1B Dice coefficient = 0.27), and the LC with the lowest error has the highest Dice coefficient (1D Dice coefficient = 0.9). These results also demonstrate that the TPP process can produce polymerized human LCs in IP-S with reasonable accuracy. The highest similarity achieved was 0.9, which can be interpreted as “twice the overlap of the input and output is 90% of the area of the two images.” It may be possible to adjust parameters to achieve an even higher Dice coefficient.
5. CONCLUSIONS
The Sørensen–Dice coefficient is an acceptable statistic for analyzing the accuracy of two photon polymerized LC models. That is, the Dice coefficient can act as a numerical value for analyzing the accuracy of LC models while agreeing with qualitative visual assessment. Additionally, the two-photon polymerization process can create human LC models in IP-S with reasonable accuracy. The results of this study may be generalized to models of other microstructures made using twophoton polymerization using similar methods. In other words, microstructures manufactured utilizing a binary image as their input may be imaged themselves and quantitatively compared to their input using the Dice coefficient. Further studies should investigate what accuracy is high enough for a realistic model of an LC and should attempt to link the error of the models to the parameters of their fabrication. Additionally, accurate LC models could be seeded with cells to investigate biocompatibility.
6. ACKNOWLEDGEMENTS
Funding was provided by the NIH T32 Interdisciplinary Visual Sciences Training Program, the Bioengineering Department at the Swanson School of Engineering, and the Office of the Provost at the University of Pittsburgh. This research was conducted under the mentorship of Remi Shittu and Dr. Vande Geest.
REFERENCES
[1] J. Crawford Downs, M. D. Roberts, and I. A. Sigal, “Glaucomatous cupping of the lamina cribrosa: A review of the evidence for active progressive remodeling as a mechanism,” Experimental Eye Research, vol. 93, no. 2, pp. 133-140, 2011/08/01/ 2011, doi: https://doi.org/10.1016/j.exer.2010.08.004. [Accessed Aug. 17, 2022].
[2] M. A. Fazio, R. Grytz, J. S. Morris, L. Bruno, C. A. Girkin, and J. C. Downs, “Human Scleral Structural Stiffness Increases More Rapidly With Age in Donors of African Descent Compared to Donors of European Descent,” Investigative Ophthalmology & Visual Science, vol. 55, no. 11, pp. 7189-7198, 2014, doi: 10.1167/iovs.14-14894. [Accessed Aug. 17, 2022].
[3] H. A. Quigley and A. T. Broman, “The number of people with glaucoma worldwide in 2010 and 2020,” British Journal of Ophthalmology, vol. 90, no. 3, pp. 262-267, 2006, doi: 10.1136/bjo.2005.081224. [Accessed Aug. 17, 2022].
[4] R. G. Strickland, M. A. Garner, A. K. Gross, and C. A. Girkin, “Remodeling of the Lamina Cribrosa: Mechanisms and Potential Therapeutic Approaches for Glaucoma,” International Journal of Molecular Sciences, vol. 23, no. 15, p. 8068, 2022. [Online]. Available: https://www.mdpi.com/14220067/23/15/8068. [Accessed Aug. 17, 2022].
64 Undergraduate Research at the Swanson School of Engineering
Visualizing CB1 Receptors in Vaginal Epithelium of Non-human Primates
Rachel Shaw 1, Katrina Knight1,2 and Pamela Moalli1,2
1 Department of Bioengineering, University of Pittsburgh
2 Magee-Womens Research Institute & Foundation
Rachel Shaw is a senior bioengineering student with a cellular engineering concentration of study. She is interested in tissue engineering, methods of medical research, and computational biology among other things. She plans to enter industry after graduation and find where she may use her skills to make an impact in medicine.

Dr. Knight is a native of Columbia, SC and an Assistant Professor in the Department of Bioengineering. Her research aims to improve the lives of women with pelvic floor disorders through the development of novel and innovative treatments while concomitantly increasing the number of minorities in STEM education and careers.

Dr. Moalli is a Professor in the Departments of Ob/Gyn/RS and Engineering who completed a combined MD/PhD as part of the NIH sponsored Medical Scientist Training Program. She co-directs the Translational Research Laboratories in Urogynecology – an interdisciplinary group that studies mechanisms that contribute to the development of pelvic organ prolapse and the development of biomaterials for improving outcomes of urogynecologic procedures.
Significance Statement
Chronic pelvic pain is a common debilitating condition affecting roughly 15% of reproductive-age women in the United States [1]. According to surveys, ~ 25% of patients with chronic pelvic pain use cannabis to mitigate their symptoms [2]; however, prior to the current study, the presence of cannabinoid receptors in the pelvis had not been documented in an animal model which is sufficiently comparable to humans. This study provides evidence for cannabinoid type 1 (CB1) receptors in the vaginal epithelium of non-human primates but not in pelvic floor muscles. This novel information supports the exploration of CB1 receptors as a therapeutic target for chronic pelvic pain related to the vagina and opens the door for additional studies which aim to further explore cannabinoids as they relate to pain relief and pelvic floor function.
Category: Experimental Research
Keywords : cannabinoids, pelvic floor dysfunction, immunofluorescence, vaginal epithelium
ABSTRACT
Chronic pelvic pain conditions in women are generally not well understood leaving patients and their physicians struggling to find medications and therapies which are effective in combatting their pain. Studies have collected data from people with chronic pelvic pain and found that almost a quarter use cannabis as an adjunct to traditional therapies due to its ability to relieve symptoms [3]. This study aimed to identify cannabinoid receptors in the pelvic floor muscles and vaginal epithelium of non-human primates. Cannabinoid type 1 (CB1) receptors were identified using immunofluorescent labeling. Overall, there were no CB1 receptors observed in the pelvic floor muscle types analyzed; however, there was a high density of CB1 receptors observed in the vaginal epithelium of non-human primates. The CB1 receptors were mostly expressed in the basal cell layer but were also found in the intermediate and superficial layers of the squamous epithelium. This discovery supports the anecdotal evidence that cannabis may be helpful in treatment of chronic pelvic pain. This information also opens the door for discoveries related to dysfunction of the cannabinoid system and the mechanisms which lead to pelvic floor dysfunction and chronic pain.
1. INTRODUCTION
Cannabinoids like Tetrahydrocannabinol (THC) and Cannabidiol (CBD) have been shown to produce antiinflammatory and muscle relaxing effects [4,5]. For example, an FDA approved drug, Sativex [6], has a 1:1 makeup of THC and CBD and is effective in treating symptoms of neuropathic pain, muscle spasticity, and overactive bladder. THC has a strong binding affinity for CB1 and is often administered in conjunction with CBD which acts as a non-competitive antagonist on CB1 to alleviate adverse effects like anxiety which have been shown in patients treated with high doses of THC.
To target women with pelvic pain and dysfunction, various companies have begun selling suppositories infused with THC and CBD which claim to provide targeted pain relief. Companies like Foria Wellness have developed CBD-based and CBD + THC-based suppositories as well as other products that claim to treat conditions like endometriosis and polycystic ovarian syndrome. The products have great anecdotal reviews, but there are no published studies which substantiate their claim that the uterus has “more cannabinoid receptors than any other part of the body except the brain.”
To begin an investigation into the legitimacy of these products and better understand the role of endocannabinoid signaling in the human reproductive system, we aimed to identify CB1 receptors in nonhuman primate (NHP) pelvic floor muscle and vagina. We used a primate model given their likeness to human reproductive anatomy [7].

65 Ingenium 2023
Rachel Shaw
Katrina Knight
Pamela Moali
Cannabinoid type 1 (CB1) receptors are most known for their functions in the brain to modulate things like sleep, hunger, and memory [8], but they also modulate pain throughout the body [9]. Previous studies have demonstrated the role of cannabinoids in maintaining other organs like in the gastrointestinal tract (controls gastrointestinal contractility) [10]. We hypothesized that cannabinoid receptors would be present in the vagina and the pelvic floor muscle tissue samples because these are common sites of pain in pelvic pain conditions such as endometriosis and interstitial cystitis. Due to cannabis’ known anti-inflammatory properties [11] and its ability to modulate muscle contractility in other biological systems, identification of CB1 receptors in the vagina and pelvic floor muscle is helpful for exploration of novel treatments for pelvic floor pain in women.
2. METHODS
Non-human primate tissue, Rhesus Macaques, obtained in a previous research study was used as a source for vagina (N = 10) and pelvic floor muscle (N = 10) samples. Animals were maintained in standard cages with ad libitum water and a scheduled monkey diet supplemented with fresh fruit, vegetables, and multiple vitamins daily. A 12-hour light/dark cycle (7 am to 7 pm) was used. Animals were female, averaged 11.79 ± 2.15 years old and 8.61 ± 1.92 kilograms, and had a median parity (defined as the number of deliveries beyond 20 weeks of gestation) of 3 (interquartile range: 2.25). Ten different primates were used for each group: vaginal epithelium and pelvic floor muscle. One sample was used per primate.
Portions of the anterior vagina and pubococcygeal muscle were embedded in optimal cutting temperature compound and cryosectioned (7 μm). Tissue sections were fixed in 4% paraformaldehyde at 4°C for one hour. After washing with PBS, the samples were incubated with 10 mM copper sulfate/50 mM ammonium acetate for 20 minutes. The samples were washed again and incubated with blocking buffer in TTBS (4% donkey serum in 0.3% Triton X-100 in 1xTBS) for 30 minutes. Blocking solution was then removed and the tissue sections were incubated overnight at 4°C with primary antibodies anti-α-smooth muscle actin (SMA) (1:100, mouse, Abcam, Cat# ab7817) and anti-cannabinoid receptor 1 (1:50, rabbit, Abcam, Cat# ab23703). These antibodies have been characterized previously [12, 13]. After overnight incubation, primary antibody solution was removed, and the samples were washed in TBS-T (0.1% Tween® 20 Detergent in 1xTBS). Next, the secondary antibodies, anti-mouse (1:200, Invitrogen, Alexa Fluor™ 488, Cat # A11029) and anti-rabbit (1:200, Invitrogen, Alexa Fluor™ 594, Cat # A21207), were applied and left to incubate for 2 hours. Following incubation, tissue sections were washed with TBS-T and PBS, VECTASHIELD PLUS Antifade Mounting Medium with DAPI (4′,6-diamidino-2-phenylindole)
(Vector Laboratories, Ref. H-2000) was applied, and slides were cover slipped. Images were taken within a week of immunofluorescent staining at 10X with a Nikon Eclipse 90i microscope (Melville, NY). In control samples, all methods were the same except primary antibodies were omitted to determine the amount of autofluorescence, which was typically low.
Trichrome staining was performed to assess the morphology of tissue sample sections and to determine overall quality. Images were taken within a week of staining at 4X with a Nikon Eclipse 90i microscope (Melville, NY).
The NIS-Elements AR3.2 (Nikon) software was used to visually analyze the images and set the florescence settings for each image to a standard.
3. RESULTS
CB1 was expressed in all 10 of the vaginal tissue samples. The CB1 receptor was mostly localized in the basal cell layer (Figure 1). Staining the tissue sections with Trichrome confirmed that the CB1 labeling was localized to the epithelium (Figure 2). Furthermore, CB1 labeling was localized to the cell membrane which is consistent with previous research [14]. Negligible staining was observed in the control vagina sections (Figure 3), signifying specificity for the CB1 antigen. There was one example of the receptor being expressed strongly in the intermediate and superficial layers of the squamous epithelium as well as the basal cell layer (Figure 4). CB1 was not identified in any of the pelvic floor muscles (Figure 5).
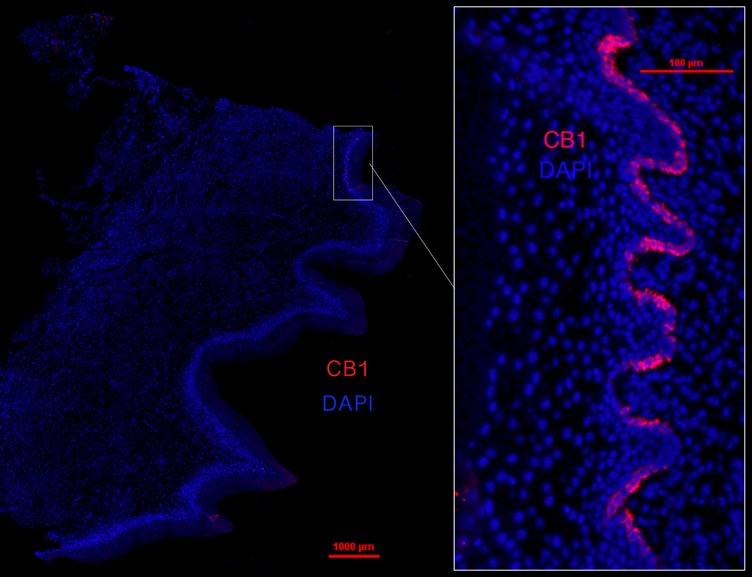
66 Undergraduate Research at the Swanson School of Engineering
Figure 1. Full thickness immunofluorescence image showing labeling of Cannabinoid type 1 (CB1, red) receptors in the basal cell layer of NHP vaginal epithelium observed in all 10 samples. DAPI (4′,6-diamidino-2-phenylindole, blue) shows the nucleus of the cells. The image on the right corresponds to the region contained within the white box (left image).
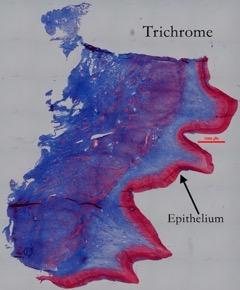
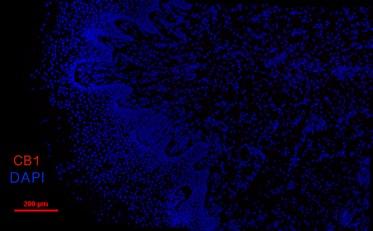


67 Ingenium 2023
Figure 2. Representative full thickness vaginal tissue section stained with trichrome showing labeling of the NHP vaginal epithelium stained in pink. Collagen is stained blue, nuclei are dark brown, muscle is red, and cytoplasm is pink.
Figure 3. Representative negative control image of the vaginal epithelium showing an absence of red, CB1 labeling. This absence of labeling demonstrates specificity of the primary antibody.
Figure 4. Full thickness immunofluorescence image showing labeling of Cannabinoid type 1 (CB1, red) receptors in the basal and upper layers of the NHP vaginal epithelium. DAPI (4′,6-diamidino-2-phenylindole, blue) shows the nucleus of the cells. SMA (smooth muscle actin, green) shows the smooth muscle. The image on the right corresponds to the region contained within the white box (left image).
Figure 5. Full thickness immunofluorescence image showing lack of labeling of Cannabinoid type 1 (CB1, red) receptors in the NHP pelvic floor muscle. DAPI (4′,6-diamidino-2phenylindole, blue) shows the nucleus of the cells.
4. DISCUSSION
The discovery of cannabinoid receptors in the vaginal epithelium is significant because it opens the door to explore pelvic floor treatment using THC- and CBDbased medications. Since there was no expression in the pelvic floor muscles and cannabinoids have been shown to reduce pain in many women facing pelvic floor dysfunction, we should consider that the mechanisms underlying some of these conditions may be related to the vagina. There is much to be discovered both about the mechanisms of the endocannabinoid system and their relationship to pelvic pain syndromes. More research is needed to investigate the roles of endocannabinoids on pelvic floor conditions relating to the vagina. There should also be investigation into the optimal THC:CBD ratio for patients and whether administration of cannabis suppositories has greater pain reducing effects than administration by ingestion or inhalation.
Additionally, more research is needed into potential adverse effects of cannabinoid-based medications. Areas of the body with a high density of CB1 receptors have been shown to be easily dysregulated by cannabinoid-based medication which may cause adverse effects as shown in Cannabinoid Hyperemesis Syndrome patients [15].
5. CONCLUSIONS
While CB1 receptors are not expressed in pelvic floor muscles, they are highly expressed in the vaginal epithelium of the anterior vagina of non-human primates. Their ubiquity and wide distribution in primates suggest a potential unexplored mechanism of the human reproductive system. Cannabinoids acting on the CB1 receptors in the vagina may substantively affect the functionality and sensations of the vagina and/or its surrounding systems.
6. ACKNOWLEDGEMENTS
Funding was provided by the Swanson School of Engineering and the Office of the Provost at the University of Pittsburgh.
REFERENCES
[1] S. Mathias, “Chronic Pelvic Pain: Prevalence, HealthRelated Quality of Life, and Economic Correlates,” Obstetrics & Gynecology, vol. 87, no. 3, pp. 321–327, Mar. 1996, doi: 10.1016/0029-7844(95)00458-0.
[2] A. R. Carrubba, A. C. Spaulding, J. O. Ebbert, and C. C. DeStephano, “Patient-Reported Use of Medical Cannabis for Management of Chronic Pelvic Pain [12H],” Obstetrics & Gynecology, vol. 135, p. 84S, May 2020, doi: 10.1097/01.aog.0000665024.52449.e7.
[3] A. R. Carrubba, J. O. Ebbert, A. C. Spaulding, D. DeStephano, and C. C. DeStephano, “Use of Cannabis for Self-Management of Chronic Pelvic Pain,” Journal of Women’s Health, vol. 30, no. 9, pp. 1344–1351, Sep. 2021, doi: 10.1089/jwh.2020.8737.
[4] F. R. Henshaw, L. S. Dewsbury, C. K. Lim, and G. Z. Steiner, “The Effects of Cannabinoids on Pro- and Anti-Inflammatory Cytokines: A Systematic Review of In Vivo Studies,” Cannabis and Cannabinoid Research, vol. 6, no. 3, pp. 177–195, Jun. 2021, doi: 10.1089/ can.2020.0105.
[5] A. M. Malfitano, M. C. Proto, and M. Bifulco, “Cannabinoids in the management of spasticity associated with multiple sclerosis,” Neuropsychiatric Disease and Treatment , vol. 4, no. 5, pp. 847–853, Oct. 2008, [Online]. Available: https://www.ncbi.nlm.nih. gov/pmc/articles/PMC2626929/
[6] M. P. Barnes, “Sativex®: clinical efficacy and tolerability in the treatment of symptoms of multiple sclerosis and neuropathic pain,” Expert Opinion on Pharmacotherapy, vol. 7, no. 5, pp. 607–615, Mar. 2006, doi: 10.1517/14656566.7.5.607.
[7] S. D. Abramowitch, A. Feola, Z. Jallah, and P. A. Moalli, “Tissue mechanics, animal models, and pelvic organ prolapse: A review,” European Journal of Obstetrics & Gynecology and Reproductive Biology, vol. 144, pp. S146–S158, May 2009, doi: 10.1016/j. ejogrb.2009.02.022.
[8] S. Zou and U. Kumar, “Cannabinoid Receptors and the Endocannabinoid System: Signaling and Function in the Central Nervous System,” International Journal of Molecular Sciences, vol. 19, no. 3, p. 833, Mar. 2018, doi: 10.3390/ijms19030833.
[9] M. Maccarrone et al., “Endocannabinoid signaling at the periphery: 50 years after THC,” Trends in Pharmacological Sciences, vol. 36, no. 5, pp. 277–296, May 2015, doi: 10.1016/j.tips.2015.02.008.
68 Undergraduate Research at the Swanson School of Engineering
[10] N. V. DiPatrizio, “Endocannabinoids in the Gut,” Cannabis and Cannabinoid Research, vol. 1, no. 1, pp. 67–77, Dec. 2016, doi: 10.1089/can.2016.0001.
[11] F. R. Henshaw, L. S. Dewsbury, C. K. Lim, and G. Z. Steiner, “The Effects of Cannabinoids on Pro- and Anti-Inflammatory Cytokines: A Systematic Review of In Vivo Studies,” Cannabis and Cannabinoid Research, vol. 6, no. 3, pp. 177–195, Jun. 2021, doi: 10.1089/ can.2020.0105.
[12] X.-L. He, L. Yang, Z.-J. Wang, R.-Q. Huang, R.-R. Zhu, and L.-M. Cheng, “Solid lipid nanoparticles loading with curcumin and dexanabinol to treat major depressive disorder,” Neural Regeneration Research, vol. 16, no. 3, pp. 537–542, Mar. 2021, doi: 10.4103/1673-5374.293155.
[13] S.-Y. Ki, Y.-S. Lee, J.-Y. Kim, T. Lho, and S. W. Chung, “Relationship between fatty infiltration and gene expression in patients with medium rotator cuff tear,” Journal of Shoulder and Elbow Surgery, Jun. 2020, doi: 10.1016/j.jse.2020.06.003.
[14] J. Freundt-Revilla, K. Kegler, W. Baumgärtner, and A. Tipold, “Spatial distribution of cannabinoid receptor type 1 (CB1) in normal canine central and peripheral nervous system,” PLOS ONE, vol. 12, no. 7, p. e0181064, Jul. 2017, doi: 10.1371/journal. pone.0181064.
[15] J. A. Galli, R. A. Sawaya, and F. K. Friedenberg, “Cannabinoid Hyperemesis Syndrome,” Current Drug Abuse Reviews, vol. 4, no. 4, pp. 241–249, Accessed: Nov. 14, 2022. [Online]. Available: https://www. eurekaselect.com/article/39825
69 Ingenium 2023
Non-Toxic DOPA-Based Polymers Improve Healing of Severe Wounds
Erica Taylor 1,2 , Jianying Zhang 2 , Michael Copeland2 , James H-C. Wang 2
1 Department of Bioengineering, University of Pittsburgh
2 Mechanobiology Laboratory, Department of Orthopedic Surgery, University of Pittsburgh
Erica Taylor was born and raised in Plum, Pennsylvania. She studies bioengineering with a focus on the cellular track and is working towards a minor in chemistry.

ABSTRACT
Current commercial adhesives to treat wounds and broken bones have issues such as not being biodegradable or containing undesirable chemical and physical properties. This creates a large issue in the health field, where there are few viable alternatives to treat these types of injuries. To resolve the issue with traditional treatments, a new polymer was synthesized from biodegradable components.
James Wang is in the faculty of the Departments of Orthopaedic Surgery, Bioengineering, and Mechanical Engineering at the University of Pittsburgh. He serves as the director of the MechanoBiology Laboratory in the Department of Orthopaedic Surgery.

Significance Statement
Traditional means for treating deep wounds or bone fractures include multiple surgeries increasing infection risk. A new polymer synthesized from biological substances eliminates the need for multiple procedures and increases cell proliferation while decreasing healing time. This polymer has the potential to be used for other types of trauma.
Category: Experimental Research
Keywords : Lysine diisocyanate, DOPA-based polymer, wound adhesive, multiple-tissue wound healing, cell proliferation
This study developed a novel, fast cure, non-toxic wound adhesive with excellent wound healing properties. Polymer treated mice tails healed much faster than mice tails with no polymer treatment. An advantage of the LDI-DOPA-cysteine-based adhesive, unlike commercial polymers made of methylene diphenyl diisocyanate (MDI), hexamethylene diisocyanate (HDI), or toluene diisocyanate (TDI) is biodegradability and biocompatibility, and all degradation products are non-toxic. This is demonstrated by the viability of the cells after they had been directly seeded on the polymer. The new polymer also does not affect the morphology or population doubling time (PDT). IPDI+BAPPG polymer is not a mimic Mfp adhesive which was used as a comparison against the DCBG+LDI polymer.
By mimicking the function of mussel foot protein (Mfp) found in mussels, a new biodegradable polymer was synthesized from 3, 4-dihydroxyL-phenylalamine -(DOPA), cysteine, O, O’-bis-(2aminopropyl)- polyethylene glycol (BAPPG), glycerol, and lysine diisocyanate (LDI) (DCBG+LDI). A separate polymer containing isophorone diisocyanate (IPDI) and BAPPG was also synthesized. Both polymers imitate Mfp and were synthesized as a replacement to current polymers.
Mechanical testing showed that the two polymers, BAPPG+IPDI and BAEE+IPDI, can hold a significant amount of weight. The tail glued together by the polymer can hold more than the mouse’s actual weight, once the polymer has dried. Increasing drying time increases strength, but once a baseline time has been established, there is no significant effect on strength. Some of the issues caused by traditional treatments for wounds and broken bones are improved by the new polymer. Our results indicated that this LDI-DOPAbased polymer is biodegradable and biocompatible, and it has the potential to be used for multiple-tissue wound healing. It is possible that different formulas of this polymer will improve healing for other health issues, such as surgery wounds. Further study must be done on these polymers with the end goal of using them in the healthcare field.
Ingenium 2023
Erica Taylor
70
James H-C. Wang
1. INTRODUCTION
Every year, millions of Americans suffer from severe cuts, broken bones, or chronic wounds that require extensive medical attention. [1][2][3].It is estimated that at least six million Americans break a bone each year [1]. Chronic wounds include pressure sores, surgical sites, or other trauma-induced wounds with tissue damage [1]. To treat severe lacerations, staples, Dermabond™, or Steristrips™ are often used. The surgical treatment for fractured bones is realigning the bone fragments together and fixing them with metal implants such as screws, plates, and nails [4]. However, most comminuted or compound bone fractures are complex, and it is difficult to accurately fix them by internal fixation devices. Other fracture treatments such as casts and slings are used in lieu of these treatments. All the internal metal fixation materials must eventually be removed via additional surgeries that are not only time-consuming, but also increase healthcare cost [1]. Treatments such as stitches, casts, and slings must also be removed post-healing or when healing has reached a satisfactory state, resulting in additional costs and surgical time [2]. The secondary treatments cost the American Healthcare System millions of dollars every year [1]. In 2016, chronic health care treatment cost the American Healthcare System over a trillion dollars [3].
Due to these undesirable outcomes, use of adhesives (substances used to adhere different objects/materials together) has become a more common treatment despite their shortcomings and other potential resulting issues. Current biodegradable adhesives are expensive, and they require a considerable amount of time to solidify, which is not practical in clinical settings. Synthetic polymers can be produced in a constant supply and with consistently uniform properties. In addition, the most synthetic polymer adhesives are less expensive than the natural adhesives. However, most polymers contain toxic organic solvents. An important challenge facing adhesive manufacturers and users is the replacement of an adhesive system based on organic solvents. Ongoing research of a solution or replacement for current polymers has led to the generation of multiple adhesive formulations since there has been a high demand for more efficient polymers for years [1][2][3].”
One of the most commonly used adhesives is polymethyl methacrylate (PMMA), a polymer adhesive used in the medical and dental fields [5]. However, there are several issues with PMMA, that the new polymer mitigates. PMMA lacks the proper chemical interaction, leading to both shrinkage and heat generation, which can be dangerous to the surrounding cells [5]. PMMA is not biodegradable, and both of its monomers are toxic. Processing chemicals can leach out during handling and use that may result in the generation of toxic waste [5].
Cyanoacrylates have good micro-tensile bond strength to support bone healing. However, rapid polymerization forms hard and brittle film on the bone leading to cell death and tissue damage [6]. Polyurethane (PU) adhesives are developed by mixing polyisocynates and polyesters or polyethers for gap filling and splinting of fractured bones [7]. However, these polymers invariably produce toxic by-products, resulting in severe limitations on their use in vivo. The PU synthesized by MDI can degrade into 4,4-methylenedianiline, a toxic by-product which reportedly produces hepatitis in humans [8]. The polymer synthesized with TDI can degrade into 2,4-diaminotoluene, which is a suspected carcinogen [9].
Starch bio adhesives are being evaluated by multiple companies, but they also have known flaws. While these adhesives are non-toxic, they are not waterresistant, which is a major problem for any adhesive that will be used in the human body due to the need to bond to non-dry surfaces [9]. These starch bio adhesives are also not strong enough to withstand much force [6].
Adhesives must be able to bond to any wet surface found within the body [1]. Due to this requirement, research was conducted on the glue-like substance that mussels secrete. The strength of this adhesive allows mussels to remain firmly attached to rocks even though waves are constantly crashing on them [10]. The adhesive properties of this glue are attributed to the presence of DOPA and cysteine in Mfp [10].
A typical problem of DOPA-based polymers is the tendency for autoxidation. Autoxidation refers to oxidations brought about by the reactions with oxygen at normal temperature, without the intervention of flame or electric spark. DOPA has two –OH groups in its structure, when these two –OH groups change to =O (DOPA quinine will be formed), DOPA will lose the ability to combine the metal ions (see the following scheme). This change from DOPA to DOPA-quinine is an autooxidation and a disadvantage of the DOPAcontaining polymer because the polymer would autoxidize inside the human body due to the presence of oxygen and lose its integrity. To keep the strength of the adhesive, the DOPA-containing polymer cannot undergo autooxidation of DOPA. This process occurs rapidly and is difficult to control [4]. In our polymer, we also included cysteine which will prevent DOPA autooxidation. Cysteine minimizes oxidation, keeping the integrity of the adhesive intact [4]. Without the cysteine, the polymer would autoxidize inside the human body, making it useless for healing,
71 Ingenium 2023
In this study of wound healing, a DOPA-based (D) polymer containing cysteine (C), O, O’-bis-(2aminopropyl)- polyethylene glycol (BAPPG)(B) glycerol (G), and lysine diisocyanate (LDI) (DCBG+LDI) and the properties of DCBG+LDI polymer were compared with two polymers containing IPDI and BAPPG. The inclusion of cysteine is anticipated to lead to higher structural polymer integrity due to the minimization of autooxidation. Higher structural integrity should also increase the overall tensile strength of the polymer. The usage of DOPA as the backbone mimics the strong adhesive found in mussels, which is a natural, wellstudied adhesive.
Mechanical testing was conducted by mice tail and rat tail weight bearing experiments. This mechanical testing was conducted on the IPDI and BAPPG polymer and the IPDI and PEG polymer. The cellular toxicity of this LDI-DCBG polymer was evaluated in vitro using a cell culture model. Bone marrow stem cells and Achilles tendon cells were the seeding cells. The effect of this DCBG+LDI polymer on wound healing was assessed using a mouse tail wound healing model.
2. METHODS
Synthesis of DCBG+LDI adhesive. The DCBG+LDI polymer was synthesized in two steps. During the first step, 0.92 g of glycerol (MW 92, 10 mmol, -OH 30 mmol) was added into a dry round-bottomed flask, flushed with nitrogen, fitted with rubber septa, and sealed. Subsequently, 5.65 g LDI (MW 226, 25 mmol, -NCO 50 mmol) was added into the flask by a syringe. The mixture was stirred continuously at room temperature overnight to obtain LDI-Glycerol pre-polymer. At the second step, 0.5 g of DOPA methyl ester hydrochloride (MW 247, 2.024 mmol, -NH2 2.024 mmol) and 0.38 g of cysteine ethyl ester hydrochloride (MW 185.67, 2.047 mmol, -NH2 2.047 mmol) were dissolved with 10 ml of BAPPG (MW 500, 20 mmol, -NH2 40 mmol) to make solution A. Finally, the medical adhesive (DCBG+LDI) was obtained by mixing one part of LDI-Glycerol prepolymer with one part of solution A.

In a separate experiment, BAPPG was reacted with LDI to make a BAPPG+LDI polymer adhesive for in vivo testing. Similarly, BAPPG was reacted with IPDI to make a BAPPG+IPDI polymer adhesive for in vivo testing. Swelling test of DCBG+LDI polymer foam. The DCBG+LDI polymer foam was obtained by mixing equal volume of pre-polymer and solution A. The formed foam was allowed to dry into a large piece of polymer foam. The foam was cut with a clean razor blade into fifty pieces of comparable size and shape with a consistent mass. These pieces were then added to phosphate-buffered saline (PBS) and allowed to soak for seven weeks with swelling monitored. At specific time intervals, the weightings were re-performed to determine the effect of the swelling and whether degradation had occurred.
Cellular toxicity test of DCBG+LDI polymer. For the cellular toxicity test, GFP-mouse tendon stem cells (TSCs) and bone marrow stem cells (BMSCs) were seeded into a 6-well culture plate at the density of 3.5 × 10 4 /well with four different culture conditions: the cells in group-1 were seeded into the normal culture plate where the wells were not coated with polymer; the cells in group-2 were seeded into the wells coated with the polymer-1 made by 10 ul DCBG+5ul LDI; the cells in group-3 were seeded into the wells coated with polymer-2 made by 20 ul DCBG+10ul LDI; the cells in group-4 were seeded into the wells coated with polymer-3 made by 20 ul DCBG+15ul LDI. The cells were cultured with DMEM plus 20% FBS and 1% penicillin-streptomycin for 7 days. The cell morphology was examined under microscope, the cell numbers were analyzed by cellular auto counter, and the cell proliferation was determined by population doubling time (PDT).
72 Undergraduate Research at the Swanson School of Engineering
Image A: DOPA transforming into DOPA-quinone due to autooxidation. The chemical structures are shown.
Image B: DOPA bonding to the metal cation Ca2+
Mechanical strength analysis of DCBG+LDI polymer adhesive using an in vitro model. The polymer mechanical strength was assessed via testing the healing of mouse tail cuts and rat tail cuts. The tail was severed fully into two pieces, aligned, and then glued together with the two polymers. The tail pieces were attached via BAPPG+IPDI polymer or BAEE+IPDI polymer. The time required for polymer formation on each cut was recorded and an average time was calculated. Weights were applied to the end of each tail incrementally to measure strength. The effects of the adhesive were evaluated until failure, where the adhesive could no longer support the weight and the two pieces separated. Each polymer was evaluated at several different time intervals to determine the effect drying time had on strength. Three trials were conducted on each polymer for each time trial, before proceeding with further analysis.
Effect of the polymer adhesives on multiple tissue wound healing. The adhesive strength was tested in vitro using animal tails (C57BL/6J mice from Jackson laboratory and Sprague Dawley (SD) rats from Charles River). The effect of the polymer adhesives (BAPPG+IPDI polymer or BAPPG+LDI polymer) on multiple tissue wound healing was tested by a mouse wounded tail model. Three C57BL/6J mice were used in each group. The mouse tail was cut three-fourths of the way through with a scalpel. In the control groups, the cut was made and then sutured closed. In both polymer groups, the cut was made, the polymer was smeared to the cut before being sutured closed. All experiments were performed in triplicate, each being repeated at least three times. During healing, pictures were taken each day. The mice were allowed to heal 3-4 weeks before being euthanized.
Statistical analysis. The following tests were used: 1) One-way ANOVA, and 2) Fisher’s LSD test for multiple comparisons. A P <0.05 value between two groups is considered significantly different. The one-way ANOVA was used for the proliferation analysis of the cells grown in the polymer coated plates. The cell proliferation was analyzed by population doubling time (PDT), the cells were seeded into each well at the same density with different conditions (polymer volume changes, polymer type changes), and compared with normal cell culture plate (control) without the polymer coating.
3. MATERIALS
Glycerol (molecular biology grad), cysteine (98%) and isophorone diisocyanante (IPDI; 98%) were obtained from Millipore Sigma (Rockville, MD); O’O-Bis(2aminopropyl) polyethylene glycerol 500 (BAPPG; 99%) was obtained from Fluka (Buchs, Switzerland); Lysine ethyl ester diisocyanate (LDI; 97%) and L-3,4Dihydroxyphenylalanine methyl ester hydrochloride (DOPA; 98%), and all cell culture medium and reagents including PBS, DMEM, and FBS were obtained from Thermo Fisher Scientific (Ward Hill, MA).
4. DATA PROCESSING
All polymer foam pieces had an initial 10 mg average weight and weighed at regular intervals to calculate the average weight for the day. Initial concentrations, viability, and mean diameters of the stem cells were recorded. The initial seeding amount was kept consistent for each trial. After incubation, the same data was collected and analyzed to find the population doubling time (PDT). The viability was also examined to assess the toxicity of the polymers. The average formation time of the polymer is the time from the initial liquid mixing to the sticky polymer crystallization. Pictures of the live mice were taken at different angles in varying light conditions, and the wound locations were examined for healing.
5. RESULTS
All the polymer adhesives synthesized using DOPA, cysteine, glycerol, BAPPG, and LDI (DCBG+LDI), BAPPG and IPDI (BAPPG+IPDI), and BAPPG and LDI (BAPPG+LDI) formed a pre-polymer viscous liquid. The DCBG+LDI polymer is shown in Fig. 1A. It then formed a sponge-like polymer foam upon mixing and exposure to air (Fig. 1B). The DCBG+LDI polymer foam increased their average weight by almost 25 milligrams over their initial weight of 10 milligrams (Fig. 1C). The polymer pieces swelled time dependently, and their weight spiked within the first day of immersion into the PBS (Fig. 1C). It was expected that the polymer would transition from a viscous liquid to a more solid state; the foam-like texture was not expected. The ability of the polymer pieces to swell and become larger allows the adhesive to hold the two pieces of bone or other substance together more strongly. The human body forms an aqueous environment for the polymer.
73 Ingenium 2023
on the surface
mouse
pieces (A), and can glue the tail pieces together (B,

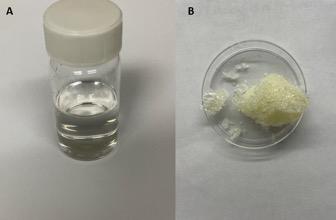
can bear
225 g weight on the
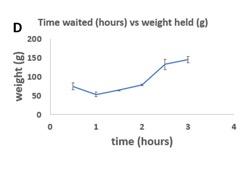
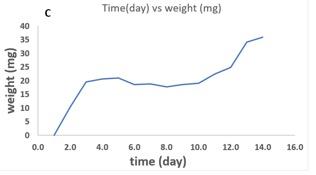
mouse tail pieces (D). The adhesive strength of the LDI-BAPPG (D) is stronger than the IPDI-BAPPG polymer (G). The adhesive strength of both LDI-BAPPG and IPDI-BAPPG polymers increases with longer drying time (D, G). Image B is the enlarged blue box area found in image C.
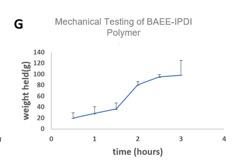
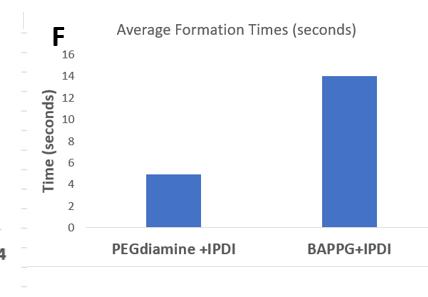
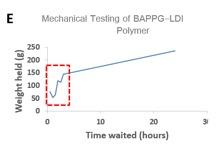
74 Undergraduate Research at the Swanson School of Engineering
Fig. 1 LDI-DCBG polymer either forms a viscous liquid (A), or a sponge-like foam (B) under different conditions (time mixed and air exposure). The graph shows that one piece of LDI-DCBG foam (10 mg) can absorb 25 mg of water (C).
Fig 2. The LDI-DCBG adhesive can be smeared
of the
tail
C). The LDI-BAPPG adhesive
more than
adhered
The polymers assessed in vitro on the mouse tail segments (Fig. 2A-C) had different drying times and adhesive strengths (Fig. 2E-G). The BAPPG+LDI polymer supported 200 grams (Fig. 2E). In contrast, the BAEE+IPDI polymer supported less weight but dried faster (Fig. 2G, F). The difference in weight supported was larger than expected. The strength of both polymers increased with longer drying times as expected. (Fig. 2D).
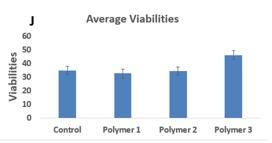
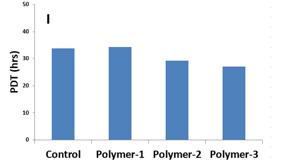
In the cell cultures, all wells with the polymer formulas had tendon-like sheets of bone marrow stem cells (Fig. 3F-H) or Achilles tendon cells (Fig. 3B-D). Tendon-like sheet layers of cells form in parallel layers. These layers of tendon cells formed on top for all three polymers and are clearly visible, while the control wells had thick layers of cells. For tendon-like sheets of cells to form, there must be more cells present than for regular thick layers. The bone marrow stem cells (BMSCs) grown in the normal culture plate (control) showed normal morphology of BMSCs (they are still stem cells---self renew), but BMSCs differentiated into tenocytes and formed tendon-like sheet when they were cultured with our polymer. Due to these results, it is concluded that the polymer increased cell proliferation, which was not an anticipated benefit, as the polymer was expected to have no significant effect on viability. The culture with the highest viability for the cells was the one with highest LDI concentration in the polymer (based on standard deviation (SD) error bars) (Fig. 3J). There was no difference in cell proliferation for the polymers containing equal amounts of DCBG but different amounts of LDI. The population doubling time (PDT) was only statistically different for polymer 3 based on the SD error bars (Fig. 3I). It was expected that the PDT would be significantly different for either all polymers or none. GFP cell distribution was increased for polymers based on the amount of fluorescence. (Fig. 3E-H). The cell diameter and cell viability were determined by the auto cell counter (Cellometer Auto T4; Nexcelom, Lawrence, MA), This machine can give the cell diameter, and cell number, cell distribution (the cell number of the different size cells), dead cell number, and live cell number, etc. These data points represent the cell viability and cell proliferation.
Fig. 3 The LDI-DCBG adhesive does not adversely affect morphology and population doubling time (PDT) of mouse TSCs (A-D) and BMSCs (E-H). Some tendon-like tissues are found in TSCs cultured with LDI-DCBG (B-C). Polymers 1-3 have differing concentrations of DCBG and LDI. The proliferation of the mouse BMSCs increases in an LDIconcentration dependent manner (I). Graph of average viabilities for each of the four groups: Polymers 1-3 and the control (J).
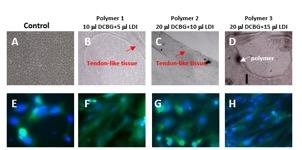
75 Ingenium 2023
In vivo experimental results revealed the LDI-based polymer enhanced tail healing. Inspection of the pictures revealed the wounds treated with the polymer were shallower and had better coloring that more closely resembled healthy skin (Fig. 4F). This was expected. It was predicted that the increased amount of contact in the tail would increase healing. A large unhealed gap was visible in the tails of the control group (Fig. 4B, C), but not in the tails of the polymer groups (Fig. 4E, F).
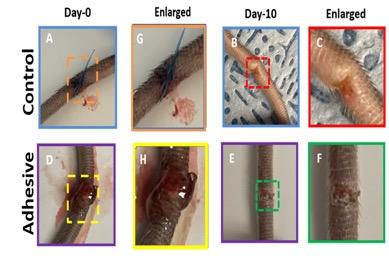
4. DISCUSSION
The DCBG polymer swells time-dependently with a spike immediately after immersion. The amount of liquid absorbed is more than double the original mass of the polymer pieces. PMMA does not swell in the body [5].
The polymers can increase cell proliferation in vitro, causing thick, tendon-like sheets of cells to form. The two polymers, BAPPG+IPDI and BAEE+IPDI, adhere strongly to organic materials and can hold a significant amount of weight. In mice, the tail glued together by the polymer can hold more than the mouse’s actual weight, once the polymer has been allowed to dry. Increasing drying time increases strength, but once a baseline time has been established, there is no noted effect on strength. PMMA takes around an hour to fully cure and requires an activator (cannot be premixed) [5]. In contrast, BPPG-IPDI and BAEE-IPDI do not require an additional activator.
The DCBG+LDI polymer is non-toxic to cells as demonstrated by insignificant differences in viability for the bone marrow stem cells (BMSCs) and tendon cells seeded both on the polymer and in the control group. Degradation products of TDI are suspected carcinogens while the degradation products of the PU synthesized by MDI are suspected to cause hepatitis [8][9].
Fig. 4 The adhesive enhances wound healing. Mouse tail pieces are sutured together in the control group (A) and glued together with adhesive in the wound adhesive treated group (D). While a large unhealed wound area remains in the control group on day-10 of post-surgery (B, C), no gap is noted in the wound adhesive treated group (E, F). Image C is the enlarged area of the red box in image B. Image F is the enlarged green box area in image E. Image G is the enlarged orange box area of image A. Image H is the enlarged yellow box area of image D.
The diameters of the cells were similar in both groups. The polymers can increase cell proliferation in vitro, causing thick, tendon-like sheets of cells to form compared to the control as seen in the images in Fig. 3. BAPPG+LDI polymer bonds to the bone, skin, and nerve tissue in live mice tails. These bonds aid in wound healing, limiting additional surgeries [7]. Strong bonds leading to healthy cells also limit inflammation and infection [7].
5. CONCLUSIONS
This study examined the use of the polymer as a novel, fast cure, non-toxic wound adhesive. Excellent wound healing was observed when reacting LDI with mussel adhesive protein-containing compounds, DOPA and cysteine. This LDI-DOPA-cysteine-based adhesive, unlike commercial polymers made of MDI, HDI, or TDI, is biocompatible. It does not affect the morphology and PDT. When using IPDI instead of LDI to synthesize the polymer, the adhesive strength was decreased. The mechanical strength increased in a drying timedependent manner. The cell proliferation displayed increases in an LDI-concentration-dependent manner. This study used mice tails as a new multiple wounded tissue healing model because mice tails contain bone, cartilage, tendon, ligament, muscle, skin, blood vessels, and nerves.
76 Undergraduate Research at the Swanson School of Engineering
The LDI-DOPA-cysteine polymer adhesive can enhance wound healing in vivo. This study shows that the DCBG+LDI polymer is not toxic and increases cell proliferation in vitro. The BAPPG+LDI polymer bonds to organic materials and aids healing. The BAPPG+IPDI polymer also adheres to organic materials. The two former polymers form an adhesive with the strength to support multiple times more than the weight of a mouse. The LDI based polymer can enhance wound healing in vivo and prevent inflammation. Successful use of the adhesive will result in no further procedures such as surgeries to remove implants or other surgical implements. The DOPA-based polymer containing LDI, cysteine, BAPPG and glycerol is biodegradable and biocompatible which enhances severe wound healing. Further study will focus on the formulation design and development. We will do more in vitro and in vivo experiments to find a better formula of this DOPALDI-containing polymer. We will also investigate the effect of this DOPA-LDI-containing polymer with some bioactive reagents (such as some growth factors) on multiple tissue wound healing.
6. ACKNOWLEDGEMENTS
This work was supported in part by the University of Pittsburgh Swanson School of Engineering (SSOE) Summer Research Program, the NIH under award number AR070340, and Pittsburgh Foundation Awards: AD-2021-120108; AD-2021-120112.
REFERENCES
[1] Sen CK, Gordillo GM, Roy S, Kirsner R, Lambert L, Hunt TK, Gottrup F, Gurtner GC, Longaker MT. Human skin wounds: a major and snowballing threat to public health and the economy. Wound Repair Regen. 2009 Nov-Dec;17(6):763-71. doi: 10.1111/j.1524-475X.2009.00543.x. PMID: 19903300; PMCID: PMC2810192.
[2] Tatsioni A., Balk E., O’Donnell T., Lau J. (2007). Usual care in the management of chronic wounds: A review of the recent literature. Journal of the American College of Surgeons, 205(4). https://doi. org/10.1016/j.jamcollsurg.2007.05.032
[3] Arm injury statistics. Aids for One Armed Tasks. (n.d.). Retrieved July 19, 2022, from https://u.osu.edu/ productdesigngroup3/samle-page/
[4] Onche II, Osagie OE, INuhu S. Removal of orthopaedic implants: indications, outcome, and economic implications. J West Afr Coll Surg 2011 Jan;1(1):101-12. PMID: 25452945; PMCID: PMC4170248.
[5] Frazer RQ, Byron RT, Osborne PB, West KP. PMMA: an essential material in medicine and dentistry. J Long Term Eff Med Implants 2005;15(6):629-39. doi: 10.1615/jlongtermeffmedimplants.v15.i6.60. PMID: 16393131.
[6] Dunne NJ, Orr JF. Thermal characteristics of curing acrylic bone cement. ITBM-RBM 2001; 22:88-97.
[7] Boxberger JI, Adams DJ, Diaz-Doran V, Akkarapaka NB, Kolb ED. Radius fracture repair using volumetrically expanding polyurethane bone cement. The Journal of Hand Surgery 2011; 36(8): 1294-1302.
[8] McGill DB, Motto JD. An industrial outbreak of toxic hepatitis due to methylenedianiline. N Engl J Med 1974; 291(6):278-282.
[9] Benoit FM. Degradation of polyurethane foams used in the Meme breast implant. J Biomed Mater Res 1993; 27(10):1341-1348.
[10] Sjøgren, K. (2013) Synthetic Mussel adhesive sticks to anything, ScienceNordic. Available at: https:// sciencenordic.com/biotechnology-chemistrydenmark/synthetic-mussel-adhesive-sticks-toanything/1391382 (Accessed: November 9, 2022).
77 Ingenium 2023
Spinal Cord Stimulation for Bladder Function Evokes
Sporadic Nerve Activity
Savannah C. Waymer 1,2 , Maria K. Jantz1,2,3 , Chaitanya Gopinath2,4 and Robert A. Gaunt1-4
1 Department of Bioengineering, University of Pittsburgh
2 Rehab Neural Engineering Labs, University of Pittsburgh
3 Center for the Neural Basis of Cognition, University of Pittsburgh
4 Department of Physical Medicine and Rehabilitation, University of Pittsburgh
Savannah Waymer is a junior bioengineering student from Washington, D.C. She is interested in researching neural stimulation for rehabilitation.

ABSTRACT
Maria Jantz is a PhD candidate at the University of Pittsburgh studying electrical stimulation for lower urinary tract control. She is interested in neural stimulation for rehabilitation of sensorimotor systems.

Lower urinary tract dysfunction is extremely detrimental to overall health and leads to a decrease in the quality of life of people living with it [2]. One emerging way to improve lower urinary tract function is to use epidural spinal cord stimulation (SCS). Here, we stimulated on the dorsal epidural surface of the lumbosacral spinal cord of five cats and investigated changes in bladder function evoked by stimulation. With SCS at 3 Hz and 33 Hz, we were able to achieve both continence and voiding responses, respectively. Nerve activity recorded from the pelvic and pudendal nerves during these trials showed that large, sporadic responses occurred throughout the stimulation trains. The inconsistent nature of this nerve activity suggests that these responses are likely compound action potentials in the efferent axons of these nerves. If so, sporadic responses may indicate that reflexes were recruited and thus be associated with improved bladder function. We observed more sporadic responses in trials that successfully evoked voiding or continence compared to trials that did not cause changes in bladder pressure. In addition, the number of sporadic responses evoked in a trial was related to increased bladder pressure.
1. INTRODUCTION
Robert Gaunt is an Associate Professor in Physical Medicine and Rehabilitation at the University of Pittsburgh. His primary research interests are in sensorimotor control of the hand and bladder and developing advanced devices to restore function to these systems after injury and disease.

Significance Statement
One in five people experience lower urinary tract dysfunction [1]. One possible method to restore lower urinary tract function is epidural spinal cord stimulation. In this paper we examine how sporadic nerve activity caused by spinal cord stimulation improves bladder function.
Category: Experimental Research
Keywords : Lower Urinary Tract Dysfunction, Bladder, Spinal Cord Stimulation, Electrophysiology
Urinary tract dysfunction is a significant problem for people with spinal cord injuries (SCI). The current method to treat lower urinary tract (LUT) dysfunction is clean intermittent catheterization, which for many people can be difficult to use, and is a leading cause of urinary tract infections [3]. One potential approach to restoring urinary tract function is epidural spinal cord stimulation (SCS), which is widely used in clinical settings to treat pain [4]. In our lab, we have shown that epidural SCS can recruit afferent fibers of LUT nerves in cats [5]. The LUT reflexes are voiding, or bladder emptying, and c ontinence, which is urine storage. Both of these have been achieved successfully in our lab using SCS. However, the mechanisms involved in effectively recruiting these reflexes remain unclear, and results are inconsistent. To most effectively apply this in a clinical setting, it is important that we understand the details of how SCS recruits spinal reflexes that ultimately lead to changes in function.
Lower urinary tract reflexes are initiated by activity in afferent axons which send sensory information to the spinal cord and brain, resulting in modulated activity in efferent axons which send motor signals to the muscles [6]. This reflex is primarily innervated by the pelvic and pudendal nerves, which arise from the sacral spinal cord. Pudendal nerve afferents can drive both continence and voiding responses [7] while pudendal nerve efferents control the external urethral sphincter. Pelvic nerve afferents convey bladder sensation, and pelvic nerve efferents contract the bladder. It has been previously theorized that SCS mainly activates the
Ingenium 2023
78
Savannah Waymer
Maria Jantz
Robert Gaunt
afferent axons of these nerves [4]. In our experiments we recorded compound nerve action potentials from the whole nerve and expected to observe antidromically driven signals from the afferent axons that occurred in response to every stimulus pulse in a stimulus train (Figure 1). However, we also observed responses which occurred sporadically throughout some stimulus trains. This may be characteristic of an efferent nerve recruited post-synaptically to the afferents in the spinal cord. We hypothesized that if these sporadic responses occur, it could possibly indicate that efferent aspects of the bladder reflex have been activated by stimulation evoked neural activity. This implies that increases in sporadic responses would be correlated with increased functional output, that is, evoked sporadic responses may be an indicator that the bladder reflexes have been successfully recruited. Here, we characterize sporadic responses evoked during stimulation for bladder function in acute cat experiments to determine if these responses could lead to overall better function. Primarily, we hypothesize that the presence of sporadic responses in trials would result in improved function.
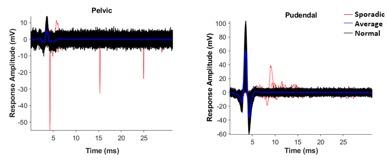
In five cats, we recorded the electrical activity from the pelvic and pudendal nerves as well as the deep perineal, caudal rectal, and sensory branches of the pudendal nerve during stimulation through SCS electrodes on the sacral and lumbar spinal cord. We stimulated at two different stimulation frequencies, 33 and 3 Hz, which have evoked differences in function in our previous experiments. Low frequency stimulation (<10 Hz) on the pudendal nerve is known to facilitate continence, while higher frequencies (>20 Hz) of pudendal nerve stimulation can facilitate voiding and can result in sustained bladder contractions [8]. Stimulation was applied in charge-balanced pulses with pulse widths of 200 µs in each pulse, for stimulation trains of >20 s in order to see the effects on the bladder. Stimulation amplitudes varied between 50 and 1200 microamps with the higher end determined by lower limb muscle activation. We believe that spinal cord stimulation is able to recruit the pudendal nerve, so we used those frequencies in testing.


2. METHODS AND MATERIALS
All procedures were approved by the University of Pittsburgh Animal Care and Use Committee. Animals were placed under isoflurane
79 Ingenium 2023
Figure 1. Example compound action potentials. All responses in the pudendal nerve to pulses in one stimulation train are overlaid here, with red representing a sporadic response.
Figure 2. Bladder pressure recorded during different trial types. a) Voiding responses include a large contraction. b) Continence SCS suppressed non-voiding contractions. c) SCS did not always evoke a functional response.
In addition to recording nerve data, we implanted a catheter in the bladder to record bladder pressures throughout the experiment. We did not record the volume of urine that was voided during each trial. We maintained the bladder at a fill level of 20% to 80% to observe changes in both voiding and continence responses. Above a particular bladder volume, it is normal to have regular small, non-voiding contractions. When these non-voiding contractions were suppressed by stimulation, we considered that trial a continence response. If there was a large, sustained increase in bladder pressure during the stimulation window, that was described as a voiding-like response. If bladder pressure appeared unaffected by stimulation, then that trial was deemed to have resulted in no function.
Sporadic responses were found by analyzing the nerve activity after each pulse during the stimulation train. We calculated the mean response to a single pulse throughout the stimulation train. If the amplitude of the nerve activity after a given pulse was more than four standard deviations either above or below this mean response, that activity was deemed sporadic. The number of sporadic responses for each nerve was then compared to whether the trial resulted in desired function (voiding and continence) or no function. When analyzing responses was probably consistent activation of the efferent between the number of sporadic responses and evoked bladder pressure during stimulation. The data were analyzed in Matlab (Mathworks Inc, Natick, MA) using the built-in perform the hypothesis test on the regression.
3. RESULTS
Sporadic nerve activity occurred in both the pudendal and pelvic nerve (Figure 1). More sporadic activity happened in trials that resulted in voiding or continence responses than in trials that resulted in no function. When stimulating at 33 Hz, in 48.1% of the trials that evoked voiding, there were more than 5 sporadic responses in the pudendal nerve, while in trials with no evoked function, only 16.5% of the trials contained this number of responses (Figure 3a). In trials where stimulation occurred at 3 Hz, 39.5% of trials that resulted in continence had 5 or more sporadic responses in the pudendal nerve, while trials that resulted in no function only had sporadic responses 8.8% of the time (Figure 3b).
For the pelvic nerve, higher numbers of sporadic responses during high-frequency SCS were correlated with increased bladder pressure with the p-values from a hypothesis test on the regression for the slope being 0.0084523 for the pelvic nerve. For the pudendal, p-value was 0.91664 which does indicate a correlation.
In trials that resulted in voiding there was a strong correlation between the amount of pelvic sporadic responses and pudendal sporadic responses (5a). For both the pelvic and pudendal nerve, the p-values from the regression test were 1.5358e-09 and 1.3931e-11, respectively. (Figure 5a).
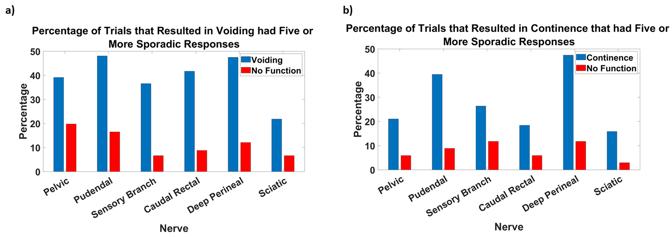

80 Undergraduate Research at the Swanson School of Engineering
Figure 3. Trials with effective function were more likely to have sporadic activity. a) Voiding trials were more likely to show sporadic activity in all nerves than no function trials. b) Continence trials were more likely to show sporadic activity in all nerves than no function trials.
4. DISCUSSION
Higher numbers of sporadic responses were present in cases which evoked both continence and voiding (Figure 3a, b). This supports our hypothesis that these responses may be evoked efferent activity leading to improved function but has not provided insight as to whether the responses are efferent activation.


We found that when there were more sporadic responses, there were also larger changes in bladder pressure in most situations (Figure 4a, b). In voiding, it was common for there to be a high number of both pelvic and pudendal sporadic responses (Figure 5a). This could indicate that both parts of the bladder reflex were activated when stimulation occurred. In continence, however, pudendal sporadic responses were common but pelvic sporadic responses were not (Figure 5b). Because the pelvic efferents are
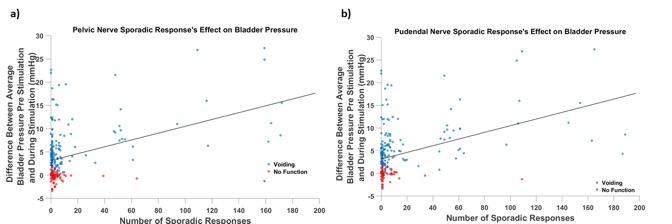

involved in bladder contractions, the lack of pelvic sporadic responses may be necessary for a successful continence response. This is essential knowledge in further research as we work towards evoking consistent function. This may eventually allow us to select a certain channel and amplitude and get an expected void or continence response every time we stimulate.
A result worth noting is that sporadic responses were present on the sensory branch of the pudendal nerve, which putatively does not contain efferents, making the nature of this activity unclear. There were a large number of trials with no sporadic activity that were also able to effectively produce reflexes, meaning that effective function cannot be predicted solely based on sporadic activity. It is difficult to intentionally replicate sporadic responses, because they are by nature inconsistent, making it difficult to disentangle differences between good voids with and without
81 Ingenium 2023
Figure 4. Sporadic activity during voiding trials. a) The number of sporadic responses compared to the difference between the average bladder pressure before and 5 seconds after stimulation during trial at 33 Hz. b) The number of sporadic responses compared to the difference between the average bladder pressure before and 5 seconds after stimulation during trial at 3 Hz.
Figure 5. Relationship of sporadic activity between the pelvic and pudendal nerves. a) The comparison of pelvic and pudendal sporadic responses in trials conducted at 33Hz. b) The comparison of pelvic and pudendal sporadic responses in trials conducted at 3Hz.
sporadic activity. However, this work suggests that although sporadic responses are not the only factor, they are helpful indicators of effective function in the bladder. Although large changes in bladder pressure are present in trials with more sporadic responses, bladder pressure is not the only indicator for whether there will be an actual void. The bladder may contract without resulting in a void, particularly if the urethra is also contracted. Because we did not record voided volumes, we cannot also correlate those values to the neural activity. However, bladder contractions evoked by SCS are critical to successful voids. With a full understanding of the relationship between bladder function and neural activity, we are closer to getting consistent void and continence responses every time.
5. CONCLUSIONS
Sporadic responses were more common in trials which effectively evoked bladder reflexes. In practical applications, this may be a useful indicator to identify electrodes that are likely to evoke useful bladder functions, which is a much faster method than waiting for the functional responses themselves to occur. Stimulation electrode choices can be guided by the neural activity in response to stimulation, including sporadic responses. In future work, we hope to evaluate latency and other characteristics of the nerve activity to identify the mechanism that leads to this sporadic activity.
6. ACKNOWLEDGEMENTS
The Office of the Director, National Institutes of Health under Award Number OT2OD024908.
REFERENCES
[1] N. N. Maserejian et al., “Incidence of Lower Urinary Tract Symptoms in a Population-Based Study of Men and Women,” Urology, vol. 82, no. 3, pp. 560–564, Sep. 2013, doi: 10.1016/j.urology.2013.05.009.
[2] Í. D. R. A. Esclar, Í. L. E. Garc, and C. R. Herruzo, “Epidemiology and risk factors for urinary tract infection in patients with spinal cord injury,” J. Urol., vol. 164, no. 4, pp. 1285–1289, Oct. 2000, doi: 10.1016/S0022-5347(05)67157-1.
[3] M. D. Stillman, J. M. Hoffman, J. K. Barber, S. R. Williams, and S. P. Burns, “Urinary tract infections and bladder management over the first year after discharge from inpatient rehabilitation,” Spinal Cord Ser. Cases, vol. 4, p. 92, 2018, doi: 10.1038/s41394018-0125-0.
[4] K. Kumar, C. Toth, R. Nath, and P. Laing, “Epidural spinal cord stimulation for treatment of chronic pain—some predictors of success. A 15-year experience,” Surg. Neurol., vol. 50, no. 2, pp. 110–121, Aug. 1998, doi: 10.1016/S0090-3019(98)00012-3.
[5] M. K. Jantz et al., “High-density spinal cord stimulation selectively activates lower urinary tract afferents,” University of Pittsburgh, preprint, May 2021. doi: 10.1101/2021.04.30.442206.
[6] W. C. de Groat, D. Griffiths, and N. Yoshimura, “Neural control of the lower urinary tract,” Compr. Physiol., vol. 5, no. 1, pp. 327–396, Jan. 2015, doi: 10.1002/cphy.c130056.
[7] P. B. Yoo, J. P. Woock, and W. M. Grill, “Bladder activation by selective stimulation of pudendal nerve afferents in the cat,” Exp. Neurol., vol. 212, no. 1, pp. 218–225, Jul. 2008, doi: 10.1016/j. expneurol.2008.04.010.
[8] A. E. Snellings and W. M. Grill, “Effects of stimulation site and stimulation parameters on bladder inhibition by electrical nerve stimulation,” BJU Int., vol. 110, no. 1, pp. 136–143, 2012, doi: 10.1111/j.1464410X.2011.10789.x.
82 Undergraduate Research at the Swanson School of Engineering
Fundamentals of Silica Scaling on Nanofiltration Membrane
1 Department of Chemical and Petroleum Engineering, University of Pittsburgh
2 Department of Civil and Environmental Engineering, University of Pittsburgh
Alexandra Fuller is a senior in the chemical engineering department. She intends to work in industry and improve processes that better water quality in public waterways.

ABSTRACT
Dr. Vidic is professor and head of the Department of Civil and Environmental Engineering at the University of Pittsburgh. Prof. Vidic has 25 years of experience in environmental engineering focused on physical/chemical/biological processes for water, wastewater and air treatment.

Significance Statement
As water is becoming increasingly scarce globally, alternative water sources are being used and efficient methods to treat these waters are needed. Membranebased desalination is commonly used but it suffers from problems with membrane scaling. To effectively treat these impaired waters, methods to reduce scaling and optimize membrane systems are needed.
Category: Experimental Research
Keywords : Silica scaling, Membrane systems, Nanofiltration, Water treatment
There is an increasing demand for clean water worldwide, but current supplies are unable to meet it. Desalination has emerged as a promising technology to address the problems related to water security. Scaling (i.e., adhesion of minerals to the membrane surface) is one of the major issues that hamper the wide-range application of these processes, especially for source waters of poor quality. The scaling of membranes can lead to a reduction in permeate flux and limit the performance of desalination processes. Silica is one of the major scaling components that is present in many source waters (most groundwaters contain elevated silica levels) and is difficult to remove once the scale has formed. Initial studies in aqueous systems suggest that silica precipitation is not instantaneous and there is an induction time that is dependent on silica concentration. This research explores silica scaling on a polymeric nanofiltration (NF) membrane to evaluate the potential of mitigating this problem by adjusting the feed detention time in the system to be shorter than the homogenous induction time. However, it was found that silica scales the polymeric NF membrane instantaneously, thereby suggesting a different means of silica scale mitigation needs to be found.
1. INTRODUCTION
With a rapidly expanding population and increasing urbanization, clean water is becoming scarce. Water is a limited natural resource and increased industrial activities have resulted in water shortages globally, including parts of the United States [1]. According to the UN, the world’s population is expected to increase to 9.8 billion by 2050 [2]. Many parts of the world are forced to utilize lower quality water sources, such as sea water or brackish water, which are now widely used as a drinking water source [1]. To desalinate these waters, membrane processes are frequently used. Nanofiltration (NF) and reverse osmosis (RO) are the most common high-pressure membrane processes that account for most of the total water desalination capacity globally [1].
RO and NF are pressure-driven processes, which require a driving force greater than the osmotic pressure difference between the feed water and the permeate [3]. Impaired water is pushed through a membrane using hydraulic pressure, leaving the pollutants on the feed side with purified water passing to the permeate side. To reduce brine disposal cost and lower the total operating costs, high water recoveries are preferred in these processes. However, there is a thermodynamic limit to water recovery because the osmotic pressure on the feed side increases as ions are rejected and pure water is removed. As the feed side concentration and osmotic pressure increase, the overall effective driving force is reduced and there is a reduction in water permeance.
83 Ingenium 2023
Alexandra Fuller 1, Savanna Maynard1, Ritesh Pawar1 and Radisav D. Vidic1,2
Alexandra Fuller
Radisav D. Vidic
This issue can be further exacerbated by concentration polarization [4], which leads to higher concentrations of ions near the membrane surface compared to the bulk. This can lead to mineral scaling, a major issue in pressure-driven membrane processes. Mineral scaling occurs when the solubility limit for a particular constituent on the membrane surface is exceeded, which leads to increased transmembrane pressure and decreased water permeance [1].
One scalant of particular concern in water treatment is silica. Silica is difficult to deal with because it precipitates at low concentrations compared to other minerals. Silica is present in varying concentrations in a wide range of source waters. Concentrations in brackish water and industrial wastewater can range from 12200 mg/L [4]. In order to effectively treat these waters using membrane processes, the behavior of silica in membrane systems needs to be better understood.
Existing thermodynamic models can be used to assess mineral scaling tendencies, but the kinetics of these reactions and the effects of concentration polarization on scale formation in membrane systems are not well understood. Previous studies have focused on the use of antiscalants to prevent silica nucleation, but a new point of interest is the existence of the induction time for silica precipitation. The induction time is the time it takes for the first silica particle to nucleate once the solubility limit is exceeded [6]. Once silica scale forms it is incredibly difficult to remove, which hinders many desalination processes [7]. If the silica induction time can be accurately ascertained, the detention time of the feed in the membrane system can be adjusted to be shorter than the induction time, allowing the process to occur without the need for the addition of antiscalant. There are no previous studies looking into the effect of detention time on silica scaling in membrane systems. Detention time can be altered by changing the flow rate of the contaminated water into the membrane, which makes it relatively easy to change in a pre-existing system.
Furthermore, scaling in heterogeneous membrane systems can vary significantly from that in the homogeneous systems because the membrane surface and inner pores can act as sites for silica nucleation. This study evaluated the performance of a nanofiltration system with varying concentrations of silica to determine if induction time can be used as an effective strategy to prevent silica scaling during filtration of high salinity feedstock.
2. MATERIALS AND METHODS
This study used the nanofiltration membrane NF90 (Dow Filmtec, Edina, MN). NF90 is a fully aromatic membrane with a polyamide active layer and a polysulfone support [6]. High purity (≥99%) sodium chloride (NaCl) and high purity (≥95%) sodium metasilicate pentahydrate (Na2 SiO3·5H2O) (Thermo Fisher Scientific, Pittsburgh, PA) were used to adjust ion concentrations in the feed and HCl (37 wt.%) was used to adjust the pH.
All NF experiments were conducted using a crossflow laboratory-scale SEPA-CFII test cell (GE, Osmonics, Minnetonka, MN) with usable membrane area of 140 cm2 . The membrane pressure and permeate flux were monitored using a pressure gauge and an NVT1601 electronic balance, respectively. The conductivity and pH of the feed was measured using an Orion Versastar Pro conductivity and pH probe (Thermo Fisher Scientific, Pittsburgh, PA). The feed solution was prepared using deionized (DI) water from a MilliQ water system (Millipore, Billerica, MA). Varying concentrations of Na2 SiO3 were added to simulate different source water. Prior to each experiment, the membrane was soaked in deionized water for 24 hours and then compacted in the SEPA cell at a pressure of 30 bar and a flow rate of 1.51 lpm for about 24-26 hours until constant DI water flux was achieved. Once these baseline conditions were established, silica was added to the feed side. Because Na2 SiO3 is a base, it was necessary to add HCl to maintain near neutral pH at which silica polymerization and precipitation occurs. Permeate flux, pH and conductivity were monitored after silica solution was added to assess membrane performance and scale formation. Used membranes were rinsed with DI water to remove loosely attached scale and dried in air prior to SEM/EDX analysis (Thermo Fisher, Apreo SEM and Octane Elite). The system was cleaned between tests by recirculating NaOH solution at pH 12 for one hour followed by a DI water rinse for 30 minutes to remove any silica scale that accumulated in the system. This study was designed to compare membrane performance at many different conditions and it was not possible to include repeated tests due to time constraints.
84 Undergraduate Research at the Swanson School of Engineering
3. RESULTS AND DISCUSSION
Table 1 lists experimental conditions used in this study. In the first experiment (Experiment 1), silica was added to the feed and the pH was maintained near 11 until the system equilibrated as evidenced by steady permeate flux. At that point, HCl was added to the feed to adjust pH to 7 and promote silica precipitation. Upon HCl addition, the feed pH was recorded. In the remaining experiments (Experiments 2-4), the pH was adjusted simultaneously with Na2 SiO3 addition. Table 1 also includes the final feed pH, scaling tendency for SiO2 (Q/K > 1 indicates supersaturation with respect to silica), and the experiment’s duration.

Figure 1a shows pressure (i.e., permeance) and feed pH during the experiment feed. After the addition of Na maintained mixing and system equilibration. The pH was then adjusted to form. Addition of HCl caused a dramatic drop in pH due to imperfect mixing with a slow increase to pH 7.2 due to the release of hydroxide ions during silica precipitation. The data in decline due to silica scale formation when the pH was reduced. It is important to note that there is a potential for significant absorption of metasilicate ions on NF90 membrane while the system was operated at pH 11. In that case, silica would be highly concentrated on the membrane and within its pores, which would lead to rapid polymerization and pore blockage when the pH was reduced to 7.
To test this hypothesis, a filtration test was conducted at a pH 11 to prevent silica polymerization, and the Si presence on the NF90 membrane was determined using SEM/EDX. The yellow line in Figure 1b indicates Si concentration throughout the membrane cross section. As shown in this figure, Si concentration spikes on the surface of the membrane and in the active layer, and then declines in the support layer. These results represent strong evidence that silica ions adsorb in the active layer of this thin film composite membrane, which leads to rapid polymerization in membrane pores and permeate flux reduction once the solution pH is adjusted to near neutral values.
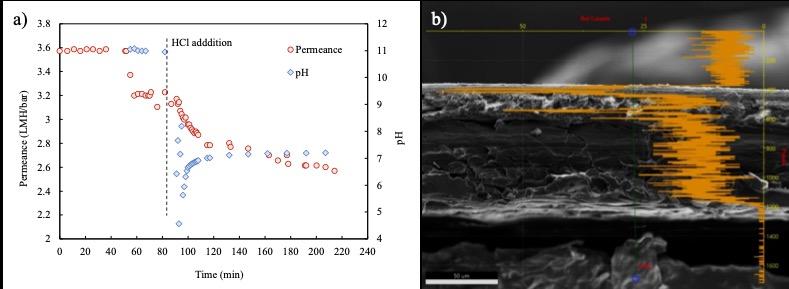

85 Ingenium 2023
Table 1. Experimental conditions analyzed
Figure 1. a) Permeate flux and feed pH in experiment with 400 mg/L of Na2 SiO3 b) Silica profile in NF90 membrane exposed to metasilicate solution at pH 10
Because of this phenomena, subsequent filtration experiments were conducted by adding Na2 SiO3 and HCl simultaneously to the feed side to ensure near neutral pH from the start of the test. The results of Experiment 2 conducted in this fashion with Na2 SiO3 concentration in the feed of 800 mg/L is shown in Figure 2a.
The results in Figure 2a indicate that it took about 15 minutes for the feed pH to reach the intended pH of 7 because the HCl solution was added several times in small increments but that the scaling pH of silica (i.e., pH < 8) was reached in 4 minutes. It is important to note these times were determined from the moment of HCl addition. The time Na2 SiO3 had to adhere to the membrane surface before a scaling pH was reached decreased dramatically compared to that in Experiment 1, but poor mixing in the feed reservoir still needed to be rectified. There was a 13% decline in permeate flux after all HCl was added to the feed; however, the flux decline started the moment HCl was added. The feed reservoir was changed to a deeper and narrower cylinder and external mixing with a stir blade was added for subsequent experiments. Experiment 3 was conducted using the modified system and a Na2 SiO3 concentration of 1,000 mg/L. This experiment was conducted for 30 minutes at a pH 4.8 and the results are depicted in Figure 2b.
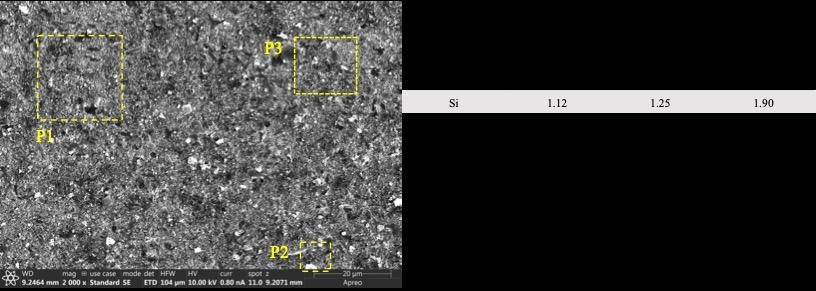

While the Na 2 SiO3 concentration in the bulk feed was 1,000 mg/L, the actual concentration on the membrane surface was 1,500 mg/L due to concentration polarization (previous studies determined that the Concentration Polarization Coefficient (CPC) in this system is 1.5). The CPC combines the hydraulic and mass transfer coefficients of the membrane module to represent the ratio between the concentration at the membrane surface and that in the bulk. Na 2 SiO3 concentration on the membrane surface was small enough that the induction time for silica scaling under homogeneous conditions was more than 10 minutes. In this trial, the pH was stabilized at low level within 2 minutes but Figure 2b clearly indicates instantaneous permeate flux decline. At the end of this experiment, the NF90 membrane was removed from the SEPA cell and immediately rinsed with DI water. The SEM/EDX analysis of the membrane used in this experiment shown in Figure 3 confirms the presence of silica on the surface.


86 Undergraduate Research at the Swanson School of Engineering
Figure 2. Permeate flux and feed pH in experiment with a) 800 mg/L Na2 SiO3 and b) 1000 mg/L Na2 SiO3
Figure 3. SEM/EDX analysis of NF90 membrane exposed to 1,000 mg/L of Na2 SiO3 at pH 4.8 for 30 minutes where P1 refers to Position 1, P2 refers to Position 2, and P3 refers to Position 3.
Experiment 4 was conducted under identical conditions as Experiment 3 except that a feed pH of 3.6 was achieved 1.5 minutes after HCl addition and the filtration was performed for 1.5 minutes, which is much shorter than the induction time of silica formation under homogenous conditions. Due to the shortened duration of this experiment, not enough data was collected to show a flux decline. At the end of this experiment, the NF90 membrane was removed from the SEPA cell and immediately rinsed with DI water. Figure 4 shows the SEM/EDX analysis of this membrane. As can be seen from Figure 4, there is a clear silica presence on this membrane that has been in contact with silica solution even for this very short period of time.
Prior to SEM/EDX analysis of NF90 membranes exposed to silica solution, it was confirmed that the silica signature was not due to the evaporation of physically bound feed solution during membrane drying. This was done by conducting SEM/EDX analysis of membranes that were submerged in a solution containing low Na2 SiO3 concentration for 30 minutes. The silica concentration used in these tests was 100 mg/L of SiO2 at a pH of 3.3, which corresponds to a Q/K value of 0.88. Since the scaling tendency is less than one, silica solids would not form under these conditions. One NF90 membrane was submerged in this solution, rinsed with DI water and air dried while the other one was air dried without the DI rinsing step. Because there was no silica detected on the surface of either membrane, it is clear that the Si signature shown in Figures 3 and 4 is due to particulate Si attached to the membrane surface.
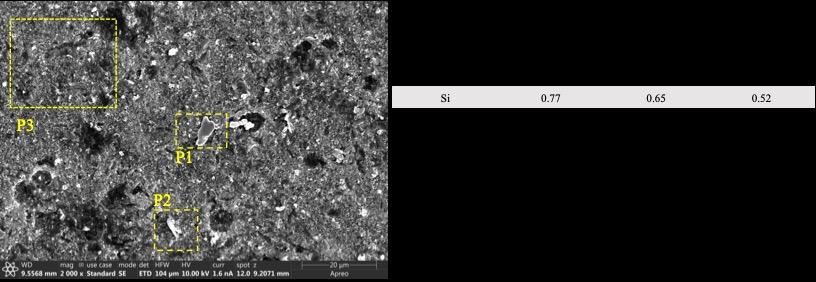

4. CONCLUSION
This study evaluated the impact of silica concentration on the scaling tendency during nanofiltration. Under the experimental conditions evaluated in this study, there was instantaneous decline in permeate flux due to silica scaling. Initial experiments suggested that nanofiltration at high pH will not be prone to scaling but would lead to adsorption of silica ions on the membrane surface and severe fouling in case of a pH drop. Subsequent experiments revealed that silica supersaturation in the feed would lead to rapid solids formation at pH <7 as evidenced by almost instantaneous permeated flux decline. SEM/ EDX analyses of NF90 membranes used in this study revealed the presence of silica on the membrane surface that was not due to evaporating of physically bound feed solution but due to attachment of silica solids formed on the feed side. This study found that silica scales instantaneously in a heterogenous flowthrough system when the silica concentration is above the saturation limit. The instantaneous nature of the scaling prevents detention time from being a possible means of prevention. Future experiments will be conducted using similar conditions, but in the presence of antiscalants and using other salts (i.e., sulfates).
87 Ingenium 2023
Figure 4. SEM/EDX analysis of NF90 membrane exposed to 1,000 mg/L of Na2 SiO3 at pH 3.6 for 1.5 minutes where P1 refers to Position 1, P2 refers to Position 2, and P3 refers to Position 3.
REFERENCES
[1] A. Antony, J. H. Low, S. Gray, A. E. Childress, P. LeClech, and G. Leslie, “Scale formation and control in high pressure membrane water treatment systems: A review,” Journal of Membrane Science, vol. 383, no. 1–2. 2011. doi: 10.1016/j.memsci.2011.08.054.
[2] “World population projected to reach 9.8 billion in 2050, and 11.2 billion in 2100 | United Nations”, Accessed: Nov. 12, 2022. [Online]. Available: https:// www.un.org/en/desa/world-population-projectedreach-98-billion-2050-and-112-billion-2100
[3] G. Caputo and A. Giaconia, “Membrane technologies for solar-desalination plants,” in Membranes for Clean and Renewable Power Applications, Elsevier Ltd, 2013, pp. 347–364. doi: 10.1533/9780857098658.5.347.
[4] L. M. Ward, B. G. Fickling, and S. T. Weinman, “Effect of nanopatterning on concentration polarization during nanofiltration,” Membranes (Basel), vol. 11, no. 12, Nov. 2021, doi: 10.3390/membranes11120961.
[5] J. Thompson, A. Rahardianto, S. Kim, M. Bilal, R. Breckenridge, and Y. Cohen, “Real-time direct detection of silica scaling on RO membranes,” J Memb Sci, vol. 528, 2017, doi: 10.1016/j. memsci.2017.01.027.
[6] L. Zhou, Z. Wang, M. Zhang, M. Guo, S. Xu, and Q. Yin, “Determination of metastable zone and induction time of analgin for cooling crystallization,” Chin J Chem Eng, vol. 25, no. 3, pp. 313–318, Mar. 2017, doi: 10.1016/j.cjche.2016.05.046.
[7] J. A. Bush et al., “Prevention and management of silica scaling in membrane distillation using pH adjustment,” J Memb Sci, vol. 554, pp. 366–377, May 2018, doi: 10.1016/j.memsci.2018.02.059.
[8] S. S. Wadekar and R. D. Vidic, “Insights into the rejection of barium and strontium by nanofiltration membrane from experimental and modeling analysis,” J Memb Sci, vol. 564, 2018, doi: 10.1016/j. memsci.2018.07.060.
88 Undergraduate Research at the Swanson School of Engineering
Calibrating Discrete-time Markov Chain Models of Disease Progression with Gradient Descent
Nathan Carney 1 and Jourdain Lamperski1
1 Department of Industrial Engineering, University of Pittsburgh
Nathan Carney of York, PA is a junior majoring in industrial engineering and minoring in materials science and engineering. His academic interests include programming, material experimentation, and photovoltaics manufacturing. He currently works in the NanoProduct Lab.
Dr. Lamperski joined the department of industrial engineering in the fall of 2020. He received a PhD from the MIT Operations Research Center in 2020 and a BS in mathematics from the University of Pittsburgh in 2015. His research interests include optimization, machine learning, and applications in healthcare.


Significance Statement
Existing methods for calibrating disease progression models require large amounts of computation time, ultimately limiting the complexity of the model. In this work we develop a more efficient calibration method that allows us to quickly reconstruct these models from data and thus understand disease progression at a more granular level.
Category: Computational Research
Keywords : Disease progression, Markov chain, gradient descent, model calibration, optimization
Abbreviations: Discrete-time Markov chain (DTMC)
ABSTRACT
Markov chain models are a potentially powerful tool for studying a wide variety of diseases. Specifically, the discrete-time class of Markov chains have strong modeling properties with respect to the parameterdependent progression of a disease through its definable stages and with respect to predicting the likelihood that a patient will transition to a new stage of the disease. For instance, Markov chains may be used to understand the degrees to which various parameters such as age, sex, activity level, health conditions, and specific genes affect the development of a degenerative disease through its stages and thus may be used to predict the likelihood of mortality for any given patient, at any given time, should their values for the variables used in the model be known. Unfortunately, existing methods for calibrating these models typically ignore their underlying mathematical structure. Consequently, these methods are computationally expensive which results in significantly longer running times. This in turn limits the complexity of the models that can be calibrated using these methods. In this work we develop a more principled and efficient method for calibrating these models, and we use our method to calibrate a hypertension (high blood pressure) model as an example. We observe that the initialization of our method has a substantial impact on its convergence. That is to say that on average, after 500 iterations of our gradient descent algorithm, initial parameter coefficients which are perturbed from their true values by gaussian noise with a .01 standard deviation were able to be calibrated to within .00085 of the true value. In contrast, when values were perturbed with a standard deviation of 1, the Euclidean distance between the true coefficients and calibrated coefficients was only minimized to .31 on average. This suggests that it is important to incorporate expert knowledge about the disease into the initialization phase of model construction.
1. INTRODUCTION
Markov chain models are a potentially powerful tool for studying disease progression; however, existing methods for calibrating these models (i.e., estimating their parameters to agree with available data targets) primarily rely on generic parameter search techniques and simulations that ignore the mathematical structure of these models. Consequently, these methods are computationally expensive and have large running times. This in turn limits the complexity of the models that can be calibrated using these methods. See this survey [1] which explores 653 PubMed articles that model infectious diseases using simulation-based methods of calibration. The authors of the survey conclude that there is a need for more reliable and welldocumented algorithmic calibration methods. In [2], dependable probabilistic estimates for various COVID-19 propagation metrics in early-pandemic Germany are calculated after calibrating an epidemiological model
89 Ingenium 2023
Nathan Carney
Jourdain Lamperski
through the combined use of optimization and Bayesian techniques via invertible neural networks. To decrease computing time the authors of [3] address the large number of simulations which are required in Bayesian calibration – since one must construct estimates of entire posterior parameter distributions – by utilizing a neural network metamodel which mapped modelspecific parameters to target data. One issue that arose was that training a neural network so that it provides accurate enough mapping approximations requires extensive computation.
In this work we aim to develop a more principled and efficient method for calibrating these models. Specifically, we aim to leverage the mathematical structure of the models to formulate the calibration problem (with prevalence targets) as an unconstrained optimization problem, and then solve the formulation with gradient descent (together with a line search subroutine). From a computational standpoint, gradient descent is quite cheap to implement, so we expect that this will help us to calibrate more complex disease progression models.
2. METHODS
2.1 Calibration, Optimization Formulation, and Parameter Search
We consider DTMC models with two types of transitions (i.e., arcs in the transition diagram); which transition is ultimately a decision for the modeler. We use our method to calibrate a hypertension (high blood pressure) model; see Figure 1. The first type of transitions is calibration transitions. The hypertension model in Figure 1 contains one calibration transition that is denoted by the red arrow (Normal & Elevated to Hypertension). The transition probability for this transition at time t is a function of feature variables. For instance, we model the probability of transitioning from Severe Hypertension to Hypertensive Cardiovascular Death as a function of the patient’s body mass index along with how often they exercise. The parameters β of these functions need to be calibrated. Calibrating these parameters will ultimately enable us to understand the impact of these features on the transition. The second type of transitions are fixed transitions. The transition probabilities for fixed transitions are known (for example, from a literature review) and do not need to be calibrated. Notationally, we can interpret pij(t) as the probability of transitioning to state j, from state i, at time t while pi (t) is the marginal probability that a given patient is in state i at time t.
Figure 1.
in the diagram has a sigmoidal function which determines the probability that an individual transitions between states at a given point in time. These functions are dependent upon variables specific to the modeled phenomena (in this case Hypertension).

The calibration problem involves choosing coefficients β that minimize the mean squared error between the calibrated targets and actual targets. We formulate the calibration problem (with prevalence targets) as an unconstrained, non-convex optimization problem whose objective function is differentiable: f (β) = (1) without the minimization function where (1) is
and where P t (β) is the transition probability matrix at time t ; p (0) is the initial marginal distribution (when the use-case specific unit of time is defined as 0); p̂ i (t) is the prevalence target for node i at time t ; ei is the ith standard unit vector; lastly M denotes the set of all node time pairs that we have prevalence targets for.

In the language of DTMCs, prevalence targets are estimates of marginal probabilities. It can be shown that the marginal probability that a DTMC with coefficients β is in state i ∈ S at time (t = 1, 2) is equal to eiT P t (β)T · · · P1(β)Tp(0) . Thus, we can see from Formula 1 that the optimization problem involves minimizing the sum of squared error between the calibrated targets (or marginal probabilities) and actual targets (or marginal probabilities). Note computing the quantity eiT P t (β)T · · · P1(β)Tp(0) just requires matrix vector multiplication and no time-intensive simulations. Now to derive the gradient of the objective function, which will be needed in the calibration algorithm, the partial derivative of f (β) for each ij pair in the set of all calibration edges (Ac) and each k th coefficient in the function for the calibration arc a = ij. First, by applying the chain rule we see that:

90 Undergraduate Research at the Swanson School of Engineering
Transition diagram of the hypertension discretetime Markov chain model used for example in this work. Each arrow
induction and the product rule the above derivative may be represented as:
Then by induction and the product rule we observe that the latter derivative is equivalent to:


We see that the algorithm requires two inputs: an initial point β(0) and the number of iterations k. In Step 2, the gradient is computed at the current iterate β(k) . Next, in Steps 2-6 a line search procedure is performed. The choice of j = -10 in Step 3 was experimentally determined and warrants future inquiry. Finally, the algorithm updates the current iterates in Step 7 by moving in the opposite direction of the gradient. 500 iterations of gradient descent are performed to see the degree of convergence for each initial-ground coefficient pair.
Note that is the n x n matrix whose uv th entry . Lastly, observe from the quotient and chain rule that:
2.2 Data Processing
Here, N(i) denotes the out-neighbors of state I, and wijt is a given transition’s weight.

We consider solving the optimization problem with gradient descent (together with a line search procedure); see Algorithm 1 below. It is worthwhile to note that gradient descent can be interpreted as a parameter search method that moves to a set of nearby parameters in the direction that instantaneously decreases the objective the most (i.e., in the direction of the negative gradient). Consequently, it is a much better choice than a generic search method that does not leverage the structure of the problem.

We generate synthetic feature and target data to assess the recovery performance of the gradient descent algorithm. First, we randomly generate feature and target data from a standard multivariate normal distribution. Next, we randomly generate ground-truth coefficients that make sense from a medical standpoint. Finally, we compute synthetic targets with these groundtruth coefficients. For this blood pressure model, we calculate the marginal probability p(t) Hypertension for t = 1 , 2, …12 years. Our goal is to see if our algorithm can recover the ground-truth coefficients when we use these targets to calibrate the parameters.
We also generate five starting points that vary in distance from the ground-truth coefficients to assess the impact of this decision on recovery performance. The distance between these five starting points ( β(0) ’s) and the ground-truth coefficients will on average, over many iterations of the experiment, vary in magnitude. We achieve this by perturbing the ground-truth coefficients with gaussian noise under different standard deviation σ specifications, namely σ ∈ {0.01, 0.05, 0.1, 0.5, 1}. On average we would expect that starting points whose entries are generated from a distribution with a smaller standard deviation σ will tend to be closer to the ground-truth coefficients. Thus, we expect recovery performance to be poorer (take longer to converge or converge to a lesser degree of accuracy) for larger standard deviation specifications. Every running of Algorithm 1, with its 500 iterations of gradient descent (k = 500), was performed on a HP Envy x360 equipped with an AMD Ryzen 7 CPU with integrated graphics.
Algorithm 1: Note that the referenced equations are the same as those provided inline.

91 Ingenium 2023
3. RESULTS
We report the distance to ground-truth coefficients versus the number of iterations of gradient descent in Figure 2 below. Each of the five runs of the algorithm (pertaining to the five standard deviation values) were conducted one hundred times. The results of these 500 runs (not to be confused with the 500 gradient descent iterations per run) were then averaged to produce Figure 2. Each run of the algorithm took less than one minute to compute.
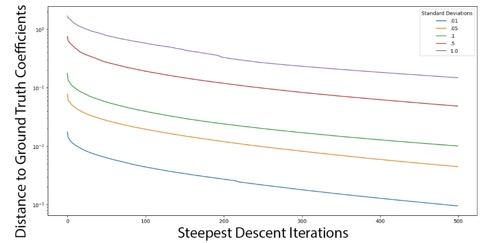
4. DISCUSSION
Figure 2. This graph is the result of one instance of the experiment described in section [2.2 Data Processing]. All other instances yielded near-identical results. In each graph, Euclidian distance between the calibrated coefficients and the ground-truth coefficients, plotted as a function of the number of Gradient Descent iterations for the five starting points corresponding to the different standard deviations (see legend). In essence, one can see the algorithm’s ability to negate varying degrees of perturbation which can be thought of as correcting the inaccuracies associated with original coefficient estimates in real world use-cases.
The algorithm is able to converge to the ground-truth coefficients. However, convergence requires more iterations and thus more time if the starting point is farther from the ground-truth (true) coefficients. Note that starting points that are farther away correspond to larger “Standard Deviations” within the legends in the four graphs that compose Figure 2. On average, after 500 iterations of our gradient descent algorithm, the coefficients that were perturbed by a value randomly generated from a gaussian distribution centered at 0 with a .01 standard deviation were able to be calibrated to within .00085 of the true beta coefficient values. In contrast, when initial values were perturbed from the true coefficients with a standard deviation of 1, the Euclidean distance between the true coefficients and algorithmically calibrated coefficients was only minimized to .31 on average.
Ultimately, we hope that this work will enable us to calibrate more complex disease progression models that will in turn enable us to study disease progression at a more granular level. To this goal, we have determined that choosing an initial point β (0) that is close to the ground-truth coefficients is important for two reasons. First, because the objective is non-convex, Algorithm 1 can converge to a local minimum if the starting point is not close enough to a global minimum. Second, even if Algorithm 1 converges to a global minimum, it may not be guaranteed that the global minimum equals the coefficients of interest, due to the fact that we have not established that the optimization problem has a unique optimal solution (i.e., it is not clear if the problem is identifiable). Accordingly, it is important to choose a starting point that is not just close to a global minimum, but that is close to the global minimum of interest. In practice, we can choose a good starting point by leveraging expert knowledge. Thus, this calibration method would be best employed in a meta-analysis of large swathes of data where prior conclusions on the degree to which certain factors play a role in a disease can be used to obtain high-quality initial parameter specifications. Moreover, the computational speed with which these experiments were performed on a personal laptop is indicative of the potential scalability of this method to larger data sets.
5. CONCLUSIONS
Markov chain models are well-defined to model disease progression. Yet the calibration of these models using large sets of data can be quite time intensive. So, in place of more traditional approaches, in this work we derive sigmoidal functions dependent upon the linear combination of disease-specific parameters which yield the transition probabilities between stages of the disease. Here we then leverage this structure to formulate the calibration problem as an optimization problem. We then solved the optimization problem with 500 iterations of a gradient descent algorithm. We observed that the algorithm recovers the groundtruth parameters for a hypertension model and does so in less than a minute; however, the accuracy with which the parameter coefficients are recovered is dependent upon the accuracy of their initial estimates. Thus, future work to improve convergence capabilities is needed. While unexplored in this work, it would be interesting to investigate how the number of calibration edges affects convergence.
6. ACKNOWLEDGEMENTS
Funding was provided by the Swanson School of Engineering and the Office of the Provost at the University of Pittsburgh.
92 Undergraduate Research at the Swanson School of Engineering
REFERENCES
1. C. Hazelbag, J. Dushoff, E. Dominic, Z. Mthombothi, W. Delva, “Calibration of individual-based models to epidemiological data: A systematic review,” PLOS Computational Biology, vol. 16, no. 5, p. 1-17, May 2020. [e1007893]. Available: https://doi.org/10.1371/ journal.pcbi.1007893.
2. Radev ST, Graw F, Chen S, Mutters NT, Eichel VM, et al, “OutbreakFlow: Model-based Bayesian inference of disease outbreak dynamics with invertible neural networks and its application to the COVID-19 pandemics in Germany,” PLOS Computational Biology, vol. 17, no. 10, October 2021. [e1009472]. Available: https://doi.org/10.1371/journal.pcbi.1009472.
3. H. Jalal, T. Trikalinos, F. Alarid-Escudero, “Streamlining Bayesian calibration with artificial neural network metamodeling,” Frontiers in Physiology, vol. 12, p. 1-12, 2021.
93 Ingenium 2023
A Spatial Clustering Algorithm for Community Detection in Social Networks
Andrew R. Polar1, Jourdain Lamperski1 , and Clarence Worrell1
1 Department of Industrial Engineering, University of Pittsburgh
Andrew Polar is a senior industrial engineering student from Pittsburgh, PA. His interests include data science, machine learning, and quantitative finance.
ABSTRACT
Dr. Lamperski joined the department of industrial engineering in the fall of 2020. He received a PhD from the MIT Operations Research Center in 2020 and a BS in mathematics from the University of Pittsburgh in 2015. His research interests include optimization, machine learning, and applications in healthcare.



Clarence is an Industrial Engineering PhD candidate at the University of Pittsburgh whose research focuses on algorithms and optimization for problems with spatial attributes. He is also a data scientist at the Software Engineering Institute of Carnegie Mellon University, working in the areas of cybersecurity, AI engineering, and software engineering.
Significance Statement
Existing algorithms for clustering location-based social networks only leverage the underlying network itself. This work develops an algorithm that leverages both the network itself and given locations of people in the network. It is observed that the performance of the algorithm typically matches the performance of an existing state-of-the-art algorithm, but it significantly outperforms the state-of-the-art algorithm on certain special instances.
Category: Computational Research
Keywords : location-based social networks, community detection, stochastic block model, spectral clustering
In this work we consider the problem of clustering location-based social networks into communities, a problem that arises in, for example, medicine (labeling patient data) and marketing (spatial customer segmentation). Existing work mainly considers using the network itself (and not the known locations of people in the network as well) to determine communities. In this study we develop an algorithm that uses both the network itself and the known locations of people in it. More specifically, we propose a clustering algorithm based on a novel generative model that we call the spatial stochastic block model; and we compare the performance of the algorithm with the performance of a state-of-the-art spectral-based algorithm through computational experiments with synthetic and real data. Interestingly, we observe that the performance of our algorithm typically matches the performance of the spectral-based method, even though the spectral-based method doesn’t utilize location information. However, for certain special types of graphs, we observe that our algorithm significantly outperforms the spectral-based method.
1. INTRODUCTION
A location-based social network is a network together with location information (typically in terms of longitude and latitude coordinates) for each person in the network. Herein we consider the problem of clustering location-based social networks into communities. Our motivation for studying the problem stems from its various applications, such as labeling patient data and spatial customer segmentation. Clustering networks is a fundamental problem in computer science and engineering. There are a number of existing algorithms for clustering networks, including spectral-based algorithms (which are mostly used in practice), message-passing algorithms, and optimization-based algorithms. We direct the reader to [1] for an overview of these different methods. These existing algorithms, however, are not designed for clustering location-based social networks; in particular, they only use the network itself (and not the locations of each individual member) to determine communities. A few studies (for example, [2]) consider developing algorithms that leverage information about the vertices of the network (e.g., locations of the people in location-based social networks) in addition to the network itself. Most of these works make two key assumptions. First, they assume that two vertices are (typically) in the same community if and only if they have similar vertex information. Second, they assume that the likelihood that there is an edge between two vertices is independent of the vertex information for these vertices. These assumptions, especially the former, often hold in a variety of applications, such as categorizing websites in a hyperlink graph. For example,
Ingenium 2023
Andrew Polar
Jourdain Lamperski
94
Clarence Worrell
people who associate with a specific political group would drive traffic to a website reflecting their beliefs. Similar people visiting this website can be assumed to be of the same political beliefs or therefore community, but not necessarily connected to each other. In this work, we are motivated by applications (see above) that satisfy the opposite assumptions, that is: (i) community assignments are not correlated with vertex attributes, and (ii) edges are more likely to exist between vertices of a community with similar attributes, and less likely to exist between communities of vertices with different attributes. In the social network application of interest, this captures the phenomena that (i) groups spread the underlying geographic region, and (ii) it is easier to infer whether two people who tend to check in at similar places are in the same group.
2. METHODS
2.1 The Spatial Stochastic Block Model
We propose the spatial stochastic block model to generate synthetic graphs that satisfy the two assumptions. The model generalizes the stochastic block model [1]. Specifically, we generate the adjacency matrix of the graph with the probabilities:

2.2 Data Sourcing
where (i) p, q, α ∈ [0, 1] are parameters of the model that satisfy p > q, q − α ≥ 0, and p + α ≤ 0, and (ii) d is a distance function that captures the distance between vertex attributes. We also propose a spatial clustering algorithm based on the model. The algorithm consists of three steps. (i) First it constructs k local vertex subsets V1…V k . (ii) Next it clusters each of the k local vertex subsets into local communities with a spectral clustering algorithm. (iii) Finally, it agglomerates the local communities into two global communities C1 and C 2 using vertex agglomeration then edge agglomeration. We test the spatial algorithm on simulated instances of the spatial stochastic block model, varying the p and q parameters between 0 and 1 to confirm cluster recovery. Figure 1 shows the algorithm performance while varying these parameters. As expected, the greater distance between p and q, the more likely the algorithm will correctly cluster the data.
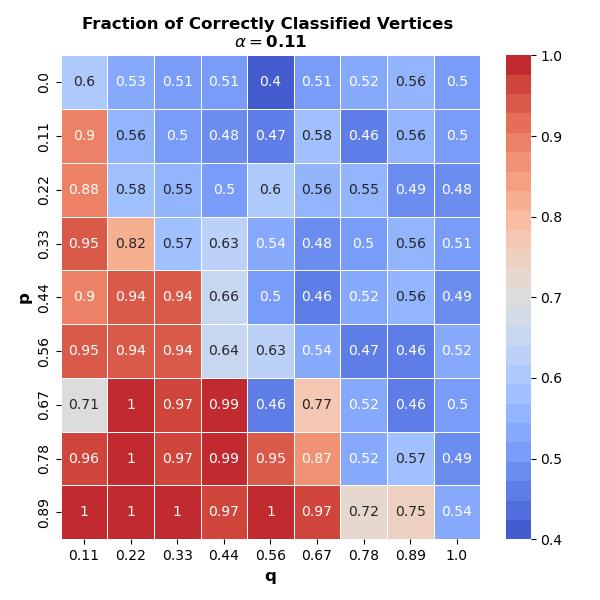
We studiedy a real social network called Brightkite, downloaded from the Stanford Network Analysis Project [3]. Brightkite is a subset of a larger social network called Gowalla that was active in the early 2000s, where users shared their locations by checking-in. We applied our spatial algorithm along with a standard spectral algorithm [4] to partition the network into two communities. Unlike our algorithm, the standard spectral algorithm does not consider vertex locations; it just creates a partition using the eigenvector associated with the second smallest eigenvalue of the adjacency matrix.
2.3 Data Processing
We selected connected graphs with 100 vertices for the 50 most populous cities in the United States. Next, a location (attribute) was assigned to each vertex using the mean check-in location per user. Our first vertexselection process incrementally expanded a geographic box until the desired number of vertices (100) were in the box. However, the resulting networks ended up being sparse, and we therefore revised our approach to use a depth first search, starting with a seed vertex. This approach traversed the graph based upon edges, and it generated graphs with sufficient edge density to study our partitioning algorithm. In addition to studying the 50 most populous cities, we used the breadth-first search to generate a large connected graph (4,580 vertices) that spanned the United States.
95 Ingenium 2023
Figure 1. Fraction of correctly classified vertices based on varying p and q parameters.
3. RESULTS
Partitions generated by the spatial algorithm closely mimicked those of the spectral algorithm. Partition consistency was 90-100% for 45 of the 50 cities studied. Figure 2 depicts the partition consistency across all 50 cities. The nationwide partition depicted in Figure 3 exhibited a similar consistency between the spatial and spectral algorithms. The green circles in this image represent the local communities chosen by the algorithm before agglomeration.
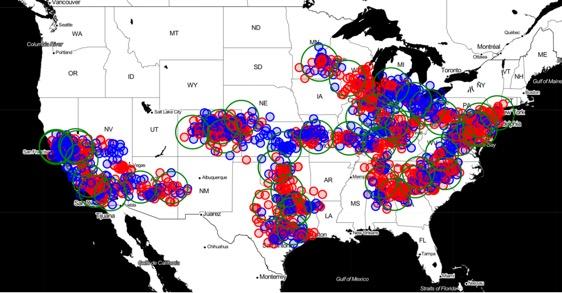
4. DISCUSSION
This work demonstrated the potential for our spatial algorithm, along with its implementation in Python, to reliably partition graphs by leveraging vertex attributes such as location. Our next line of investigation is to identify the conditions in which the spatial algorithm outperforms the spectral algorithm. Conceptually, this should occur in graphs that exhibit a “dumbbell” shape, such as the one depicted in Figure 4.
The graph in Figure 4 consists of two geographic areas (North and South Park). Vertices are well-connected within the two areas, but weakly connected between the areas. In this extreme instance, we expect the spectral algorithm to partition the graph such that each geographic area is assigned to its own community. However, in real social networks, the “class” of vertices (e.g., democrat / republican, male / female, or hiker / biker) do not split along geographic lines. Our algorithm leverages this fact by partitioning each geographic region individually, and then agglomerating the resulting communities, generating a more realistic partition.
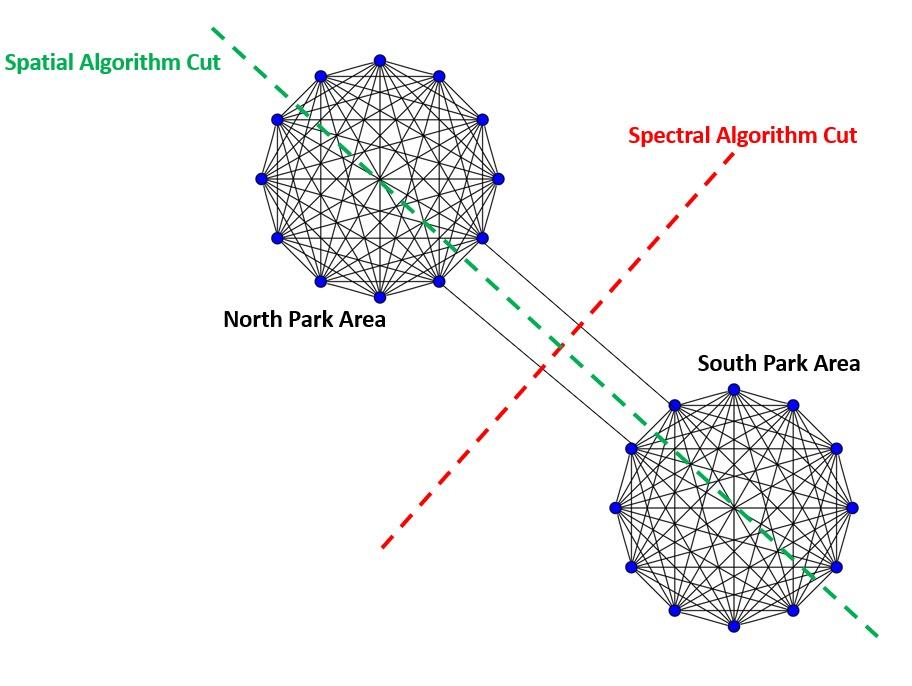
5. CONCLUSIONS
The spatial and spectral algorithm performed similarly across 90-100% of the test instances. Given that our algorithm leverages spectral clustering as a part of it, some similarity was expected. However, the extraordinarily high consistency in partitions was rather surprising considering that the spectral algorithm does not leverage any data about vertices. With that being said, the spatial algorithm outperforms the spectral algorithm on graphs that have similar structure to that of Figure 4.
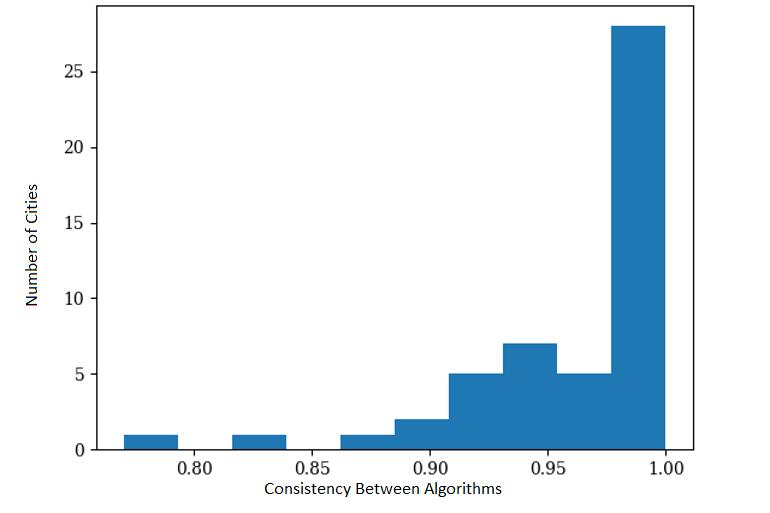
96 Undergraduate Research at the Swanson School of Engineering
Figure 2. Percent consistency between the spatial and spectral algorithms, applied to social network data from the 50 most populous cities in the United States.
Figure 3: Nationwide partition generated by our spatial algorithm with red and blue each representing a community.
Figure 4. Conceptual illustration of a graph in which the spatial algorithm would outperform the spectral algorithm.
6. ACKNOWLEDGEMENTS
Funding was provided by the Swanson School of Engineering and the Office of the Provost at the University of Pittsburgh.
REFERENCES
[1] E. Abbe, “Community Detection and Stochastic Block Models: Recent Developments,” Journal of Machine Learning Research, vol 18, April 2018, Available: https://www.jmlr.org/papers/ volume18/16-480/16-480.pdf.
[2] Y. Deshpande, A. Montanari, E. Mossel, and S. Sen, “Contextual Stochastic Block Models,” Advances in Neural Information Processing Systems, vol 31, 2018, Available: https://proceedings.neurips.cc/ paper/2018/file/08fc80de8121419136e443a7048 9c123-Paper.pdf.
[3] J. Leskovec and R. Sosic, “SNAP: A General-Purpose Network Analysis and Graph-Mining Library”, ACM Transactions on Intelligent Systems and Technology, vol 8, July 2017, Available: https://dl.acm.org/ doi/10.1145/2898361.
[4] J. Lei and A. Rinaldo, “Consistency of Spectral Clustering in Stochastic Block Models,” Ann. Statist., vol 43, p. 215-237, February 2015, Available: https:// doi.org/10.1214/14-AOS1274
97 Ingenium 2023
Structural Drivers of Polarization in Social Networks
Zhaohan Xing1, and M. Amin Rahimian1
1Sociotechnical Systems Research Lab, Department of Industrial Engineering, University of Pittsburgh
Zhaohan Xing is a research associate in the Sociotechnical Systems Research Lab at the University of Pittsburgh. His research interests are social network analysis, misinformation and polarization. He plans to continue his research in graduate school.
Dr. Amin Rahimian is an assistant professor in the Industrial Engineering Department. He is the principal investigator of the Sociotechnical Systems Research Lab. Broadly speaking his research interests are at the intersection of networks, data, and decision sciences.

Significance Statement
This research aims to analyze the effect of network centralization and the influential power of elites on belief polarization in social networks. Users on social media have suffered from consequences of mis-, dis- and mal-information that have compromised the information integrity of cyberspace in recent years. Our results provide new thinking into design of feeds and allocation of cybersecurity resources within and between online communities.
Category: Computational Research
Keywords : Echo Chamber, Filter bubble, Polarization, Social Networks
ABSTRACT
The spread of misinformation on the web is a serious problem in the information age, which can lead to violence, fraud, and extremism. This study aims to identify the polarization due to the echo chamber and the filter bubbles caused by the platform’s recommendation system. We study the effect of the structure of social networks and the influence of elites in social networks on polarization. We find that a structure with a moderately influential elite is more conducive to reducing the occurrence of polarization in users’ opinions. By simulating the echo chamber model on a social network, we also find that opinion polarization on social networks is small at first, but increases steeply after the number of exchanges exceeds a certain threshold. Our results can inform interventions such as mediating the influential power of elites to control the echo chamber effects and mitigate the excessive, affective polarization in social networks.
1. INTRODUCTION
In recent years, the widespread usage of online social platforms has enriched our lives and enabled people more paths to information. Unfortunately, due to the algorithms of the recommendation systems of social platforms, the phenomenon called “filter bubble” causes users to be exposed to information that is mostly aligned with or echoes their existing prejudices [1]. As biased opinions spread, they are far more influential than they could ever be on their own, because the recommendation systems tend to push similar ideas to user feeds. In addition, users have their own social circles, where they echo each other’s opinions, e.g., people who share or like each other’s toots and tweets, and can lead to excessive, affective polarization within echo chambers [2]. It is true that polarization is not always detrimental, the social platforms, however, contain a lot of misinformation that disguises the truth, deceives the users, and creates rumors [3]. The misinformation that spreads online will cause misunderstanding and discrimination, disrupt democracies, and move societies away from the wisdom of crowds and towards the madness of mobs [4]. One can see a large number of fake news reporting the scandals (causing affective polarization), mismatches between pictures and passages (causing cultural misunderstanding), and deliberately smearing a group of people (causing discrimination). Consequently, researchers are focusing on methods to find out abnormal user behavior on platforms, such as bots sending misinformation on the platform, or malign influence campaigns creating polarized news on the i nternet, to avoid the harmful polarization caused by misinformation. In addition, the transformations and changes in people’s opinions are studied to find out whether and to what extent polarization will occur, and how much time it takes to spread [5]. Other studies show that as echo chambers emerge, they
Ingenium 2023
Zhaohan Xing
98
M. Amin Rahimian
cause social networks to become more politically polarized, and the contents that are recommended to the users of these platforms are quite similar, which may deteriorate democratic discourse, while factors such as user homophily (Social Network Structure) may further exacerbate political polarization [6,7]. On the other hand, elites can improve the online discourse by providing apprehension of party ideologies on social media for political engagement [8].
In this paper, we study the effect of network centralization and the influential power of elites on opinion polarization in social networks. By studying these factors, we can provide new thoughts on policies (such as how to allocate safeguards) and interventions (such as recommendations of whom to follow).
2. METHODS
2.1 Network Structure and Representation
In the echo chamber model of Sasahara et. al [9], users of social platforms are represented by nodes in a network that serves as the platform, and the following/followed relationships between users are represented by edges with directions. We create two different groups of nodes that represent two communities which have different ideas against a common issue (e.g., abortion, taxes, or voter rights). Their ideas are stored as “opinion” values, which means the opinion is positive for one group, and negative for the other; here, the value of opinions is between -1 and 1, generated by random sampling. Then, we simulate an opinion dynamics model to evaluate the degree of polarization by varying two factors which are social network centralization and the influential power of the elites [9, 10].
To evaluate the effect of network centralization, we build two different models. We refer to the first model as the “Social Elites Model (SEM),” which means there are elites within each community who have the strongest influence on their respective communities, possibly reaching all or most other agents in their community, depending on their influential power. The second one is the so-called “Stochastic Block Model (SBM),” which is a random model of connections within and between communities without centralization (unlike SEM, in which all the users are connected to the elites who have the most similar opinion to them). In this model, the probability that two agents within a community are connected to is P within , and the probability that two agents between two different communities are connected is Pbetween < P within [11]. In SEM, we denote k as the influential power of the elites, where 0 < k < 1, and vary it at two levels (k =0.5 and k =1) while controlling any irrelevant factors (e.g., the expected number of edges within and between groups, the number of agents in both groups and the number of messages recommended by the system). The elites are connected to all the other agents of
the group if k =1, and are not connected to any other agents if k =0. The middle point, k =0.5, means that the probability of the elites being connected to other agents in their groups is 0.5.
2.2 Opinion Dynamics
The model aims to analyze the changes in the degree of polarization over time as the recommendation system pushes similar contents continuously. We study the opinion dynamics based on the echo-chamber model of Sasahara et. al [9]. For user i, his or her opinion is updated by:
where μ is the influence of messages from other people, l is the number of messages that are displayed on user i ’s feed, and I ∈ is the indicator function for the concordance of the opinions based on threshold ∈ : if the difference between the user i ’s opinion and the displayed messages is greater than the threshold, then the message is not concordant and does not influence the user i ’s opinion: I ∈ (oi (t ), mj )=0 – e.g., because i does not believe it. We simulate 100,000 iterations and analyze the degree of polarization. There are 100 agents, 50 of them are people with positive opinions and the other 50 are with negative opinions. To control the irrelevant factors, the expected numbers of edges between and within groups are kept fixed and consistent with SBM with P within =0.5 and Pbetween =0.05.
2.3 Quantifying Polarization
To quantify the degree of polarization ( β ) with users’ opinions ( z), we use the method of Musco et al., who propose to use skewness ( γ ) and kurtosis (κ ) of opinions to calculate the degree of polarization ( β ) as follows [12]:


2.4 Software Used for Simulation
In this study, we use Python for simulations and data generation/processing (supported by Pitt CRC), as well as R and Gephi for analysis and visualizations.
3. RESULTS
3.1 Visualizing Opinion Polarization
We use the code provided by Sasahara et al. [9]1 to generate the network connection data and use Gephi to visualize the structure. From Figure 1, we find a sharp increase in the degree of polarization over time. Figure 1A shows that the state in the beginning, t = 0, is not very polarized, while Figure 1B shows that after t =100,000 iterations of the opinion dynamics, the degree of polarization is obviously increased.
99 Ingenium 2023
Figure 1. The distribution of opinions in SBM model. The numbers on the nodes correspond to user ID. (A) Initial distribution of the opinions, red represents the positive opinion and blue represents the negative ones. The nodes in purple hold a more neutral opinion. The figure shows that in the beginning, the degree of polarization is not severe. (B) After 100,000 iterations of the opinion dynamics, the degree of polarization increases dramatically.
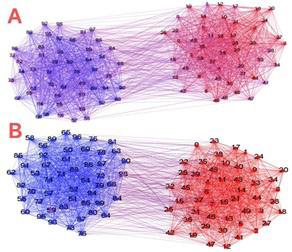
3.2 Centralization
In Figure 2B, we compute the polarization degree 100 times based on 100 samples of SEM (k =1) and SBM over time. We find that the degree of polarization does not increase a lot in the beginning and as the number of interactions increases to 100-500, there is a sudden jump in polarization. Moreover, SEM has a lower polarization degree at the end. We quantify the latter using stochastic dominance2 in Figure 3.
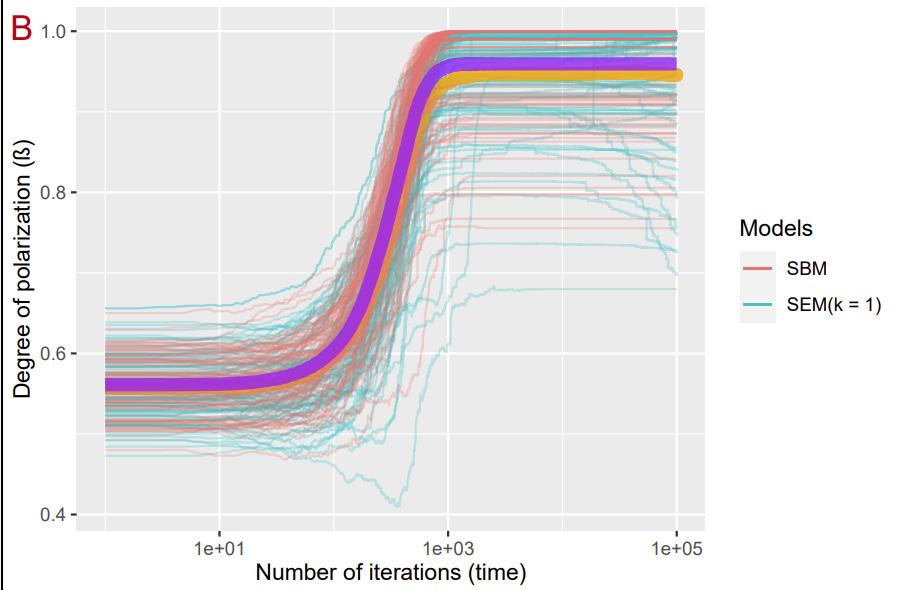
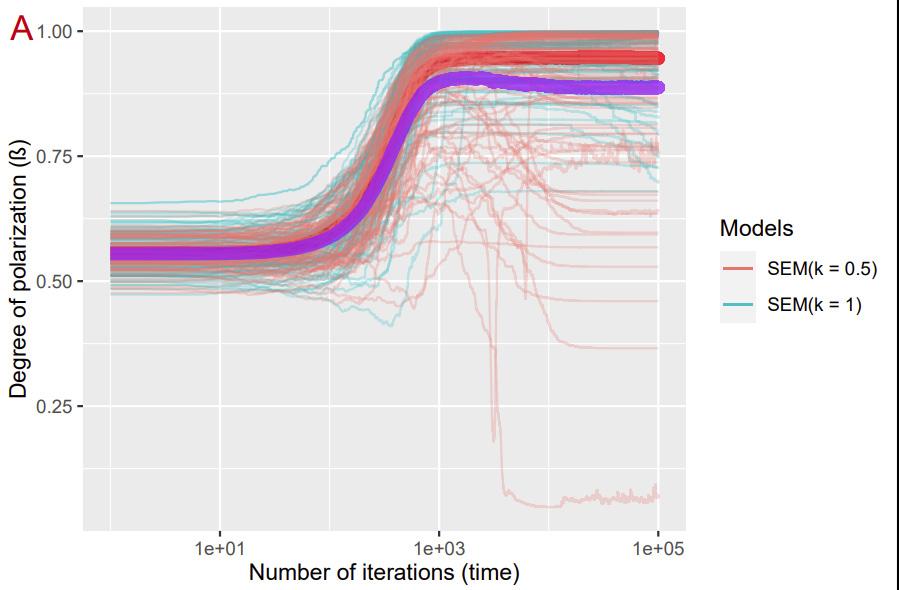
3.3 Influential Power of Elites
Our results in Section 3.2 indicate that opinion dynamics over SEM could be less polarizing. Similarly, by computing the polarization degree using the same steps as mentioned in Section 3.2, we find out that polarization under SEM (k=0.5) is smaller compared to SEM (k=1). By comparing both cases and SBM, we reach the conclusion that SEM is preferable when attempting to control polarization, and the influential power of the elites should be moderate, neither too strong nor too weak. In Figure 3, we generate the Empirical Cumulative Distribution Functions (ECDF) for all three cases. Here, the x axis represents degree of polarization (β) at time step t= 100,000 , and the y axis represents the cumulative proportion of samples for which the degree of polarization is less than the corresponding x value. Figure 3 shows that polarization under SEM (k=0.5) is stochastically dominated (is the least).
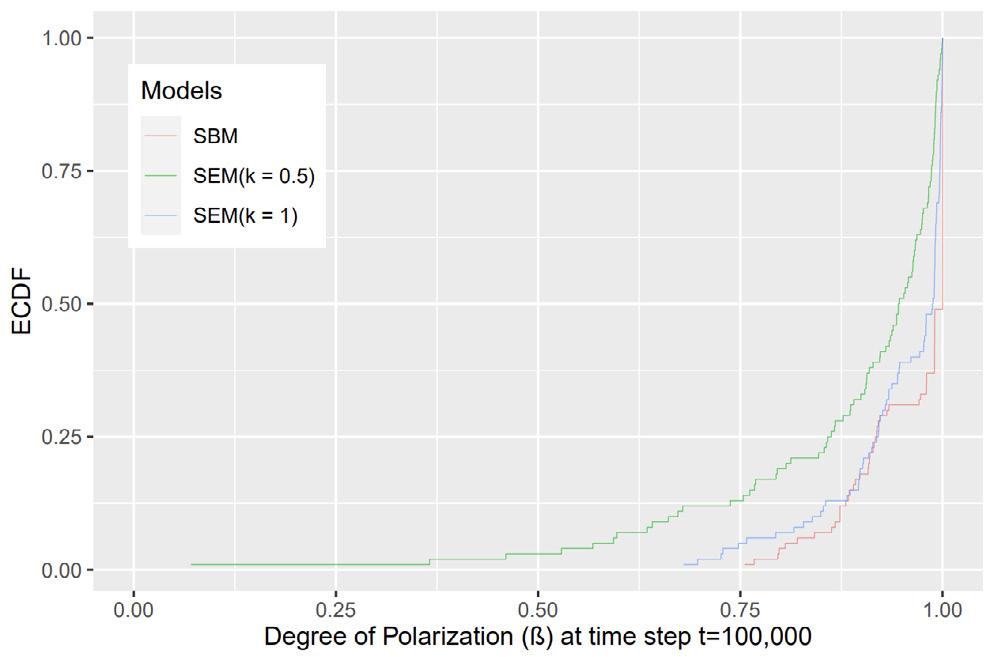
Figure 2.
The dynamics of the degree of polarization generated by SEM (k =1 and k =0.5). We observe a potential decrease of polarization degree in the end when k =0.5. The bold curve in purple represents the average degree of polarization under the condition k =0.5 and the red one represents the condition k =1. (B) The temporal dynamics of the degree of polarization generated by SEM (k =1) and SBM. The purple bold curve represents the average degree of polarization under SBM model and the orange one represents the average degree of polarization under SEM model. The x axis is in logarithmic scale. Note the sharp sudden increase in polarization over time.
= 0.5) < s β(SEMk = 1)< s β(SBM)
100 Undergraduate Research at the Swanson School of Engineering
(A)
Figure 3. The ECDF plot at time step 100,000. The plot shows a stochastic dominance relationship. The polarization under SEM (k = 0.5) is “stochastically” smaller than SEM (k = 1), which is stochastically smaller than SBM: β(SEMk
4. DISCUSSION
From the simulation results, we observe that the degree of polarization does not increase a lot in the beginning, while it increases sharply after 100 to 500 iterations. It indicates that in the beginning, the dissemination of similar contents and the exchange of people’s opinions do not lead to a great degree of polarization. It implies that the social platforms and the cybersecurity systems can take advantage of the initial slow phase before the sharp increase for their interventions. In addition, we find that the Social Elites Model is preferable to SBM if we want to limit the polarization, and a moderate influential power is better for controlling the polarization. That is to say, it is better if there are elites who spread true information, while their influential power should not be extreme to avoid the consequence that every agent in both groups will only trust the elites’ ideas but disregard anything else including ideas from the opposing group.
5. CONCLUSION
In this study, we analyze the degree of polarization based on different network structures and conclude that cybersecurity systems can be most effective if they respond to false and polarizing contents fast before the sharp increase in opinion polarization. In addition, we find out that the Social Elites Model is better for mitigating polarization compared with the Stochastic Block Model, and the influential power also plays an important role. We reach the conclusion that the best structure for mitigating polarization is the Social Elites Model with a moderate influential power. Future work can address the number of elites that is the best for mitigating polarization and the optimal influential power for limiting polarization.
6. CODE AND DATA AVAILABILITY
At https://github.com/aminrahimian/social-mediaelites.
7. ACKNOWLEDGEMENTS
We acknowledge the computing hardware, software, and research consulting provided through the Pitt Center for Research Computing (Pitt CRC). Rahimian acknowledges support from a Pitt Cyber Accelerator Grant on Modeling Threats to Sustainability of Social Networks as Critical Infrastructure.
REFERENCES
[1] Pariser, E. (2011). The filter bubble: What the Internet is hiding from you. penguin UK.
[2] Matteo Cinelli, Gianmarco De Francisci Morales, Alessandro Galeazzi, Walter Quattrociocchi, and Michele Starnini. The echo chamber effect on social media. Proceedings of the National Academy of Sciences, vol. 118, no. 9, pp. e2023301118, 2021.
[3] H. Allcott, M. Gentzkow, and C. Yu, “Trends in the diffusion of misinformation on social media,” Research & Politics, vol. 6, no. 2, p. 205316801984855, 2019.
[4] C. K. Tokita, A. M. Guess, and C. E. Tarnita, “Polarized information ecosystems can reorganize social networks via information cascades,” Proceedings of the National Academy of Sciences, vol. 118, no. 50, 2021.
[5] S. Du and S. Gregory, “The Echo Chamber effect in Twitter: Does community polarization increase?” Complex Networks & Their Applications V, pp. 373–378, 2016.
[6] K. Garimella, G. De Francisci Morales, A. Gionis, and M. Mathioudakis, “Political discourse on social media,” Proceedings of the 2018 World Wide Web Conference on World Wide Web - WWW ‘18 , 2018.
[7] K. Garimella, “Polarization on social media,” Aaltodoc, 07-Feb-2018. [Online]. Available: https:// aaltodoc.aalto.fi/handle/123456789/29708.
[8] K. Grön and M. Nelimarkka, “Party politics, values and the design of Social Media Services,” Proceedings of the ACM on Human-Computer Interaction, vol. 4, no. CSCW2, pp. 1–29, 2020.
[9] K. Sasahara, W. Chen, H. Peng, G. L. Ciampaglia, A. Flammini, and F. Menczer, “Social influence and unfollowing accelerate the emergence of Echo Chambers,” Journal of Computational Social Science, vol. 4, no. 1, pp. 381–402, 2020.
[10] Unchitta Kan, Michelle Feng, Mason A. Porter. “An Adaptive Bounded-Confidence Model of Opinion Dynamics on Networks.” arXiv:2112.05856 [physics. soc-ph], 2021.
[11] B. Karrer and M. E. Newman, “Stochastic blockmodels and community structure in networks,” Physical Review E, vol. 83, no. 1, 2011.
[12] Christopher Musco, Indu Ramesh, Johan Ugander, R. Teal Witter. “How to Quantify Polarization in Models of Opinion Dynamics.” arXiv:2110.11981 [cs. SI], 2021.
101 Ingenium 2023
Toward Using an Equilibrium System Theory to Describe Non-equilibrium Systems
Tianyi Bi1, and Lei Fang 2
1 Department of Mechanical Engineering and Materials Science, University of Pittsburgh
2 Department of Civil and Environmental Engineering, University of Pittsburgh
Tianyi is an undergraduate student in Mechanical Engineering at the University of Pittsburgh. She is currently working on socially distanced crowd simulation.

ABSTRACT
Lei Fang is an Assistant Professor in Civil and Environmental Engineering at the University of Pittsburgh. His research focuses on turbulence dynamics and transport and mixing problems with particular emphasis on topics relevant to biology, environment, and health.

Significance Statement
This research mainly aimed to describe the motions of non-equilibrium particles by the 2D Ideal gas law. At the end of this paper, the jammed non-equilibrium system has been proven to be valid for this law. The finding could lead to a framework to make it possible to predict the more generalized non-equilibrium systems.
Category: Methods
Keywords : Jammed non-equilibrium system, collision time scale, relaxation time scale, MaxwellBoltzmann law, 2D Ideal gas law
Non-equilibrium motion can be various in different environments. By simulating highly disordered motions and interactions among a collect of particles particularly in the jammed door-exiting case on computer, the probability distribution of their velocities for each step is found to be precisely reflecting the trend of the Maxwell-Boltzmann distribution. This observation strengthened the feasibility of the hypothesis of using the 2D Ideal gas law to describe the non-equilibrium system. In this paper, the process of how to derive to the final equation of the 2D ideal gas law is elaborated by comparing the properties of ideal gases to the kinetics of the particles. This result is useful because it initiates a new method to project difficult-to-analyze systems onto a much easier-tointerpret pattern at least in the jammed door-exiting case. One of the most significant real-life applications of this research is to predict how humans would react in panic which would be an essential tool to re-organize highly disordered human crowded in an infinitesimal period as possible. A further step is to develop this conceptually new strategy to more general situations.
1. INTRODUCTION
Active matter systems comprise many highly energized agents that interacting and moving depends on various environments. Such interactions produce collective motion giving rise to states of matter in non-equilibrium systems. The vast complexity of such interactions has grown to become the biggest obstacle preventing humans from explaining and predicting its systems. Scientists have developed sophisticated mechanisms and theories for controlling the equilibrium systems, yet in the real world most of the systems are in non-equilibrium state. One of the most common non-equilibrium systems in the real world is the pedestrian traffic, especially the jamming during escape panic. Huge fatalities could be avoided if there exists a framework to depict their interactions. Therefore, the big picture of this paper is to see whether there exists a regime in parameter space where the theory for equilibrium system can apply to non-equilibrium system. This subject is improved by one of the research papers published by Dirk Helbing in the 1990s, which relates to pedestrian specific gas kinetic model and fluid-dynamic traffic model. This is the first idea of using the microscopic modeling concept to simulate in macroscopic field. In the following sections, the process of interpreting the motions of the jammed non-equilibrium system in door-exiting cases by the 2D Ideal gas law will be shown.
Ingenium 2023
Tianyi Bi
102
Lei Fang
2. METHODS
The motions of random particles in the door-exiting case can be described as if they are subject to several forces [1]: First, a force describing the acceleration towards the desired velocity. Second, the forces on each particle exerted by the border and other particles compel each particle maintaining a certain distance from its surroundings. Last, the randomly fluctuating force for each particle making their motions becomes unpredictable. For simulating door exiting cases on computer, 200 particles are put into the left-most side of a 20 x 20m square boundary with only a 0.92m wide door opened on the right side allowing particles to go out (Fig. 1). Each simulation has a total of 4000 advection steps. The reason for recording such a lengthy period of the advection steps is to accommodate for the abundant data requirements of velocity vectors which will create a continuous curve. The model is programmed to automatically replenish the particles so that there are always 200 particles in this space. The purpose of replenishment is to guarantee that the number of particles is constant and continuous throughout the entire running process since the particle would be squeezed out of boundary rapidly due to the pressure coming from other particles. The velocity vectors of each step for each particle in x and y directions are stored automatically while the particles are moving towards and out of the door. When particles are away from the wall, there exists two time scales [2]. One is the collision time scale τcollision , which the system is randomized during this scale. The collision time is the mean free path(2 r 0 ρ) -1 divided by v 0
3. RESULTS
The 2D speed distribution for particles (Fig. 3) is plotted out and it is found it was well fitted by the 2D MaxwellBoltzmann distribution [3] which is characterized by the PDF function (Eq. 3).
As long as the jammed door-exiting particles are approved to exhibit equilibrium characteristics, the 2D Ideal gas law is allowed to be extended to perform the framework of particles in energy and momentum relation and in the jammed door-exiting situation. Therefore, the following contents are going to perform the process of getting to the equation of ideal gas law by derivation in 2D stemmed from the simulation data step by step.
First, the velocity vectors are randomly oriented and point in θ range (0° ≤ θ ≤ 180°)(Fig. 4), which could lead to a ratio that . Let n ≡ρ, which is simply because of the original PV=NRT notation conversion.
Then, the equation that describes the number of particles in angle θ and unit area A with velocity v ∈ (v,v +Δ v ) is defined to be:


Where r 0 is the radius of each particle, v 0 is the desired velocity, and ρ is the local density.
This equation of the collision time scale is derived by first considering the area of a particle scanned during time t which is 2 r 0 v 0 t (Fig. 2). Then, the number of particles encountered by a single particle during time t is expressed as 2 r 0 v 0 tρ. Therefore, the mean free path is gotten which is:
At dt, particle travelling at angle θ to the normal of the wall wiped out an area. Eq. 4 below represents the magnitude of the area which is actually rectangular that has a length of L and a width of vdt cos θ. (Fig. 5 shows the schematic diagram.)
Then, combining equations (3) and (4) together and dividing them by Ldt , which led to the equation that represents the number of particles hitting unit length of wall in unit time which have speed between v & v +Δ v and angle between θ & θ +Δ θ.
The other one is the relaxation time scale τ, which is the time required for the system to get back to coherent.
103 Ingenium 2023
Since each particle contributed to momentum which is 2mv cos θ (elastic collision), the pressure is determined in Eq. 6 by double integrating with respect to θ and v, which is
current values to the experimental data. If the methods outlined here prove to be broadly predictive in describing disordered motion, then they will become a valuable new strategy to enhance safety at high-density crowds.
5. CONCLUSIONS
The above equation can be simplified to become Eq. 6 by assuming m =1
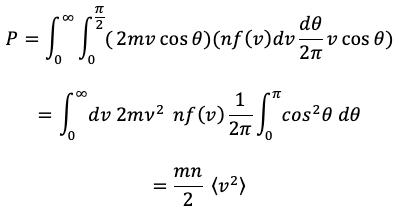
Where
Next, the final equation in the 2D Ideal gas law frame is determined by multiplying Eq. 6 with area of the entire domain A:


It has been shown that the non-equilibrium motion in the jammed door-exiting case can be described by the 2D Ideal gas law. Computer simulations of the moving particles in a square boundary demonstrated that the motion of this system can behave like in equilibrium status when the particles’ random collision time scales are substantially smaller than their self-propulsion time scale. By identifying a quantitative framework for measuring its existence, the authors are now in the position of testing its real-world applicability. However, the movement of the non-equilibrium crowd will probably be more intense and unpredictable in reality than the one the authors have simulated on the computer. This potential weakness will require more unexpected adjustment in the future.
6. ACKNOWLEDGEMENTS
Funding was provided by the Swanson School of Engineering and the Office of the Provost at the University of Pittsburgh.
Which corresponds to the variable R in ideal gas law. As long as it is a constant as R, the equation above will fit perfectly in the same structure as the ideal gas law. Overall, a jammed non-equilibrium system exhibits equilibrium characteristics and could be described by 2D ideal gas law in equilibrium state when τcollision ≪ τ, which indicates the condition of when the statistical motion of the system is dominated by random collision. This is supported by running a total of 1600 cases under different values of r 0 and τ and calculating the mean error for velocity vectors of each run and plot them onto a colormap (Fig. 6). The region above the separating line are eligible parameters that follow the ideal gas law.
4. DISCUSSION
The final equation (Eq. 8) obtained is an ideal starting point for the prediction of non-equilibrium activities, making the jammed door-exiting a unique system for consistently and reliably studying non-equilibrium motion. The authors currently are committed to quantitively acquire the magnitudes of k in order to prove that is eligible to be estimated as a constant which matches the role R plays in ideal gas law. The next step is to further enhance the understanding of the active matter system and therefore enlarge the application to more types of non-equilibrium motions. However, since this project is simply examined based on the data gathered by simulations on computer, it also needs to be further proved by comparing the
REFERENCES
[1] Helbing, Dirk; Molnar, Peter, “Social force model for pedestrian dynamics,” Physical Review E, vol. 51, pp. 4283-4284, May 1995.
[2] Arianna Bottinelli; Jesse L. Silverberg, “How to: Using Mode Analysis to Quantify, Analyze, and Interpret the Mechanisms of High-Density Sollective Motion,” Frontiers in Applied Mathematics and Statistics, vol. 3, pp. 1-5, 21 December 2017.
[3] J. L. e. a. Silverberg, “Collective motion of humans in mosh and circle pits at heavy metal concerts,” Physical review letters,110, no. 228701, pp. 1-2, 31 May 2013.
104 Undergraduate Research at the Swanson School of Engineering
a particle travelling at angle θ and to a distance of L to the normal of the wall wiped out an area (shaded) during time dt. The particle starts from the lower position (denoted by a circle in solid line) and after a unit time it reaches the upper position (represented by the circle in dashed line).
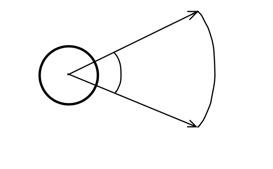

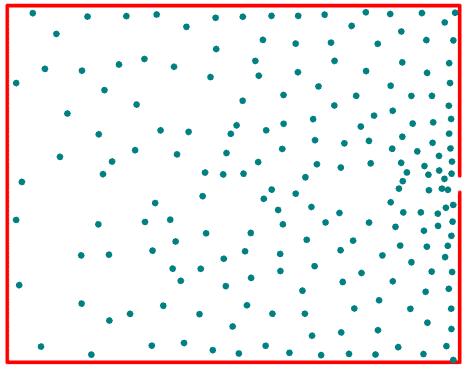

Figure
how the mean error of velocity vectors distributed. It illustrates the magnitude of mean error in log space by gradient colors. The separating line (red line) is r 0 ~0.1τ (-1)

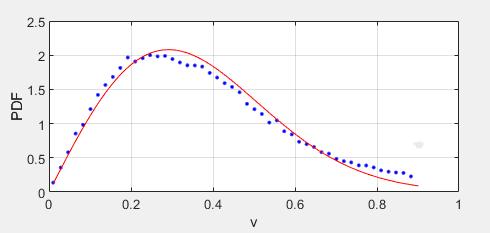
105 Ingenium 2023
Figure 1. The screenshot of the model simulated on computer. This figure records about the halfway point of the model processing, where all the 200 particles are moving towards the narrow door opened on the right side of the wall and will gradually being jammed.
Figure 3. The graph of the PDF. Those solid blue circles are the velocity magnitude for each particle, and the red line represents the best fit to a 2D Maxwell-Boltzmann distribution.
Figure 2. The schematic diagram described the area (shaded) of a particle scanned during time t. Assume this particle in a radius of r 0 starts moving from the left side and travels towards the right side.
Figure 4. randomly oriented in angle . And the curve hovered by the particle is denoted as S
6. The colormap shows
θ θ r S L
Figure 5. The schematic diagram shows
Analysis of Vortex-generating Fences on a Formula Student Multi-element Rear Wing
Dane A. Sabo1, and Matthew M. Barry 1
1 Department of Mechanical Engineering and Materials Science, University of Pittsburgh
Dane Sabo is an undergraduate student in the Mechanical Engineering department, where he was the technical director of the school’s Formula Student team and a teaching assistant. He plans to pursue an advanced degree and research at the intersection of machine learning and wearable robotics.

Matt Barry is an assistant professor in the Mechanical Engineering department at the University of Pittsburgh. His research focuses on thermoelectrics and engineering education. Matt teaches several introductory engineering classes at the University of Pittsburgh.

Significance Statement
This paper experiments with vortex generation in Formula Student as a means of boundary layer energization and separation prevention. Formula Student conditions are unique; airspeeds are much lower than previous vortex generation research has examined. Vortex generation at these conditions were found ineffective in the test case but show potential.
Category: Computational Research
Keywords : Vortex generation fences, Formula Student, boundary layer separation, ANSYS Fluent
ABSTRACT
Vortex generating devices are prevalent in high end motorsport such as Formula 1 and modern automobiles. These devices help to reenergize boundary layers on aerodynamic surfaces to help prevent separation. The characteristic of separation prevention makes vortex generators enticing for use in the experimental and brave world of Formula Student—the ability to prevent separation would allow Formula Student teams to design for more extreme angles of attack and therefore greater amounts of downforce. Current established uses of vortex generators, however, are effective at drastically faster airspeeds than are typical in a Formula Student event. In this paper, a vortex generating device configuration is examined in ANSYS Fluent for its potential use as a separation-prevention agent on the University of Pittsburgh’s Formula Student rear wing. This vortex generator system was evaluated at several different airspeeds and yaw angles to determine its sensitivity and efficacy as a performance enhancing element. While the configuration studied demonstrated a creation of a weak vortex structure, no significant increase in downforce was observed.
1. INTRODUCTION
Formula Student (FSAE) aerodynamics are a unique case where traditional approaches to wing and element design do not always apply. FSAE racecars must generate the maximum amount of downforce in extremely low speed aerodynamic conditions and at high angles of yaw while maintaining a reasonable weight and manageable buildability. An example
Formula Student car is displayed in Figure 1. The aerodynamic devices of these cars lend themselves to inventive designs due to their restrictive size

Ingenium 2023
Dane A. Sabo
106
Matthew M. Barry
Figure 1. The author driving University of Pittsburgh Panther Racing’s 2022 Formula Student Car, PR-034, during competition at Michigan International Speedway. The rear wing examined is present behind the driver’s head labeled with the number 82.
and position requirements. The car pictured fills the bounding boxes provided in the 2022 FSAE ruleset. The rear wing examined is difficult to change in dimension due to these rules. Consequently, performance enhancing devices such as vortex generators are highly lucrative.
Vortex generating fences are familiar to motorsport and performance cars. Koike et al. examined the use of vortex generating fences on the roof of a sedan to reduce drag and separation on the rear end of a car [1]. Koike et al. also examined their experimental configuration in CFD and found that the vortex phenomena displayed in a wind tunnel test could be replicated in a simulation accurately. These fences introduced a streamwise vortex which visibly kept the flow attached to the sedan compared to a configuration without fences. This technology was later manufactured on the ninth generation of the Mitsubishi Lancer Evolution.
Vortex generating fences, (VGs), have also been found to be able to increase the maximum available downforce of a given wing section [2]. In the work provided by Kuya et al., large-scale counterrotating triangular VGs were able to improve the maximum downforce as much as 10%, however were studied on wing surfaces in close ground effect.
Work by Storms and Ross studied the use of vortex generators on a two-element airfoil in freestream. The addition of vortex generators did increase the performance of the wing and flap experiment but were examined in combination with an additional gurney flap [3].

Small-scale vortex generators are applied in modern commercial aircraft to improve the maximum lift provided by an airfoil during events such as takeoff and landing. Lin discusses how these vortex generators are implemented and their effects [4], but these studies do not consider the effects on VGs of extreme yaw angles which are prevalent in Formula Student.
Given these characteristics, the application of vortex generating devices was investigated for Formula Student. This paper seeks to evaluate whether usage of vortex generating fences in typical Formula Student applications increases performance in key performance metrics such as drag and downforce at various speeds and yaw angles.
2. METHODS

Analysis was carried out on the most recent rear wing built by the University of Pittsburgh’s FSAE team: a multi-element wing with four elements. No other components of the car were included in the analysis to capture only the effect of the vortex generating fences and reduce simulation complexity.
VG placement and structure was taken from guidance suggested by Kuya et al. [2]. Large-scale vortex generators could potentially be manufactured using common filament deposition 3D printing and maintain reasonable accuracy in their placement using standard adhesives. Sub-boundary layer VGs were not examined due to the apparent difficulty in manufacturing and the challenge of placing them on a physical wing precisely due to their small size. As a requirement, small-scale VGs must be shorter in height than the boundary layer. Due to the low speeds and wing sizes in Formula Student, it is not feasible to create small-scale VGs as they would be on the order of sub-millimeter heights. The test configuration was chosen to be a set of counterrotating fences evenly spaced on the secondary element, with an aspect ratio of 4:1 (Spacing Width:VG Length), a height of 0.5 [in], and an incidence of 15 degrees away from freestream (Figure 2 and 3).
Meshes were created in ANSYS Meshing with sufficient refinement of the boundary layers around VGs and wing surfaces to approach y+ values on the order of 1. This is critical for results to be meaningful; the boundary layer must have sufficient resolution for the simulation to predict separation accurately. The remaining volume mesh was a standard tetrahedral mesh. Proper curvature and proximity refinement were created with guidance given by LEAP Australia [5].
107 Ingenium 2023
Figure 2. Comparison of control wing versus with VGs installed. Left image shows rear wing model “clean” configuration without VGs installed. Right image shows the “test” configuration with close spaced counterrotating VGs installed on secondary element.
Figure 3. Close up of counterrotating VG placement. Each singular VG is 0.5” tall and 1” long. Each VG fence is positioned 15 degrees away from freestream.
An enclosure was created around the wing assembly with about 4.5 [ft] of padding around the front and side edges of the assembly and 10 [ft] of space behind the wing assembly. A velocity inlet condition was provided at the most forward enclosure face and a pressure outlet at the rear. The side walls were all wall conditions. This organization mirrors what would be found in a traditional wind tunnel. The full wing assembly was simulated in all cases—while cases without yaw angles could take advantage of symmetric walls, these were not introduced to reduce workflow complexity.
All simulation was done in ANSYS Fluent using a k-ω SST turbulence model, which was chosen for its computational efficiency, accuracy of separation prediction, and near-wall treatment [6]. All simulation was done in a steady state as the flow structure was assumed to be time independent. Simulation convergence was judged by a steady value of lift and drag forces on the wing sections and steady residual velocities on the order of 1e-5.
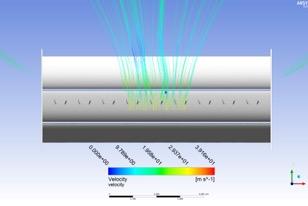
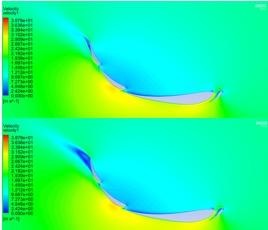
A sweep of inlet speeds between 15 and 45 [MPH] were examined and followed by a yaw sensitivity study which rotated the entire wing assembly as much as 12 degrees away from freestream. These values were chosen after analyzing real data from the driven car. Average corner speeds were seen to neighbor 30 [MPH] during previous competitions. Simulation results were then processed in ANSYS CFD-Post to understand the flow phenomena and vortex cores present.
Drag and downforce values of the assembly were the key performance indicators. An ideal configuration prioritizes maximizing downforce while minimizing drag as a secondary goal.
3. RESULTS
shape
trends
Vortex generating fences did create a noticeable decrease of separation in solutions that were post processed and created weak rotational flows in their wake (Figure 4 and Figure 5). The vortex generating fences are altering the flow throughout the rear wing, but the flow is dominated by the much larger-scale circulation around the rear wing itself. Helical structures are apparent in the streamlines following the VG placement and elucidate the vortex created (Figure 5). These structures are most clear near the center of the wing but become much weaker on the outer sides of the wing.
108 Undergraduate Research at the Swanson School of Engineering
Figure 4. Velocity contours at midplane with and without VGs at a test speed of 40 [MPH] and 0 degrees of yaw. The test configuration (Top) shows less separation when compared to the clean configuration (Bottom) as demonstrated by the size of the near-zero velocity region following the final element. Flow is from right to left.
Figure 5. Velocity streamlines illustrating vortex generating fences. Streamlines demonstrate effect of VG placement and visualize the resultant swirling and helical
in the space between wing elements. The greater
of the endplate are also visible, as streamlines are pulled away from the center as they proceed away from the wing surfaces. This data is from a speed of 40 [MPH] and 0 degrees of yaw.
Formula Student cars have large endplates to help contain the pressure gradient generated by their wings but are limited in size by the rulebook. The result is flow patterns that are inherently rotational at the end of a wing section as pressure escapes over the edges of the endplate. This creates strong swirling in the wake that also pulls the flow from vortex generators outward (Figure 5). As shown in the streamlines, flow progresses in a curved path outwards rather than in a linear track rearward as it leaves the wing assembly.
Figure 6. Downforce and drag values for a sweep of freestream velocities, with the blue line representing a wing without vortex generating fences, and the yellow line with them installed. Downforce values are nearly indistinguishable, while drag is mildly increased by the addition of the VGs.
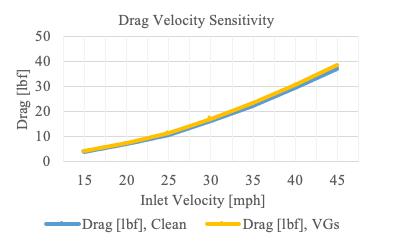
Figure 7. Downforce and drag values for a sweep of yaw angles at a fixed 30 [MPH], with the blue line representing a wing without vortex generating fences, and the yellow line with them installed. VGs negatively affected the downforce generated across all yaw angles, while somewhat improving drag forces generated when compared to the clean configuration.

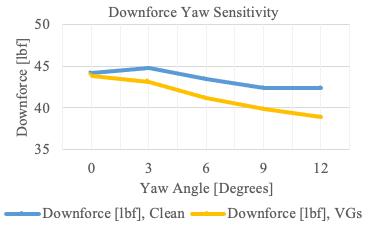
No outstanding changes in downforce were recorded during the sweep of several airspeeds, however an increase in drag was established when compared to a clean wing (Figure 6 and Table 1). During the yaw sensitivity examination, VGs were found to negatively impact the downforce generated, while a decrease in drag was also present (Figure 7 and Table 2).
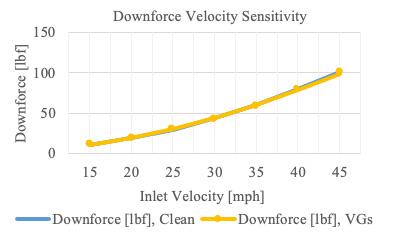
109 Ingenium 2023
4. DISCUSSION
A general increase in drag during the velocity sweep with VGs installed was expected and is an indication of the energy directed towards creating vorticity in their wake, however, no perceivable change in lift was surprising. Research is required to establish why exactly this result is present despite the reduction in separation provided by the VGs. This test configuration, while a probe into VGs in Formula Student, is not optimized for VG or wing element size. A multi-element wing designed with VGs in mind could prove more effective than the rear wing examined here.
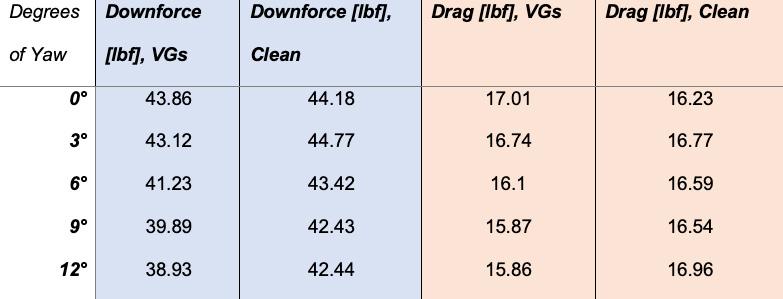
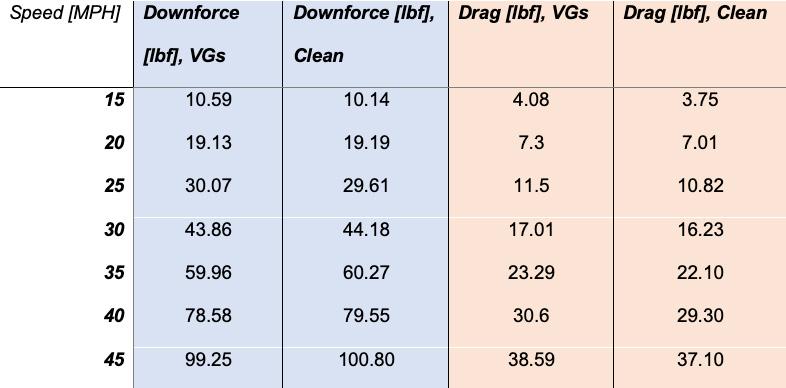
According to the yaw sensitivity study, VGs proved noticeably detrimental. This is due to the angle of incidence of the VGs changing dramatically and asymmetrically with overall yaw angle, and thus becoming instigators of separation at more oblique angles. VGs at more extreme yaw angles create chaotic pockets of turbulence rather than a controlled vortex in these cases.
The clean wing design was also found to benefit from a small amount of yaw angle. The projection of the wing profile onto the freestream at yaw angles of about 3 degrees creates a milder transition between elements
110 Undergraduate Research at the Swanson School of Engineering
Table 1: Listed values of lift and drag at a sweep of speeds as displayed in Figure 6. All models at 0 degrees of yaw.
Table 2: Listed values of lift and drag at a sweep of yaw angle as displayed in Figure 7. All data taken at an inlet speed of 30 [MPH].
than at near-zero yaw angles and reduces the overall angle of attack of each wing element. This effect is limited by aerodynamic effects of the wing endplates at higher yaw angles. Finally, future work should look to validate these computational results experimentally. The current Formula Student car could potentially be examined with flow-vis paint and other typical means to determine the validity of the flow patterns presented.
5. CONCLUSION
Vortex generating fences demonstrated a clear change in drag and flow phenomena when applied, however, their usage cannot yet be recommended. The test configuration with VGs attached developed more yaw sensitivity and did not significantly increase downforce generated.
6. ACKNOWLEDGEMENTS
Computational access and guidance were provided by Dr. Matt Barry. Funding was provided by the Swanson School of Engineering and the Office of the Provost at the University of Pittsburgh.
REFERENCES
[1] M. Koike, T. Nagayoshi, and N. Hamamoto, “Research on Aerodynamic Drag Reduction by Vortex Generators,” Mitsubishi Motors Technical Review, 2004.
[2] Y. Kuya et al., “Flow Separation Control on a Race Car Wing With Vortex Generators in Ground Effect,” ASME. J. Fluids Eng., vol. 131, iss. 12, December, 2009, doi: 10.1115/1.4000420.
[3] B.L. Storms, and James C. Ross, “Experimental Study of Lift-Enhancing Tabs on a Two-Element Airfoil,” J. Aircraft , vol. 32, iss. 5, 1995, doi: 10.2514/3.46838.
[4] J. C. Lin, “Review of research on low-profile vortex generators to control boundary-layer separation,” Progress in Aerospace Sciences, vol. 38, iss. 4-5, 2002, pgs. 389-420, doi:10.1016/S0376-0421(02)00010-6.
[5] LEAP Australia, (2019). CFD Workflow & Best Practices for FSAE using ANSYS Fluent. [Online]. Available: https://www.youtube.com/ playlist?list=PLvsJbyBB0CMcLcnFTUJox3V0ib82t4drw
[6] A. Wimshurst. (2019). The k-omega SST Turbulence Model. [Online]. Available: https://www.youtube. com/watch?v=myv-ityFnS4
[7] A. Wimshurst. (2021). Residuals in CFD (Part 1) –Understanding Residuals. [Online]. Available: https:// www.youtube.com/watch?v=v9OnNeYH4Ok
111 Ingenium 2023
Development of a
Reduced Area Build-box for a Commercial Binder Jet 3D
Printer for Minimized Powder
Utilization for Printing of Magnetocaloric Materials
Emma Spatz1, Pierangeli Rodríguez De Vecchis1, and Markus Chmielus1
1 AM3 Lab, Department of Mechanical Engineering and Materials Science, University of Pittsburgh
Emma Spatz was born and raised in Warrington, PA. Her interest in chemistry, physics, and design led her to pursue a bachelors degree in materials science and engineering.

ABSTRACT
Pierangeli Rodriguez is a PhD student in Prof. Markus Chmielus’s lab in the Mechanical Engineering and Materials Science Department at the University of Pittsburgh. Her research interests focus on Binder Jet 3D printing and characterization of metallic materials for various applications including Nibased superalloys, tungsten carbide and magnetic shape memory alloys.
Dr. Markus Chmielus is an Associate Professor and Materials Science and Engineering Program Director in the Mechanical Engineering and Materials Science Department of the University of Pittsburgh. His areas of research focus on advanced manufacturing of metals, carbides, and functional magnetic materials. The combining umbrella of his research is quantitative, correlative characterization of microstructure, defects, mechanical, electrical, magnetic, and thermal properties over several length scales.

Significance Statement
Large amounts of powder are required even for small prints produced via binder jet 3-dimensional printing (BJ3DP), making experimenting with expensive powders a challenging task. Developing a reduced area build box for an existing BJ3DP can allow for experimentation using this technology with small amounts of powder.
Category: Device Design
Keywords : binder jet 3-dimensional printing, additive manufacturing, magnetocaloric materials, small-area build box
Binder jet 3-dimensional printing (BJ3DP) is an Additive Manufacturing (AM) method that produces parts by spreading powder and selectively adding binder to each layer according to a 3D model. For some metals, such as magnetocaloric materials, BJ3DP has advantages over traditional manufacturing and other AM methods in terms of design freedom. BJ3DP does not involve melting, elemental evaporation, or thermal stresses. Additionally, powder can be recovered and reused after printing which is especially important when only small amounts of powder are available. Unfortunately, many printers require large amounts of powder to print successfully, which makes using this technology with expensive or experimental powders challenging. In this project, this challenge was addressed by developing a modified build box with smaller print area. This build box was made to work with an existing commercial ExOne printer, only modifying the print bed area. The modified build box was successfully used to print several samples, some of which were printed with a Ni 45.5Mn36.6 Co 4.3 In13.6 magnetocaloric powder.
1. INTRODUCTION
The magnetocaloric effect (MCE) describes the ability of magnetic materials to heat or cool when a magnetic field is applied or removed [1]. The MCE has potential applications in refrigeration and has been shown to be more energy efficient, quieter, and more environmentally friendly than current refrigeration methods. Additive manufacturing (AM), due to the flexibility of shapes it can produce, could be an effective way of manufacturing magnetocaloric materials for this purpose [2]. There are many types of magnetocalorics. One class is Heusler alloys, an example of which is Ni-Mn-Co-In. The composition of the alloy and small changes of it can affect magnetic and other functional properties, so being able to experiment with small amounts of powder is useful [3].
Binder jet 3-dimensional printing (BJ3DP) is a powder bed-based AM method. In 1993, binder jetting technology was first developed at the Massachusetts Institute of Technology. Since then, it has been primarily developed and commercialized by companies such as ExOne [4]. First in the BJ3DP process, a layer of powder is rolled and flattened onto the powder bed on the build platform. Jets deliver binder in a pattern set by a computer in order to create the desired final 3-dimensional shape. The binder can have different formulations, but no matter the formulation, its purpose is to act as glue to keep powder together. Heat is applied to slightly dry the binder. The build box is then moved down a distance equal to layer height, and the previous steps are repeated. Once the desired height and number of layers is reached, the part is removed from the printer and cured. Curing is when the part is heated to fully dry the binder. Unbound powder is then removed from the cured
Ingenium 2023
Emma Spatz
Pierangeli Rodriguez De Vecchis
112
Marcus Chmielus
part and may be reused for another print. At this point the parts are referred to as green and are fragile, but their strength and density can be increased by a heat treatment process, such as solid-state sintering. BJ3DP is especially promising for production of functional materials like magnetocalorics because printing does not involve melting of the particles like laser-based AM methods, allowing the powder’s original properties to be maintained. Other advantages of BJ3DP include lesser cost and energy usage [3]. Unfortunately, this production technique often requires significantly more powder to be available during printing than will be bound in the final part. For example, the build-box of the ExOne X-1 Lab, a 3D binder jet printer, can require up to 300 g of powder for a successful print, making printing with small amounts of experimental or expensive powders challenging. Stevens created a manually operated BJ3DP which greatly reduced the amount of powder required to print, however it lacked the consistency and automation of a commercial BJ3DP [3]. Here, the goal of this project was to create a modified build box with reduced area, allowing the use of the flexible shape manufacturing capabilities of a commercial BJ3DP with a small amount of powder, while maintaining the same printer parameters and quality.
2. METHODS
2.1 Powder production and characterization
A magnetocaloric powder was produced to be printed using the modified printer parts that would be created. An ingot of magnetocaloric material, provided by Simone Fabbrici from the University of Parma with given composition of Ni 45.5Mn36.6 Co 4.3 In13.6 by atomic percent, was ball milled at 350 rpm in cycles of 5 min on, 15 min rest. The resulting powder was sieved to a particle size of less than 63 μm. The original ingot and powder were characterized with a ZEISS Sigma 500 VP scanning electron microscopy (SEM) equipped with energy-dispersive spectroscopy (EDS) for compositional analysis. This powder was to be printed with the area reducer because attempting to print using any unmodified 3DBJP would be impossible due to the small amount of powder available.
2.2 Reduced area build-box development
Previous, larger versions of a build and feed box area reducer (AR) had been created in the lab by disassembling the original build and feed box, measuring their dimensions with calipers and designing boxes with a much smaller printing area that covered the remaining section. These existing AR CAD files were modified using SOLIDWORKS to reduce the build area even further for this iteration. Parts being modelled were new, smaller build and feed plates, and shafts to move these plates. Collars were also created to fill the space between the smaller plates and shafts, and the original, larger build box. The AR parts, excluding the build collar and build plate, were printed on a Prusa i3 MK3S+ using polyethylene terephthalate glycol (PETG) filament. The build collar and build plate were printed using high temperature resin on a FormsLab Form 3+ printer because these parts are directly exposed to temperatures up to 200°C (at which PETG begins to melt) during binder drying from the heat lamp in the X-1 Lab printer.
2.3 Printing of samples
First, two test samples were printed using Inconel 625 (a nickel-based superalloy) to test the effectiveness of the AR. Cubes (7 mm side length) were printed using parameters of layer height 100 μm, roller traverse speed of 25 mm/s, feed/build powder ratio of 3, drying time 25 s, and binder saturation 60%. After these successful test prints, two 5 mm side cubes and a 3 mm side cube were printed with the Ni-Mn-Co-In powder. Parameters used were layer height 100 μm, roller traverse speed of 3 mm/s, feed/build powder ratio of 3, drying time 25 s, and binder saturation 70%. All samples were cured at 200°C for 6 h. No post curing densifying was performed.
3. RESULTS
3.1 Powder characterization
Table 1 shows the compositional results of EDS and compares the composition of the original ingot, the powder, and the given composition.

113 Ingenium 2023
Table 1: Results of EDS on the original ingot Ni-Mn-Co-In and powder compared to the as-received composition.
Although all powder was less than 63 μm, the ball milling process results in size and particle shape variation, which is visible in SEM images, as shown in Figure 1.
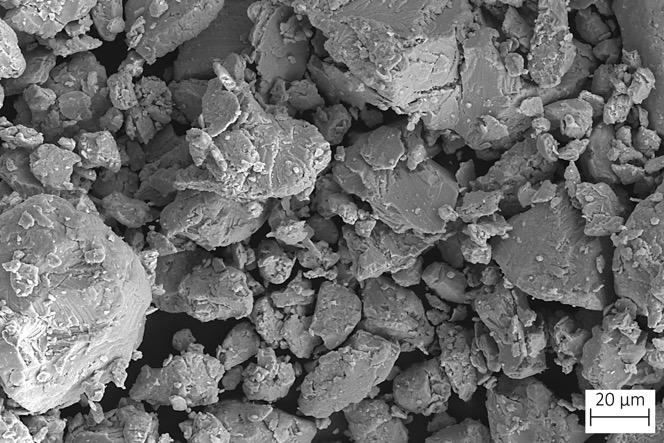
3.2 Modified build box
The complete AR design is shown in Figure 2, as assembled (a), in an exploded view to visualize the components and assembly procedure (b), and a labeled cross-section, showing the assembled parts ready for operation (c). The original build and feed box parts X-1 Lab were removed to make space for the AR. Figure 3 shows how the AR parts sit in the X-1 Lab. The feed and build towers were screwed to the F and Z axes of the X-1 Lab. The motors move the towers which, in turn, move the build and feed plates that sit on top of these towers (as shown in Figure 2 (c)). The collars were introduced in the build and feed box positions around their respective towers. The collars were secured into their respective boxes using an O-ring, so they would not move during printing and to prevent powder leakage. The build plate attaches to the tower via a dovetail mechanism that allows it to be removed after the print is done. During the print, this build plate moves down a set amount for each layer. The feed plate sits on top of the feed tower and is raised during printing to deliver powder for each layer.

114 Undergraduate Research at the Swanson School of Engineering
Figure 1. SEM image of the Ni-Mn-Co-In powder, showing its varied size and irregular shape.
Figure 2. SOLIDWORKS assembly of finalized area reducer, (a) Top-front view showing complete assembly with both towers raised completely through the collars, (b) Exploded view to show assembling procedure and (c) Labeled parts on a front cross-sectioned view of the assembly.
Several iterations of the AR designs were attempted. The finalized model included, as shown in Figure 2, (a) build and feed towers with tapered corners to facilitate assembling into the X-1 Lab axes, (b) a two-section build tower assembled together with a socket and screw to facilitate build collar fitting, and allow changes in the build plate dove tail without the need of printing the entire build tower again, and (c) a hollowed build collar that resulted in saved resin material and a higher quality part (by facilitating print orientation and drying during its printing).
In Figure 4, two of the successfully printed samples are shown after curing. (a) shows an IN625 sample, and (b) shows a Ni-Mn-Co-In sample. Both are intact solid shapes, just as they would be had they been printed with the original build box.

The densities of the green samples were calculated by the direct method. The dimensions of each sample were measured and used to calculate the volume. The mass of the sample was measured using a balance and divided by the previously calculated volume to give the density. Relative density can then be found by dividing this calculated part density by the standard density for the material. IN625 samples had densities of 4.62 g/cm3 and 4.25 g/cm3 , or 54.78% and 50.40% dense, respectively as IN625 has a standard density of 8.44 g/ cm3 [5]. Ni-Mn-Co-In samples had densities of 3.29 g/ cm3 , 3.19 g/cm3 , and 3.29 g/cm3 .

115 Ingenium 2023
Figure 3. Finalized AR assembly integrated into the X-1 Lab build and feed boxes showing both collars flushed with the surface of the print area, the raised build tower (without build-plate to show the dove tail) and the lowered feed tower, with its feed plate.
Figure 4. 3DBJ-Printed and cured samples printed using the area reducer (a) with Inconel 625 powder (test powder) and (b) with the Ni-Mn-Co-In magnetocaloric powder.
4. DISCUSSION
The AR build plate had dimensions of 14.35 mm x 14.35 mm, compared to the original build plate of 49.5 mm x 69.5 mm, reducing the print area by 94.0%. The AR also had minimal powder leakage when operating and parts did not get stuck due to thermal expansion.
The successful printing of the Inconel 625 samples allowed for the testing of the AR reducer with the NiMn-Co-In powder. The variability in size and shape of the Ni-Mn-Co-In powder can result in different flow and spreadability and packing density, which can create challenges during BJ3DP [4]. These changes in properties can be accounted for by changing printing parameters. The parameters used for Ni-Mn-Co-In powder were modified from the IN625 parameters, as described in section 2.3, to account for the difference in powder morphology (as the Inconel 625 powder is spherical, while the Ni-Mn-Co-In powder is irregular), and samples were printed successfully. With densification by sintering, these parts could be further strengthened [3].
5. CONCLUSIONS
The AR, a modified build and feed box plugin for the X-1 Lab printer, allowed for successful printing of samples. This project produced the first working iteration of the X-1 Lab AR by effectively reducing the printing surface area (and thus required amount of powder), while avoiding powder leakage or expansion of the parts due to the heat lamp. It was first tested for printing of samples with spherical Inconel 625 powder, and then used for experimental quantities of irregular Ni-Mn-Co-In powder. The small, irregular magnetocaloric powders were successfully printed into solid parts. The AR will allow for testing the use of BJ3DP production on different, precious materials needing only a small amount of powder. Further testing will be performed on the Ni-Mn-Co-In parts to observe their magnetic and thermal properties to investigate the impact of production via BJ3DP on these properties. Microstructural examination after sintering will also be performed to determine the best sintering conditions to densify printed parts, and the composition of sintered Ni-Mn-Co-In parts will be tested and compared to the original ingot and powder.
6. ACKNOWLEDGMENTS
Thanks to the Chmielus Lab group, especially Pierangeli Rodríguez and Dr. Chmielus, the Swanson Center for Product Innovation (SCPI), Simone Fabbrici from the University of Parma, and the Swanson School of Engineering and the Office of the Provost at the University of Pittsburgh. The authors also gratefully acknowledge funding from the National Science Foundation [NSF grant number 1727676].
REFERENCES
[1] V. Buchelnikov et al., “Magnetocaloric effect in NiMn-Ga and Ni-Co-Mn-In Heusler alloys,” in Materials Research Society Symposium Proceedings, 2010, vol. 1200, pp. 92–99.
[2] E. Stevens et al., “Mastering a 1.2 K hysteresis for martensitic para-ferromagnetic partial transformation in Ni-Mn(Cu)-Ga magnetocaloric material via binder jet 3D printing,” Addit Manuf, vol. 37, p. 101560, Jan. 2021.
[3] E. Stevens, “Additive Manufacturing of Magnetocaloric Materials: Assessing and Adapting DLD and BJ3DP Fabrication Methods,” 2020.
[4] A. Mostafaei et al., “Binder jet 3D printing—Process parameters, materials, properties, modeling, and challenges,” Progress in Materials Science, vol. 119. Elsevier Ltd, Jun. 01, 2021.
[5] J. R. Davis, “Physical Properties of Cast Nickel-Base and Cobalt-Base Alloys,” in ASM Specialty HandbookHeat-Resistant Materials, ASM International, 1997.
116 Undergraduate Research at the Swanson School of Engineering
Designing a Haptic Shape Display to Assist Blind Individuals
Joshua M. Summers1 and Samuel J. Dickerson
1 Department of Mechanical Engineering and Materials Science, University of Pittsburgh
2 Department of Electrical and Computer Engineering, University of Pittsburgh.
Joshua Summers is a sophomore mechanical engineering student from Yardley, PA. He is passionate about renewable energy innovation. He intends to pursue a master’s degree in mechanical engineering and aspires to work on stationary battery storage or nuclear fusion in his career.
ABSTRACT
2
Samuel J. Dickerson became a Senior Member in 2018. He received his PhD in electrical engineering from the University of Pittsburgh in 2012. He is currently an Associate Professor in the Department of Electrical and Computer Engineering at the University of Pittsburgh. His primary research interests are in the design of cyber-physical systems. In addition to the design of electronic hardware, his research includes the development of modeling and simulation software for mixed-signal multi-domain systems.

Significance Statement
Blind individuals are sometimes limited to the sense of touch in their hands when it comes to navigating complex physical environments. Haptic feedback can allow blind individuals to collect data on their environment from afar when coupled with cameras and other various electronic equipment.
Category: Device Design
Keywords : solenoid, grid, depth, haptic feedback
Haptic feedback has been a part of electronic devices for a long time. Vibrations are in devices such as our phones, our smart watches, and our gaming consoles. But haptics in the medical field, specifically for assisting the blind, is much more uncommon. The technology used for assisting the blind is considerably limited, but it is possible to offer technology that can greatly improve their quality of life. Shape displays can be used as a form of haptic feedback to draw the surroundings of a blind individual onto their body. If done effectively, this could give blind individuals more mobility and reduce the cognitive load of navigating around complex environments. This research investigates if a haptic feedback device of this nature can be designed and if it is practical. Push-pull solenoids were found to be a noticeable, sufficient form of haptic feedback. When coupled with a depth-perceiving camera and other electronic equipment, this device acted as a crude tool that could communicate information about the physical environment to the individual using it.
1. INTRODUCTION
Sight is an incredibly useful asset when it comes to navigating our world. Unfortunately, there are many of us that lack this vital ability. About 1 million Americans are blind [1]. Across the globe, over 2.2 billion people have eye and vision ailments [2], and 43 million are blind. It is estimated that by the year 2050, that number will increase to 61 million people [3]. These numbers are surely unsettling, and most work in this field should be done on preventative medical care. However, there are still millions of people with irreversible blindness, and this group has yet to benefit from some of the powerful technology of today. Currently, members of the blind community utilize technology such as white canes, guide dogs, screen readers, and electric braille displays [4]. Vision is real-time, hands-free, and can be used to sense the varying depths of one’s surroundings. Blind people do not currently have a device that mirrors this for their community, but a device like this can certainly be developed. The research uses a haptic feedback device composed of an array of push-pull solenoids, which forms a shape display. The haptic feedback device communicates information to the user about their physical environment and how to navigate it. The research intends to enable blind people to navigate their environment quicker, more safely, and with more information at their disposal.
1.1. Why Haptic Feedback
The mechanism for communicating the surrounding depth data to the user was haptic feedback. Haptic feedback can be clearly distinguishable, comes in a variety of forms, and the mechanisms can range from low in cost to highly expensive. The research takes concepts for its haptic feedback mechanism from prior research, namely the inFORM Dynamic Shape Display produced by the MIT Media Lab [5]. A shape display is
117 Ingenium 2023
Joshua M. Summers
Samuel J. Dickerson
an electronically powered device that has a dynamically changing shape, and which allows users to receive information via touching the changing device. A grid of actuators forming a shape display can provide excellent haptic feedback [6]. High resolution haptic feedback can also be implemented in the form of an electro-tactile display, such as an array of electrodes [7]. However, the objective of the research produced some novel criteria. For the device to become a viable product for daily living in the blind community, it needs to be lightweight, portable, relatively inexpensive, all while still being able to convey a large quantity of information. Therefore, 12 Volt push-pull solenoids were chosen to make up the device’s shape display. These are some of the most economical actuators, and multiple can be powered with a lightweight battery.
2. METHODS
The research conducted used an Intel® RealSense™ D435 camera, which is a camera that can detect both visible light and the distance of objects from the device. The footage the camera collects is 1280 pixels wide by 720 pixels long. 64 pixels from the footage were chosen to be measured. Each pixel was placed so that an 8 by 8 grid of these points was formed. Each point measures a pixel’s depth value live from the footage. The pixels were spaced out to take up as much of the footage as possible. The pixels were also not placed on the perimeter of the footage (the first few and last rows and columns).
2.1. How Software and Hardware Interface
Each point controls whether a corresponding solenoid turns on or off. This yields 64 solenoids in a grid that all fluctuate depending on the depth values the camera is presently recording. The solenoids are the mechanism for communicating depth-based information to the user. The solenoids thus push into the user’s skin as a form of haptic feedback. The solenoids could use the user’s back as the “canvas” it displays the information on. The intention is that this 8 by 8 grid of solenoids will inform the user of where objects are located in reference to the user’s own position. For example: the camera could detect an obstacle at the bottom of where it is recording, based on the grid’s depth readings. The solenoids could then press into certain regions of the user’s skin, such as the bottom of their back, to let the user know that an obstacle is in that area (the bottom) of their “field of view”. Depth readings from the camera indicate the proximity of objects. This is the process by which someone who is visually impaired would be expected to use this device.
2.2 Dealing with Limitations
The 12V push-pull solenoids are energy intensive, however. Only approximately 10 can turn on at a given time, considering the size of a small battery that was chosen. To allow for these 10 solenoids to be used as efficiently as possible, only the 10 points/solenoids corresponding to the largest depth value readings will be turned on at a time. When these solenoids press into a user’s skin, they will let the user know that those parts of the grid are where the most available walking space is. All other parts of the shape display, by being turned off, indicate to the user that there are obstacles in those regions.
3. EQUIPMENT
Other equipment used in this research is a Raspberry Pi 3b, 64 N4001 diodes to protect the Raspberry Pi from the 12 Volt current being used, 8 printed circuit boards, 64 N-type MOSFETs, and 8 74HC595 8-bit shift registers. The N-type MOSFETs allow the Raspberry Pi to turn on and off the solenoids using only the 5 Volt current it supplies. The shift registers are needed because a Raspberry Pi 3b has less than 64 GPIO pins, and 64 separate electronic devices need to be controlled. The solenoids are glued to strips of plywood so that they do not move around. The solenoids could also not be gradually actuated; they could either be in their off state, or in their fully extended state. Jumper wires were used to connect the GPIO pins of the Raspberry Pi, and to the PCBs to each other, so that the 12V current can flow between them. The code is written in python and used the Intel® RealSense™ SDK 2.0 library to operate the depth-perceiving camera.
4. RESULTS
The code measuring the 64 regions of the footage works as intended. In Figure 1, the camera is facing a person’s chest. The 10 points with the highest depth values were somewhat randomly dispersed, as there were no points of significance, and they were all generally equal.
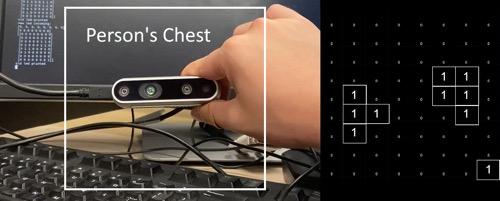
118 Undergraduate Research at the Swanson School of Engineering
Figure 1. The 10 points with the largest depth values on the grid were somewhat randomly dispersed, as the camera was essentially facing a wall.
In Figure 2, a hand is covering the lower portion of the camera. The points with the largest depth value should all be at the top, because the points below them should all be detecting an object that is very close to them. The points at the top would not be detecting such an obstacle. The code sorted all 64 values from highest to lowest. The highest 10 values were replaced with a “1”, and the remaining values were replaced with a “0”. The values were then displayed in the region that they occurred in. The code worked as expected.
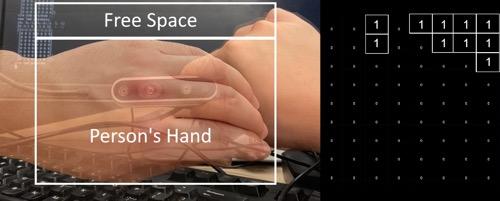
4.1 Haptic Feedback Results
When the solenoid’s plunger shoots backwards, it can be easily felt. A test was done using an 8 by 1 solenoid grid, seen in Figure 4. Code made each solenoid in the grid turn on and off one by one, in less than a second total, for all 8.
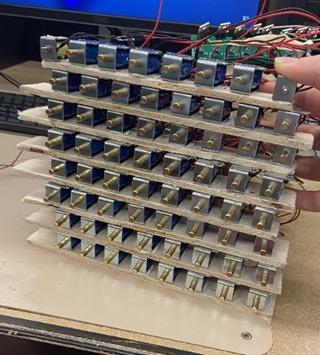
the solenoids would turn on where there was a “1” in Figure 2, and the solenoids would turn off where there was a “0” in Figure 2.
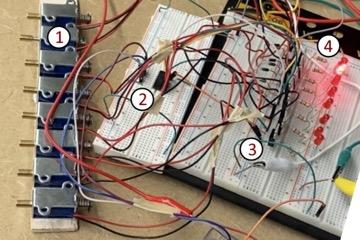
When individuals working on the project pressed their arm up to the solenoids, they could feel the solenoids successively running up their arm. This indicates that push-pull solenoids suffice as a form of haptic feedback. A limitation is that if the individual’s arm was pressed up immediately next to the solenoid’s plunger, it would stop the solenoid’s plunger from moving, and no sensation of touch would be produced.
4.2 Results Summary
When an object was covering the center and bottom of the footage, the code detected that the regions of the footage with the most “free space” were at the top. If the solenoid array was fully functional, the solenoids at the top of the grid would be sent signals to turn on, and their plungers would stick outwards. This is how information would be conveyed from the camera to the user. In a separate experiment, the 12V push-pull solenoids were determined to be a viable form of haptic feedback. Their on and off states were sensed by the user, but some circumstances prevented the solenoid’s plunger from performing as expected. Solenoids were demonstrated to be a viable option for building a shape display. Since the solenoids and the equipment used in the research were lightweight, relatively inexpensive (besides the camera, which can be replaced with cheaper alternatives), portable, and sufficed as a shape display, the research criteria were demonstrated to be possible.
119 Ingenium 2023
Figure 2. As an object covers the middle and bottom portions of the camera, the 10 points with the largest depth values were all located at the top portion of the camera/grid.
Figure 3 depicts what the 8 by 8 grid of the solenoids in their off state appeared like. If the grid of solenoids was functioning in accordance with the code in Figure 2,
Figure 3. The 8 by 8 solenoid grid outside of a backpack/other carrying device. All solenoids are in their off state, and their plungers are not extending outwards.
Figure 4. Testing the 8 by 1 solenoid grid. 1. 12V Push-Pull solenoid, 2. Breadboard and shift register, 3. MOSFETS, diodes, 12V power supply, 4. LED to help visualize which solenoid is turned on. Note the difference between the on solenoid (second from top), and the remaining off solenoids. The plunger in the on solenoid has extended outwards.
5. DISCUSSION
The full 8 by 8 grid shape display is still being produced. However, the testing of the 8 by 1 solenoid grid indicates that this method of haptic feedback is useful and able to be sensed. The 8 by 8 solenoid grid would suffice as haptic feedback assuming it is constructed properly. Moreover, since the code for detecting the lowest depth value points works as intended, the 8 by 8 solenoid grid would fluctuate and provide information to the user relative to their physical environment. What is uncertain is how effective this will be. The resolution of the shape display might need to increase, or more solenoids may need to be able to turn on at a time for the burden of its weight and cost to be overridden.
5.1 Solenoid Innovations
The limitation of the number of solenoids that can turn on at a time can be overridden, however. Instead of turning 10 solenoids on at the same instant, 2 or 3 solenoids of the 10 can each be turned on and off in rapid succession of each other. This would be done until all 10 of the desired solenoids are actuated. This way, the same amount of information can be conveyed, in a similarly sized time span, but with less electric draw required. Moreover, the defect of the solenoid plunger not turning on if it is pressured up against an object can also be resolved. A tube would need to be placed on the back of the solenoid that was slightly longer than the solenoid plunger in its off state. The tube would block the user’s skin from accidentally pushing up against the plunger, so that the plunger can be free to actuate when it needs to turn on. The plunger will not be blocked when it is off and will still be able to make contact with the user’s skin when it is on.
5.2 Additional Features
Additional features could be implemented to the device. One feature could be a button that switches the solenoids from detecting the largest depth values to the smallest depth values. In an outdoor environment, it may be more helpful to have the few solenoids on the grid focus on what can be collided with, such as a ball or a tree. In an indoor environment, it would be more useful to know what cannot be collided with, such as an open doorway or a hallway. Another feature could be text detection in the camera, and thus a text-to-braille converter on the shape display for any words or signs the user may be around. Furthermore, this device could be coupled with a system that utilizes sound feedback, in addition to touch. Lastly, different kinds of haptic feedback could be used to indicate information besides depth, such as vibrations or thermal sensations. Perhaps if a point on the camera footage detects the color red, orange, or yellow, a corresponding heat coil grid could emit heat in that point’s corresponding region. The same could be done with cold sensations and for the colors green, blue, or purple. This could “paint” an image on the user’s back as well. The possibilities are vast!
6. CONCLUSIONS
An economical shape display using 12V push-pull solenoids was tested on whether it could suffice as haptic feedback and if it could be used to inform individuals of their surrounding environment. While each separate component of the device functioned properly, it has yet to be tested in its complete form as an 8 by 8 grid. Haptic feedback is used in a variety of applications, and it can certainly be used to help the blind community. Multiple shape displays have already been built and proven to be practical, and this research concludes that a portable, low-cost shape display can be built out of push-pull solenoids. However, there are some limitations to this design, as only a few solenoids at a time can be turned on, depending on the size of the battery used.
7. ACKNOWLEDGEMENTS
Funding was provided by the Swanson School of Engineering and the Office of the Provost at the University of Pittsburgh. Thanks to the Robotics and Automation Society for lending their lab space and equipment. Special thanks to Killian J. Rush for the time, energy, and mentorship he dedicated to this research.
REFERENCES
[1] “Visual impairment, blindness cases in U.S. expected to double by 2050,” National Institutes of Health (NIH)
[2] “The Statistics on Eye Disease in America (2021),” NVISION Eye Centers
[3] M. J. Burton et al., The Lancet Global Health Commission on Global Eye Health, Vol. 9, no. 4, pp. e489–e551, Apr. 2021
[4] “Understanding Assistive Technology” Level Access
[5] S. Follmer, D. Leithinger, A. Olwal, A. Hogge, and H. Ishii, “inFORM,” Proceedings of the 26th annual ACM symposium on User interface software and technology - UIST ’13, 2013, doi: 10.1145/2501988.2502032.
[6] F. Steinicke, W. Stuerzlinger, D. Leithinger, S. Follmer, A. Olwal, and H. Ishii, “Shape Displays: Spatial Interaction with Dynamic Physical Form,” MIT Media Lab. Accessed: Jan. 09, 2023. [Online]. Available: https://trackr-media.tangiblemedia.org/ publishedmedia/Papers/600-Shape%20Displays%20 Spatial%20Interaction/Published/PDF
[7] H. Kajimoto, M. Suzuki, and Y. Kanno, “HamsaTouch,” CHI ’14 Extended Abstracts on Human Factors in Computing Systems, Apr. 2014, doi: 10.1145/2559206.2574782.
120 Undergraduate Research at the Swanson School of Engineering
121 Ingenium 2023
Index
Category: Computational Research
Christian N. Hangey, Nathan L. Liang, David A. Vorp, Timothy K. Chung
Framework
Yu-hsuan Chao, John M. Cormack, Kang Kim
Remi Shittu, Jonathan Vande Geest
Category: Device Design
Category: Experimental Research
Cambell T. France, Alexis L. Nolfi, Mangesh Kulkarni, Vishal Jhanji, Bryan N. Brown
Category:
122 Undergraduate Research at the Swanson School of Engineering
Expansion and Optimization
.......................... 33
Pemberton,
Quantifying and Minimizing the Error in
Printing the Human Lamina Cribrosa 62
Carney, Jourdain Lamperski Calibrating Discrete-time Markov Chain Models of Disease Progression with Gradient Descent 89
of an Artificial Intelligence
to Predict Wall Stresses in Abdominal Aortic Aneurysms
Brock
3D
Nathan
A Spatial Clustering Algorithm for Community Detection in Social Networks 94 Zhaohan Xing,
Amin Rahimian Structural Drivers of Polarization in Social Networks 98
Analysis of Vortex-generating Fences on a Formula Student Multi-element Rear Wing 106
Andrew R. Polar, Jourdain Lamperski, Clarence Worrell
M.
Dane A. Sabo, Matthew M. Barry
Development of a Reduced Area Build-box for a Commercial Binder Jet 3D Printer for Minimized Powder Utilization for Printing of Magnetocaloric Materials 112
Emma Spatz, Pierangeli Rodríguez De Vecchis, Markus Chmielus
Dickerson Designing a Haptic Shape Display to Assist Blind Individuals 117
Joshua M. Summers, Samuel J.
Dry Eye Disease Replication in Rabbits: An Evaluation Comparing a Surgically Induced to a Chemically Induced Dry Eye Model ................... 9 Alyssa Aguglia, Kanyakorn Riewruja, Hang Lin PEG-reinforced Gelatin Scaffold Promotes Uniform Chondrogenesis of Human MSCs .............................................................................................. 14 Jacob Antonello, Ioannis Zervantonakis THP-1 Macrophages Influence SNAP CAR-T Cell Infiltration in the Tumor Microenvironment 19
Directivity of Focused
Wave Beams in Soft Elastic Media 23 Abigail Fisk, Rui Liang Impact of Surgical Prolapse Mesh Implantation on Vaginal Collagen Network 28 Michael P. Haugh, Haodi Wu, Robert Barndt FVIII Gene Restoration in Hemophilia A patient Stem Cells Using CRISPR Editing 39 Cara Klinger, Ashley Koenig, Faris Hazwan, Yu Hanry, Jennifer L. Young Biomaterials Design for Bioengineered Meat 43 Laurel Koehler, Youngbin Cho, Ioannis Zervantonakis Mechanisms of Macrophage Recruitment and Infiltration in HER2+ Breast 48 Connor La Marca, Isabelle Chickanosky, Cyrus Darvish, Justin Weinbaum, David A. Vorp Pore Size and Mechanical Strength of Silk Fibroin-based Tissue Engineered Vascular Grafts 52 Andres Leon-Vargas, Maria Jantz, Alaina McCumber, Chaitanya Gopinath, Robert Gaunt Epidural Spinal Cord Stimulation Can Modulate Bladder Activity in an Awake Environment 57 Rachel Shaw, Katrina Knight, Pamela Moalli Visualizing CB1 Receptors in Vaginal Epithelium of Non-human Primates 65 Erica Taylor, Jianying Zhang, Michael Copeland, James H-C. Wang Non-Toxic DOPA-Based Polymers Improve Healing of Severe Wounds 70 Savannah C. Waymer, Maria K. Jantz, Chaitanya Gopinath, Robert A. Gaunt Spinal Cord Stimulation for Bladder Function Evokes Sporadic Nerve Activity .............................................................................................. 78 Alexandra Fuller, Savanna Maynard, Ritesh Pawar, Radisav D. Vidic Fundamentals of Silica Scaling on Nanofiltration Membrane 83
Shear
Tianyi Bi, Lei Fang Toward Using an Equilibrium System Theory to Describe Non-equilibrium Systems 102
Methods
123 Ingenium 2023
151 Benedum Hall
3700 O’Hara Street
Pittsburgh, PA 15261
412-624-9800
engineering.pitt.edu
The University of Pittsburgh is an affirmative action, equal opportunity institution. Published in cooperation with the Office of University Communications. 113032-0321

 Undergraduate Research at the Swanson School of Engineering
 The image on the cover shows immunofluorescence image showing labeling of Cannabinoid type 1 (CB1, red) receptors in the basal and upper layers of the NHP vaginal epithelium. (See page 67 by Rachel Shaw.)


