

Undergraduate Research at the Swanson School of Engineering


Undergraduate Research at the Swanson School of Engineering

University of Pittsburgh Swanson School of Engineering Undergraduate Research Benedum Hall, 3700 O’Hara Street, Pittsburgh, PA 15261 USA
Spring 2025
Cover from left to right: Stress Distribution Visualization of Aneurysm Geometry (See page 60 by Aakash Kottakota), Laser Scanned Image of Mice Brain when Awake (See page 106 by Arushi Singh), ps6 Expression in HER2+ Tissue Slides (See page 74 by Jospeh C. Long), Inconel 718 Laser Cut Bridges Printed using Laser Powder Bed Fusion (LPBF) (See page 41 by Jared Espiritu), Representative Images of Histology Taken with Confocal Microscopy (See page 101 by Yugma Patel).
Please note that neither Ingenium nor the Swanson School of Engineering retains any copyright of the original work produced in this issue. However, the Swanson School does retain the right to nonexclusive use in print and electronic formats of all papers as published in Ingenium
................ 7
Review Board-Ingenium 2025 ................................... 8
The impact of probe pressure on ultrasound imaging for monitoring rat bladder morphology and volume ............... 9
Lily A rmstrong1, Mehdi Ramezanpour1, Anne Robertson1,2
1 Department of Mechanical Engineering and Materials Science, University of Pittsburgh, Pittsburgh, PA
2 Department of Bioengineering, University of Pittsburgh, Pittsburgh, PA
Generation of adipose-like tissue from human induced pluripotent stem cells for studying contribution of obese fat to osteoarthritis .......................................... 12
Olivia Bartholomew1, Meagan Makarczyk1,2 , Sophie Hines1,2 , Hang Lin1,2,3
1 Department of Bioengineering, University of Pittsburgh, Pittsburgh, PA
2 Department of Orthopedic Surgery, University of Pittsburgh, Pittsburgh, PA
3 Orland Bethel Family Musculoskeletal Research Center, University of Pittsburgh, Pittsburgh, PA
A novel virtual reality-based platform for kinetic visual field testing ...................... 18
Brian Bartley1, Galen Holland2 , William Smith2 , Rakié Cham3, Alessandro Fascetti3,4
1 Department of Electrical and Computer Engineering, University of Pittsburgh, Pittsburgh, PA
2 Department of Ophthalmology, University of Pittsburgh, Pittsburgh, PA
3 Department of Bioengineering, University of Pittsburgh, Pittsburgh, PA
4 Department of Civil and Environmental Engineering, University of Pittsburgh, Pittsburgh, PA
DeltaCuff: A novel device to measure venous compliance from acoustic signals .................................. 23
John A. S. Buttles2 , Jason Y. Lee9, Cyrus J. Darvish1, Pete Gueldner1, Rabih Chaer4,5, David A. Vorp1-8,10, Timothy K. Chung1,8
1 Department of Bioengineering, University of Pittsburgh, Pittsburgh, PA
2 Department of Mechanical Engineering and Materials Science, University of Pittsburgh, Pittsburgh, PA
3 McGowan Institute for Regenerative Medicine, University of Pittsburgh, Pittsburgh, PA
4 Department of Surgery, University of Pittsburgh, Pittsburgh, PA
5 Division of Vascular Surgery, University of Pittsburgh, Pittsburgh, PA
6 Department of Chemical and Petroleum Engineering, University of Pittsburgh, Pittsburgh, PA
7 Department of Cardiothoracic Surgery, University of Pittsburgh, Pittsburgh, PA
8 Clinical and Translational Sciences Institute, University of Pittsburgh, Pittsburgh, PA
9 Department of Computer Science, University of Pittsburgh, Pittsburgh, PA
10 Magee-Womens Research Institute, University of Pittsburgh, Pittsburgh, PA
Space utilization increases user interaction and satisfaction within academic settings ....................................... 28
Natalie Ceccarelli1, William W. Clark 2
1 Department of Bioengineering, University of Pittsburgh, Pittsburgh, PA
2 Department of Mechanical Engineering and Materials Science, University of Pittsburgh, Pittsburgh, PA
u Development and analysis of volumebased solvers for partially occluded surfaces in the context of radiation heat transfer ............................................... 33
Eliana Crew1, Matthew Barry1
1 Department of Mechanical Engineering & Materials Science, University of Pittsburgh, Pittsburgh, PA
Category Definitions
u Computational Research—using computational techniques to address a scientific question
Device Design—focusing on the development of a product or device
Experimental Research—using laboratory methods to achieve a novel overarching experimental aim
Methods—developing new techniques and tools for research and design
Other

Effects of heat accumulation on melt pool size in laser powder bed fusion .............................. 39
Jared Espiritu1, Seth Strayer1, Albert To1
1 Department of Mechanical Engineering & Materials Science, University of Pittsburgh, Pittsburgh, PA
Identifying myofibroblast origin in mesh-vagina explants following surgical mesh complications from pelvic organ prolapse repair ........................ 44
Malini Harinath1,4, Marrisa Therriault1,2,4, Pamela Moalli1-5, Katrina Knight1,4
1 Department of Bioengineering, Swanson School of Engineering, University of Pittsburgh, Pittsburgh, PA
2 McGowan Institute for Regenerative Medicine, University of Pittsburgh, Pittsburgh, PA
3 Department of Obstetrics, Gynecology, and Reproductive Sciences, University of Pittsburgh, Pittsburgh, PA
4 Magee-Womens Research Institute, University of Pittsburgh, Pittsburgh, PA
5 Division of Urogynecology & Reconstructive Pelvic Surgery, University of Pittsburgh Medical Center Magee-Womens Hospital, Pittsburgh, PA
Assessing the change in strength of the quadricep tendon after graft harvest ........................... 52
Samiya Henry1, Patrick Smolinski1, Anja Wackerle2 , William Gamble1 and Volker Musahl2
1 Department of Mechanical Engineering and Materials Science, University of Pittsburgh, Pittsburgh, PA
2 Department of Orthopedic Surgery, University of Pittsburgh, Pittsburgh, PA
u AI-Enabled virtual surveillance: Forecasting morphological and wall stress changes in abdominal aortic aneurysms ........................................ 57
Aakash K. Kottakota1, Jason Lee9, Pete H. Gueldner1, Nathan L. Liang, David A. Vorp1-8, Timothy K. Chung1,7
1 Department of Bioengineering, University of Pittsburgh, Pittsburgh, PA
2 Department of Mechanical Engineering and Materials Science, University of Pittsburgh, Pittsburgh, PA
3 McGowan Institute for Regenerative Medicine, University of Pittsburgh, Pittsburgh, PA
4 Department of Surgery, University of Pittsburgh, Pittsburgh, PA
5 Department of Chemical and Petroleum Engineering, University of Pittsburgh, Pittsburgh, PA
6 Department of Cardiothoracic Surgery, University of Pittsburgh, Pittsburgh, PA
7 Clinical and Translational Sciences Institute, University of Pittsburgh, Pittsburgh, PA
8 Magee-Womens Research Institute, University of Pittsburgh, Pittsburgh, PA
9 Department of Computer Science, University of Pittsburgh, Pittsburgh, PA
A comparison of Normaland Low-frequency extension accelerometry data in persons with chronic low back pain ........................... 62
Simran Kulkarni1, Kevin M. Bell1, Meenakshi Sundaram2 , Zakiy F. Alfikri3, Sara Piva 2 , John M. Jakicic 4, Carol M. Greco2
1 Human Movement and Balance Laboratory, Department of Bioengineering, University of Pittsburgh, Pittsburgh, PA
2 School of Health and Rehabilitation Science, Department of Physical Therapy, University of Pittsburgh, Pittsburgh, PA
3 Department of Bioengineering, University of Pittsburgh, Pittsburgh, PA
4 Division of Physical Activity and Weight Management, Department of Internal Medicine, University of Kansas, Lawrence, KS
Category Definitions
u Computational Research—using computational techniques to address a scientific question
Device Design—focusing on the development of a product or device
Experimental Research—using laboratory methods to achieve a novel overarching experimental aim
Methods—developing new techniques and tools for research and design
Other
Reversible, strong, stimuliresponsive hydrogel adhesion ..................... 66
Jake Laws1, Zefan Shao1, Qihan Liu1
1 Department of Mechanical Engineering and Materials Science, University of Pittsburgh, Pittsburgh, PA
Spatial analysis of pro-survival signaling as a function of tumor cellfibroblast distance in HER2+ breast cancer xenografts ....................................... 71
Joseph C. Long1, Matthew D. Poskus1, Ioannis Zervantonakis1,2
1 Tumor Microenvironment Engineering Laboratory, Department of Bioengineering, University of Pittsburgh, Pittsburgh, PA
2 UPMC Hillman Cancer Center, Pittsburgh, PA
Comparing fibroblast-mediated signaling mechanisms to separate effects influencing drug resistance in HER2+ breast cancer ................................ 76
Soham Mandal1, Matthew D. Poskus1, Ioannis Zervantonakis1,2
1 Tumor Microenvironment Engineering Laboratory, Department of Bioengineering, University of Pittsburgh, Pittsburgh, PA
2 UPMC Hillman Cancer Center, Pittsburgh, PA
u Thermophoretic effects on the removal of neutron poisons in nuclear thermal rocket fuel rods .................. 81
Paul McPartland1, Yonghee Kim2
1 Department of Mechanical Engineering and Materials Science, University of Pittsburgh, Pittsburgh, PA
2 Department of Nuclear and Quantum Engineering, Korea Advanced Institute of Science and Technology, Daejeon, Republic of Korea
Diabetes induces abnormal vessel remodeling in the vagina: implications in urogynecologic surgeries ..... 83
Sofia Milone1, Rui Liang1,2
1 Department of Bioengineering, University of Pittsburgh, Pittsburgh, PA
2 Department of Anesthesiology, Ohio State University, Columbus, OH
u Towards the development of synthetic ultrasound data for image classification of Obstructed Defecation Syndrome .................................. 86 Nalima Munyofu1, Ghazaleh Rostaminia 2 , Steven Abramowitch1
1 Department of Bioengineering, University of Pittsburgh, Pittsburgh, PA
2 Division of Urogynecology, NorthShore University HealthSystem, Chicago, IL
Tuning the compliance of small diameter vascular grafts using two biocompatible elastomers ........................... 90
Trin R. Murphy1, David R. Maestas, Jr.1, William R. Wagner1,2 , Sang-Ho Ye1,2 , Jonathan P. Vande Geest1,2
1 Department of Bioengineering, University of Pittsburgh, PA
2 McGowan Institute for Regenerative Medicine, Pittsburgh, PA
Cross-modal congruency effect as a measure for sensory feedback in lower limb amputees ................................... 94
Charles A. Oduro Jr.1,2 , Rohit Bose1,2,4, Lee Fisher1-3
1 Department of Bioengineering, University of Pittsburgh, Pittsburgh, PA
2 Rehab Neural Engineering Labs, University of Pittsburgh, Pittsburgh, PA
3 Department of Physical Medicine and Rehabilitation, University of Pittsburgh, Pittsburgh, PA
4 Department of Bioengineering, Case Western Reserve University, Cleveland, OH
Category Definitions
u Computational Research—using computational techniques to address a scientific question
Device Design—focusing on the development of a product or device
Experimental Research—using laboratory methods to achieve a novel overarching experimental aim
Methods—developing new techniques and tools for research and design
Other

Tissue reaction in response to biomimetic coating on parylene-C neural implants ........................................... 98
Yugma Patel1, Delin Shi1,3, Elaine M Robbins1,2 , Adrian Michael2 , Xinyan Tracy Cui1,2,3,4
1 Department of Bioengineering, University of Pittsburgh, Pittsburgh, PA
2 Department of Chemistry, University of Pittsburgh, Pittsburgh, PA
3 Center for the Neural Basis of Cognition, Pittsburgh, PA
4 McGowan Institute for Regenerative Medicine, Pittsburgh, PA
In vivo two-photon imaging of cerebral blood flow in small vessels of Alzheimer’s mice show decreases with age ................................... 104
Arushi Singh1, Yucheng Shen1, Noah Schweitzer1, Bistra Iordanova1
1 Department of Bioengineering, University of Pittsburgh, PA
Combating phantom limb pain (PLP): enhancing vibration therapy through feedback and prototype development ............................. 109
Norah Stivala1, Goeran Fiedler 2
1 Department of Bioengineering, University of Pittsburgh, Pittsburgh, PA
2 Department of Rehabilitation Science and Technology, University of Pittsburgh, Pittsburgh, PA
Effects of photoinhibition on material thickness using in-situ ultrasonic monitoring ................................. 115
Ryan Vidal1, Yiquan Wang1, Yue Zhang1, Xiayun Zhao1
1 Department of Mechanical Engineering and Material Science, University of Pittsburgh, Pittsburgh, PA
Tracking in a hypersonic flow through a rotating mirror system ................ 119
Jihao Zhang1, Lei Fang1,2,3
1 Department of Mechanical Engineering and Materials Science, University of Pittsburgh, Pittsburgh, PA
2 Department of Civil and Environmental Engineering, University of Pittsburgh, Pittsburgh, PA
3 Department of Bioengineering, University of Pittsburgh, Pittsburgh, PA
Category Definitions
u Computational Research—using computational techniques to address a scientific question
Device Design—focusing on the development of a product or device
Experimental Research—using laboratory methods to achieve a novel overarching experimental aim
Methods—developing new techniques and tools for research and design
Other

PhD
Although the term “Ingenium” may not be widely used, its meaning remains highly relevant today, especially in engineering. Ingenium refers to innate talent and potential –qualities that transcend time and place – that have always driven research and discovery: a tradition carried on by the student researchers showcased in the following pages. Their pursuit of knowledge, whether exploring new scientific frontiers or developing real-world solutions, captures the essence of Ingenium. We celebrate the timelessness of Ingenium and its ability to challenge the expanse of human potential.
On behalf of the Swanson School of Engineering and U.S. Steel Dean of Engineering Michele Manuel, I proudly present the eleventh edition of Ingenium: Undergraduate Research at the Swanson School of Engineering. This issue showcases the achievements the Swanson School’s exceptional undergraduate students and their 2024 summer research projects wherein they took the skills and knowledge gained in their coursework and applied them thoughtfully outside the classroom. They seized the opportunity to engage in scientific research and, in so doing, they have accomplished impressive academic and professional growth and development. The pages that follow highlight what can be accomplished when young researchers combine their talent with persistence, dedication, and a willingness to challenge themselves. Their contributions to the field of engineering demonstrate the potential of the next generation to drive the breakthroughs of tomorrow – and even today. By investing in such emerging talent, we ensure that innovation continues to thrive, strengthening our ability to shape a better future for all.
The student authors of the articles in this issue of Ingenium studied mostly under the guidance of faculty mentors in the Swanson School. At the conclusion of the summer research program, students were asked to submit abstracts summarizing the results of their research. These abstracts were reviewed by the Graduate Student Review Board (GSRB), and the authors of the highest-ranking abstracts were invited to submit full manuscripts for peer review by the GSRB for inclusion in this edition of Ingenium. Therefore, Ingenium serves as more than a record of our undergraduate student experience in research; it is also a practical experience for them in scientific writing and in the author’s perspective of the peer-review process. Additionally, it provides graduate students with an opportunity to experience the editorial review process and the reviewer’s perspective of the peer-review process.
I would like to acknowledge the hard work and dedication of the co-Editors-in-Chief of this issue of Ingenium, Lily Farmerie and Manyu Chadha, as well as the design team at AlphaGraphics and administrative help from Emily VonderPorten and Rose Gerber. This issue would not have been possible without the hard work of the graduate student volunteers who constitute the GSRB and who are listed by name in this issue. It is also altogether fitting to thank the faculty mentors and other coauthors of the reports included in this issue.
I hope that you enjoy reading this edition of Ingenium and that the many talents of our students inspire the engineers of the future.
Hail to Pitt!

David A. Vorp, PhD Sr. Associate Dean for Research & Facilities
John
A. Swanson Professor of Bioengineering
Swanson School of Engineering University of Pittsburgh


Greetings!
We are excited to present the 11th edition of Ingenium: Undergraduate Research at the Swanson School of Engineering (SSOE). Ingenium introduces undergraduate students to the scientific peer-review process, offering them the opportunity to enhance their research communication skills through the submission of written manuscripts. These manuscripts undergo review by Swanson School of Engineering (SSOE) graduate students, who volunteer to give comprehensive feedback. This process is mutually beneficial, allowing undergraduates to appreciate the reviewer’s viewpoint and gain insights into new subjects, while graduate students have the chance to impart their knowledge.
Moreover, Ingenium enables undergraduate students to engage deeply with established research methodologies through direct collaboration with PhD students and the guidance of faculty mentors. This invaluable experience prepares them for future professional endeavors, whether they aim to pursue further studies in graduate school or embark on a career in industry.
This volume features 24 articles from undergraduate students at the University of Pittsburgh’s SSOE, and students from other universities who participated in the SSOE summer undergraduate research internship program (SURI). This year’s articles show how the talents and hard work of these students provide new perspectives in relevant scientific topics being developed today. This year’s edition of Ingenium displays a sample of the diverse research that can be found in SSOE labs, and the opportunities undergraduate students are exposed to. We are so proud of all participating students for their creativity, critical thinking, hard work, and commitment to their research. We hope all authors, mentors, and reviewers share our excitement and pride and that you enjoy all articles as much as we did!
We would like to thank everyone on the production team of this year’s Ingenium volume. We deeply thank Dr. David Vorp, Senior Associate Dean for Research and Facilities, for his vision and continued commitment to this publication. We are also extremely grateful to Emily VonderPorten and Rose Gerber, for their advice, guidance, and continued support throughout the entire year. We also deeply appreciate all the mentors who guided the students’ research and the graduate students on the GSRB, for dedicating so much of their not-so-free time and sharing their knowledge to advise the authors. Finally, we would like to thank everyone in the Office of University Communications and Marketing and the AlphaGraphics team, especially Tracy Schneider and Mitchell Longstreth for their amazing work with the production and design of this Ingenium edition.
We have learned so much from everyone involved in this year’s Ingenium edition, and we are honored to have served as Co-Editors-in-Chief. It was truly a most rewarding experience to continue this Pitt SSOE tradition and to be part of a remarkable research community that invests in students and their academic and personal development. We hope that as you read this year’s articles, you let yourself be submerged in the wonderful research developments, as well as the passion and hard work shown by the authors.
Congratulations to the authors and happy reading!

Vimanyu Chadha, Co-Editor-In-Chief

Lily Farmerie, Co-Editor-In-Chief
* Co-editors-in-Chief
Gilgal Ansah Department of Bioengineering
Jackie Avila Department of Bioengineering
Adwoa Awuah Department of Bioengineering
Sophie Breedlove Department of Bioengineering
Lidya Canturk Department of Bioengineering
Lily Farmerie* Department of Bioengineering
Andrew Filipp Department of Bioengineering
Kyla Frenia Department of Bioengineering
Pete Geuldner Department of Bioengineering
Reyhaneh Gholami Department of Bioengineering
Sophie Hines Department of Bioengineering
Emani Hunter Department of Bioengineering
Bhavya Iyer Department of Bioengineering
Niloofar Jafari Department of Bioengineering
Kat Kerr Department of Bioengineering
Julie Kobyra Department of Bioengineering
Shuqi Liu Department of Bioengineering
Katarina Martinet Department of Bioengineering
Leon Min Department of Bioengineering
Tracey Moyston Department of Bioengineering
Temitope Obisesan Department of Bioengineering
Erin Parlow Department of Bioengineering
Danielle Pitlor Department of Bioengineering
May Pwint Department of Bioengineering
Andrea Sajewski Department of Bioengineering
Delin Shi Department of Bioengineering
Trevor Neece Department of Civil and Environmental Engineering
Arundhati Tewari Department of Civil and Environmental Engineering
Shengwen (Jenny) Ding Department of Electrical and Computer Engineering
John El Berch Department of Chemical and Petroleum Engineering
Mahmoud Elsayed Department of Industrial Engineering
Rie Huntington Department of Industrial Engineering
Patrick Lubenia Department of Industrial Engineering
Eyad Moria Department of Industrial Engineering
Tony Robol Department of Industrial Engineering
Prem Shenoy Department of Industrial Engineering
Luca Wrabetz Department of Industrial Engineering
Yamnesh Agrawal
Department of Mechanical and Materials Science
Yousra Bensouda Department of Mechanical and Materials Science
Vimanyu Chadha*
Department of Mechanical and Materials Science
Josh Frantz Department of Mechanical and Materials Science
Carter Gassler
Stephanie Liu
Andrew Stricklin
Department of Mechanical and Materials Science
Department of Mechanical and Materials Science
Department of Mechanical and Materials Science
Lily Armstrong1, Mehdi Ramezanpour1, Anne Robertson1,2
1Department of Mechanical Engineering and Materials Science, University of Pittsburgh, Pittsburgh, PA, 2Department of Bioengineering, University of Pittsburgh, Pittsburgh, PA
LILY ARMSTRONG
Lily is a fourth-year Mechanical Engineering student at the University of Pittsburgh with a strong interest in biomechanics and product design. She plans to enter the industry after graduation to gain experience before eventually pursuing a graduate degree.
MEHDI RAMEZANPOUR
Mehdi is a PhD candidate in Computational Modeling and Simulations at the University of Pittsburgh, where his research focuses on applying machine learning and computational modeling to investigate cardiovascular diseases. He specializes in advanced imaging techniques, such as micro-CT and multiphoton microscopy, to study vascular tissue biomechanics, with a particular emphasis on intracranial aneurysms and vascular calcifications. Mehdi has collaborated with institutions like the HarvardMIT Biomedical Engineering Center and Graz University of Technology, and his work has been published in peer-reviewed journals and presented at international conferences. His research aims to improve cardiovascular risk assessment and enhance patient outcomes through innovative biomedical imaging and analysis techniques.
ANNE ROBERTSON
Anne Robertson, PhD is a Distinguished Service Professor in the Department of Mechanical Engineering and Materials Science, a William Kepler Whiteford Professor of Engineering and the Associate Dean for Faculty Development. She is a current Fellow of the 2024-25 class of the Harvard Radcliffe Institute. Her research group explores the coupling between the physical structure and mechanical function of soft tissue organs such as arteries and the bladder and uses this knowledge to improve treatments of disease. Robertson co-directs an NIH-supported multi-institutional R01 program on cerebral aneurysms and a second NIH R01 program to develop a digital twin of the bladder. She is cofounding director of the Center for Faculty Excellence, which develops and implements programs to enhance the effectiveness



of junior faculty. She was honored as the 15th Elsevier Distinguished Lecturer in Mechanics.
We developed a reproducible ultrasound protocol which involves the development of the first digital twin of the bladder to accurately assess bladder morphology and volume in a rat model with bladder outlet obstruction (BOO). This protocol mitigates the operator bias in image acquisition, which is crucial for subsequent analysis of the impact of various treatments for BOO on bladder morphology.
Keywords: Bladder outlet obstruction (BOO), lower urinary tract symptoms (LUTS), ultrasound (US), benign prostatic hyperplasia (BPH), bladder morphology, digital twin, deep-learning segmentation, 3D reconstruction
Abbreviations: Bladder outlet obstruction (BOO), lower urinary tract symptoms (LUTS), ultrasound (US), benign prostatic hyperplasia (BPH)
Bladder outlet obstruction (BOO), often caused by benign prostatic hyperplasia (BPH) in men, restricts urine outflow by constricting the bladder outlet. While the bladder can initially adapt to increased pressure by increasing muscle mass, prolonged high pressures lead to progressive changes to the bladder wall which causes lower urinary tract symptoms (LUTS). Our research aims to develop the first digital twin of the bladder using data from a rat model to improve BOO treatments. Central to this objective is the reliability and consistency of in-vivo image acquisition. This study focuses on refining an ultrasound (US) protocol to ensure accurate and consistent measurements of bladder morphology and volume by evaluating the impact of probe pressure during the image acquisition process. We first tested the effects of high and low probe pressures on US imaging of a healthy rat bladder and then assessed reproducibility by performing scans three times with the minimal pressure we determined was optimal from
the first test. Results showed that high probe pressure significantly reduced bladder volume measurements by 34.4% and caused morphological variations. Thus, minimal probe pressure is recommended to avoid distortion. The reproducibility analysis confirmed that minimal probe pressure resulted in less than 4% variation in volume measurements, proving its reliability for accurate bladder monitoring in research settings.
Bladder outlet obstruction (BOO) is a pathological condition that constricts the outlet of the bladder and reduces the urine outflow. In men, the most common cause of BOO is benign prostatic hyperplasia (BPH), a non-cancerous enlargement of the prostate gland. Among men over 50, one-third will experience moderate to severe lower urinary tract symptoms (LUTS) due to BOO [1-2]. The symptoms comprise difficulty in the initiation of urination, a weak urinary stream, and incomplete bladder emptying, which can significantly impact life quality [2].
A complex dynamic interplay exists between increased resistance at the bladder outlet as a result of BOO and the bladder wall’s adaptive response to abnormal physiological conditions. In the early stages of BOO, the bladder is capable of increasing its muscle mass to generate sufficiently high pressures to overcome the rise in outlet resistance. However, this prolonged elevation in voiding pressures induces progressive changes to the bladder, causing LUTS, which can later result in chronic bladder dysfunction.
There are prostate surgeries to treat BOO, but unfortunately, 30% are ineffective. This highlights the need for improved management and treatment strategies that can better address the underlying mechanisms of BOO. In an ongoing research program, we are developing the first digital twin of the bladder to be used to design and test improved treatments for BOO. A digital twin is an in-silico model that can mimic the mechanical response of the bladder in its filling and voiding states. This enables us to study the mechanisms that lead to bladder pathological conditions like BOO. This model is based on data which is obtained from an established rat model with BOO. Ultrasound (US) measurements of the bladder are an important component to this data set. Performing US imaging on rat models has been introduced as an efficient and practical approach to investigate the bladder’s response to the different treatment approaches [3], as ultrasound imaging is a high-throughput in-vivo acquisition tool. We specifically use rat models in our study to perform these analyses as there are significant physiological similarities between rat and human bladders [4]. The focus of this study is to design a US protocol that enables consistent and reproducible bladder imaging, which is crucial for accurate in-vivo monitoring of bladder morphology and volume measurements.
We performed this investigation in two steps. In the first step, to assess the impact of probe pressure on US imaging we performed two imagings on a healthy rat, one with high amounts of probe pressure and one with low amounts of probe pressure. The objective was to determine the optimal pressure that is neither too high that leads to bladder deformation, nor too low to create significant imaging artifacts, affecting the visibility of the bladder in the output datasets. To quantify the morphology of the bladder we performed an objective analysis which relied on an iterative closest point (ICP) algorithm, to align each point-cloud (stl) geometries of the bladders and the Hausdorff distance (HDist) metric to access the differences between them. In the second step, to ensure the experiment’s reproducibility, we performed US imaging on a rat three times by implementing the minimal probe pressure we determined earlier. After performing each experiment, we utilized an in-house semi-automated deep-learning-based image segmentation tool to segment the bladder in the acquired US stacks [5]. Annotation of all the slices in the bladder US stack are time consuming and tedious, since there could be up to 300 individual slices for example, so, developing the semi-automatic segmentation tool allows us to take a couple manually annotated slices from the input stack to then learn the general characteristics of the region of interest (ROI) which is the rat bladder, to then predict the ROI border in slices with unclear borders. The semi-automatic segmentation model is trained to perform automatic segmentation on the remaining slices not manually marked from the same US stack. We then used an in-house 3D reconstruction tool to generate 3D models of the bladder for each experiment and calculate its measured volumes [5]. This is calculated by using the divergence theorem which converts the volume integration to surface integration, then by using mathematical formulation we can calculate the volume.
Figure 1 shows the results of the first experiment, which assessed the impact of probe pressure on rat bladder morphology and volume measurements. These results show that high probe pressure can result in a 34.4% reduction in bladder volume measurements compared to the low probe pressure. The morphology of the bladder obtained from the two US stacks also indicates substantial variations, indicating the necessity to perform rat ultrasound imaging tasks using minimal probe pressure. By using the approach of an objective analysis on bladder morphology, we can see that the HDist between the 3D models of the bladder using the low and high probe pressure seen in Figure 1 was equal to 3.808 units.

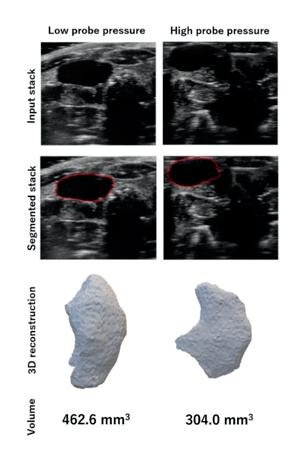
Fig. 1. The impact of probe pressure on bladder morphology and volume measurements. The input US stacks (first row), the segmentation results using the semi-automated segmentation tool (second row), bladder 3D reconstructions (third row), and volume measurements (last row).
Figure 2 shows the results of the reproducibility analysis. Repeating the US imaging for the rat’s full bladder resulted in less than 4% variations in the volume measurements compared to the average volume measurements among the three stacks. The HDist between the two 3D bladder models in the scan and rescan analysis from Figure 2 was less than 0.6 units.
In summary, the results from the first experiment highlighted the sensitivity of bladder shape to the amount of pressure applied during ultrasound imaging. Excessive pressure can alter bladder morphology, suggesting imaging should be performed with minimal probe pressure to avoid spurious bladder deformations. The second experiment demonstrated the reproducibility of bladder volume measurements when a low probe pressure was used, indicating ultrasound imaging, when performed with minimal probe pressure, is a reliable method for monitoring in-vivo bladder shape and volume in rats.
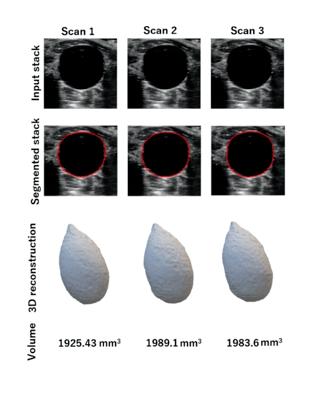
Fig. 2. Reproducibility analysis for bladder morphology and volume measurements considering minimal probe pressure. A rat bladder was imaged three times using ultrasound and 3D bladder models were generated following the performance of image segmentations on the input stacks.
Funding was provided by the Swanson School of Engineering and by the NIH number R01 DK133434.
[1] A. F. Awedew et al., “The global, regional, and national burden of benign prostatic hyperplasia in 204 countries and territories from 2000 to 2019: a systematic analysis for the Global Burden of Disease Study 2019,” Lancet Healthy Longev, vol. 3, no. 11, pp. e754–e776, Nov. 2022.
[2] Speakman, M., Kirby, R., Doyle, S. and Ioannou, C. Burden of male LUTS suggestive of BPH. BJU Int. 2015; 115: 508-519.
[3] Yang K, Wang Q. 50 week ultrasound imaging and ultrastructural abnormalities of bladder after sugar diuresis and diabetes mellitus in rats. Int Urol Nephrol. 2021 Oct;53(10):1995-2005. doi: 10.1007/s11255-02102911-w. Epub 2021 Jun 10. PMID: 34110574; PMCID: PMC8190992.
[4] Shen, J.-D.; Chen, S.-J.; Chen, H.-Y.; Chiu, K.-Y.; Chen, Y.-H.; Chen, W.-C. Review of Animal Models to Study Urinary Bladder Function. Biology 2021, 10, 1316. https://doi.org/10.3390/biology 10121316
[5] M. Ramezanpour, X. Jia, Y. Tobe, J. Cebral, A. M. Robertson. Phenotyping calcification in vascular tissues using artificial intelligence. https://arxiv.org/ abs/2401.07825.
Olivia Bartholomew1, Meagan Makarczyk1,2 , Sophie Hines1,2 , Hang Lin1,2,3
1 Department of Bioengineering, University of Pittsburgh, Pittsburgh, PA, 2 Department of Orthopedic Surgery, University of Pittsburgh, Pittsburgh, PA, 3 Orland Bethel Family Musculoskeletal Research Center, University of Pittsburgh, Pittsburgh, PA
OLIVIA BARTHOLOMEW
Olivia Bartholomew is a junior undergraduate student majoring in Bioengineering on the Cellular track. She is also obtaining a minor in Chemistry and a certificate in Conceptual Foundations of Medicine. Her research interests are in tissue engineering, with a focus on in vitro disease modeling and regenerative medicine. After graduation, she plans to attend graduate school and pursue a PhD in Biomedical Engineering to further her research and knowledge in the field.
MEAGAN MAKARCZYK
Meagan Makarczyk is a fifth-year PhD student in the Department of Bioengineering at the University of Pittsburgh. She completed her bachelor’s degree at Texas A&M in Biomedical Engineering in 2020. Following graduation, she aspires to pursue a postdoctoral position and run her own lab studying musculoskeletal pain.
SOPHIE HINES
Sophie Hines is a second-year Bioengineering PhD student at the University of Pittsburgh, with a specific interest in tissue engineering and regenerative medicine. Before her enrollment in the PhD program, she completed her bachelor’s at the Indiana University of Pennsylvania in biology. Following graduation, she started working as a lab tech in Dr. Lin’s lab and then earned her master’s degree in biomedical sciences with the University of Pittsburgh School of Medicine. Sophie’s research focuses on the difference between healthy aging of joints and trying to elucidate the mechanisms that link this to age-related diseases such as osteoarthritis.
DR. HANG LIN
Dr. Hang Lin, PhD is an Associate Professor in the Department of Orthopaedic Surgery & Bioengineering at the University of Pittsburgh. He received his BS in Biochemistry from Nanjing University and his PhD in Cell Biology from




the Institute of Genetics and Developmental Biology of the Chinese Academy of Sciences. He has published over 100 peer-reviewed articles (H-Index: 48). Dr. Lin’s research goal is to apply the latest biological knowledge and state-ofthe-art technology in orthopaedic research and translate the research findings into effective treatments for joint diseases. There are three integrated projects ongoing in his lab (https://www.linlab.pitt.edu/): investigating the association between aging and osteoarthritis; establishing an in vitro microphysiological model for OA pathogenesis study and drug development; and testing regenerative therapy for treating cartilage injury. Dr. Lin is the Grants & Programs Director of the Orland Bethel Family Musculoskeletal Research Center (BMRC). He serves as the co-chair of the Orthopaedic Research Society (ORS) Biomaterials Topic and is the Communication Committee chair of the International Chinese Musculoskeletal Research Society (ICMRS). He is also an associate editor in Frontiers in Cell and Developmental Biology and an editorial board member of Osteoarthritis and Cartilage Open. He has received funding from the NIH, DOD, PA-CURE, and foundations to support his research.
Recent findings highlight the biochemical link between obesity and osteoarthritis. A 3D iPSC-derived adipose tissue model was developed to replicate obesitylike phenotypes and investigate obesity-driven joint degeneration. The model can also be used to test therapeutic strategies for obesity-associated osteoarthritis and advance translational research.
Keywords: Obesity, Stem Cells, Inflammation, Osteoarthritis
Abbreviations: Osteoarthritis (OA), Induced pluripotent stem cells (iPSCs), Induced multipotent progenitor cells (iMPCs), Sodium Palmitate (NaPA)

Osteoarthritis (OA) is a debilitating joint disease, and obesity represents one of the major risk factors. In addition to increased mechanical loading to the knee joint due to obesity, pro-inflammatory cytokines secreted by hypertrophic adipose tissue also play a key role. Current in vitro models fail to fully replicate obesity-associated changes in adipose tissue and their impact on OA. Due to physiological disparities, animal models are limited, and the translational success of therapeutics for OA has been low. To address this gap, we aimed to develop a three-dimensional (3D) adipose tissue model derived from human-induced pluripotent stem cells (iPSCs) to study obesity-associated OA and test therapeutic interventions.
In this study, iPSCs were successfully differentiated into adipocyte-like cells, confirmed by upregulated gene expression of adipose-specific markers, such as adiponectin and peroxisome proliferator-activated receptor gamma 2, and deposit of lipid drops in cells. An obesity-like phenotype was then induced using sodium palmitate (NaPA), which elevated inflammatory gene expression in adipocytes, including interleukins (IL)-6, IL-8, and IL-1β, while preserving fat phenotype, and promoting the accumulation of lipid droplets. In addition, metformin treatment decreased the expression of adipogenic genes in the obese-like tissues, but not in control tissues. Following treatment obese-like tissues saw reduced inflammation, particularly, IL-1β, highlighting its potential as a therapeutic to reduce the upregulation of adipogenic markers, in turn decreasing the expression of inflammatory gene IL-1β
This model provides a unique platform for investigating obesity-associated OA, replicating inflammation created by obese adipocytes, and evaluating therapeutic agents. Future directions include co-culturing adipose and joint cells to study intercellular communication and testing additional interventions for managing obesity-associated OA. These findings contribute to advancing in vitro modeling for understanding obesity-associated OA and developing targeted treatment strategies.
Osteoarthritis (OA) is a debilitating condition impacting millions worldwide, leading to chronic pain and reduced physical function [1]. Common symptoms include pain, stiffness, decreased flexibility, grating sensations, bone spurs, and swelling [1]. Several risk factors are associated with OA, including biological sex, age, genetics, obesity, and joint injuries [2].
Obesity significantly elevates the risk of developing OA, with a Body Mass Index (BMI) of 30 or higher being a critical factor [3]. The mechanisms underlying this connection are not fully understood, but it is known that obese adipose tissue releases pro-inflammatory cytokines, such as interleukins (IL)-6, IL-8, and IL-1β, which can intensify joint inflammation and degeneration,
thereby contributing to OA [4]. Understanding the role of adipose tissue associated inflammation in OA is crucial for developing effective treatments.
Existing therapeutic strategies for OA primarily focus on symptom management through pain relief, weight loss interventions, and, in severe cases, surgical procedures such as joint replacement [5]. However, emerging research suggests that repurposing metabolic drugs, like metformin, may offer disease-modifying benefits. Metformin, commonly used to treat type 2 diabetes, has demonstrated anti-inflammatory and chondroprotective effects, potentially slowing OA progression by reducing systemic inflammation and modulating cellular metabolism [6]. Investigating its impact on obesityassociated OA could lead to novel, non-invasive treatment options.
Traditional two-dimensional (2D) monolayer cultures fail to accurately replicate the phenotypes of native adipocytes and their environments [7]. While animal models have been extensively used to study the link between OA and obesity, they are limited by ethical concerns and low translational success [8]. Additionally, while primary adipose tissue derived from patients offers direct physiological relevance, its application is limited by donor variability, ethical concerns, and challenges in scalability for controlled experiments [9].
Current in vitro models investigating the role of hypertrophic adipose tissue on cartilage inflammation are limited, therefore this project aims to establish a threedimensional (3D), physiologically relevant adipose tissue and then induce adipocyte hypertrophy to mimic the changes seen in obesity. Induced pluripotent stem cells (iPSCs), derived from adult somatic cells, present a novel approach due to their ability to differentiate into various cell types and mimic disease phenotypes in vitro [10]. Unlike embryonic stem cells (ESCs), iPSCs bypass ethical concerns and offer theoretically unlimited proliferation potential compared to mesenchymal stem cells (MSCs) [11]. Developing obese adipose-like tissues from iPSCs can provide a modeling platform to deepen our understanding of obesity-associated OA as well as support the development of targeted therapies.
2.1
Human induced pluripotent stem cells (iPSCs) were initially differentiated into induced multipotent progenitor cells (iMPCs) and cultured until passage 5 (P5) as established by previous protocols from the Lin Lab [7, 12]. The process of iMPC differentiation into adipose tissue occurs in two steps, the first is a three-day monolayer treatment with a supplemented medium containing Endothelial Cell Growth Basal Medium-2 (EBM-2, Lonza, Walkersville, MD), Fetal Bovine Serum (FBS, Life Technologies, Carlsbad, CA), Antibiotics-
Antimycotics (Life Technologies), SB431542 ALK inhibitor (Abcam, Cambridge, MA), L-Ascorbic acid 2-phosphate sesquimagnesium salt hydrate (Sigma-Aldrich, St. Louis, MO), hydrocortisone (Sigma-Aldrich), EGF (Thermo Fisher Scientific, Waltham, MA), 3-Isobutyl-1-methylxanthine (IBMX, Sigma-Aldrich), dexamethasone (Sigma-Aldrich), 3,3′,5-Triiodo-L-thyronine sodium salt (T3, Sigma-Aldrich), Insulin-Transferrin-Selenium-Ethanolamine (ITS, Gibco/ Thermo Fisher Scientific), and Rosiglitazone (SigmaAldrich) with a media change occurring on the second day of differentiation.
Following those three days, the iMPCs were then encapsulated into three-dimensional (3D) tissue constructs by ultraviolet photo-crosslinking of 15% methacrylated gelatin (GelMA) with 0.15% lithium phenyl-2,4,6-trimethylbenzoylphosphinate (LAP) for 30 seconds. These iMPC constructs were subsequently differentiated into adipose tissue using established protocols [13]. A new medium composed of EBM-2 (Lonza), FBS (Life Technologies), Antibiotics-Antimycotics (Life Technologies), SB431542 ALK inhibitor (Abcam), L-Ascorbic acid 2-phosphate sesquimagnesium salt hydrate (Sigma-Aldrich, St. Louis, MO), hydrocortisone (Sigma-Aldrich), EGF (Thermo Fisher Scientific, Waltham, MA), 3-Isobutyl-1-methylxanthine (IBMX, Sigma-Aldrich), Insulin-Transferrin-Selenium-Ethanolamine (ITS, Gibco/ Thermo Fisher Scientific), and Rosiglitazone (SigmaAldrich) for an additional 21 days. Media changes occurred every two days throughout the differentiation process.
2.2 Creation of an Obese-like Phenotype using Palmitic Acid
The differentiation process was completed at the day 24 timepoint, and the adipose tissue constructs were then treated with sodium palmitate (NaPA, Sigma-Aldrich), a salt derived from Palmitic Acid, to induce an obese-like phenotype. The NaPA mixture was made using 100 mM Sodium Palmitate (Sigma-Aldrich) and 70% methanol (Thermo Fisher Scientific) solvent dissolved in a 50 ° C oven for an hour. The NaPA at 350 m M was added to growth media (GM, Dulbecco’s Modified Eagle Medium/ Nutrient Mixture F-12, Gibco/Thermo Fisher Scientific), 10% FBS (Life Technologies), 1% Antibiotics-Antimycotics (Life Technologies), with 1g/100mL bovine serum albumin (BSA, Thermo Fisher Scientific). The mixture was placed in an incubator and shaken at 37 ° C until dissolved and then filtered. Prior to the introduction of the NaPA containing media, constructs were rinsed with Phosphate buffered Saline (PBC, Gibco/Thermo Fisher Scientific). For a successful induction of the hypertrophic phenotype associated with obesity, the NaPA-supplemented GM was applied to the adipose tissue constructs until day 45, with media changes occurring every two days.
At the day 45 timepoint, after inducing an obeselike phenotype in the adipose tissue constructs, the constructs were treated with metformin to investigate its therapeutic effects. Metformin (Sigma-Aldrich) was
used at a concentration of 0.05 mM, and was added into GM, both with and without sodium palmitate, for a total treatment period of 14 days. Prior to metformin treatment, constructs were rinsed with PBS (Gibco/Thermo Fisher Scientific) and media changes, including fresh metformin supplementation, were performed every two days until day 59.
Gene expression levels were quantified using the ΔΔCt method for real time quantitative polymerase chain reaction (RT-qPCR) analysis, with Glyceraldehyde-3phosphate dehydrogenase (GAPDH ) serving as the housekeeping gene for normalization. This method allows for the relative comparison of target gene expression between experimental groups, using the formula 2−ΔΔCt to calculate fold changes. The expression levels were then normalized against the control group to ensure consistent baseline comparisons across all samples.
Lipid accumulation in adipose tissues was evaluated using Oil Red O staining (Sigma-Aldrich), a histological method that selectively stains lipid droplets. The hallmarks of adipocytes are the large lipid droplets within the cells that are stained red with Oil Red O. For tissues that are undifferentiated, there will be minimal staining in the cell body. Furthermore, obese tissues adopt a hypertrophic phenotype, directly meaning an enlarged cell body, caused by lipid droplet accumulation. Under Oil Red O staining, the NaPA treated cells should have a larger cell diameter compared to the untreated control. To quantify cell enlargement, imageJ was used to measure cell diameter. Statistical analysis of gene expression data was conducted using appropriate tests for each comparison. For control versus obese groups, a Welch’s unpaired t-test was performed, with a significance level set at p < 0.05 To evaluate the effects of metformin treatment, a BrownForsythe and Welch ANOVA test was employed, followed by Dunnett’s post-hoc test, also with a significance level of p < 0.05. Standard deviations were corrected in all analyses.
The differentiation of iMPCs into adipocytes was confirmed through RT-qPCR and Oil Red O staining. The results demonstrated that the differentiation of iMPC constructs into adipocytes was successful, as indicated by the significant upregulation of adipose-specific markers. Notably, adiponectin (ADIPOQ), a hormone mainly secreted by adipose tissue, C-terminal binding protein 2 (CtBP2), a protein that regulates lipid homeostasis, adipsin, lipoprotein lipase (LPL), and peroxisome proliferatoractivated receptor gamma 2 (PPARG-2), known for its adipose-specific expression, were significantly elevated in the constructs treated with the adipogenic medium (Figure 1b).

Oil Red O staining was used to visually assess lipid droplet formation, providing further validation of successful adipocyte differentiation. Differentiated constructs displayed robust staining compared to non-differentiated controls, which exhibited negligible staining (Figure 1c)
3.2 Effect of Palmitic Acid on Adipocytes
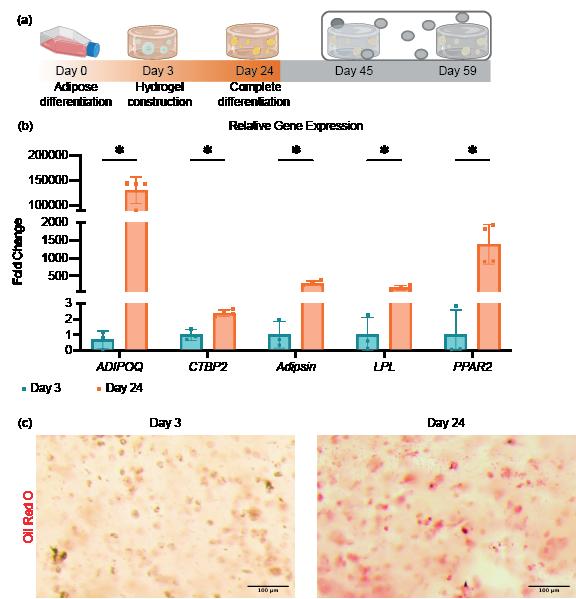
Figure 1: Differentiation of iMPCs into Adipose Tissue Over 24 Days. Comparison of iMPC-derived adipose tissue at Day 3 (undifferentiated) and Day 24 (differentiated) after adipogenic medium treatment. (a) Timeline showing experiment progression and current stage. (b) RT-qPCR assessing adipose-specific markers, adiponectin (ADIPOQ), C-terminal binding protein 2 (CtBP2), adipsin, lipoprotein lipase (LPL) and peroxisome proliferator-activated receptor gamma 2 (PPARG-2), confirming successful differentiation. *, p<0.05. (c) Oil Red O staining demonstrating lipid droplet formation in differentiated tissues, validating adipocyte maturation.
The sodium palmitate treatment successfully induced obesity-like changes in adipocytes, as demonstrated by RT-qPCR and Oil Red O staining. RT-qPCR analysis showed that adipose-specific markers, such as adiponectin (ADIPOQ), adipsin, LPL, and PPARG-2, continued to be significantly upregulated in the obese-like tissues, indicating the preservation of the adipose differentiation and the genetic promotion of lipid droplet accumulation. In addition, inflammatory markers, including IL-8, IL-6, and IL-1β, were significantly elevated in obese-like tissues compared to the control, reflecting the pro-inflammatory effects of sodium palmitate (Figure 2b)
Oil Red O staining increased lipid droplet accumulation in obese-like tissues, with significantly larger cell diameter observed compared to controls (Figure 2c) These findings
indicate that the sodium palmitate treatment successfully induced an obesity-like phenotype in the adipocytes, characterized by heightened inflammation and enhanced lipid storage, while preserving key adipose characteristics.
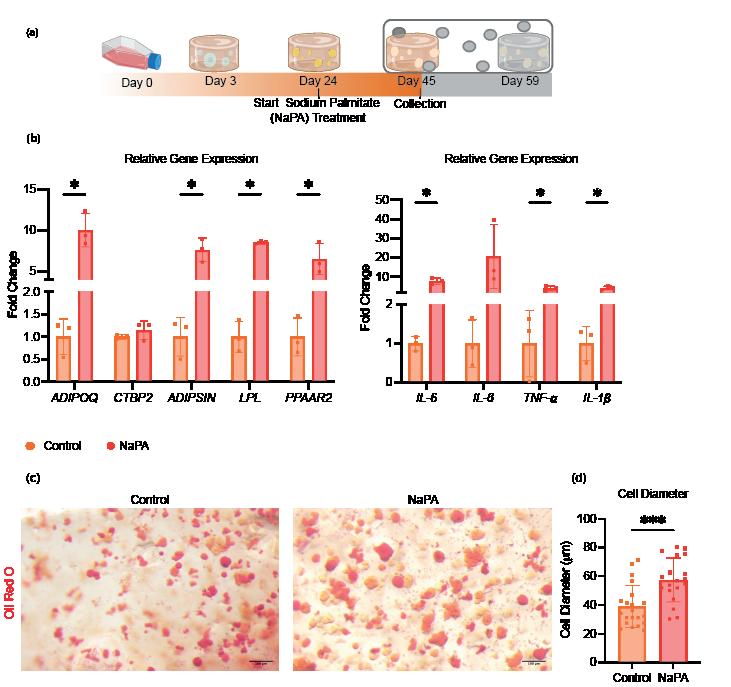
Figure 2: Assessment of Sodium Palmitate Treatment on Adipose Tissue Derived from iMPCs. Comparison of iMPC-derived adipose tissue cultured in adipogenic medium alone (control), or adipogenic medium supplemented with sodium palmitate (NaPA) for 21 days. (a) Timeline showing experiment progression and current stage. (b) RT-qPCR assessing adipose-specific markers, adiponectin (ADIPOQ), C-terminal binding protein 2 (CtBP2), adipsin, lipoprotein lipase (LPL), peroxisome proliferator-activated receptor gamma 2 (PPARG-2), and inflammatory markers, interleukin-6 (IL-6), interleukin-8 (IL-8), Tumor necrosis factor alpha (TNF- α ) and interleukin-1β (IL-1β) to evaluate the induction of an obese-like phenotype. (c) Oil Red O staining demonstrating increased lipid droplet size in sodium palmitatetreated adipose tissues compared to controls. *, p<0.05; ***, p<0.001.
The treatment of obese and normal adipose tissues with metformin demonstrated a reduction of adipokines in the obese-like tissues, but not in the treatment control group, as shown by RT-qPCR. Furthermore, the expression of IL-1β, was decreased in the obese-like group treated with metformin indicating that the reduction of adipogenic gene expression might play a role in the down regulation of IL-1β. However, the expression of IL-6 and IL-8 was not significantly changed between the two obese-like groups (Figure 3b)
Oil Red O staining shows that cell diameter did not change, therefore lipid droplet accumulation was relatively unchanged between the obese and metformintreated obese groups, with no reduction in droplet size or number (Figure 3c). This result indicated that metformin does not alter lipid storage, thus preserving the adipocyte differentiation.
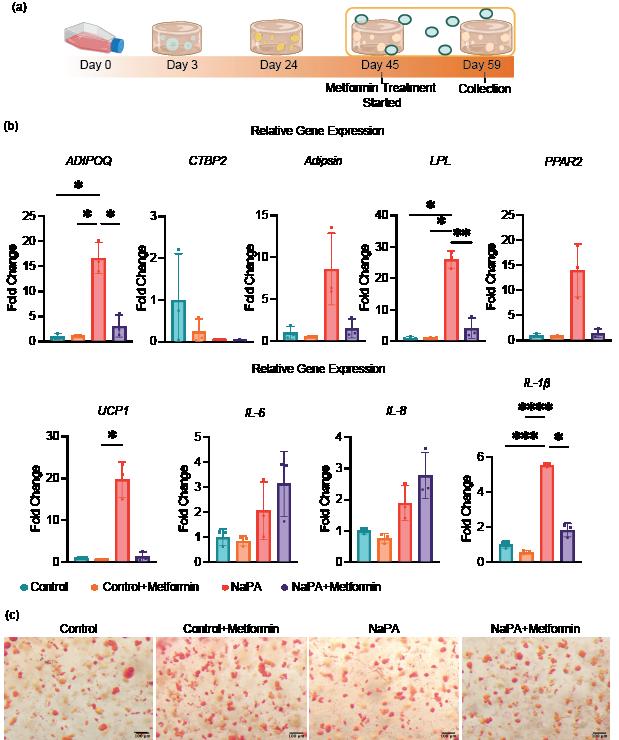
Figure 3: Effect of Metformin Treatment on Obese-Like Adipose Tissue Derived from iMPCs. Day 56 iMPC-derived adipose tissue after 21 days of differentiation, 21 days of sodium palmitate (NaPA) treatment, and 14 days of 0.05 mM metformin treatment. (a) Timeline showing experiment progression and current stage. (b) RT-qPCR assessing adipose-specific markers, adipsin, adiponectin (ADIPOQ), C-terminal binding protein 2 (CtBP2), lipoprotein lipase (LPL), peroxisome proliferator-activated receptor gamma 2 (PPARG-2), and inflammatory markers, interleukin-6 (IL-6), interleukin-8 (IL-8) and interleukin-1β (IL-1β) to evaluate metformin’s effects on inflammation and adipose differentiation. (c) Oil Red O staining assessing lipid droplet accumulation to confirm the preservation of adipose tissue characteristics. *, p<0.05; **, p<0.01; ***, p<0.001, ****, p<0.0001.
The successful differentiation of iMPC gels into adipocytes, as shown by RT-qPCR and Oil Red O staining, underscores the utility of iPSCs as a reliable platform for modeling adipose tissue. The significant upregulation of adipose-specific markers, such as adiponectin (ADIPOQ) and PPARG-2, confirms the efficacy of the adipogenic differentiation protocol and the ability to replicate key features of mature adipocytes in vitro
The induction of an obesity-like state in adiposelike tissues with NaPA successfully replicated the physiological changes associated with obesity, including increased lipid accumulation and elevated inflammatory gene expression such as IL-6, IL-8, and IL-1β. This
model preserves adipose differentiation while inducing inflammation, providing a valuable system for studying the metabolic and inflammatory characteristics of obesity and their role in osteoarthritis. These findings highlight the potential of 3D adipose-like tissue models to investigate the interplay between obesity and OA, particularly in understanding how pro-inflammatory adipokines contribute to joint degeneration.
Metformin treatment demonstrated a down regulation of adipogenic markers in the obese-like group and not the controls, indicating its effectiveness in regulating adipogenic gene expression while also preserving the adipogenic phenotype. Additionally, due to the reduction in adipogenic gene expression, similar to that of healthy control levels, IL-1β expression in metformin-treated obese-like tissues was also reduced. There were no changes in cell diameter indicated by Oil Red O staining observed, suggesting that while metformin did reduce adipogenic gene expression, lipid droplet size was not altered.
While the observed trends in some adipose markers and inflammatory markers support metformin’s effects, additional trials with larger sample sizes are needed to enhance the statistical significance of these findings and to provide a more robust understanding of metformin’s role in modulating inflammation and preserving adipose functionality in obese-like tissues. Additionally, the optimal timepoint of metformin treatment to reduce the expression of IL-6 and IL-8 should be investigated.
Future directions for this research include co-culturing obese-like adipose tissues with various cell types aiming to recreate the in vivo environment, enabling the study of intercellular communication within joint tissues. Additionally, testing a broader range of therapeutic compounds may uncover novel strategies for addressing obesity-associated OA.
In this study, iPSC-derived adipose tissue was successfully differentiated, as evidenced by the upregulation of adipose-specific markers and lipid accumulation. An obesity-like phenotype was effectively induced using NaPA, demonstrating increased inflammation while preserving adipose characteristics. Additionally, metformin treatment showed potential for reducing inflammation in obese fat tissues without altering lipid storage or adipose functionality. These findings establish a robust model for investigating obesity-related conditions and evaluating therapeutic interventions.
This research was conducted with the support from the NIH (R01AR082386-A1), as well as the University of Pittsburgh Swanson School of Engineering, specifically as part of their Summer Undergraduate Research Internship (SURI).

[1] Mayo Clinic, “Osteoarthritis,” Mayo Clinic, 2021. https://www.mayoclinic.org/diseases-conditions/ osteoarthritis
[2] Osteoarthritis Action Alliance, “OA pathogenesis and risk factors,” Osteoarthritis Action Alliance, 2023. https://oaaction.unc.edu/oa-module/oa-pathologyand-risk-factors
[3] World Health Organization, “Obesity and overweight,” World Health Organization, 2021. https://www.who. int/news-room/fact-sheets/detail/obesity-andoverweight
[4] Makki, K. et al., “Adipose tissue in obesity-related inflammation and insulin resistance: cells, cytokines, and chemokines,” ISRN Inflamm, vol. 2013, 2013, doi: 10.1155/2013/139239.
[5] M. J. Makarczyk et al., “Current Models for Development of Disease-Modifying Osteoarthritis Drugs,” Tissue Eng Part C Methods, vol. 27, no. 2, pp. 124-138, Feb 2021, doi: 10.1089/ten.TEC.2020.0309.
[6] T. Zhang, L. Zhou, M. J. Makarczyk, P. Feng, and J. Zhang, “The Anti-Aging Mechanism of Metformin: From Molecular Insights to Clinical Applications,” Molecules, vol. 30, no. 4, p. 816, 2025. [Online]. Available: https://www.mdpi.com/14203049/30/4/816.
[7] Bahmad, H. F. et al., “3D culture models to study adipose tissues: emerging insights,” Cells, vol. 9, no. 10, p. 2326, 2020, doi: 10.3390/cells9102326.
[8] Xiang, S. et al., “Novel insights into the biochemical correlation of obesity and osteoarthritis,” Clin Transl Med, vol. 12, no. 1, p. 1112, 2022, doi: 10.1002/ ctm2.1112.
[9] T. Luca, S. Pezzino, S. Puleo, and S. Castorina, “Lesson on obesity and anatomy of adipose tissue: new models of study in the era of clinical and translational research,” J Transl Med, vol. 22, no. 1, p. 764, Aug 14 2024, doi: 10.1186/s12967-024-05547-3.
[10] V. K. Singh, M. Kalsan, N. Kumar, A. Saini, and R. Chandra, “Induced pluripotent stem cells: applications in regenerative medicine, disease modeling, and drug discovery,” Front Cell Dev Biol, vol. 3, p. 2, 2015, doi: 10.3389/fcell.2015.00002.
[11] K. Thanaskody, A. S. Jusop, G. J. Tye, W. S. Wan Kamarul Zaman, S. A. Dass, and F. Nordin, “MSCs vs. iPSCs: Potential in therapeutic applications,” Front Cell Dev Biol, vol. 10, p. 1005926, 2022, doi: 10.3389/ fcell.2022.1005926.
[12] McCarthy, M. et al., “Human adipose-derived stem cells for tissue engineering applications: a systematic review,” Tissue Eng Part B Rev, vol. 26, no. 6, pp. 586–600, 2020, doi: 10.1089/ten.teb.2020.0120.
[13] Hafner, A. L. et al., “3D bioprinting to create adipose tissues for research and regenerative medicine applications,” Sci Rep, vol. 6, no. 1, p. 32490, 2016, doi: 10.1038/srep32490.
Brian Bartley1, Galen Holland2 , William Smith2 , Rakié Cham3, Alessandro Fascetti3,4
1Department of Electrical and Computer Engineering, University of Pittsburgh, Pittsburgh, PA, 2Department of Ophthalmology, University of Pittsburgh, Pittsburgh, PA, 3Department of Bioengineering, University of Pittsburgh, Pittsburgh, PA, 4Department of Civil and Environmental Engineering, University of Pittsburgh, Pittsburgh, PA
BRIAN BARTLEY
Brian Bartley is a junior majoring in Electrical and Computer Engineering at the University of Pittsburgh. He hopes to further his work and interest in virtual reality through graduate studies and continued research in the field.
GALEN HOLLAND, MS
Galen Holland, MS, is a Senior Research Engineer in the Department of Ophthalmology at the University of Pittsburgh. Her research focuses on assessing functional performance of daily living activities in vision loss populations, as well as development of tools and interventions to help improve function in these groups.
WILLIAM SMITH, OD
William Smith, OD, is an optometrist with advanced training in the area of low vision rehabilitation. He is the Director of Low Vision Services at the UPMC Vision Institute, and an Assistant Professor of Ophthalmology at the University of Pittsburgh. His research focuses on AR/VR technologies as tools for low vision intervention and rehabilitation, as well as assessing functional impact of advanced optical devices for patients with moderate to profound vision loss.
RAKIÉ CHAM, PHD
Rakié Cham, PhD is a Professor of Bioengineering, Ophthalmology and Physical Therapy at the University of Pittsburgh. She is also the co-director of the Pittsburgh StreetLab at the Vision Institute UPMC Mercy. Dr. Cham’s interests are focused on gross (e.g. mobility) and fine (e.g. eye-hand coordination) motor tasks in healthy and clinical populations with a special interest in individuals with vision loss. She collaborates with a multidisciplinary team of investigators including engineers, clinicians, rehabilitation experts, neuroscientists and mental health experts.



ALESSANDRO FASCETTI, PHD
Alessandro Fascetti, PhD is an Assistant Professor and Roberta Luxbacher Faculty Fellow in the Department of Civil and Environmental Engineering at the University of Pittsburgh. His research revolves around the definition of novel computational tools for the deployment of Digital Twins of complex systems, in the context of design optimization and operational maintenance.
Traditional visual field testing introduces several challenges associated with patient discomfort, limited test versatility, and operator dependency. This paper presents the development of a novel virtual environment that offers an innovative solution to these challenges, with promising results that demonstrate potential for both replicability and enhanced patient experience.
Keywords: Virtual Reality, Visual Field Testing, Gaze Tracking, Accessibility
Abbreviations: Visual Field (VF), Virtual Reality (VR), Extended Reality (XR), Head Mounted Display (HMD), Field of View (FOV)

This paper presents a virtual reality (VR)-based solution to address the issues of traditional kinetic visual field testing, which has been plagued by patient discomfort, inflexibility of machine maintenance and maneuverability due to underlying mechanical complications, and operator dependency. By replacing the physical equipment with digital, software-based solutions, the virtual environment brings the potential to eliminate many of these logistical and mechanical challenges. The developed VR application uses Unity as its platform and the Varjo XR-4 Aero as its head-mounted display (HMD) to replicate the Goldmann visual field test, allowing for the incorporation of advanced features such as gaze tracking to monitor patient compliance. Other benefits include reducing test time through automation, increasing accessibility for patients with mobility impairments, and enabling testing from more comfortable environments such as the patient’s home. Additionally, the system’s integration of gaze tracking allows for real-time detection of irregularities, which could ensure accurate results and reduce the likelihood of false positives or negatives. Preliminary testing demonstrates feasibility and sensitivity of the system, by comparison of results from a healthy and visually impaired patient. Despite the promising advantages of the virtual model, some limitations remain, including field-of-view (FOV) constraints and the need for device-specific adaptations for gaze tracking. Nonetheless, the application demonstrates the potential of VR to streamline the testing procedure, enhance patient comfort, and improve the overall efficiency of visual field assessments. Future work will focus on expanding compatibility across different devices, pursuing larger scale testing, and addressing current limitations to enhance the system’s effectiveness.
Recent advancements in VR and the growing availability of HMDs have allowed several studies to explore the feasibility of replacing physical VF tests with virtual ones. The difference between this paper and other relevant literature lies within the type of test being simulated, with this paper focusing on kinetic perimetry (Goldmann) as opposed to static perimetry (Humphrey, Octopus 900). The HMD technology used in the development of this virtual model, the Varjo XR-4 Aero, also offers distinct advantages over alternative headsets, enabling a broader range of applications and capabilities. Most notably, it introduces novel opportunities to tackle challenges associated with the traditional physical testing equipment, such as fixation loss and intentional gaze aversion, which can lead to errors or false positives in the execution of these tests. In one study, J. Stapelfeldt et al. investigated the comparability between the static Octopus test and one of their own virtual models on an Oculus Quest VR. With a maximum horizontal FOV of around 89° compared to the XR-4 Aero’s 120°, the Oculus Quest eliminates a significant portion of VF data. Even with that loss, they
deduced the Quest has potential for assessing visual fields with high confidence, making it a viable alternative for perimetry, especially in terms of portability and accessibility. Correlation coefficients (r=0.77, p<0.00001), (r=0.50, p<0.001), and (r=0.70, p<0.0001) for all patients, healthy, and glaucoma patients, were respectively found [1]. In a similar study, S. Tsapakis et al. uses an even more limited form of VR – one with no HMD, using only a 6-inch smartphone and glasses for display. Still, they were able to find a high correlation coefficient (r=0.808, P<0.0001) between the VR test and the static Humphrey test [2]. This implies high potential for VR environments to be employed to simulate VF testing procedures. In a different study, P. Narang et al. attained a strong functional correlation between an Advanced Vision Analyzer’s (a custom HMD) Elisar Standard Algorithm and the Humphrey’s Swedish Interactive Threshold Algorithm. One focus of their paper is the portability of the whole system, with components that are compact enough to fit entirely inside of a backpack [3]. For the Goldmann test that is replicated later in this paper, portability is just as important. In the physical test, patients have to maintain a fixed, upright position for extended periods of time. The portability of the Varjo XR-4 Aero (although not a functional standalone like the Advanced Vision Analyzer) allows for the program to be used in any location where a compatible computer is available. This allows certain patients who were previously unable to use the physical machinery, such as those who are wheelchair-bound, to now participate by simply wearing the headset in a comfortable setting. There are some studies that further promote portability of VR VF tests by pushing for cheaper costs and more widespread availability, like P. Kunumpol et al.’s work and its focus on making its GaluCUTU VR suitable for developing countries such as Thailand [4].
One feature of the Varjo XR-4 Aero that is not available in any of the aforementioned studies is the gaze-tracking capability, which is integrated into the program and directly accessible to the proctor. This feature enables immediate detection of irregularities in the data, allowing for prompt retesting, or for formal assessment of noncompliance. This could ensure more accurate results and reduce the likelihood of false positives. As Z. K. Chia et al. elaborate on with their own Vivid Vision Perimetry (another VR based VF test), VF tends to be one of the least popular tests to run in clinics, which the researchers hypothesize is due to the patients’ need to suppress their foveation reflex. Additionally, these researchers note that future versions of VVP will utilize gaze tracking for better assessment of fixation [5].
2.1
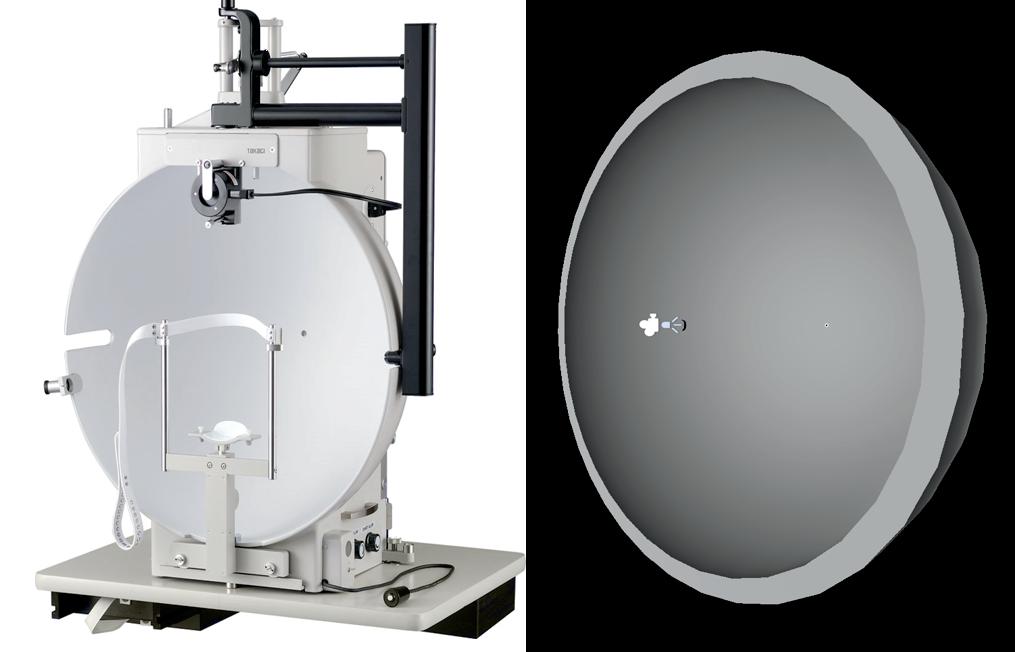
As seen in Figure 1, the physical Goldmann test employs a large hemispheric dome as the backdrop for the patient’s field of view, with additional head support to ensure consistent positioning during the exam. During the test,
a proctor manipulates a mechanical arm that controls a light target, adjustable in both size and luminosity. The proctor adjusts these parameters dynamically to customize the tests according to the patient’s specific visual thresholds. By recording the responses of the patient and systematically moving the light along the degree lines of the bowl, the proctor can delineate the isopters (i.e., the visual threshold points) that define the extent of the patient’s field of view. If the patient has a late response or the proctor notices a loss in focus, that point is generally retested. Figure 2 shows the main window in which the proctor visualizes the virtual implementation of this process, which inherits most of its interface from the physical counterpart.
For the work presented herein, Unity was selected as the development platform due to its robust VR compatibility and comprehensive documentation. All scripts were written in C#, Unity’s default programming language, and a modular scripting structure was employed. This approach capitalizes on segmentation by isolating functionalities into specialized code, each adhering to its own responsibilities and set of principles, thereby ensuring clarity, reusability, and ease of debugging. The main control section consolidates over 45 of these individual scripts into a cohesive system by providing centralized access through a user-friendly control panel, as shown in Figure 3. By positioning this control panel adjacent to the visual interface in Figure 2 , the proctor has seamless access across all essential functionalities, enabling efficient management of the system while maintaining focus on the patient’s responses and test accuracy.
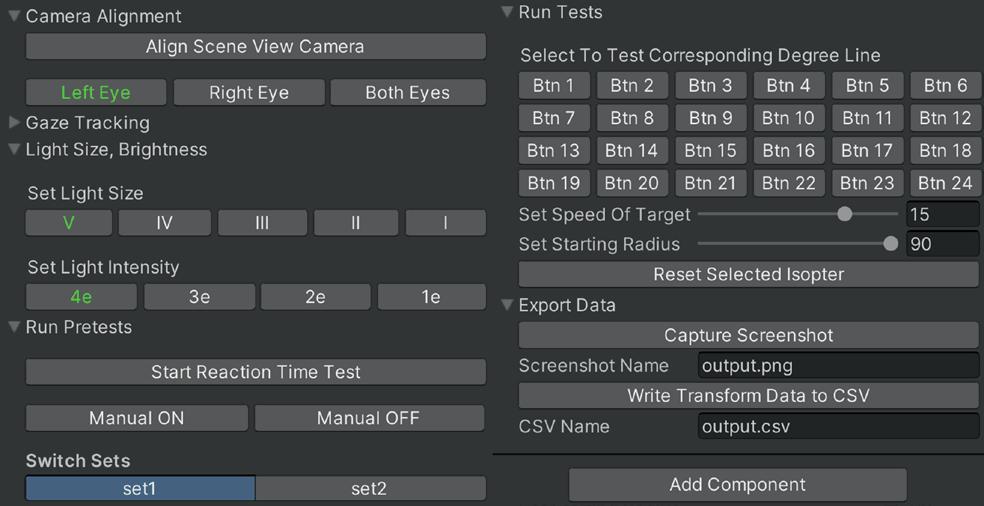
Replicating the Goldmann test apparatus in Unity required focus on accurately mimicking the machine’s functional operation. The VR environment significantly streamlined the process, as much of the intricate hardware is replaced by software. By converting Cartesian coordinates to polar coordinates, the virtual target light’s x- and y-rotations were directly manipulated using radial distances and polar angles, replicating the motion of the real target light. This method formed the basis for virtual simulations. The remaining features of the virtual test were implemented through a series of interconnected scripts, addressing several key aspects of the test’s functionality. The following represent some of the more major considerations:
• Dynamic eye switching which allowed for seamless transition between right and left eye tests –something that required a complete repositioning of the patient in the physical model.
• Light size and intensity adjustments for the proctor to fine-tune and ensure that the stimulus matched requirements for various tests.

• Controlling the speed and initial radius of the light target. As the target becomes smaller and dimmer, the speed needs to decrease as it can become significantly harder to detect. Reducing the initial radius can result in a considerable reduction in both time and effort for proctors, as it minimizes the need for unnecessary adjustments during testing, particularly in cases where an isopter with a smaller radius can be deliberately evaluated.
• Recording reaction times and button press delays, which is essential for the clinician to assess how quickly the patient responds to stimuli. These delays were worked directly into isopter formation, sending visual threshold points back to positions where they were seen, rather than where they were reacted to.
• A conduction of automatic tests along the main degree lines, eliminating the need for proctors to consistently trace out degree lines while operating the mechanical arm.
• Rendering lines for the isopters, which removes the need for proctors to manually draw in lines postexamination (which, on occasion, may extend beyond 30 minutes).
• Gaze tracking, which records the location of fixation during reactions to the target light. Fixation points can then be reviewed, and clicked on to alert the proctor as to exactly where and when the patient may have lost the fixation. This ensures patient compliance, and can prevent falsification of data.
Some additional improvements granted by the adoption of the VR platform lie in the fact that test results are directly and automatically exported in digital format, eliminating the need for paper records and allowing for efficient data maintenance and control overtime. This also lays the groundwork for future implementations of advanced data visualization and more robust analytics, enabling potentially greater insights and a deeper understanding of diagnoses. Although more of the physical test can be automated, the goal is to maintain a semi-automated testing protocol to allow for streamlined testing operations (e.g., automatic isopter, data collection), while still allowing for the operator to switch to manual control for cases in which human intervention is required (e.g., complex non-convex visual fields in the presence of non-standard conditions).
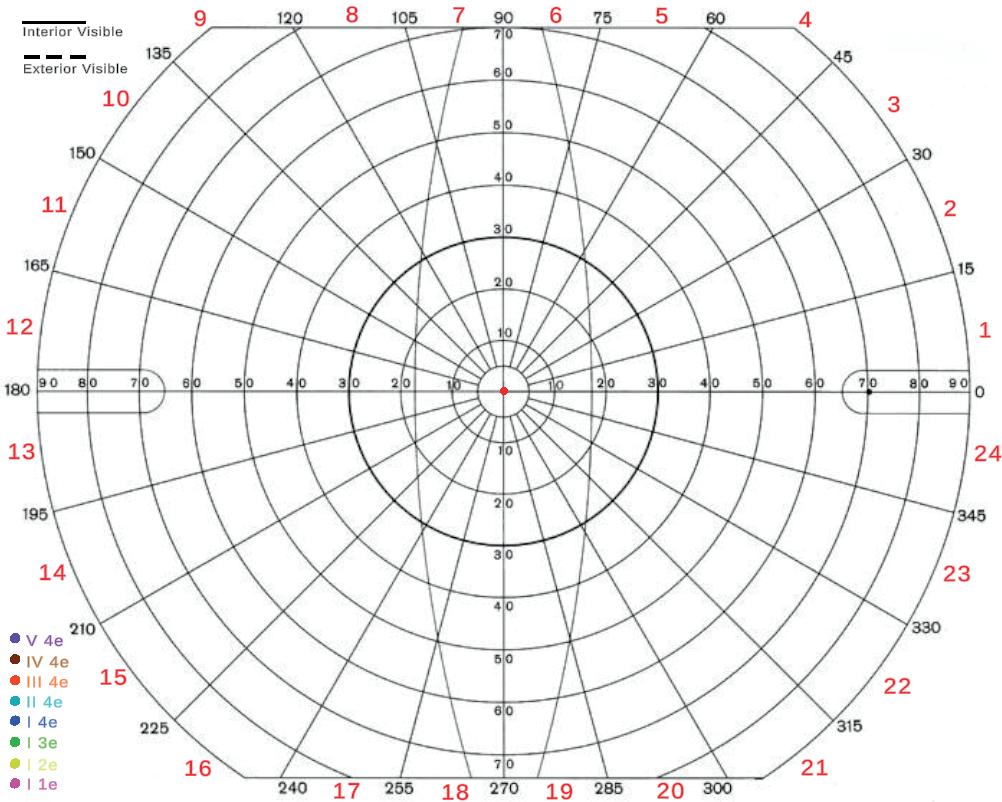
Figure 4 presents the results of a preliminary set of tests conducted on two volunteers: one healthy patient and one with a history of paracentral vision loss. The primary objective of this testing was to assess the sensitivity of the system, with the aim of identifying potential patterns that could support reasonable diagnostic conclusion. The test was administered using a target light of consistent brightness (4e), with varying sizes ranging from (V-I) to
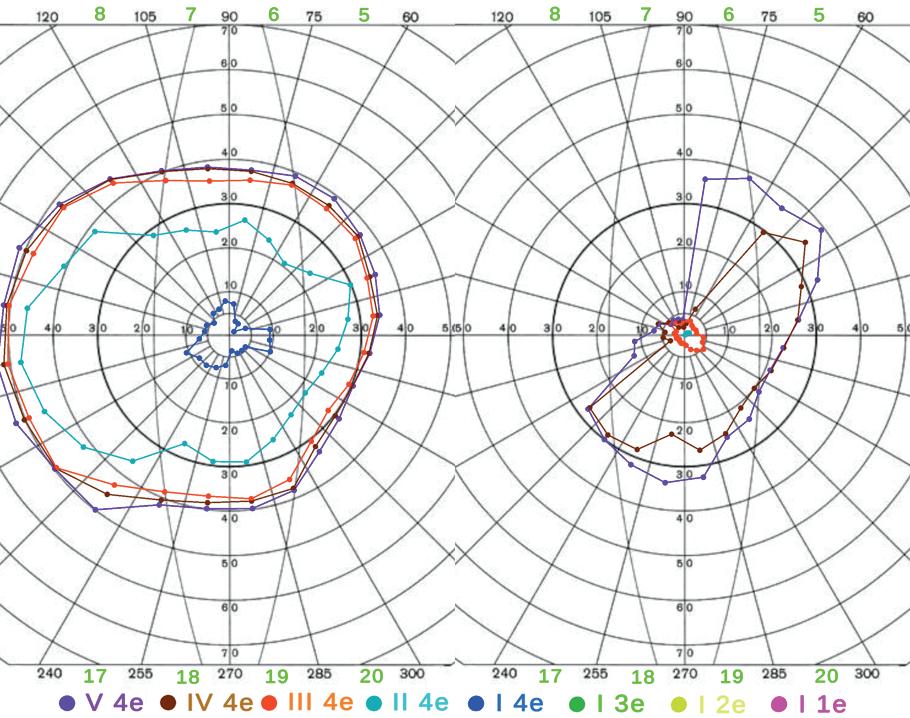
Figure 4: Results of preliminary testing, showing a left-eye test for both a healthy patient (left) and a patient with visual impairment (right).
form isopters which demonstrate interior visibility.
Figure 4 illustrates several key observations regarding the VF testing results. Generally, the healthy patient exhibits coherent results consistent with expectations for VF testing. However, one notable point is the density of the outermost isopters (V 4e, IV 4e, III 4e). This highlights a limitation of the system, specifically the restricted field of view imposed by the HMD. The Varjo XR-4 Aero, with a full horizontal FOV of only 120°, results in a limitation of approximately 15° per eye, which interferes with measurements of the aforementioned isopters. This constraint may persist in future headsets, as enhancing FOV in HMDs presents significant challenges in lens design, weight minimization, and pixel density. Although this is clearly a major constraint for virtual models, it is important to note that not all of the outermost isopters are essential for diagnosis, as the major visual impairments that are usually tested for typically affect larger areas.
As expected, the nasal visual field is affected by the obstruction caused by the nose, particularly along the bottom-right section of both sets of outer isopters. This is a good indication that the isopters are capturing the farther reaches of vision properly, despite being limited to the HMD’s FOV. Another important distinction is the absence of overlapping isopters, a necessary attribute for testing.
Taking a look at the impaired patient, there is a clear distinction particularly in the top-left region of the isopters, which aligns with the location of the impaired patient’s VF loss. Additionally, this patient exhibits a significant difference in the spacing of their outer isopters, with V 4e, IV 4e, and III 4e being the only ones that are visible. This contrast is primarily attributed to the glasses worn by the patient (which are allowed to be worn during testing), but even in the absence of smaller isopters, the results still
provide valuable insight into the extent of the FOV.
With the development of a functional virtual environment and the collection of preliminary data, extensive testing is expected to follow. However, certain limitations within the system remain, such as constraints on the FOV imposed by the HMD. Moreover, the program is currently not cross-compatible with other devices which could present challenges for scalability. In particular, the gaze tracking scripts are currently tailored to the Varjo-XR libraries for Unity and would need to be adapted for different headsets. Looking ahead, it will be crucial to conduct parallel testing alongside the physical model to facilitate direct comparisons and draw conclusions regarding the overall precision and reliability of the diagnostic process. Furthermore, it is essential to test the system with a broader and more diverse group of patients, including individuals with varying degrees of impairment, to test the sensitivity of the system across a wider spectrum of potential conditions.
Funding was provided by the Office of the Provost, the Swanson School of Engineering, the Department of Ophthalmology, and Dr. Alessandro Fascetti at the University of Pittsburgh.
[1] J. Stapelfeldt et al ., “Virtual Reality-Based and Conventional Visual Field Examination Comparison in Healthy and Glaucoma Patients,” Trans. Vis. Sci. Tech , vol. 10, no. 12, p. 10, 2021, doi: 10.1167/tvst.10.12.10.
[2] S. Tsapakis et al., “Visual field examination method using virtual reality glasses compared with the Humphrey perimeter,” Clin. Ophthalmol., vol. 11, pp. 1431–1443, Aug. 2017, doi: 10.2147/OPTH.S131160.
[3] P. Narang et al., “Advanced Vision Analyzer-Virtual Reality Perimeter: Device Validation, Functional Correlation and Comparison with Humphrey Field Analyzer,” Ophthalmol. Sci., vol. 1, no. 2, p. 100035, Jun. 2021, doi: 10.1016/j.xops.2021.100035.
[4] P. Kunumpol et al., “GlauCUTU: Virtual Reality Visual Field Test,” 2021 43rd Annual International Conference of the IEEE Engineering in Medicine & Biology Society (EMBC), Mexico, 2021, pp. 7416-7421, doi: 10.1109/ EMBC46164.2021.9629827.
[5] Z. K. Chia et al., “Assessment of Remote Training, At-Home Testing, and Test-Retest Variability of a Novel Test for Clustered Virtual Reality Perimetry,” Ophthalmol. Glaucoma, vol. 7, no. 2, pp. 139–147, 2024, doi: 10.1016/j.ogla.2023.08.006.
[6] Oftomed. “CAMPIMETRO DE GOLDMANN.” https:// www.oftomed.cl/productos/diagnostico /equipos/ campimetro/campimetro-de-goldmann/campimetrode-goldmann/Accessed 13 Aug. 2024.
John A. S. Buttles2 , Jason Y. Lee9, Cyrus J. Darvish1, Peter H. Gueldner1, Rabih Chaer 4,5 , David A. Vorp, PhD1-8,10, Timothy K. Chung1,8
1Department of Bioengineering, University of Pittsburgh, Pittsburgh, PA, 2Department of Mechanical Engineering and Materials Science, University of Pittsburgh, Pittsburgh, PA, 3McGowan Institute for Regenerative Medicine, University of Pittsburgh, Pittsburgh, PA, 4Department of Surgery, University of Pittsburgh, Pittsburgh, PA, 5Division of Vascular Surgery, University of Pittsburgh, Pittsburgh, PA, 6Department of Chemical and Petroleum Engineering, University of Pittsburgh, Pittsburgh, PA, 7Department of Cardiothoracic Surgery, University of Pittsburgh, Pittsburgh, PA, 8Clinical and Translational Sciences Institute, University of Pittsburgh, Pittsburgh, PA, 9Department of Computer Science, University of Pittsburgh, Pittsburgh, PA, 10Magee-Womens Research Institute, University of Pittsburgh, Pittsburgh, PA
JOHN A.S. BUTTLES
John Buttles is a senior undergraduate student in Mechanical Engineering at the University of Pittsburgh. His research focuses on the development of electromechanical devices to address vascular diseases. After graduation, John hopes to pursue his MS in Electrical Engineering with a focus on embedded systems.
PETE H. GUELDNER, BS
Pete H. Gueldner, BS is a NSF and AHA Graduate Research Fellow in the Department of Bioengineering at the Swanson School of Engineering. Pete’s research interests are primarily related to experimental vascular biomechanics. He is also interested in how artificial intelligence tools can aid with computational methods, and clinical diagnosis/ prognosis of vascular diseases.
CYRUS J. DARVISH, BS
Cyrus Darvish, BS is a Master’s Student and staff member in the University of Pittsburgh Bioengineering Department. Cyrus has been involved with medical device design and experimental biomechanical testing that has highly translatable research. His efforts have led to several patentpending technologies to help clinicians better treat patients with vascular diseases including deep vein thrombosis and post-thrombotic syndrome.
JASON Y. LEE
Jason Lee is a University of Pittsburgh graduate with a background in software and hardware development, product design, and machine learning. His work has explored the intersection of technology and biological systems, particularly vascular systems. With a strong interest in entrepreneurship, Jason is passionate about building innovative products that merge medicine and technology.
RABIH CHAER, MD, MSC
Rabih Chaer, MD, MSc has been at the forefront of surgical innovation by establishing several clinical programs and quality initiatives at UPMC, coupled with industry-funded



clinical trials and NIH-funded translational research. He continues to innovate vascular care by promoting clinical and translational/basic science research and building several cutting-edge clinical centers of excellence, including a multidisciplinary aortic center as part of the UPMC Heart and Vascular Institute.
TIMOTHY K. CHUNG, PHD
Timothy K. Chung, PhD is a Department of Bioengineering Research Assistant Professor at the Swanson School of Engineering with a secondary appointment in the Clinical and Translational Science Institute. Dr. Chung’s research focuses on the development of experimental apparatus for biomechanical testing, computational simulations of diseased vasculature, medical device design and manufacture, and artificial intelligence.
DAVID A. VORP, PHD
David A. Vorp is the John A. Swanson Professor of Bioengineering and Senior Associate Dean for Research and Facilities at the University of Pittsburgh’s Swanson School of Engineering. Dr. Vorp’s research specializes in vascular biomechanics, mechanopathobiology, and tissue engineering, with a focus on aortic aneurysms and tissue-engineered vascular grafts. He has authored over 145 peer-reviewed papers and has received numerous honors, including the Van C. Mow Medal and the Carnegie Science Award. He is also a Fellow of the American Heart Association, the American Institute for Medical and Biological Engineering, the American Society of Mechanical Engineers, and the Biomedical Engineering Society.
Deep vein thrombosis (DVT) affects roughly 900,000 people in the United States, annually. Clinicians find it difficult to treat patients because no gold standard exists for confidently diagnosing those with DVT. The proposed acoustic signal detection device is the first step in ensuring patients are properly evaluated.
Keywords: Deep Vein Thrombosis, Post Thrombotic Syndrome, Printed Circuit Board, Acoustic Signals, Software Development, Data Acquisition, Python
Clinicians often face challenges in effectively managing patients with potential DVT. Typically, these patients visit a primary care physician who may prescribe basic anticoagulation therapy and then send them home. Anticoagulation is a common method used to treat DVT to prevent post-thrombotic syndrome (PTS) by reducing the coagulation of blood cells. This treatment is not a solution to managing DVT and preventing PTS; the clotting of blood cells is only prolonged, which results in patients requiring a constant supply of anticoagulants. This project focuses on the development of an acoustic signal detection device, DeltaCuff, to measure the compliance of the deep vein for accurately diagnosing whether a patient is healthy, has DVT, or has progressed to PTS. The development of the detection device was accomplished by manufacturing a custom printed circuit board (PCB) and creating software to govern the hardware. Signals read from the device were logged and plotted in real-time as a standard pressure cuff inflated to 10 kPa and then deflated. After testing, it was found that the device could reproduce individual results when holding all other things constant. Therefore, DeltaCuff could measure repeatable acoustic signals, which would enable clinicians to properly diagnose DVT and further prevent PTS.
Deep vein thrombosis (DVT) is a condition characterized by blood clot formation in the deep veins, primarily in the lower extremities. It affects approximately 900,000 individuals in the United States annually, making it the third most common vascular disease[1]. DVT is not only a significant medical concern due to its prevalence but also due to its potential to cause life-threatening complications, such as pulmonary embolism, responsible for 100,000 fatalities each year[2]. Among individuals aged 65 and older, the annual incidence of DVT increases to 10 per 1,000 people. Black communities experience disproportionately high rates of DVT, while pregnant women are five times more likely to develop the condition[1, 3].
The progression of DVT into post-thrombotic syndrome (PTS) further exacerbates the burden, with nearly 50% of acute DVT cases advancing to this chronic and debilitating condition. PTS is characterized by persistent symptoms such as limb swelling, pain, fatigue, and heaviness, significantly reducing patients’ quality of life[4, 5]. Severe cases often result in venous ulcers, which are slow to heal and chronically painful. The financial impact of managing PTS is profound, with annual treatment costs exceeding $20,000 per patient (adjusting for inflation), compounded by loss of productivity and the need for frequent medical interventions[6]. Despite advancements in diagnostic imaging and therapeutic options for DVT, no reliable methods exist to predict which patients will develop PTS, hindering the ability to implement preventive care strategies[7, 8]. This unmet need underscores the
importance of innovative approaches to both predict and prevent PTS in DVT patients.
DeltaCuff represents a significant step forward in addressing this gap. By employing a novel approach that integrates acoustic signal detection and biomechanical measurements, DeltaCuff aims to differentiate between healthy veins, those affected by DVT, and those progressing to PTS. Leveraging an array of piezoelectric sensors embedded in an off-the-shelf pressure cuff, the device measures venous compliance by capturing acoustic waveforms during pressurization and depressurization. Coupled with real-time data acquisition, these waveforms could provide clinicians with predictive insights into PTS development, enabling preemptive and personalized treatment plans[9, 10].
The proposed technology not only has the potential to enhance diagnostic accuracy but also to alleviate the healthcare and economic burdens associated with DVT and PTS. By identifying at-risk patients early, interventions such as aggressive compression therapy or thrombolytic treatment can be deployed to mitigate progression to PTS, ultimately improving patient outcomes and quality of life[11]. DeltaCuff signifies a transformative approach to managing one of the most challenging complications of vascular disease.
The expected and anticipated results for the experimental apparatus included the successful detection of acoustic signals from piezoelectric sensors to determine the compliance of the deep vein. DeltaCuff consists of four Arduino Nano microcontrollers, nine piezoelectric sensors, two pumps, one solenoid valve, one 5 V pressure transducer, one pressure cuff, and one 3D printed structure to house all components. The piezoelectric
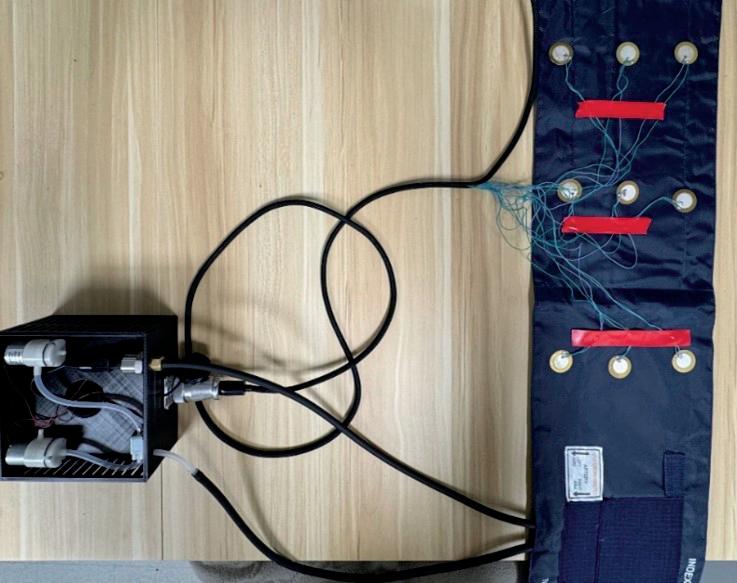
sensors are arrayed along the pressure cuff and are the primary approach for acoustic signal detection. The sensors contact the bare leg and measure the change in

pressure while the pressure cuff is pressurized to 10 kPa and then depressurized. Using the analog input pins on the Arduino Nano, changes in voltage from the sensors are recorded and then sent over the universal serial bus to a local computer. The voltages are then stored and plotted in real-time on the computer using Python.
Three of the Arduino Nanos were used to read signals from the piezoelectric sensors. Using the Arduino IDE, a program was written to enable the microcontrollers to send voltage readings over the universal serial bus (USB). This custom firmware built using C++ code initializes a serial connection to an external computer for each Nano with a baud rate of 115200 bits/sec. To capture signals from the sensors, the Nano polls the serial line to ensure there is a connection and then reads a string “A4”, “A5”, or “A6” sent from the computer to determine which analog pin to read. The data is then converted from the integer to a voltage reading using the 10-bit resolution of the analog to digital converter and is then sent back to the computer over the USB. Due to the delay in converting analog signals to digital, the piezoelectric sensors were split amongst three Arduino Nano boards to parallelize and reduce sensor latency over USB. This custom firmware was then uploaded and flashed to each Arduino Nano board before data acquisition.
2.2.
A separate custom Python program was written to provide a graphical user interface (GUI) on a personal computer connected to the Arduino Nanos. To model the behavior of the Nano, a class was created using the

serial library. The constructor for this class initializes the corresponding object with a name, a queue for data recording, a flag to differentiate between Nanos that collect data and the Nano that pressurizes DeltaCuff, and a serial object with specific port and baud rate values. A public method read was then written to send strings like “A4”, “A5”, and “A6” to the Nano. These strings prompted the Nano to read analog pins 4, 5, and 6, corresponding to the piezoelectric sensors; the reading was then
converted to a voltage and sent back over the USB to the computer and stored in the queue and a separate array for post processing. To visualize these voltages, a class named RealTimePlotter was created using PyQt6 and pyqtgraph. Upon instantiation, the data queue was passed into the constructor and initialized an external application with a window that contains a plot of sensor voltages against time. A public method update pulls the name of the Nano and plots the corresponding voltage reading from the queue. A main Python file integrates all these functionalities using the multiprocessing library. Here, multiple objects of the Arduino class and a RealTimePlotter object are instantiated as individual threads managed by multiple cores of the central processor. This program allowed for parallel handling of each Nano which improved the latency of the data acquisition from multiple Nanos when compared to nonparallel data acquisition. Additionally, the stored data in the Nano class was exported as a comma separated values (*.csv) file for post processing.
A custom PCB was created to efficiently house the data acquisition and cuff pressurization circuits. Traces were routed from the ground and analog pins of the three Nanos to terminals at the end of the PCB for the piezoelectric sensors. A 1.0 MΩ resistor was placed in parallel with each sensor to improve the stability of the voltage readings by ensuring a known voltage value at the analog pin on the Nano. Additionally, traces were made from digital output pins on the fourth Nano to the base of three negativepositive-negative (NPN) transistors which controlled the pumps and solenoid. The transistors were necessary because the maximum source current of the Nano’s digital pins is 40 mA, much less than the required 500 mA of the pneumatic pumps and solenoid; therefore, a separate power supply was required to meet the current draw, so a barrel jack was added to the PCB. All the electrical components were assembled in KiCAD. This software allowed rapid prototyping by using its circuit schematic tool, where pinouts were imported for each necessary component. After the connections between the pins were made, the schematic was exported as a Gerber file and sent to the manufacturer. The PCB was then assembled.

To pressurize DeltaCuff, the Nano’s digital pins toggle the base of NPN transistors, which allows current to flow to the pumps and solenoid. Excessive switching of the transistors generates a significant amount of heat, which degrades performance and can be potentially dangerous. Diodes were added in parallel to prevent damage by allowing current to flow in a closed loop until dissipated. A separate program was written, in C++, to control DeltaCuff’s pressurization by initializing a serial connection with an external computer. The computer would send a command such as “Start” to the Nano over the USB. The start signal initiates the Nano to switch the state of the transistor to turn the pump on. While the pressure cuff inflates, the pressure transducer voltage was constantly read using analogRead and converted to a pressure with a linear relationship obtained from calibration. Once the transducer read 10 kPa or 75 mmHg, the Nano switched the state of the transistors to turn the pump and vacuum off and on, respectively.
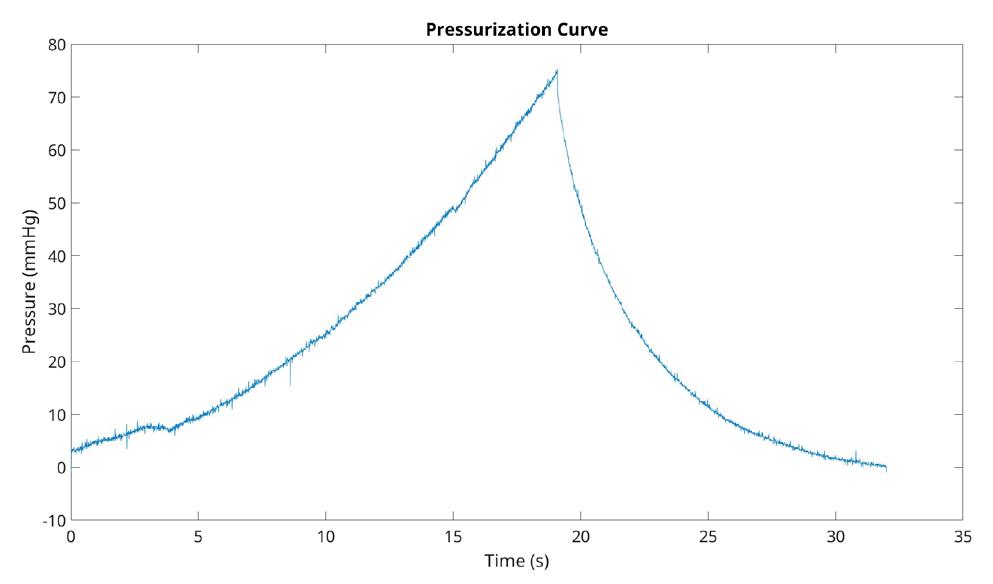
2.5
Signal Processing was performed in MATLAB from the exported *.csv files of the acoustic signals from DeltaCuff. The data was sampled to reduce redundancies of the signals while maintaining a minimum Nyquist sampling frequency. The signal data was filtered using a SavitzkyGolay filter with a third-degree polynomial to smooth the waveforms.
We developed a prototype of DeltaCuff that measures acoustic signals while simultaneously pressurizing an off-the-shelf blood pressure cuff. Voltages from the nine piezoelectric sensors demonstrated consistent, repeatable waveform patterns during the pressurization and depressurization cycles. Real-time visualization and data exportation via Python reduced latency, enhancing
the accuracy of the device for clinical assessments. These findings suggest the potential of the device to assess venous compliance and detect differences indicative of pathological states such as DVT or PTS; however, DeltaCuff’s functionality was verified on healthy veins instead of diseased counterparts. The modular design and custom PCB allowed the device to operate reliably with minimal hardware errors. The inclusion of diodes and transistors in the PCB design ensured stable operation of the pumps and solenoid. The device’s ability to process and store data efficiently with any modern computer demonstrates its potential for hassle-free deployment in clinical environments. The compact size and costeffectiveness of the system make it a viable option for point-of-care testing.
This study demonstrated that DeltaCuff is capable of detecting acoustic signals from the thigh while a standard blood pressure cuff was inflated and deflated. Real-time data acquisition and visualization via Python were successful, enabling efficient monitoring and storage of sensor outputs. While the results validate the device’s hardware and software integration, the clinical interpretation of the acoustic signals remains to be confirmed with more samples. Current diagnostic methods for DVT, including ultrasound and venography, are effective for detecting thrombosis but are unable to predict progression to DVT or PTS. DeltaCuff advances this field by integrating piezoelectric sensors into a wearable, user-friendly cuff system. The modular and cost-effective design allows for broader accessibility compared to high-cost imaging techniques. Although, the primary limitation of this research is the small number of test subjects, which restricted the validation of the acoustic signals. Currently, the hypothesis is that diseased veins are less compliant and will not provide a distinct acoustic signal. The prototype and current institutional review board approval only accommodates
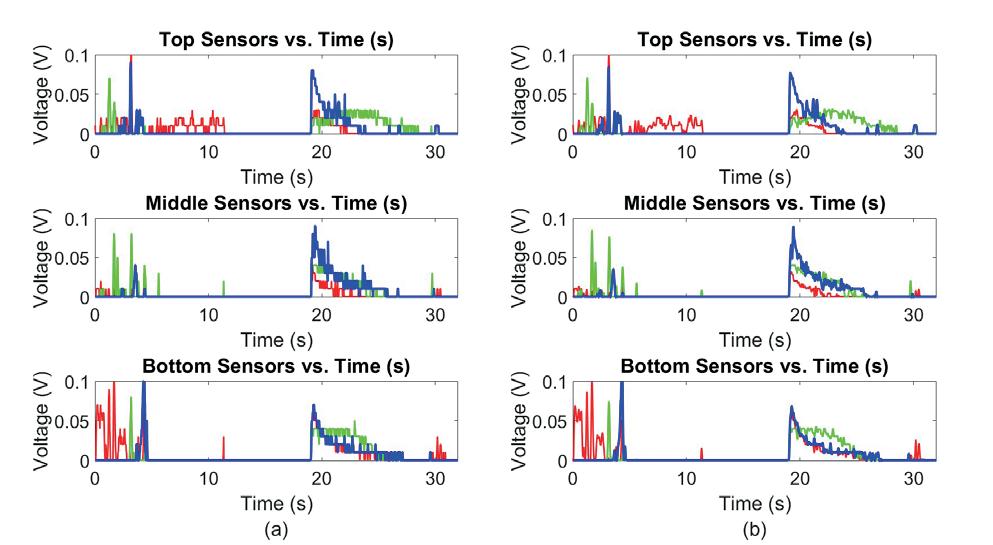

healthy patients. DeltaCuff holds significant potential to revolutionize the diagnosis and management of DVT and PTS. By identifying at-risk patients earlier, DeltaCuff enables pre-emptive interventions such as compression therapy or thrombolytic treatments, which could mitigate progression to PTS, reduce healthcare costs, and improve patient outcomes. Future research will focus on validating the acoustic signals from patients using ultrasound. Our team plans to incorporate machine learning algorithms to analyze acoustic waveforms, which could enhance DeltaCuff’s ability to differentiate between healthy veins, DVT, and PTS. With these advancements, DeltaCuff has the potential to become a necessary tool in vascular diagnostics.
The biomedical device, DeltaCuff can effectively capture acoustic signals from the leg while simultaneously pressurizing and depressurizing a blood pressure cuff. There is a strong clinical need for DeltaCuff as it unites clinicians with patients in serious need of more permanent blood clotting removal rather than traditional anticoagulation therapy. DeltaCuff is the first step for successful diagnosis of DVT and preventing PTS, a solution that does not exist today. Next developments for the medical device include testing on real patients, validation of the acoustic signals, and the creation of machine learning models to streamline the process of accurately detecting DVT or PTS. Combining current achievements and future enhancements, DeltaCuff offers a non-invasive, cost-effective method to assess venous compliance.
Funding was provided by Timothy Chung and David Vorp of the Vascular Bioengineering Laboratory. The pilot study funding was provided by the Center for Medical Innovation Swanson School of Engineering at the University of Pittsburgh Award 347-2024.
[1] “Data and Statistics on Venous Thromboembolism.” Centers for Disease Control and Prevention. https:// www.cdc.gov/blood-clots/data-research/facts-stats/ index.html (accessed 2025).
[2] Y. Freund, F. Cohen-Aubart, and B. Bloom, JAMA, vol. 328, 2022, doi: 10.1001/jama.2022.16815
[3] K. McLendon, A. Goyal, and M. Attia, “Deep Venous Thrombosis Risk Factors,” in StatPearls. Treasure Island (FL), 2024.
[4] A. Rabinovich and S. R. Kahn, J Thromb Haemost, vol. 15, 2017, doi: 10.1111/jth.13569
[5] B. Cucuruz et al., J Vasc Surg Venous Lymphat Disord, vol. 8, 2020, doi: 10.1016/j.jvsv.2019.10.012
[6] A. A. Ashrani and J. A. Heit, J Thromb Thrombolysis, vol. 28, 2009, doi: 10.1007/s11239-009-0309-3
[7] S. R. Kahn et al., J Thromb Haemost, vol. 7, 2009, doi: 10.1111/j.1538-7836.2009.03294.x
[8] D. P. Vekilov and K. J. Grande-Allen, Methodist Debakey Cardiovasc J, vol. 14, 2018, doi: 10.14797/mdcj-14-3182
[9] S. J. Rupitsch, Piezoelectric Sensors and Actuators Fundamentals and Applications, 1 ed. Springer Berlin Heidelberg, 2019.
[10] H. Huang, J. P. Gu, H. F. Shi, W. Y. Shi, J. Y. Lu, L. Chen, and H. B. Su, Sci Rep, vol. 8, 2018, doi: 10.1038/s41598018-30645-w
[11] R. S. Chitsike et al., J Thromb Haemost, vol. 10, 2012, doi: 10.1111/j.1538-7836.2012.04872.x
Natalie Ceccarelli1, William W. Clark 2
1Department of Bioengineering, University of Pittsburgh, Pittsburgh, PA, 2Department of Mechanical Engineering and Materials Science, University of Pittsburgh, Pittsburgh, PA
NATALIE CECCARELLI
Natalie Ceccarelli is an undergraduate student in Bioengineering where she specializes in medical product design and entrepreneurship. She is currently working in the IDEA Lab and pursuing the Innovation, Product Design, and Entrepreneurship certificate.
WILLIAM W. CLARK, PHD
Dr. Clark is a professor of Mechanical Engineering and Materials Science where he teaches and carries out research in dynamic systems and controls. He is also the Director of the Innovation & Entrepreneurship Program in the Swanson School of Engineering that is responsible for building a community of innovation in the school.

Natalie Ceccarelli William W. Clark
Current academic buildings at the University of Pittsburgh are not adequately designed for extensive student use. Research into the student population has not been done when designing student spaces.
Keywords: Human-centered design, interior design, stakeholders
Proper interior design can improve space utilization and user interaction by addressing the psychological needs of users. This study highlights the importance of project understanding, customer discovery, and solutionoriented thinking when using a Human-centered design (HCD) approach. The Gardner Steel Conference Center (GSCC) houses the University of Pittsburgh’s Innovation Institute, the Academic Resource Center (ARC), and one main classroom with surrounding tables and chairs predominantly used by freshman engineering courses. With these roles, GSCC was found to be underutilized for its intended functions of student usage, with current layouts failing to support students’ preferences for individual study and group project work. HCD approaches, including online and in-person surveying, found that students desired individual study areas and group project workspaces. Furthermore, after observing students using the area of interest, the team identified a frequent use of socializing before and after their lectures. New proposed digital renders of the space include more individual study areas, conceptual group project tables, modular Zoom conference spaces, and a social area to enhance both productivity and social interaction to address these found needs. A final focus group was conducted to test the effectiveness of these changes.
Effective space utilization and user interaction require deep knowledge of human-centered design (HCD) and a psychological understanding of the principles behind interior design. According to the Harvard Business School, human-centered design is “a problem-solving technique that puts real people at the center of the development process” to create products or services that are tailored to the audience’s needs [1]. Key elements of HCD consist of understanding the project’s context, discovering the underlying problems by conversing with stakeholders and shareholders, and implementing solution-oriented thinking. For space utilization, the team demonstrated HCD through surveying, interviewing, and appearance modeling.
The space in question is Gardner Steel Conference Center (GSCC), a University of Pittsburgh (Pitt) academic building that students use for freshman engineering classes and houses the Innovation Institute and Academic Resource Center. The redesigned space consists of a set of tables in alcoves surrounding a large classroom. Initial surveying, done by a team of diverse engineers, incorporated online surveys, in-person interviews, and focus groups that recognized that GSCC was not being used in ways that supported students’ needs. The current layout and design of the space did not reflect student-desired usages: studying and conceptual group project workspaces. This insight led the team to adopt a solution-oriented approach, thus aiming to redesign the space to achieve increased student utilization and satisfaction.

The proposed redesign introduced several key elements, including additional individual study areas, designated Zoom conference spaces, collaborative group study areas, and an appointed social space. These modifications were then used to conduct follow-up surveys of the student population, which resulted in a positive evaluation of the proposed changes.
2.1
The team performed an initial site tour of GSCC to identify pressing issues for the redesign. These issues included poor space management, such as environmental hazards, lack of cleaning, missing ceiling tiles, and broken lights. Additionally, office materials and printers were unavailable, seating was nonfunctional due to its large, uncomfortable nature, and there was a noticeable lack of student desire to use the space. Some of these issues are seen in Figures 1, 2 , and 3 below. Following the tour, the team ideated ways to increase the space’s functionality and maximize its potential for student use.
2.2
A major part of HCD is to keep the shareholders and stakeholders in mind. Before proposing the redesign, the team met with students and faculty at Pitt. The shareholder for this project is Dr. Besterfield-Sacre, the Senior Associate Dean for Academic Affairs at the University of Pittsburgh; the stakeholders are the Pitt student population. Feedback from stakeholders and shareholders helped clarify current space issues and informed the development of proposed solutions, increasing awareness of the space’s deficiencies.
Three methods of surveying were employed: an initial online survey, in-person interviews, and multiple focus groups. The total sample size included about 50 Pitt students of all majors, genders, and graduation years. Initial online surveys were conducted through a Google Form consisting of 10 questions regarding the organization and usage of GSCC. This allowed the team to collect quantitative data on the most pressing issues for the stakeholders.
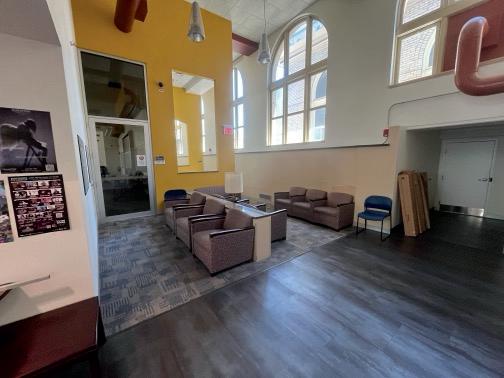
Based on this understanding, the team pursued two pathways: one that focused on continued customer discovery and the other that focused on ideation and redesigning the space itself.
The survey team conducted one-on-one interviews with a diverse population of Pitt students. This data further helped develop the problem statement and value propositions of the redesign. The qualitative results of the interviews showed that the current layout of GSCC failed to align with students’ needs.
While surveying occurred, the design team explored potential interior design solutions to increase student usage. According to Heba-Talla Hamdy Mahmoud, a lecturer of interior architecture, décor department and faculty of Fine Arts at Mansoura University, “interior architecture designers should maintain the identity of peoples and communities and respect their daily routine of life” [2]. In response, the team continued their efforts to embrace human-centered design practices by engaging with stakeholder feedback when proposing new designs. Key priorities included increasing usable workspaces equipped with desks and outlets, adjusting the flow of the space to allow for more comfortable seating, and keeping the fundamental identity of GSCC: a quiet place to work individually or in a small group.
After appropriate surveying and problem discovery phases were completed, the team utilized digital prototyping to visualize proposed solutions.
Surveying results revealed that a significant portion of students did not use GSCC, finding that only 18.5% of students use the space at least once per week. Among those that did use GSCC, the primary use was for individual studying or small group projects based on the classes prevalent in GSCC. These courses include a range of freshman engineering classes, engineering departmental seminars, and other introductory courses such as chemistry and English composition. Maintaining this core identity—an academic space for individual and small group project work—became a central focus for the redesign.

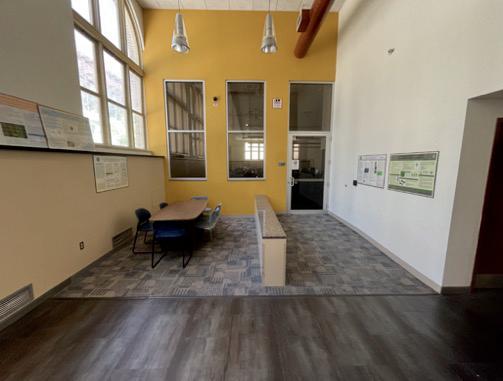
The problem discovery phase primarily used student feedback, while still aligning with shareholder desires and designing a unique space for students to work in. The team realized that the main conflict between the current space and the student feedback was a shortage of usable workspaces. Addressing this issue became the main objective for the redesign. After appropriate problem discovery, the team moved forward with digital prototyping to envision potential solutions and communicate to desired audiences.
The final proposal for space utilization and increased user interaction stemmed from the feedback from shareholders and stakeholders. This input guided the team to digitally render multiple modular designs to prototype new ways to utilize the space while better aligning with student desires. The proposed designs include individual study areas, designated Zoom conference spaces, collaborative group study areas, and a designated social space.
A key change identified by students was the need for more individual workspace. Although the current design had multiple chairs, it lacked tables nearby. The current space did not have designated spaces for individuals to study, despite this being one of the space’s most common uses. To address this, the team proposed to change the space located at the exit of the classroom, as shown in Figure 1. The updated design would replace the cramped seating arrangement with a five to six-person individual workspace, as illustrated in Figure 4


The second priority of the redesign was to expand and enhance the modularity of group spaces. The team also recognized this secluded nature of the building as an ideal space to include Zoom conference spaces. Given the limited size of GSCC, modularity became a crucial consideration. The side hallway, depicted in Figure 2 , was identified as a prime location for group spaces and Zoom conference areas. The proposed changes, illustrated in Figure 5, include adding movable room dividers and tables with multiple seats, allowing for modular use of the space.

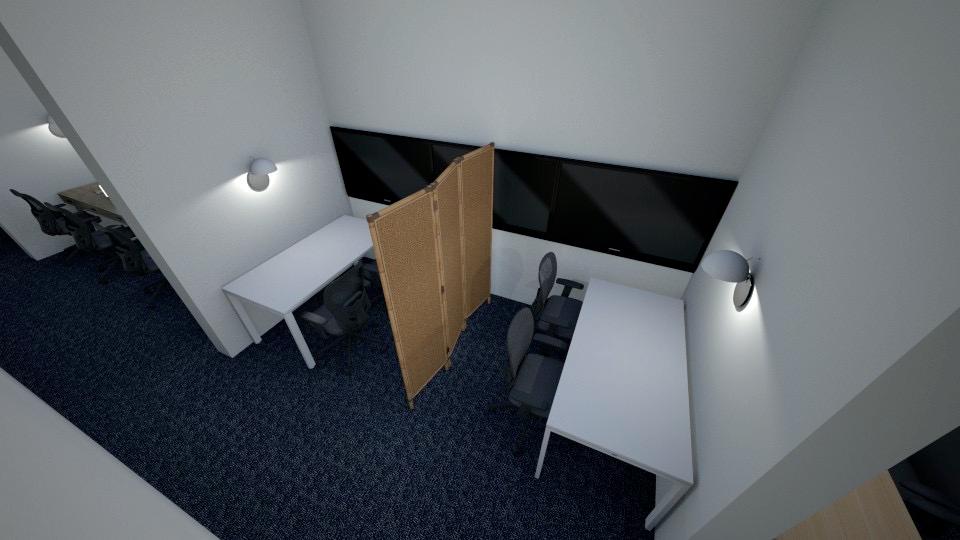
The final proposed addition to GSCC is to implement a sociable area. Rather than the current layout, a table and a few chairs shown in Figure 3, the team recommends including multiple two-seater tables and couches to ensure comfort and aesthetics. This is seen in Figure 6

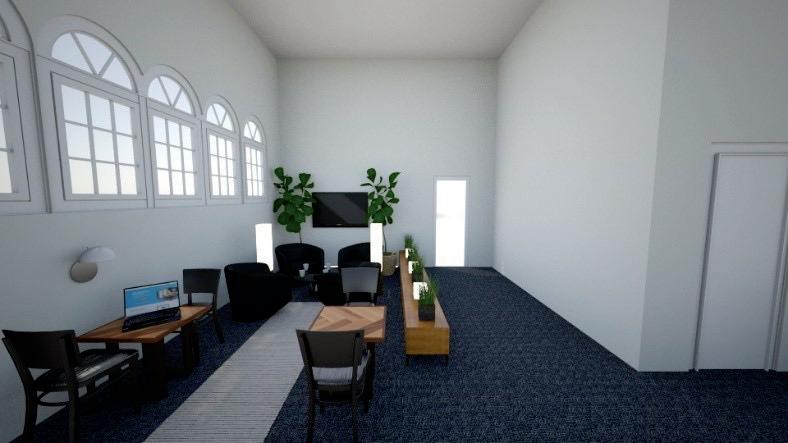
It is important to note that these designs represent the most highly rated options and are not comprehensive of all designs created by the team.
The proposed renovations are expected to significantly increase the student usage of the space over the next few years. The final designs will expand available work seating by over 83% and add more than 20 new chairs to the area. Survey results indicate that students are more likely to use GSCC with the proposed changes than without them. Students surveyed about the proposed changes reported a 40% increase in desire to use GSCC over other academic buildings. Due to the location and size of the building, this is an unexpectedly high increase in demand.
Furthermore, the addition of Zoom conference spaces adds a unique feature to GSCC compared to other places on campus. There are no other buildings on campus that are intended for group or individual meetings. With the growing number of online interviews, meetings, and other discussions, students desire these spaces greatly [3]. The modularity of the space allows students to use the space for multiple purposes. This flexibility is unusual for study spaces on campus, as most contain a rigid design.

Stakeholder surveying revealed that GSCC is currently underutilized due to the lack of functionality for the desired needs of students. Specifically, students expressed a desire for more individual seating and small group work areas. Current use of the space includes conceptual group project work, individual studying, and sociable activities before and after lectures. Applying a human-centered design approach, the team proposed multiple adaptations to the current space to better align with student needs and preferences. These HCD methods helped the team understand the pain points of current Pitt students, align the redesign with the value students would receive, and justify the proposed implementations with statistical evidence from the stakeholders. These proposed changes include increasing the number of usable seats by implementing designated individual studying areas, Zoom conference spaces and group project areas, and including more seating in a sociable area.
Team members, Paul Sadofsky, Maya Conners, and Patrick Lovenguth for their continued work generating designs and surveying students. Dr. William Clark, Brandon Barber, Daniel Yates, and Amelia Gordon for their guidance and mentorship during the project. Funding was provided by the Swanson School of Engineering and the Office of the Provost at the University of Pittsburgh.
[1] Landry. What is Human-Centered Design? Harvard Business School. 12.15.2020. Accessed 02.04.2025. https://online.hbs.edu/blog/post/what-is-humancentered-design
[2] Mahmoud. Interior Architectural Elements that Affect Human Psychology and Behavior. The Academic Research Community Publication. 2017. pg. 3. DOI: 10.21625/archive.v1i1.112. https://www.researchgate. net/publication/331658185_Interior_Architectural_ Elements_that_Affect_Human_Psychology_and_ Behavior
[3] Common Zoom Interview Mistakes and How to Avoid Making Them. Indeed. 09.15.2024. Accessed 11.24.2024. https://www.indeed.com/career-advice/ interviewing/mistakes-in-zoom-interview
Development and analysis of volumebased solvers for partially occluded surfaces in the context of radiation heat transfer
Eliana Crew1, Matthew Barry1
1Department of Mechanical Engineering and Materials Science, University of Pittsburgh, Pittsburgh, PA
ELIANA CREW
Eliana Crew is a sophomore majoring in Engineering Science with a Mechanics concentration at the University of Pittsburgh. Her academic interests include computational modeling for engineering applications and physics. She plans to continue her academic interests in graduate school.
MATTHEW BARRY, PHD
Matthew Barry is an Associate Professor in the Mechanical Engineering Department at the University of Pittsburgh. His research focuses on thermoelectrics and engineering education. Dr. Barry teaches several introductory engineering classes at the University of Pittsburgh.


Eliana Crew Matthew Barry
The resolution of radiation view factors is integral to various numerical heat transfer modeling applications. The presence of blocking structures complicates this computation and can markedly affect the resulting value. This work introduces a novel method to account for partial occlusion, which could offer computational advantages over existing methods.
Keywords: Radiation view factor, partial occlusion
Abbreviations: Double Area Integration (DAI), Double Refinement (DR), Grid Convergence Index (GCI), MöllerTrumbore Intersection (MTI), Single Area Integration (SAI), Single Refinement (SR)
Radiation heat transfer processes are fundamental to applications ranging from space exploration to microand nanotechnologies. Across these diverse scales, numerical modeling offers an efficient way to analyze their nature. The radiation heat transfer between two bodies is characterized by Eqn. 1:
Q 1 2 = σ A1 Fij (T14 – T 24) where σ is the Stefan-Boltzmann constant, A1 is the surface area of the emitting body, T1 and T 2 are the temperatures of bodies 1 and 2, respectively, and Fij is the view factor from body 1 to body 2, which is the receiving body. A necessary step to solving this equation is calculating the radiation view factor, Fij , which quantifies the proportion of radiation emitted by one body and received by another. This value is bounded between zero and unity. Naturally, any obstruction between the two participatory bodies decreases the value and raises the need for further numerical quantification to accurately determine its effect (specifically, diminution). This situation is known as the Shadow Effect.
Existing methods, such as the Möller-Trumbore Intersection (MTI) algorithm, achieve accuracy in accounting for the shadow effect but are computationally expensive. Computational expense is quantified as the number of mathematical operations needed to arrive at an answer; the more operations, the longer the code takes to execute. While there are more computationally advanced algorithms for resolving unblocked Fij values, such as the Single Area Integration (SAI) algorithm (the reader can reference [1] for more detail on this method), there is a lack of compatible methods to account for obstructions accurately. This study aims to develop a new algorithm to determine the effect of occlusion on the Fij value that is compatible with more robust Fij solvers (i.e., SAI with an efficient blocking algorithm). This is accomplished by developing an algorithm that does not rely on a binary determination of the visibility between an emitting and receiving element (e.g., 0 for blocked or 1 for unblocked rays) but allows for any value within the interval of 0 and 1. The proposed algorithm is then tested against existing occluded Fij calculation methods (e.g., Double Area Integration (DAI) with MTI) to evaluate its accuracy and capabilities.
Fij : Radiation View Factor
For an unobstructed configuration, two prominent algorithms exist to calculate the Fij value: DAI and SAI. The reader is referenced to [1] for more details on these algorithms. Where obstructions do exist between the emitting and receiving elements, supplementary procedures are needed as the Fij value is consequently

reduced. The MTI algorithm is one such procedure that operates in a binary manner, eliciting total visibility (i.e., 1) or no visibility (i.e., 0) between each pair of emitting and receiving elements [2]. It determines whether the centroidto-centroid ray between elements intersects the blocking structure in a barycentric coordinate system.
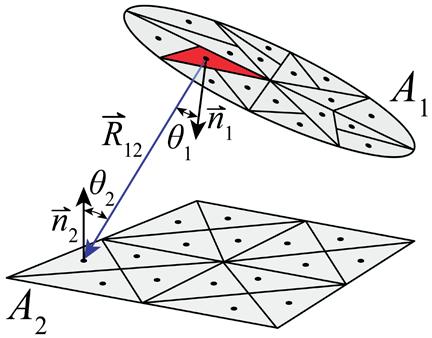


Figure 1: Visual representation of the DAI algorithm where both bodies, A1 and A 2 , are refined. For every combination of elements, the calculation given in (c) is performed according to the defined geometry in (a). In the presence of blocking, (b) demonstrates MTI’s ability to detect and account for blocking given there is a sufficient number of elements on both surfaces.
The MTI algorithm is compatible with the DAI method, as DAI innately requires that the emitting and receiving surfaces have well-refined elements (i.e., a large number of differential areas). Fig. 1 outlines DAI’s approach to Fij calculation where Fig. 1c displays the principal equation and Fig. 1a notes the quantities used in the equation. It is noted that the DAI equation requires the integration of differential elements over both participatory bodies. In the presence of occlusion, Fig. 1b demonstrates how MTI can be favorably paired with DAI to check every centroidto-centroid ray for intersection with a blocking structure. However, the necessary refinement for DAI to accurately quantify Fij values notably increases the computational burden (the number of rays cast is proportional to the number of differential areas squared). Additionally, DAI exhibits fundamental failures with specific geometries, such as the presence of a shared edge.
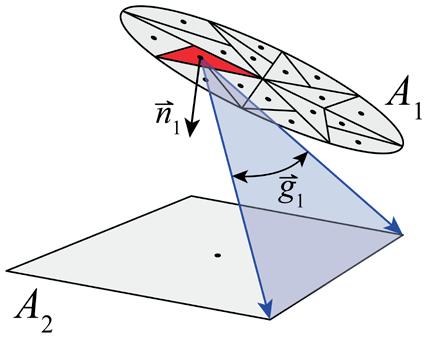
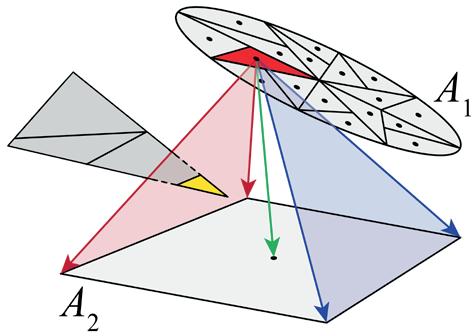

Figure 2: Visual representation of the SAI algorithm where body A1 is refined and body A 2 remains unrefined. For every element on body A1, the calculation given in (c) is performed along the edges of A 2 according to the defined geometry in (a). The vector g1 is directed outwards from the highlighted plane and has a magnitude equivalent to the marked angle. In the presence of blocking, (b) demonstrates MTI’s inability to properly detect blocking as a singular centroid-to-centroid ray is used to examine the entire space between elements.
SAI can overcome these issues with certain geometrical configurations (e.g., a shared edge between two participatory surfaces) and allow the receiving surface to remain coarsely refined, thus demonstrating its advantage over DAI in an unblocked setting. Fig. 2 illustrates SAI’s approach to F ij calculation where the principal equation is given in Fig. 2c , and the necessary terms are represented in Fig. 2a . It is noted that the SAI equation replaces the integration of differential areas over the receiving body with a summation of operations along the receiving body’s edges and therefore eliminates the need for receiver refinement beyond what is necessary to minimally yet accurately represent its geometry. When extending its usage to a blocked setting, the MTI algorithm is insufficient when paired with the SAI method. This is evidenced in Fig. 2b where the singular centroid-tocentroid ray cast from the refined element on body A1 to the unrefined surface of A 2 does not detect the presence of the blocking structure. Given MTI’s use of centroid-tocentroid rays and SAI’s lack of receiving body refinement, the reduced number of rays oversimplifies the effect of the blocking.
Numerous efforts have been made to exploit the advantages of SAI-based methods. To reduce the initial demand for refinement of the receiving surface, Vadez et al. proposed the idea of progressive view factors. When partial occlusion is detected, the receiving surface is recursively subdivided into smaller elements until full visibility or no visibility is confirmed for each pair [3]. While allowing for a more thorough investigation of partial occlusion, this still relies on a binary value of visibility and ultimately results in the refinement of the receiving body, which increases the computational expense of using the algorithm. Fransisco et al. detail the use of Stoke’s
theorem to calculate view factors, which allows for the efficient evaluation of complex geometries; but in the presence of partial occlusion, recursive refinement of the receiving body is similarly applied [4]. G. Walton offers a different solution that uses adaptive integration to adjust the integrated edges of the receiving surface given the borders generated by the shadow of the blocking structure [1]. It succeeds in not requiring additional refinement, but it experiences challenges when handling more complex blocking structures, as they must first be decomposed to discern the edges of the whole shadow.
This project seeks to develop and analyze an alternative SAI-based solver that accurately accounts for partial occlusion and does not require additional refinement of the receiving surface or edge recalculation.
The criteria for the proposed algorithm include the following: it does not rely on additional mesh refinement of the receiving body, it does not require the simplification of blocking structures, and the receiving element remains unaltered. Therefore, the algorithm rejects the idea of a binary representation of sight between elements and instead produces a value between 0 and 1 that is applied to the unblocked Fij value. This greater degree of specificity in the effect of occlusion is attained by using a volume-based solver that evaluates the entire space between an emitting and receiving element rather than reducing this space to a singular ray cast between element centroids, as seen in the MTI algorithm.
Figure 3: For the example scenario in (a), the approaches of both Block Intersect and Polyshape Intersect are provided. Block Intersect first generates the convex hull seen in (b) before projecting the parsed blocking structure onto the receiver as seen in (c). Polyshape Intersect projects the entire blocking structure into the plane of the receiver as seen in (d) and then parses the projection to what remains inside the receiver as seen in (e).
Where necessary, the new algorithm first simplifies an emitting and receiving pair of elements to preserve only the parts of them visible to each other. It then employs four-point Gaussian Quadrature to determine evaluation points for each emitting element and assign each a weight factor [5]. After calculating the unobstructed Fij value at one evaluation point using SAI, MATLAB’s convhull function is used to define a volume bounding the quadrature point on the emitting surface and the vertices of the receiver. Given an obstruction (an example is provided in Fig. 1a), the blocking structure is modified to retain only what exists within the defined volume as shown in Fig. 3b. This fragment of the blocking structure is then projected into the plane of the receiving element (illustrated in Fig. 3b), the projection’s area is divided by the total area of the receiving element (illustrated in Fig. 3c), and this value is then applied to the unblocked Fij . This algorithm is referred to as Block Intersect.
Following this same conceptual process, an alternative approach was developed to test the order of mathematical procedures and reduce the number of mathematical calculations. This secondary approach projects the entirety of the visible blocking structure into the plane of the receiving element as shown in Fig. 3d , where it is then parsed to retain only the components within the element by way of MATLAB’s polyshape class (shown in Fig. 3e). In the same way as the Block Intersect approach, the area of the projected shadow is divided by the total area of the element, and this value is applied to the unblocked Fij . This algorithm is referred to as Polyshape Intersect.
To analyze the proposed algorithm and investigate its possible advantages, it was tested against several existing methods. The DAI method paired with MTI (DAI-MTI) is utilized to validate the solutions of the proposed algorithm. This approach is visually represented in Fig. 1. Where both the emitting and receiving meshes are heavily refined, the DAI-MTI method offers a benchmark-level solution. This method is referred to as DAI-MTI Double Refinement (DR). When only the emitting mesh is refined, the DAI-MTI method demonstrates the failure of MTI to account for occlusion. This method is referred to as DAI-MTI Single Refinement (SR), and its failures are visually akin to the failures of SAI when paired with MTI as portrayed in Fig. 2 . A third algorithm, constructed using SAI and concepts detailed by G. Walton [1], is included to illustrate how current SAI-based solvers may manage occlusion. This method is referred to as SAI Comparison.

The tested geometries were selected to represent realistic scenarios for which a reliable solution can be calculated. Initial tests utilize successive refinement of the emitting surface to test convergence to the accepted solution given by the consistently ultra-refined DAI-MTI DR method. For tests of this nature, the error is defined as the absolute percent difference from the accepted solution: error = |true – numeric| / true. For all the following tests, prior to including blocking structures, the unblocked configurations were tested with the successive refinement of the emitting and receiving surfaces for DAI and only the emitting surface for SAI against an analytic solution. Based on these results, an appropriate degree of element refinement was determined as to eliminate unintended error from the base algorithms.
Table 1: Number of elements for each distmesh2d refinement level given a unit square represented by two triangles.
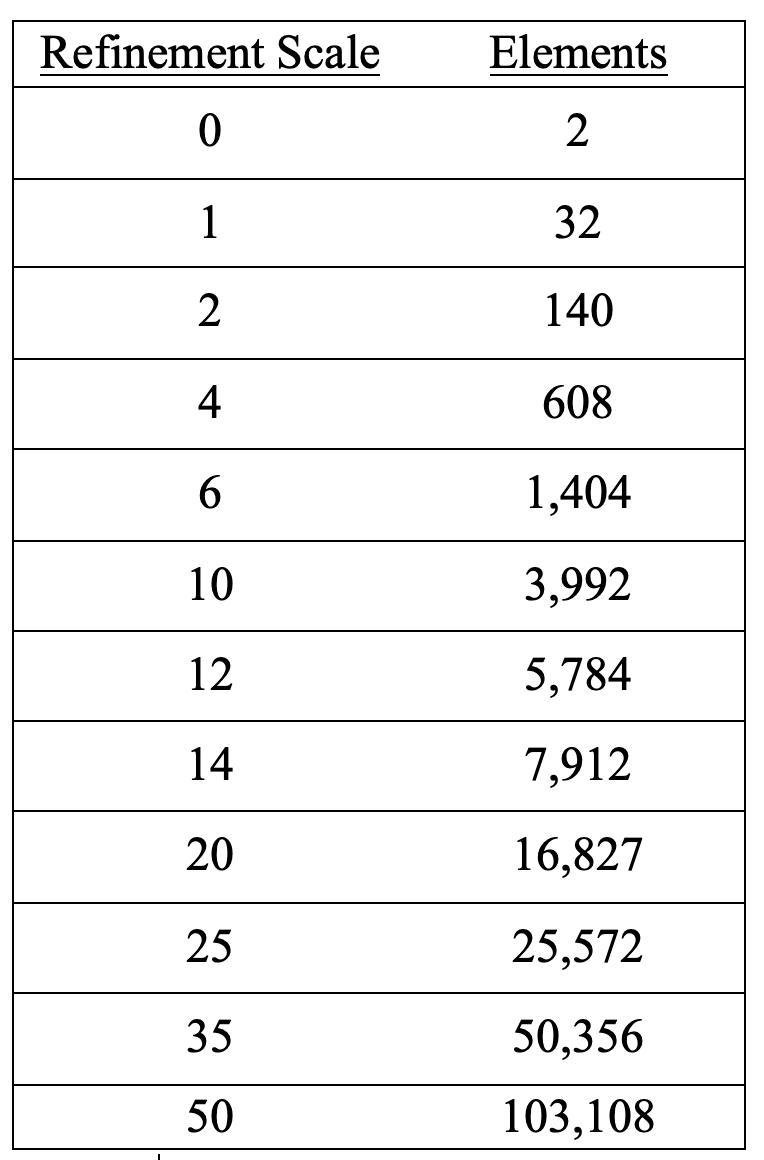
All mesh refinement was achieved using the distmesh2d algorithm [6]. This method of refinement was chosen due to its generation of high-quality mesh elements (where high-quality is defined as being close to an equilateral triangle). Given that none of the testing configurations involve curved surfaces or edges, there are no known limitations of this. A refinement level of 0 represents the least possible number of tessellations to describe a body’s geometry accurately. At each subsequent level, the refinement scale is inversely proportional to the nominal mesh spacing, with smaller mesh spacing corresponding to higher mesh resolution and more elements. The
relationship between the refinement scale and the number of elements is not strictly linear, and the exact number of tessellations are given in Table 1.
For each configuration of the participatory bodies, the methods were tested with at least three distinctly different levels of refinement of the emitting body. Using the values at each of these levels and the method outlined by Celik et al., the Grid Convergence Index (GCI) was calculated [7]. This value offers numerical uncertainty in the solution associated with the highest level of refinement.
The following sections evaluate the performance of the proposed solver against the benchmark-level solutions provided by DAI-MTI DR and in comparison to DAI-MTI SR and SAI Comparison. The test cases are chosen to investigate a comprehensive set of scenarios to record the strengths and limitations of the proposed method. Section 3.1 considers parallel unit plates with three different blocker placements and utilizes successive mesh refinement to provide an initial validation of the proposed algorithm. Section 3.2 considers the case of offset perpendicular unit plates and a wide range of blocker placements to investigate how the location of the blocking structure may affect the accuracy of the proposed method. Section 3.3 considers parallel unit plates and a blocker with uniform placement and varying size. It is noted that while the proposed algorithms use moderately different approaches, they are proven to produce the same Fij values as they are both dependent on the area averaging of the shadowed to total receiver area. Differences do arise in their run times as Polyshape Intersect was noted to be comparatively faster than Block Intersect. Additionally, Polyshape Intersect had comparable run times to those of SAI Comparison as both follow similar methods of projection and differences only exist in the handling of the shadowed area.


Figure 4: Test 1 geometries where the emitter is red, the receiver blue, and the blocker green. Test 1a corresponds to (a), Test 1b to (b), and Test 1c to (c).


Figure 6: Test 2 geometry where the emitter is red and the receiver blue. The blocking structure moves diagonally within the space between the emitting and receiving surfaces.
SR SAI Comparison Block Intersect Polyshape Intersect
Figure 5: Error for Test 1 geometries as functions of emitter refinement, showing the solution accuracy for the proposed method in comparison to a current SAI-based method and the DAI-MTI SR method. Numerical uncertainty was calculated using the GCI with the refinement levels of 3, 6, and 12. Error for Test 1a is given in (a), where a blocker exists between two parallel unit plates and is offset towards the receiver (as shown in Fig. 4a). For a refinement level of 12, DAI-MTI SR, SAI Comparison, and the proposed algorithm had numerical uncertainties of 0.00982%, 4.98e-4%, and 3.13e-4%, respectively, as given by the GCI. Error for Test 1b is given in (b), where a blocker is centered in the space between two parallel unit plates (as shown in Fig. 4b). For a refinement level of 12, DAI-MTI SR, SAI Comparison, and the proposed algorithm had numerical uncertainties of 0.0401%, 5.49e-5%, and 6.39e-5%, respectively, as given by the GCI. Error for Test 1c is given in (c), where a blocker is between two parallel unit plates and is offset towards the emitter (as shown in Fig. 4c). For a refinement level of 12, DAI-MTI SR, SAI Comparison, and the proposed algorithm had numerical uncertainties of 0.0101%, 1.92e-6%, and 0.00848%, respectively, as given by the GCI.
When only the emitting body is refined, both proposed methods outperform the DAI-MTI SR method, yielding a better approximation of the Fij value. For the geometries in Fig. 4a , Fig. 4b, and Fig. 4c , the proposed algorithms converge to Fij values with errors between 0.760% and 2.43% whereas the DAI-MTI SR method converges to values with errors between 15.4% and 30.0% as seen in Fig. 5a, b, and c The profound failure of DAI-MTI SR to produce a reasonable Fij value illustrates the demand for more robust solutions that can accurately evaluate partial occlusion without the need for high degrees of refinement on both surfaces. The proposed methods do not outperform the representation of a current SAIbased solver (SAI Comparison), which has consistent convergence to a value with 2.20e-4% error.
Figure 7: Fij values for Test 2 (Fig. 6) as a function of blocker position between the offset parallel unit plates showing the abilities of the tested methods to follow the benchmark-level results as given by DAI-MTI DR. The maximum numerical uncertainty for DAI-MTI SR, SAI Comparison, and the proposed algorithm were 0.0161%, 5.60e-4%, and 0.00163%, respectively; these values utilize the GCI for refinement levels 10, 20, and 35.
To more broadly test the capabilities of the proposed solutions, the second test configuration retains a consistently high scale of refinement for a series of 16 related configurations. A Grid Independence Study was performed on the unblocked configuration in order to determine an adequate level of refinement. For the refinement levels of 6, 12, and 20, the GCI yields a numerical uncertainty of 4.94e-3% for DAI and 4.63e-9% for SAI. These are applied to the Fij values found with the highest level of refinement which for DAI had an error of 2.95e-3% and SAI an error of 7.97e-8% when compared to the proven analytic solution. Given the low nature of these values, a refinement level of 20 or higher was determined sufficient. For the benchmark-level solution, DAI-MTI DR utilized a refinement level of 50 on both the emitting and receiving surfaces to ensure enough centroid-to-centroid rays were cast for accurate use of MTI. All other methods utilized a refinement level of 35.
In this test, the blocking structure begins with an edge in both the plane of the emitting and receiving bodies, which
are offset from the origin by 0.2 units. It then moves along the diagonal plane that bisects the space between the participatory bodies, as shown in Fig. 6. Where the Fij value is calculated at each step, Fig. 7 shows that the DAI-MTI SR method consistently fails to account for occlusion, whereas the proposed methods and SAI Comparison method offer comparatively better results. Using DAI-MTI DR as the accepted solution, DAI-MTI SR, SAI Comparison, and the proposed solutions had maximum errors of 31.7%, 4.30%, and 6.55%, respectively. DAI-MTI SR notably fails to calculate even the unblocked Fij value, further proving its disadvantage as an algorithm.
A specific configuration with an intermediate position of the blocker was chosen to further investigate the numerical uncertainty of the methods. For position 5, the refinement levels of 10, 20, and 35 were used to calculate the GCI of each algorithm. For this geometry, DAI-MTI SR had an error of 12.9% and an uncertainty of 1.09e-3%, SAI Comparison had an error of 1.17e-3% and an uncertainty of 1.60%, and the proposed method had an error of 2.94% and an uncertainty of 2.20e-5%. These values of uncertainty offer confidence that the level of refinement was sufficient to produce results true to the algorithms’ capabilities.


8:

Figure 9: Fij values for Test 3 (Fig. 8) as a function of blocker growth showing the abilities of the tested methods to follow the benchmark-level results as given by DAI-MTI DR. The blocker is centered in the space between two parallel unit plates. The maximum numerical uncertainty for DAI-MTI SR, SAI Comparison, and the proposed algorithm were 0.0527%, 1.03e-4%, and 1.07e-4%, respectively; these values utilize the GCI for refinement levels 4, 10, and 25.


and the
the following 10 steps.
A third test was completed to evaluate the proposed methods for a range of blocker sizes. A Grid Independence Study was performed on the unblocked configuration using refinement levels 6, 12, and 20. This study found DAI to have an error of 2.13e-3% when compared to the analytic value and an uncertainty of 5.68e-3%, and SAI was found to have an error of 5.73e-9% and an uncertainty of 6.12e-8%. These results supported the choice to use a refinement level of 50 for DAI-MTI DR to ensure accurate values and a level of 25 for all other algorithms.
The full test configuration is shown in Fig. 8 , where each successive blocker is 0.1 units longer and 0.1 units wider than the previous. For this test, the resulting values from the DAI-MTI SR method clearly illustrate its limitations, as it reports no visibility from the instance where the blocker is 0.7 by 0.7 units onward despite the continued visibility until the size of the blocker meets that of the participatory surfaces. This occurs as the blocker exceeds the locations of the receiving element centroids, creating the illusion that there is no longer any visibility. The SAI Comparison and proposed methods closely follow the trend established by DAI-MTI DR as seen in Fig. 9. The maximum error of DAI-MTI SR, SAI Comparison, and the proposed methods are 11.2%, 1.8e-2%, and 5.08e-1%, respectively.
To provide additional verification of the results, a sample Grid Independence Study was performed for blocker size 5. For this configuration, refinement levels 4, 10, and 25 were used to calculate the GCI and related numerical uncertainty. DAI-MTI SR was found to have an uncertainty of 4.15e-3%, SAI Comparison 1.88e-5%, and the proposed methods 3.58e-5%. These values confirm that the chosen level of refinement is sufficient to reflect the true abilities of the algorithms.
This study explores a novel method of numerically quantifying the effect of partial occlusion in an effort to have more robust methods of calculating Fij values for complex structures. The results demonstrate the need for and advantage of robust methods for handling partial occlusion. The DAI-MTI SR method clearly displays the inability of MTI to account for occlusion with the refinement of only one participatory surface whereas the proposed algorithms are capable of more accurately accounting for occlusion. The proposed algorithms compete more closely with that described by G. Walton and do not require the redefinition of the edges of the receiver. However, they do not outperform this method and exhibit their own limitations to achieving the accepted solution.
Given the proposed methods’ reliance on a ratio of shadowed to total receiver area, it neglects the specific location of the shadow and may oversimplify the effect of obstructions. The continued testing and revision of the proposed methods will aim to improve algorithm performance through giving consideration to the location of the shadowed region relative to the participatory surfaces and will also aim to improve computational efficiency. With the opportunity to reduce the burden of emitter refinement and its reliance on simple mathematical calculations, the proposed algorithm may prove itself advantageous over other methods.
Further work will require the investigation of more sophisticated element configurations and will chart the algorithm’s ability to handle more demanding problems in order to identify where revision is necessary. It will also seek to better quantify the differences in computational expense when compared to existing solutions.
Computational access and guidance were provided by Dr. Matthew Barry. Additional support was provided by undergraduate student Natan Herzog. Funding was provided by the Swanson School of Engineering and the Office of the Provost at the University of Pittsburgh.
[1] G. Walton (2002), Calculation of Obstructed View Factors by Adaptive Integration. (National Institute of Standards and Technology, Gaithersburg, MD), NIST Internal Report (IR) 6925. https://nvlpubs.nist.gov/ nistpubs/Legacy/IR/nistir6925.pdf
[2] T. Möller and B Trumbore, “Fast, minimum storage ray/ triangle intersection,” in ACM SIGGRAPHI, New York, NY, USA: Association for Computing Machinery, 2005.
[3] S. C. Francisco, A. M. Raimundo, A. R. Gaspar, A.V. M. Oliveira, and D. A. Quintela, “Calculation of view factors for complex geometries using Stokes’ theorem,” Journal of Building Performance Simulation, vol. 7, iss. 3, pp. 203-216, Jun. 2013, doi: 10.1080/19401493.2013.808266.
[5] J. Burkardt. “Quadrature Rules for Triangles.” https:// people.sc.fsu.edu/~jburkardt/datasets/quadrature_ rules_tri/quadrature_rules_tri.html
[6] P. Persson and G. Strange, “A Simple Mesh Generator in MATLAB,” SIAM Review, vol. 46, iss. 2, 2004, doi: 10.1137/S0036144503429121.
[7] I. B. Celik, U. Ghia, P. Roache, and C. J. Freitas, “Procedure for Estimation and Reporting of Uncertainty Due to Discretization in CFD Applications”, in Journal of Fluids Engineering, Jul. 2007, doi: 10.1115/1.2960953.
Jared Espiritu1, Seth Strayer1, Albert To1
1Department of Mechanical Engineering and Materials Science, University of Pittsburgh, Pittsburgh, PA
JARED ESPIRITU
Jared Espiritu is currently a junior at West Virginia University pursuing a dual major in mechanical and aerospace engineering.
SETH STRAYER
Seth Strayer is a mechanical engineering PhD candidate in the Department of Mechanical Engineering and Materials Science at the University of Pittsburgh. Seth began his PhD studies in August 2019 and was awarded the NASA Space Technology Graduate Research Opportunity (NSTGRO) Fellowship in August 2020, which funded him until August 2024. His PhD research focuses on microscale process modeling of Inconel 718 using computational fluid dynamics and finite element analysis while coupling these simulation techniques with machine learning to improve the simulation fidelity and efficiency.
DR. ALBERT TO
Dr. Albert To is currently the William Kepler Whiteford Professor in the Department of Mechanical Engineering and Materials Science at University of Pittsburgh, where he also serves as the Director of the ANSYS Additive Manufacturing Research Laboratory. He is also the Founding Director of the MOST-AM Consortium, which is a public-private partnership of 30+ organizations formed to address the most pressing needs in modeling and simulation for additive manufacturing. His current research interests lie in process simulation, process-microstructureproperty modeling, and in-situ monitoring for laser-based metal additive manufacturing. During the past 10 years, his research in these areas has been supported by DOD, DOE, NASA, America Makes, NRC, and NSF. Dr. To has over 150 peer-reviewed journal publications and is currently an associate editor for Additive Manufacturing. Dr. To has been a recipient of the NSF BRIGE Award in 2009, the Board of Visitors Faculty Award from the School of Engineering in 2016, and the Carnegie Science Award in the Advanced Manufacturing and Materials Category in 2018.



Parts fabricated using laser powder bed fusion contain quality-impeding defects. Keeping a consistent melt pool size can minimize defects. This paper analyzes the effects of heat accumulation on melt pool size in overhang bridges. Understanding these effects can help manufacturers optimize their process parameters to improve part quality.
Keywords: additive manufacturing, laser powder bed fusion, melt pool, heat accumulation.
Laser powder bed fusion (LPBF) is a form of additive manufacturing (AM) that fabricates metal parts layerby-layer using a scanning laser. Its ability to fabricate complex geometries makes it a viable alternative to subtractive manufacturing. However, defects accumulated throughout the process degrade part quality and hinder the wider adoption of AM. Minimizing melt pool size changes throughout the process is one way of improving part quality. This paper investigates how heat accumulation affects melt pool size in fabricated overhang bridges. A RoboMet machine was used to prepare images of samples so their melt pools could be measured in Fiji. Data analysis revealed that bridges scanned perpendicular to the overhang experienced greater heat accumulation than parallel-scanned bridges. Melt pool depth in parallelscanned bridges deepened around regions of minimum thickness. Melt pool depth in perpendicular-scanned bridges steadily increased with fluctuations. Heat accumulation in this study appeared to have little to no effect on melt pool width. The demonstrated effect of heat accumulation on melt pool size can help manufacturers optimize parameters to reduce these effects and improve part quality.
Laser powder bed fusion (LPBF) is an additive manufacturing (AM) technique for fabricating metal components. Metal powder is distributed across a base plate and a laser beam melts the powder together while more powder is spread layer-by-layer between each laser pass [1-3]. Melt pools are formed during the process as the powder absorbs the laser energy and solidifies after cooling; tracks of melt pools are formed along the laser scanning direction [4-5]. The base plate lowers as more layers are added until the part is completed [1-2].
LPBF offers several advantages over subtractive manufacturing methods, including reduced material waste [1], minimal post-processing [5], and improved dimensional control [2]. LPBF can produce parts containing highresolution features [2], intricate internalities [6], and complex geometries at almost full density [5]. LPBF has proven valuable in the medical, automotive, and aerospace fields, such as aircraft that use AM-fabricated parts to lower fuel consumption and carbon footprint [2, 7].
Common defects in LPBF include porosities, voids, cracks [1], balling, and spatter [5]. The former two are caused by a lack of fusion, which is when the laser inadequately heats the powder. Balling occurs when melt tracks split into droplets, increasing surface roughness and porosity while potentially disrupting new layers [5]. Spatter occurs when excessive melt pool temperatures cause recoil pressure to expel molten material across the powder bed causing gaps and surface roughness [5]. These defects accumulate throughout fabrication and lower part quality [6].
The key to obtaining high-quality parts from LPBF depends on stable melt pool dimensions, as melt pool instability causes defects [2, 8]. For example, melt pool depth and width can affect density while length can affect the microstructure [8]; this study focuses on depth and width measurements. Improved understanding of process physics via effective simulations and models that determine optimal parameters can enhance part quality [8]. Controlling melt pool dimensions can be accomplished by optimizing process parameters like laser scan path, power, and speed to reduce defects in fabricated parts [6]. Bayat et al. discovered that higher scanning speeds form smaller melt pools, while lower speeds expand the melt pool [7]. Chen et al. found that higher base plate preheating temperatures formed deeper melt pools [6]. Li et al. and Yin et al. found that increasing laser power increased melt pool width and depth [5, 9].
The effects of heat accumulation and other forms of heat on melt pools have been previously studied. Bayat et al.’s multi-physics model found that heat accumulation in higher layers led to more lack of fusion defects in the lower layers [1]. Hagenlocher et al. developed an analytical model to predict the residual temperature increase from heat accumulation. The model identified that besides laser power, material deposition frequency and layer thickness impacted heat accumulation [10]. Zhang et al. developed
a finite element model to find that convection increased width while conduction increased depth and width, with heat accumulation increasing the magnitudes of these effects [4].
This paper examines heat accumulation and how it affects melt pool size in LPBF. Understanding this relationship will help manufacturers optimize process parameters and part designs to minimize these effects and prevent significant changes in melt pool dimensions to improve part quality. Rectangular arch bridges with a thin overhang (region unsupported underneath) in the middle of the part were designed to restrict heat dissipation, with the resulting heat accumulation expected to increase the depth and width of the incoming melt pools. Bridge 1 was laser scanned and printed perpendicular to the overhang’s sides while Bridge 3 was printed parallel. Heat accumulation is expected to increase the melt pool sizes for both bridges, with the parallel bridge is expected to yield larger melt pools than the perpendicular bridge since the different scanning directions will influence the amount of heat accumulation experienced.
Four bridges were printed using Inconel 718 powder, a high-strength, nickel-based alloy. As seen in Figure 1, only Bridges 1 and 3 were used for this report. Two sets of measurements were taken for Bridge 1 while only one was taken for Bridge 3. Both bridges were printed with 135 tracks or 135 laser passes for each layer. The scanning orientations for both bridges are shown in Figure 2 Once printed, a laser cuts the bridges into four sections perpendicular to the scanning direction as shown in Figure 1

Figure 1: Picture of bridge samples and visual guide of how each bridge was cut. The red dot corresponds to the cutting origin.

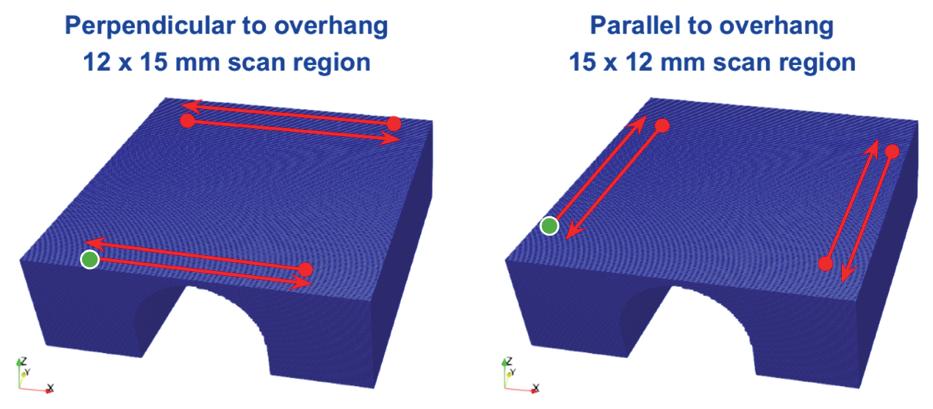
The laser-cut sections of the sample are placed in a RoboMet machine where a pre-loaded recipe programs the machine to grind and polish the samples using a series of rotating platens that remove material. The samples are then dipped into an etching solution to make melt pools visible for photography. After etching, a microscope captures pictures of the sample that are stitched together using overlap detection, which are shown in Figure 3
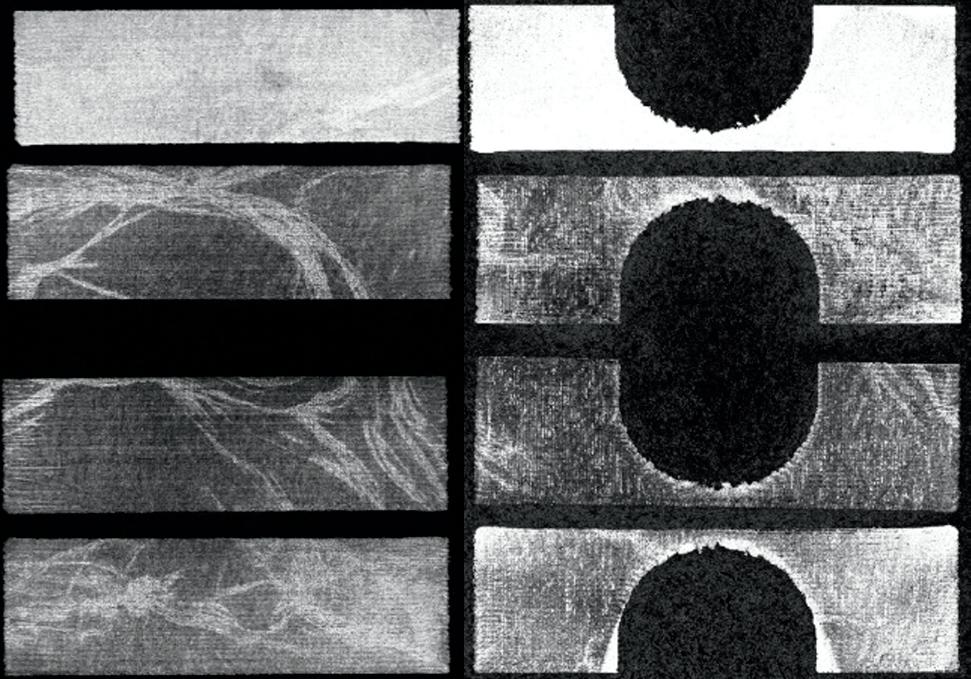
In Fiji, a written script was used to reorient and the images for every sample while another placed dots over the expected location of the melt pool. Images were reoriented to be perpendicular. For brightness, that included the most black and white hues was selected using minimum and maximum bound sliders. After the dots were placed, the depth and width of each melt pool were measured, with the width measured from the widest point to the center and the depth measured from the deepest point to intersect the width measurement line at a 90-degree angle. This measuring method is shown in Figure 4

Figure 5 displays the mean melt pool depth and width of all the slices’ sections for each of the three data sets plotted against the track numbers ranging from 1 to 135. The mean depths for the Bridge 1 measurements reach a local maximum around track number 50 and then an absolute maximum around track 125 before flattening out. The mean widths for Bridge 1 remain relatively constant and stay within the range of about 175 and 225 microns. For Bridge 3, the mean depth steadily increases with the melt tracks until it peaks around tracks 65 and 70 and decreases afterward. The smallest mean depths are near the initial and final tracks. The mean widths also remain relatively constant, staying between 175 and 200 microns.


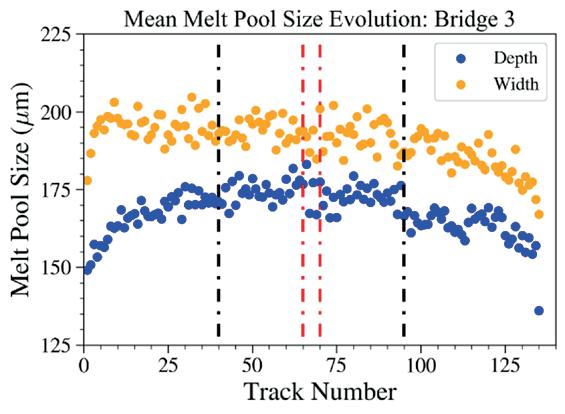
Figure 5: Mean melt pool size evolution for Bridges 1 and 3. For Bridge 3, the overhang region is denoted by the black dotted lines. The overhang’s minimum thickness region is denoted by the red dotted lines.
Figures 6 and 7 portray some example plots of the depth and width of each individual melt pool plotted along their respective x-coordinate positions corresponding to the cutting origin in Figure 1, with five melt track measurements per plot. Comparing the depth between Bridge 1 and Bridge 3, the depths of Bridge 3 are greater than the depths of Bridge 1. Comparing the widths between Bridge 1 and Bridge 3, the widths fall around similar ranges of values.
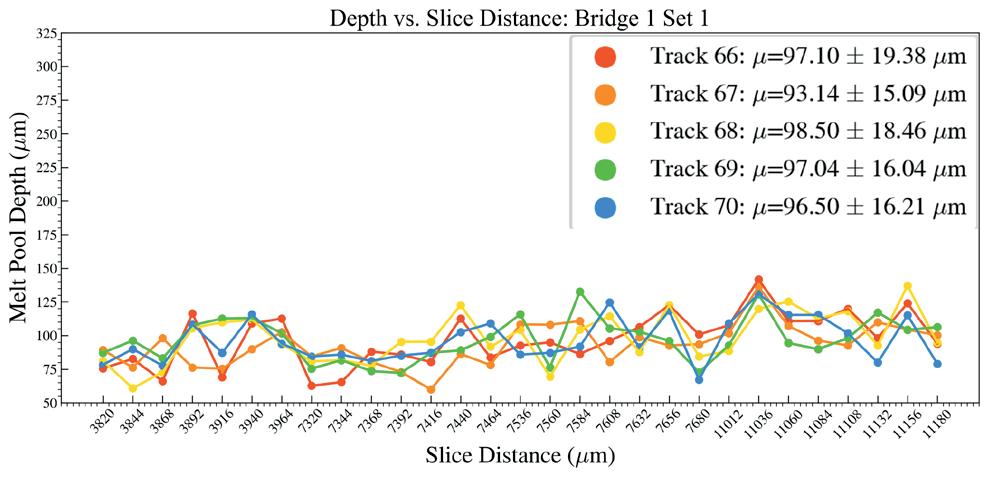
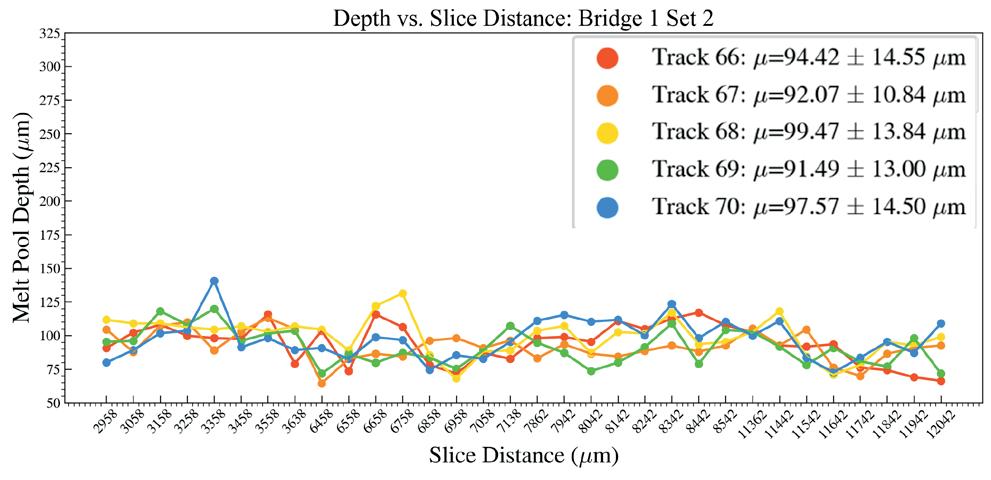
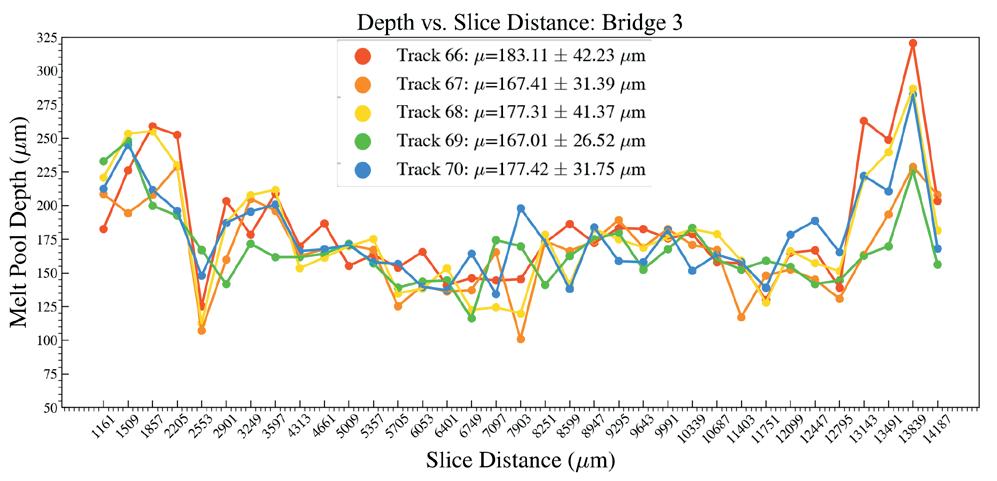
Figure 6: The depth of each melt pool for Bridges 1 and 3 plotted against their corresponding location on the x-axis as established in Figure 2. Legends are enlarged for visual clarity and include mean and standard deviation.
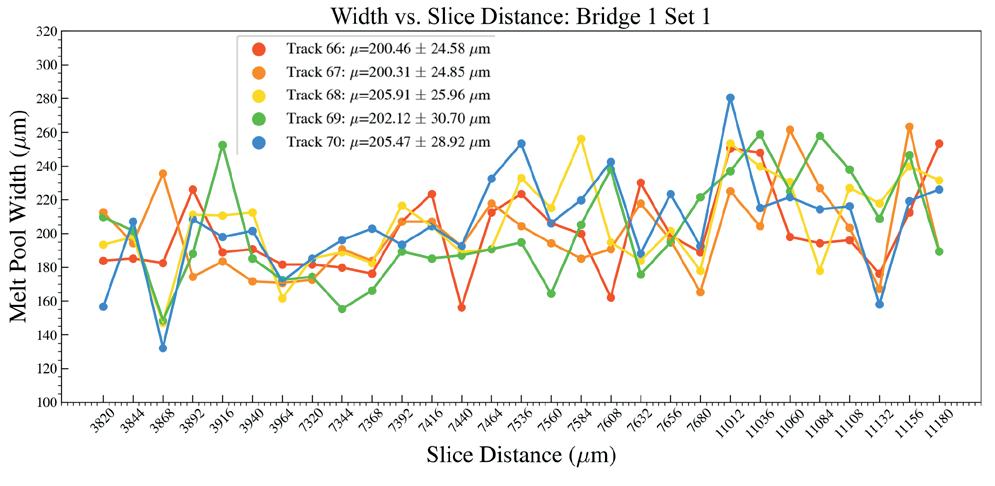
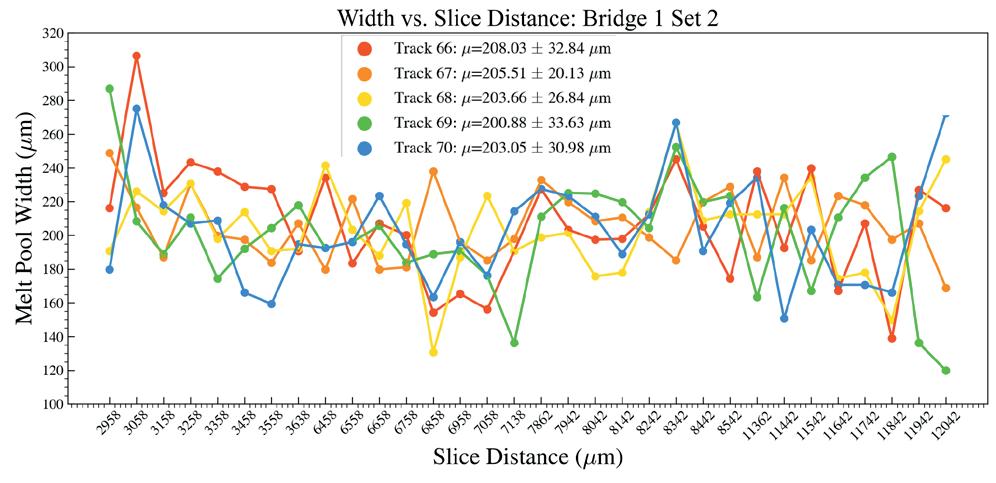

Figure 7: The width of each melt pool for Bridges 1 and 3 plotted against their corresponding location on the x-axis as established in Figure 2. Legends are enlarged for visual clarity and include mean and standard deviation.
When comparing the two bridges, the mean depths and individually plotted depths for Bridge 3 are greater than the mean depths of Bridge 1. This is due to the nature of the laser scanning relative to the overhang direction. Since Bridge 1 was scanned perpendicular to the overhang, the area underneath changed from thick layers to the thin overhang back to the thick layers as the laser was scanning. Bridge 3 was scanned parallel to the overhang, meaning a certain set of laser scans passed exclusively over the thin overhang region, which would lead to greater heat accumulation and therefore deeper melt pools in Bridge 3.

For Bridge 1, the melt pool depth increases with the track number, indicating that heat accumulation increases melt pool depth as more tracks are scanned. However, rather than steadily increasing, the melt pool depth data fluctuates, peaking around tracks 50-55, reaching a minimum around track 70, and back up to a maximum around track 100. These fluctuations may result from process uncertainties and conditions not considered in simulations. For Bridge 3, the regions corresponding to the overhang region and the overhang’s minimum thickness region are labeled in Figure 5. The mean depths are greatest within the minimum thickness region, as heat accumulation would be high here. Melt tracks farthest from the overhang have smaller mean depths since there would be less heat accumulation.
For both bridges, mean widths experience little variation, which could be because of the laser drilling effect. As the laser’s heat evaporates material, it creates a strong pressure that acts parallel to the beam’s direction, pushing down on the melt pool and increasing its depth. However, this pressure is weaker in the transverse direction, which could explain the lack of variation in mean melt pool widths.
This study examined how heat accumulation from cross-sectional area changes in overhang bridges printed from LPBF affected melt pool size. Melt pool measurements revealed that bridges laser-scanned parallel to the overhang will have greater melt pool depth than perpendicular-scanned bridges. In parallel bridges, the melt pool depth peaked in the minimum overhang thickness region due to high heat accumulation. In perpendicular bridges, the melt pool depth increases with melt tracks due to heat accumulation, with fluctuations in data trends due to process uncertainties. The melt pool width across all three remained relatively within the same range across all melt tracks, likely due to the laser drilling effect. Now that the effects of heat accumulation on melt pool size have been demonstrated, manufacturers should keep these effects in mind when setting process parameters to optimize part quality. Future research should focus on controlling or minimizing the effects of heat accumulation induced by cross-sectional area changes on melt pool size to reduce part defects.
The author acknowledges the Swanson School of Engineering’s MEMS Department and the MEMS FIRE program, as well as the National Science Foundation for providing funding.
[1] M. Bayat, S. Mohanty, and J. H. Hattel, “Multiphysics modelling of lack-of-fusion voids formation and evolution in IN718 made by multi-track/
multi-layer L-PBF,” Int J Heat Mass Transf, vol. 139, pp. 95–114, Aug. 2019, doi: 10.1016/j. ijheatmasstransfer.2019.05.003.
[2] W. E. Frazier, “Metal additive manufacturing: A review,” 2014, Springer New York LLC doi: 10.1007/s11665-0140958-z.
[3] P. S. Cook and A. B. Murphy, “Simulation of melt pool behaviour during additive manufacturing: Underlying physics and progress,” Jan. 01, 2020, Elsevier B.V. doi: 10.1016/j.addma.2019.100909.
[4] D. Zhang, P. Zhang, Z. Liu, Z. Feng, C. Wang, and Y. Guo, “Thermofluid field of molten pool and its effects during selective laser melting (SLM) of Inconel 718 alloy,” Addit Manuf, vol. 21, pp. 567–578, May 2018, doi: 10.1016/j.addma.2018.03.031.
[5] E. L. Li, L. Wang, A. B. Yu, and Z. Y. Zhou, “A threephase model for simulation of heat transfer and melt pool behaviour in laser powder bed fusion process,” Powder Technol, vol. 381, pp. 298–312, Mar. 2021, doi: 10.1016/j.powtec.2020.11.061.
[6] Q. Chen et al., “Elucidating the effect of preheating temperature on melt pool morphology variation in Inconel 718 laser powder bed fusion via simulation and experiment,” Addit Manuf, vol. 37, Jan. 2021, doi: 10.1016/j.addma.2020.101642.
[7] M. Bayat, S. Mohanty, and J. H. Hattel, “A systematic investigation of the effects of process parameters on heat and fluid flow and metallurgical conditions during laser-based powder bed fusion of Ti6Al4V alloy,” Int J Heat Mass Transf, vol. 139, pp. 213–230, Aug. 2019, doi: 10.1016/j.ijheatmasstransfer.2019.05.017.
[8] W.E. King et al., “Observation of keyhole-mode laser melting in laser powder-bed fusion additive manufacturing,” J. Mater. Process. Technol. 214 (12) (2014) 2915–2925.
[9] J. Yin et al., “Rapid prediction of the relationship between processing parameters and molten pool during selective laser melting of cobalt-chromium alloy powder: Simulation and experiment,” J Alloys Compd, vol. 892, Feb. 2022, doi: 10.1016/j. jallcom.2021.162200.
[10] C. Hagenlocher, P. O’Toole, W. Xu, M. Brandt, M. Easton, and A. Molotnikov, “Analytical modelling of heat accumulation in laser based additive manufacturing processes of metals,” Addit Manuf, vol. 60, Dec. 2022, doi: 10.1016/j.addma.2022.103263.ng
Malini Harinath1,4 , Marrisa Therriault1,2,4 , Pamela Moalli1-5, Katrina Knight1,4
1Department of Bioengineering, Swanson School of Engineering, University of Pittsburgh, Pittsburgh, PA, 2McGowan Institute for Regenerative Medicine, University of Pittsburgh, Pittsburgh, PA, 3Department of Obstetrics, Gynecology, and Reproductive Sciences, University of Pittsburgh, Pittsburgh, PA, 4Magee-Womens Research Institute, University of Pittsburgh, Pittsburgh, PA, 5Division of Urogynecology & Reconstructive Pelvic Surgery, University of Pittsburgh Medical Center Magee-Womens Hospital, Pittsburgh, PA
MALINI HARINATH
Malini Harinath is a senior Bioengineering major with a minor in Chemistry. Malini’s research interests lie in the characterization of the cellular response to implanted polypropylene mesh as a treatment for pelvic organ prolapse. She intends to attend medical school and pursue a career in women’s health.
MARRISA THERRIAULT
Marrisa Therriault is a sixth-year PhD candidate in Bioengineering in Dr. Pamela Moalli’s lab at MageeWomens Research Institute. Her research focuses on the host response to implanted polypropylene mesh for pelvic organ prolapse repair, as well as explores regenerative strategies for women’s health applications.
PAMELA MOALLI, MD, PHD
Dr. Moalli is a Professor in the Department of Obstetrics, Gynecology and Reproductive Sciences at the University of Pittsburgh with secondary appointments in the Department of Bioengineering, the McGowan Institute of Regenerative Medicine, and the Clinical and Translational Institute at the University of Pittsburgh; and Adjunct Professor of Bioengineering at Carnegie Mellon University. Dr. Moalli serves as the Division Director for Urogynecology and Reconstructive Pelvic Surgery and has been a senior scientist at the Magee-Womens Research Institute since 2010. Dr. Moalli was recently selected to serve as the Vice Chair of Research for the Department and interim Executive Director of the Magee-Womens Research Institute.



After completing her undergraduate degree at Brown University, Dr. Moalli received a combined MD/PhD from Northwestern University. She served her residency in Obstetrics and Gynecology at Magee-Womens Hospital of the University of Pittsburgh and then completed a fellowship in Urogynecology and Reconstructive Pelvic Surgery at the same institution. Dr. Moalli has been funded by the NIH since entering medical school in 1986. She progressed from the Medical Scientist Training Program to the Women’s Reproductive Health and Career Development Program (K 12) to become independently funded in multiple R01 grants and alternate PI on three U01 awards. She has published over 142 peer-reviewed scientific papers and 14 book chapters. Her Web of Science h-index is 36. Dr. Moalli is a regular NIH study section peer reviewer and has also served as a reviewer for the Swiss National Science Foundation. She has served on numerous committees for AUGS. She is current Vice Chair of the Grants Review Committee and Vice Chair of the Pelvic Floor Disorders National Registry.
Dr. Moalli co-directs the Translational Research Laboratories in Urogynecology. Over the last decade, her research has included understanding the pathogenesis of synthetic mesh complications which cause significant morbidity in affected women and have been the target of litigation worldwide; the development of novel regenerative materials that can be used to repair pelvic organ prolapse and urinary incontinence; characterization and activation of endogenous vaginal stem cell populations and vaginal biofabrication. Additional research interests include mechanisms of maternal birth injury and improving outcomes in women injured during childbirth.
KATRINA KNIGHT, PHD
Katrina M. Knight, PhD is an Assistant Professor in the Department of Bioengineering at the University of Pittsburgh and a BIRCWH Scholar (Building Interdisciplinary Research Careers in Women’s Health Training Program).
Dr. Knight received her PhD in Bioengineering from the University of Pittsburgh and a BS in Biochemistry from

Claflin University. Prior to joining the Bioengineering Faculty, Dr. Knight was a Postdoctoral Fellow in the MageeWomens Research Institute and Foundation Postdoctoral Fellowship Program. The overarching goal of the Knight Laboratory is to improve the lives of women with pelvic floor disorders and other gynecologic conditions/ anomalies through the development of novel and innovative treatments. Specifically, the lab focuses on pelvic organ prolapse (prolapse) and uses an interdisciplinary approach to elucidate the biologic and mechanical mechanisms of complications associated with the use of synthetic mesh in prolapse repairs. In addition to her passion for women’s health, Dr. Knight also has a strong passion for giving back to the community. She is the Director of CampBioE 2.0, the signature outreach program for the Bioengineering Department, which aims to inspire and educate the next generation of scientific and medical professionals through intentional mentorship and exposure to cutting edge, hands-on activities related to bioengineering.
Pelvic organ prolapse is often corrected with the implantation of polypropylene mesh, which can induce a maladaptive host tissue response and lead to complications. This study investigates macrophage originated myofibroblasts that contribute to fibrotic pathways associated with complications requiring revision surgery.
Keywords: pelvic organ prolapse, host immune response, macrophage to myofibroblast transition, fibrotic pathways
Abbreviations: pelvic organ prolapse (POP), polypropylene mesh (PPM), macrophage to myofibroblast transitioned (MMF), fibroblast to myofibroblast transitioned (FMF)
Pelvic organ prolapse (POP) occurs when weakened pelvic connective tissues and muscles cause the pelvic organs to descend into the vagina. Polypropylene mesh (PPM) is used to repair POP, however there is a high rate of complications such as mesh exposure into the vaginal lumen and pain. Increased mesh burden (amount of mesh in contact with the vagina) has been linked to higher complication rates in non-human primate models. Previous studies have evidenced the host response as the main driver for downstream remodeling and healing outcomes. Macrophages, a key driver of the host response to PPM, have been shown to influence resident fibroblasts to transition into myofibroblasts (FMF cells) to remodel the surrounding tissue. Previous studies have evidenced macrophages also have the capacity to transdifferentiate to myofibroblasts (MMF cells) in fibrotic areas, however, their presence in response to an implanted biomaterial has not been shown. Here, we investigated the relationship between mesh burden and clinically relevant complications (pain and exposure) by quantifying the number of macrophages, fibroblasts, fibroblast-tomyofibroblast transitioned (FMF) cells, and MMF cells present in mesh-tissue complexes explanted from women for the indication of pain and/or mesh exposure. We hypothesized a positive correlation of MMF cell presence with mesh burden, a likely mechanism for poor remodeling outcomes necessitating revision surgery.
Fifteen mesh-vagina complexes excised from women with complications (pain and/or mesh exposure) were randomly selected from a human mesh biorepository. Excised samples were labeled for alpha smooth muscle actin (αSMA), vimentin (Vim), and CD68 via immunofluorescence to identify cells that express αSMA+/Vim+ (FMF), CD68+ (macrophages), and αSMA+/ Vim+/CD68+ (MMF). Mesh burden was defined as the percentage of adventitia occupied by mesh fibers. Immunolabelling showed high mesh burden samples had 1) significantly more macrophages than FMF cells, indicating a predominant inflammatory response, and 2) significantly more macrophages and MMF cells than low mesh burden samples. Furthermore, MMF cells were observed in all samples and increased with mesh burden. Collectively, these results suggest there is a macrophage driven response to PPM implanted for POP repair in samples removed for complications, with evidence of phenotypically differentiated macrophages to myofibroblasts (MMF) cells seen to correlate with increased mesh burden.
Pelvic organ prolapse (POP) is defined as the herniation of pelvic organs into the vagina or beyond the hymen because of weakened pelvic connective tissues and muscles, affecting nearly 50% of women over 50 [1]. Common symptoms of POP include incontinence, sexual dysfunction, and pain [2,3]. In the United States, 12.6% of women will undergo repair for POP by the age of 80, and a third of these surgeries utilize polypropylene mesh (PPM) for repair [4-6]. POP repairs using mesh are advantageous as compared to native tissue repairs due to the already compromised structure of native tissue and the ability of mesh to restore anatomic properties [7]. Sacrocolpopexy is a procedure performed to correct POP utilizing mesh to reinforce the vagina, attaching it to the sacrum via a mesh bridge. This lifts the vagina and the pelvic organs back into the pelvis and restores their native anatomy [6]. Over 10 percent of women who have had POP corrected using PPM face complications, such as mesh exposure and pain, and many will require mesh excision [8,9].
Previous studies demonstrate that mesh burden, or the amount of mesh in contact with vaginal tissue, correlates with pain in patients [10,11]. Mesh burden can be evaluated by quantifying the area of a sample of vaginal tissue that contains mesh fibers and can be affected by the textile properties of mesh such as porosity, weight, and fiber size [12]. A recent study by our group showed that an increase in mesh burden led to an increase in mesh related complications (vaginal thinning and exposures) using a nonhuman primate POP repair model [13].
The host response to PPM has been defined in the vagina for POP repair, demonstrating prevalence of active cellular recruitment years following implantation [10, 11]. Macrophages, an integral cell type in the host response, mediate the foreign body response to implanted PPM [10]. Previous studies have identified macrophages as the primary driver of the host response to biomaterials. Their capacity to differentiate from pro-inflammatory to profibrotic phenotypes plays a distinct role in the resulting healing outcomes to PPM [10]. Initial macrophage presence following implantation of PPM is necessary, however the sustained presence of these cells is indicative of a maladaptive host response, poor mesh integration, and is seen in conjunction with fibrotic tissue deposition. In response to PPM, fibroblasts—a native cell to the vagina—transition to myofibroblasts (referred to as FMF cells in this paper) and increase in prevalence following
Figure 1. A representation of the steps required to analyze vaginal tissue samples for the presence of various cell types.
(1) An inclusion criteria was created, and samples were randomly selected.
(2) Samples were cryosectioned and slides were prepared. (3) Slides were labeled using immunofluorescence.
(4) Immunofluorescence imaging was performed on the samples. (5) Cell quantification, data analysis, and statistical testing was performed on the samples.
mesh implantation [13]. Myofibroblasts are essential in the wound healing process as they deposit extracellular matrix such as collagen and exert contractile force to aid in wound closure [14]. Myofibroblasts are present in normal vaginal tissue, however, their prevalence and long-term persistence is pathologic and is thought to be a contributor to fibrosis, which is linked to pain in patients [15]. Emerging data suggests that macrophages may transdifferentiate to myofibroblasts (MMF cells) in the context of fibrosis, and because of their long-term presence in response to PPM, could be the primary driver of foreign material induced fibrosis [16].
The purpose of this study was to examine the presence of myofibroblasts in mesh-vagina explants and to determine the relationship between myofibroblast origin and mesh burden. Here, we utilized mesh-tissue complexes removed from patients experiencing complications (pain and/or exposure). These samples were then labelled with fibroblast (vimentin), macrophage (CD68), and myofibroblast (α SMA) markers to evaluate the colocalization of these markers, indicating cellular origin. These cell types were first measured for correlation between mesh burden and cellular phenotype and then separated into quartiles to determine the relationship between amount of mesh burden and responding cell types. Here we hypothesized that macrophages and MMF cells would have the highest correlation with mesh burden. Both myofibroblast phenotypes (FMF and MMF) were expected to be present in mesh-vagina explants with a higher mesh burden. Therefore, we anticipated that the majority of the myofibroblasts in higher mesh burden samples are of a macrophage origin.
The schematic below describes the overall process by which samples for this study were chosen, prepared, imaged, and analyzed to understand the specific cellular response to polypropylene mesh in mesh-tissue explants ( Figure 1 below).
Samples were taken from the Mesh Biorepository, a large, IRB-approved human mesh biorepository at the MageeWomens Research Institute (IRB = CR19080175-010). The mesh biorepository maintains biological samples (i.e., mesh-tissue explants) that were removed because of maladaptive healing or complications following surgery to


repair pelvic organ prolapse, urinary incontinence, or both. Patient clinical data and condition specific questionnaires are also included in the database. It is important to note that this project only considers samples from women who underwent mesh excision surgery from a previously conducted sacrocolpopexy to treat POP. Patients who underwent other mesh implantation surgeries, such as ones to treat stress urinary incontinence (SUI), were not included in the study. Samples with minimal amounts of tissue (only mesh) were not considered due to the inability to gauge the cellular response. The inclusion criteria were the following:
• Samples with the presence of polypropylene mesh fibers
• Samples were taken from patients who underwent POP repairs
• Samples had to have adequate tissue present around mesh fibers to investigate the cellular response. Out of 243 total patients enrolled in the mesh biorepository study, only 38 patients fit the three criteria outlined above and had mesh-vagina complexes collected and stored for histological analysis. A sample size of 15 was established using a power analysis with a power of 0.8 and an alpha less than 0.05 for significance. Thus, of the 38 eligible patients, 15 samples were randomly chosen.
All MVCs were preserved in OCT and fresh frozen at -80 o C immediately following mesh excision surgery and sample procurement. Following selection of the samples included in this study, MVC cross-sections were cut into 7 µm thick sections using a Leica Cryostat. The sections were placed on negatively charged slides, with two tissue sections on each slide (one as the experimental and the other as the negative control on which no primary antibodies were placed).
The sections were labeled using a two-day immunofluorescence protocol. They were fixed using 4% paraformaldehyde for one hour and then washed thrice using a 1x phosphate buffered saline (PBS) solution. Sections were then covered with a 10 mM copper sulfate/50 mM ammonium acetate solution and incubated at 37o C for 20 minutes. Following this, the samples were washed thrice using 1x PBS and incubated with 4% donkey serum blocking solution and 0.3% Triton-X in 1x tris buffered saline for 30 minutes at room temperature. The blocking solution was removed and the 1:100 primary antibody solution made in 2% donkey serum was applied. The sections were then incubated in the primary solution overnight at 4 o C. Alpha smooth muscle actin (abcam, Cambridge, UK, ab21027), Vimentin (Novus Biologicals, Ontario, NB300-223SS), and CD68 (abcam, Cambridge, UK, ab955) were used as the primary antibodies. The following day, the primary solution was washed off the samples using 1x tris buffered saline (TBS) solution mixed with
0.1% Tween 20, as well as 1x PBS. A solution of secondary antibodies was applied at a 1:200 concentration and the sections were incubated for two hours at room temperature. Following this incubation, sections were rinsed and washed with three 15-minute cycles of 1x tris buffered saline with 0.1% Tween 20 and then three 5-minute cycles of 1x PBS. Coverslips were applied on the sections with a DAPI stain used as a nuclear marker. Lastly, the samples were imaged at 10x magnification using a Nikon 90i microscope (Nikon USA, Melville, NY).
The captured images of the immunofluorescence labeled tissue sections were analyzed using QuPath, an opensource analysis software. Total tissue area, total mesh area, and total area of tissue without mesh fibers were outlined and quantified. Mesh burden was quantified by calculating the percentage of tissue area occupied by mesh and separated into two quartiles, low and high mesh burden. Low mesh burden included samples under the 75th percentile of mesh burden and high mesh burden included samples above the 75th percentile.
Cells were digitally analyzed and quantified using QuPath. Only cells that were labelled with DAPI (nuclear) were considered in the analysis. Co-labelling of DAPI with vimentin, αSMA , and/or CD68 was used to classify the responding cells into the following cell populations: fibroblast (Vimentin+), fibroblast to myofibroblast transitioned cells ( FMF, Vimentin+ αSMA+), macrophages (CD68+), and macrophage to myofibroblast transitioned cells ( MMF, Vimentin+ αSMA+ CD68+). After cell quantification, the cell number and area data were analyzed using GraphPad Prism 10 (GraphPad Software LLC, Boston, MA).
To determine the correlation between mesh burden and responding cell type, a Chi-Square test for trend was used. Strength of the correlation between mesh burden and cell response was determined using linear fit. Tests of normality revealed non-normal data. Mann Whitney U-tests were utilized to compare the top quartile of mesh burden to the lower mesh burden quartile. A one-way ANOVA was performed to determine differences within mesh burden quartiles. Significant differences were determined with an α < 0.05 and a 95% confidence interval.
Randomization of samples that met inclusion criteria resulted in 15 mesh-vagina complexes (MVC) included in the present study. There was no significant difference in patient age (61.27 ± 10.17 years, p=0.57), BMI (27.98 ± 5.27, p=0.6898), gravidity (3 ± 2, p=0.8343), parity (2 ± 1, p=0.7045), or average time between polypropylene mesh (PPM) implantation and mesh removal surgeries (84.2 ± 47.4 months, p=0.8941) between lower and high mesh burden patients.
Figure 2 shows representative immunofluorescence images of samples fitting in three mesh burden categories: high (above 75th percentile), middle (between 25th and 75th percentile), and low (beneath 25th percentile). Merged channels as well as separate channels are shown.

Figure 2. Representative immunofluorescence images of samples labelled with αSMA, a myofibroblast marker, vimentin, a fibroblast marker, and CD68, a macrophage marker. Samples were imaged at 10x magnification. Samples seen here divided into mesh burden quartiles, as previously defined, below 25th percentile, between 25th and 75th percentile, and above 75th percentile of mesh burden. Mesh fibers indicated with white asterisks. 100 µm scale bars placed.
The excised mesh-vagina complexes demonstrated varying levels of mesh burden or amounts of PPM in contact with vaginal tissue (visualized with a star, Figure 2). A violin plot of the percentage of total adventitial area occupied with mesh revealed two distinct populations (N=15, Figure 3), a population around 10 percent of adventitial area and a smaller population around 30% of adventitial area. This allowed for separation into quartiles, categorizing above the 75th percentile as high mesh burden samples. Samples below the 75th percentile were categorized as low mesh burden samples. This was because samples below the 25th percentile and between the 25th and 75th percentiles of mesh burden largely fit in the same population ( Figure 3).
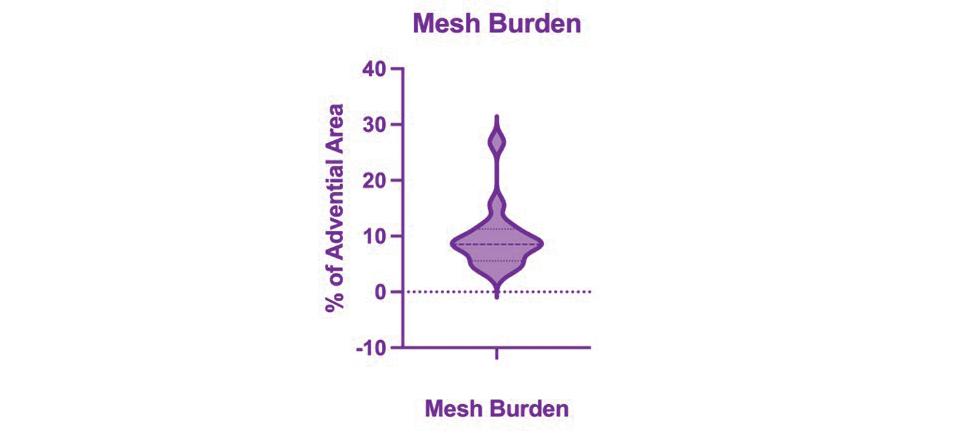
Figure 3. Percent of adventitial area occupied by mesh identified two distinct populations. Two distinct populations seen in terms of mesh burden (percentage of tissue in contact with mesh); one population centered at around 10 percent of area covered and other population centered at around 30 percent of area covered
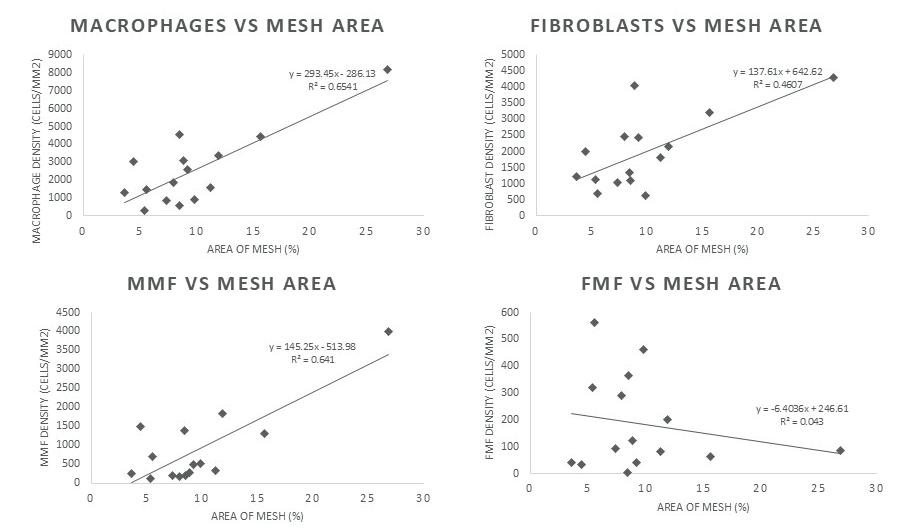
Figure 4. Percentage of sample area covered by mesh corresponding to the density (cells/mm2) of macrophages, MMF cells, fibroblasts, and FMF cells with lines of best fit
The relative amounts of fibroblasts, FMF cells, macrophages, and MMF cells in each sample were identified to understand the cellular response to polypropylene mesh within each mesh burden category (high and low).
Within the samples categorized as having a lower mesh burden, there were significant differences between the relative amounts of FMF cells and macrophages (p = 0.0004) and FMF cells and fibroblasts (p = 0.0001) ( Figure 5a). There were significantly more macrophages and fibroblasts present than FMF cells. There were significant differences between the relative amounts of MMF cells and macrophages (p = 0.0057) and MMF cells and fibroblasts (p = 0.0024) ( Figure 5a). The much larger presence of fibroblasts and macrophages as opposed to any myofibroblast phenotype can be attributed to lower mesh burden present in the samples.
Within the high mesh burden population, there was a significantly higher percentage of macrophages than FMF cells present in these high mesh burden samples (p = 0.0038) ( Figure 5b). The rest of the cell populations were likely similar in number due to an overall larger myofibroblast response in high mesh burden samples.
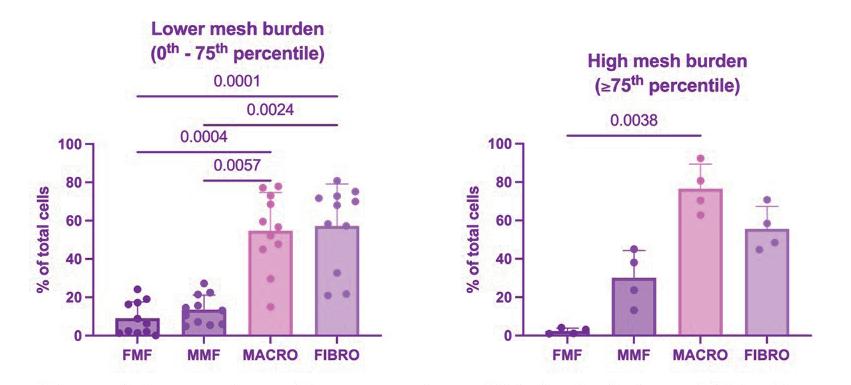
Figure 5. Comparison of the percentage of total cells that are FMF cells, MMF cells, macrophages, and fibroblasts within samples with (a) lower mesh burden and (b) high mesh burden

3.5 Comparing cell type prevalence between high and low mesh burden populations
The average percentages of macrophages, fibroblasts, MMF cells, and FMF cells seen in high mesh burden samples were compared to those seen in low mesh burden samples. Mann-Whitney tests revealed a significant difference between the number of macrophages (p = 0.04) and MMF cells (p = 0.04) present in high versus low mesh burden samples, where there were more macrophages and MMF cells in high mesh burden samples ( Figure 6). There were no significant differences between the numbers of fibroblasts and FMF cells present in high versus low mesh burden samples.
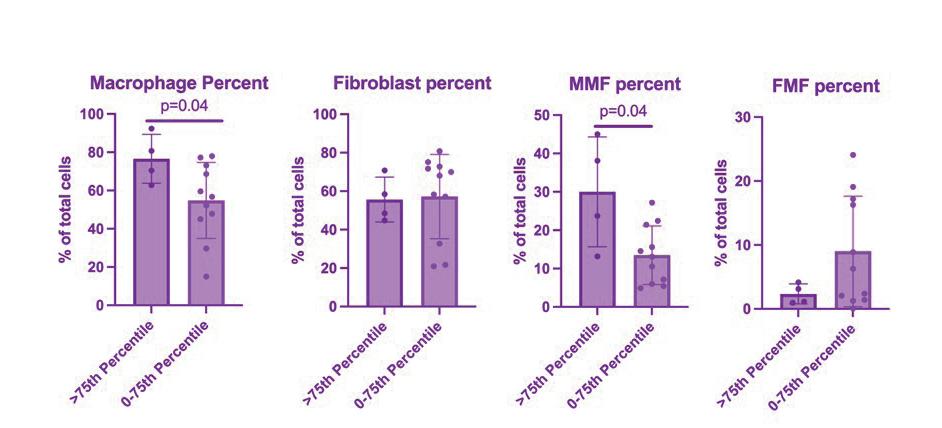
Figure 6. Percentage of total cells that are (a) macrophages (DAPI+CD68+), (b) fibroblasts (DAPI+/Vim+), (c) MMF cells (DAPI+/Vim+/CD68+/αSMA+), or (d) FMF cells (DAPI+/Vim+/ αSMA+) compared by mesh burden (high versus lower) (p = 0.04 for macrophages, p = 0.04 for MMF cells)
There was no significant difference in the total number of myofibroblasts (MMF plus FMF cells) between high and low mesh burden samples ( Figure 7 ). When looking at the percentage of myofibroblasts that are of macrophage origin (MMF cells), high mesh burden samples had a higher percentage of myofibroblasts that were of macrophage origin (p = 0.0196).

Figure 7. Percentage of myofibroblasts that are MMF cells compared across mesh burden (p = 0.0196), and total myofibroblasts compared across mesh burden (ns)
In this study we utilized 15 mesh-vagina complexes (MVC) from a mesh biorepository at Magee-Womens Research Institute (IRB: CR19080175-010). These MVCs were from patients who previously underwent sacrocolpopexy to
repair POP and were having their PPM removed for a complication. Samples that met inclusion criteria had no significant difference in demographics considered to be indicators of POP such as age, BMI, gravidity, or parity. There was no significant difference in time since implantation, allowing us to compare the cellular response across samples. Here, we sought to ascertain the presence of MMF cells in the context of PPM mitigated POP repair by correlating mesh burden to MMF cell presence in MVCs removed from patients experiencing complications (pain and exposure).
MMF cells were observed in the adventitia throughout all samples. Mesh burden, quantified by the amount of area occupied by mesh fibers in the adventitia, showed two distinct populations: the majority of samples having 10% of adventitial area being covered by mesh and a smaller population at 30% of adventitial area being covered by mesh. Correlation analysis of cell type present and percent of mesh burden showed a high correlation for macrophages (CD68+, R 2=0.654) and MMF cells (αSMA+/ Vim+/CD68+, R 2=0.641). Highly organized FMF derived myofibroblasts (αSMA+/Vim+) were present immediately surrounding the macrophages and encased mesh fibers in low mesh burden samples. This organized response was not present in high mesh burden samples; MMF cells increased in abundance instead. In high mesh burden samples, there was a significant increase in the number of MMF cells (p=0.04) and macrophages (p=0.04) as compared to low mesh burden samples. Higher mesh burden samples also showed that there were significantly more MMF cells as a percent of total myofibroblasts than in response to lower mesh burden (p=0.0196). This evidences a myeloid-labelling myofibroblast responding to polypropylene mesh implanted as a biomaterial for pelvic organ prolapse repair surgery.
Previous studies indicate that the textile properties of PPM influence the host response, leading to the understanding that mesh burden is a driver of the foreign body reaction to PPM [10, 17, 18]. Previous work done in a clinically relevant non-human primate model sought to understand the effect of mesh deformations on clinical complications by measuring the myofibroblast response. This work done by Knight et al. evidenced an increased presence of myofibroblasts in samples with higher mesh burden (deformation) that was seen alongside mesh exposures, a clinical complication. Similarly, other studies in women showed that the fibroblast to myofibroblast transition resulting in FMF cells are essential in wound healing following sacrocolpopexy, but that the long-term persistence of FMF cells is linked to pain and fibrosis in patients [11]. This relationship between myofibroblast presence and maladaptive healing responses seen in the vagina informs our study seeking to investigate cell populations associated with mesh burden in the vagina. Particularly, the persistent presence of FMF and MMF cells in the vagina as a maladaptive response to PPM implantation ( Figure 2).
Other work looking at the T-cell response indicated that mesh burden was correlated to T-cell recruitment, evidencing a relationship between mesh burden and the host response [11]. Mesh burden has also been shown to influence the macrophage response and its persistence following PPM implantation [8,10]. Further exploring this concept, we determined the percent of adventitial area occupied by mesh fibers and utilized a violin plot. This allowed us to visualize the presence of two distinct mesh burden populations (low and high) within the patient samples in this study, warranting investigation into the specific cellular responses related to each population ( Figure 3).
The aforementioned studies found increased macrophage and myofibroblast presence to samples with increased mesh burden and higher incidence of complications. In this study we identified not only macrophage presence, but also MMF cells to increase in samples with an increased amount of mesh burden (R 2 = 0.65 and R 2 = 0.64, respectively), indicating the existence of a sustained immune response to PPM in human patients even years after implantation ( Figure 4). Prior work has demonstrated the persistent presence of macrophages in MVC removed from women who underwent POP repair surgery utilizing PPM [10]. These studies indicated a correlation between complications and macrophage presence, a finding supported with this study. A lesser correlation was seen between fibroblasts and mesh burden (R 2 = 0.46), and nearly no correlation between FMF cells and mesh area (R 2 = 0.04). These results indicate macrophage-labelled cells (macrophages or MMF cells) being highly correlated to mesh burden in samples explanted from women experiencing mesh-related complications.
Additional analysis surveying the differences in cell type distribution within each mesh burden population demonstrated that both high and lower mesh burden samples had a significantly larger percentage of macrophage-labelling cells present as opposed to FMF cells (p = 0.0038 and p = 0.0004, respectively) ( Figure 5 ). This finding affirms the presence of a large inflammatory response which contributes to maladaptive healing in patients.
High mesh burden samples had significantly higher numbers of macrophages (p = 0.04) and MMF cells (p = 0.04) than lower mesh burden samples ( Figure 6). This finding corroborates previous work showing that a higher mesh burden is connected to there being a larger inflammatory host reaction. This is evident because there were more macrophages as well as myofibroblasts that originated from macrophages in high mesh burden samples ( Figure 6). Work in other soft-tissue organ systems such as the liver have found evidence of macrophage to myofibroblast trans-differentiation (leading to MMF cell presence) in other fibrotic contexts [16]. This study evidences the occurrence of macrophageto-myofibroblast transition in the vagina, which has not been shown before.
A recent study in a clinical non-human primate model has demonstrated a clear, positive relationship between the amount of mesh burden and myofibroblast presence in non-human primates following implantation of PPM in deformed configurations [13]. The total number of myofibroblasts (encompassing both phenotypes: MMF and FMF cells) in patient MVCs was examined; this study demonstrated no significant difference between the total number of myofibroblasts in lower and high mesh burden samples ( Figure 7 ). However, when looking at the percentage of myofibroblasts that are of macrophage origin (MMF cells), there is a significantly higher percentage of the MMF subtype in the high mesh burden group as opposed to the lower mesh burden group (p = 0.0196). This also supports the ideology that samples with a higher mesh burden undergo more of an inflammatory response, evidenced by a larger percentage of MMF cells, that play a role in the proliferation of myofibroblasts and subsequent fibrosis that occurs.
This study took samples from patients undergoing mesh excision surgeries due to mesh complications and was able to identify and quantify the presence of MMF cells, which is a major strength. Myofibroblasts with myeloid markers were identified for the first time in the human vagina, as a response to mesh presence. One of the limitations of this study is that well integrated mesh in human vagina could not be studied, as mesh excision surgery is only performed in the case of mesh complications. This study was only able to label and identify the presence of MMF cells. Future studies should aim to determine the phenotypic differences between macrophage to myofibroblast transitioned and fibroblast to myofibroblast transitioned cells.
The initial hypothesis that there would be a higher presence of macrophage to myofibroblast transitioned cells in samples with higher mesh burden was supported by the data collected. The data supports evidence of a sustained maladaptive host response to implanted polypropylene mesh (PPM) spearheaded by the presence of macrophages and myofibroblasts originating from macrophages. The next steps to further knowledge on macrophage to myofibroblast transition with relation to immune host response to PPM involves identifying specific macrophage subtypes in tissue and their propensity to aid in inflammatory and fibrotic pathways. Investigating myofibroblast phenotypes and the specific cellular mechanisms underlying the maladaptive immune host response to PPM will aid in the development of novel materials and methods to limit mesh complications in patients.
This research is funded by the National Institutes of Health R01 HD083383. Funding for MH was provided by the

Swanson School of Engineering, the Office of the Provost, and the Department of Bioengineering at the University of Pittsburgh.
[1] N. I. Iglesia, K. E. Smith, and L. J. Handa, “Pelvic Organ Prolapse,” Am. Fam. Physician, vol. 96, no. 3, pp. 179–185, 2017.
[2] L. N. Wood and J. T. Anger, “Urinary incontinence in women,” BMJ, vol. 349, p. g4531, Sep. 2014, doi: 10.1136/bmj.g4531.
[3] M. Zargham, F. Alizadeh, A. Moayednia, S. Haghdani, and K. Nouri-Mahdavi, “The role of pelvic organs prolapse in the etiology of urinary incontinence in women,” Adv. Biomed. Res., vol. 2, p. 22, Mar. 2013, doi: 10.4103/2277-9175.108010.
[4] M. D. Barber et al., “Comparison of 2 transvaginal surgical approaches and perioperative behavioral therapy for apical vaginal prolapse: the OPTIMAL randomized trial,” JAMA, vol. 311, no. 10, pp. 1023–1034, 2014, doi: 10.1001/jama.2014.1719.
[5] N. K. Mattsson et al., “Methods of surgery for pelvic organ prolapse in a nationwide cohort (FINPOP 2015),” Acta Obstet. Gynecol. Scand., vol. 98, no. 4, pp. 451–459, 2019, doi: 10.1111/aogs.13520.
[6] M. Jonsson Funk et al., “Trends in use of surgical mesh for pelvic organ prolapse,” Am. J. Obstet. Gynecol., vol. 208, no. 1, pp. 79.e1–79.e7, 2013, doi: 10.1016/j. ajog.2012.11.008.
[7] E. Yeung et al., “Transvaginal mesh or grafts or native tissue repair for vaginal prolapse,” Cochrane Database Syst. Rev., vol. 3, no. 3, p. CD012079, Mar. 2024, doi: 10.1002/14651858.CD012079.pub2.
[8] R. Liang et al., “Vaginal degeneration following implantation of synthetic mesh with increased stiffness,” BJOG, vol. 120, no. 2, pp. 233–243, 2013, doi: 10.1111/1471-0528.12085.
[9] D. Hachim et al., “Effects of aging upon the host response to implants,” J. Biomed. Mater. Res. A, vol. 105, no. 5, pp. 1281–1292, 2017, doi: 10.1002/ jbm.a.36013.
[10] A. L. Nolfi et al., “Host response to synthetic mesh in women with mesh complications,” Am. J. Obstet. Gynecol., vol. 215, no. 2, pp. 206.e1–206.e8, 2016, doi: 10.1016/j.ajog.2016.04.008.
[11] A. M. Artsen et al., “Mesh induced fibrosis: The protective role of T regulatory cells,” Acta Biomater., vol. 96, pp. 203–210, 2019, doi: 10.1016/j. actbio.2019.07.031.
[12] R. Liang et al., “Exploring the basic science of prolapse meshes,” Curr. Opin. Obstet. Gynecol., vol. 28, no. 5, pp. 413–419, 2016, doi: 10.1097/ GCO.0000000000000313.
[13] K. M. Knight et al., “Mesh deformation: A mechanism underlying polypropylene prolapse mesh complications in vivo,” Acta Biomater., vol. 148, pp. 323–335, 2022, doi: 10.1016/j.actbio.2022.05.051.
[14] B. S. Bagalad, K. P. Mohan Kumar, and H. K. Puneeth, “Myofibroblasts: Master of disguise,” J. Oral Maxillofac. Pathol., vol. 21, no. 3, pp. 462–463, 2017, doi: 10.4103/jomfp.JOMFP_146_15
[15] T. Kisseleva, “The origin of fibrogenic myofibroblasts in fibrotic liver,” Hepatology, vol. 65, no. 3, pp. 1039–1043, 2017, doi: 10.1002/hep.28948.
[16] L. Lis-López, C. Bauset, M. Seco-Cervera, and J. CosínRoger, “Is the macrophage phenotype determinant for fibrosis development?” Biomedicines, vol. 9, no. 12, p. 1747, Nov. 2021, doi: 10.3390/biomedicines9121747.
[17] W. R. Barone, K. M. Knight, P. A. Moalli, and S. D. Abramowitch, “Deformation of transvaginal mesh in response to multiaxial loading,” J. Biomech. Eng., vol. 141, no. 2, p. 0210011, 2019, doi: 10.1115/1.4041743.
[18] B. N. Brown et al., “Characterization of the host inflammatory response following implantation of prolapse mesh in rhesus macaque,” Am. J. Obstet. Gynecol., vol. 213, no. 5, pp. 668.e1–668.e10, 2015, doi: 10.1016/j.ajog.2015.08.002.
Samiya Henry1, Patrick Smolinski1, Anja Wackerle2 , William Gamble1 and Volker Musahl2
1Department of Mechanical Engineering and Materials Science, University of Pittsburgh, Pittsburgh, PA, 2Department of Orthopedic Surgery, University of Pittsburgh, Pittsburgh, PA
SAMIYA HENRY
Samiya Henry is a fourth-year Mechanical Engineering student originally from Philadelphia, Pennsylvania. Her research interests have been centered around biomechanical evaluations of the human anatomy, specifically the ACL. After graduation, she aspires to work for NASA, contributing to the design of future spacecrafts and continuing her work with biomechanical research to further improve human space exploration initiatives.
WILL GAMBLE
Will Gamble is a second-year graduate student in the Mechanical Engineering and Materials Science department. He received his bachelor’s degree in Mechanical Engineering from Pitt, and plans to pursue a PhD with a focus of biomechanics. Will’s research interests include the modeling strain of the lower limb joints and studying the mechanics of the legs.
PATRICK SMOLINSKI, PHD
Patrick Smolinski has a PhD in Theoretical and Applied Mechanics from Northwestern University. His lab is interested in joint injury mechanics, tissue mechanical properties and the mechanical evaluation of surgical treatments in orthopedics and sports medicine.



The reduction in strength of the quadricep tendon after ACL graft harvest is not known. This study will provide information that can help determine the allowable size of the graft that can be taken without unduly risking tendon rupture.
Keywords: ACL reconstruction, Quadricep tendon graft, failure strength
Abbreviations: Quadricep Tendon (QT), Anterior Cruciate Ligament (ACL)
Anterior cruciate ligament reconstruction (ACL-R) is a common knee surgery that involves the reconstruction of the ligament with the use of an autograft, or a graft harvested from another tendon of the patient. The graft can be taken from the quadricep tendon (QT), a tendon located above the knee, and while this donor site has some advantages, it is important to know what effect this has on the tendon strength. To study this, cadaveric intact QTs and QTs with grafts removed (donor tendons) were tested under axial tensile loading until failure. The force and elongation of the tissue were measured during testing. It was hypothesized that the donor tendon would be significantly weaker than the intact tendon. The results of the testing showed that the intact tendon had a mean failure load of 5209.9 ± 999.3 N, while the donor tendon had mean value of 2553.1 ± 701.4 N. For the intact tendon, the failure stress averaged 25.9 ± 8.7 MPa while the donor tendons had maximum stress of 17.1 ± 4.6 MPa, respectively. The results showed that the donor tendon had a reduced failure load and stress, supporting the initial hypothesis.

The anterior cruciate ligament (ACL) is a major knee ligament connecting the tibia and femur and provides stability by preventing the tibia from having excessive anterior translation relative to the femur (Figure 1). Injuries to the ACL are common, and since the tissue cannot heal after rupture, ACL reconstruction (ACL-R) surgeries are often performed. In the United States, over 200,000 ACLRs are performed annually (Figure 1) [1], typically using a graft taken from a patient’s tendon (autograph). The graft is either taken from the patellar tendon (PT), hamstring tendon (HT), or the quadricep tendon (QT). To decide which type of graft to use for ACL-R specifically, surgeons discuss the graft options with their patients, considering the patient’s desires along with the surgeon’s experience. Of the three options, PT grafts are seen as the “Gold Standard” but have a history of resulting in anterior knee pain [1]. Hamstring tendon grafts are favored by 44% of orthopedic surgeons, however, there can be a limit to the size of graft, due to the small size of the tendon, resulting in a greater risk of graft failure [1].
Because of these drawbacks, QT grafts are gaining more popularity since they allow for more reliable graft sizes and decreased anterior knee pain [2]. Despite the interest, there are little to no studies quantifying the strength of the QT after removal of the graft.
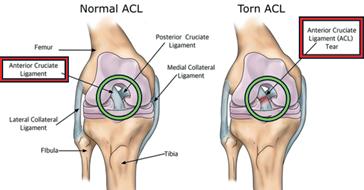
Harvesting a graft from the QT changes the tendon geometry and there is interest in how this alters the tendon strength. If the strength is significantly reduced, patients may be more susceptible to QT rupture after ACL-R. Therefore, the goal of this study is to evaluate the mechanical strength of the intact tendon and the donor (remaining) tendon after graft harvest. In one previous experimental study of the strength of the intact and remaining QT, the intact tensile strength (3,660 ± 830N) suffered a 35% reduction in strength of the remaining QT. Compared to the tensile strength of an intact (1.920 ± 330 N) PT, the patellar remainder had a 25% reduction in strength [3]. With these results in mind, the hypothesis
formed for this experiment was that the failure load and failure stress of the QT would be reduced by graft harvesting.
2.1
Prior approval was granted for this research study by the Committee for Oversight of Research and Clinical Training Involving Decedents (CORID), (CORID #1186). The cadaveric specimens were procured from institutionally approved tissue suppliers. All specimens were stored in freezers at 0° F degrees and thawed at room temperature 24 hours before dissection. Nine sets of quadriceps tendons were removed from the paired knees by an orthopedic surgeon. With each pair of knees, one knee was randomly selected to be the intact QT while the other knee provided the tendon from which the graft would be harvested, referred to as the residual or donor tendon (Figure 2) From the donor tendon, a 70 mm long x 10 mm wide x 5 mm thick graft was removed. Each intact tendon served as a control to the donor tendon of the same individual. While not actively being tested or analyzed, all specimens were kept moist to maintain tissue hydration.
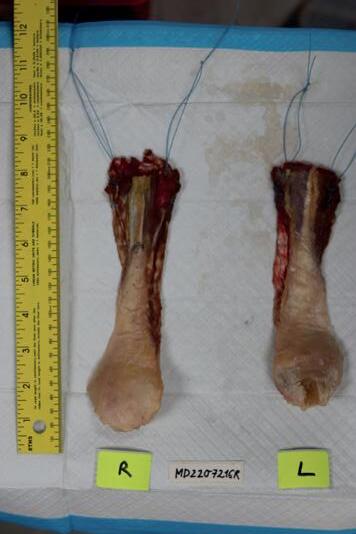
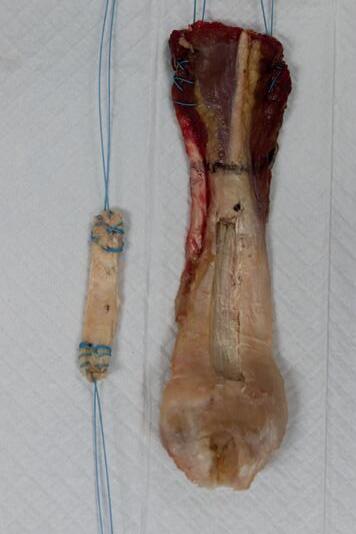
Prior to graft harvest, 3D laser scanning (Faro, Inc.) was used to scan the tissue to measure the cross-sectional area of the intact tendons. For this, sutures were added to the tissue end of the tendon and the tendon was hung with two 20-gram weights attached to the bony end of the tendon. This provided the proper exposure and stability for the tendon to be scanned. Software (Geomagic Studio) was used to compute the cross-sectional area of the scanned tendon (Figure 3)
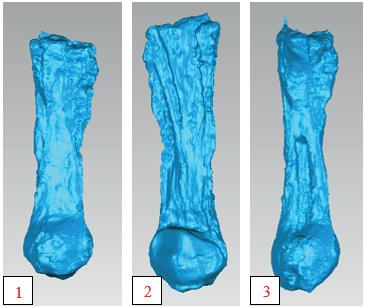
Five markers were glued along the length of the tissue sample on both sides approximately 1 cm apart. These were tracked by the video system during loading to measure the elongation of the tissue during testing (Figure 4)
4: Tissue markers glued to an intact tendon in fixed testing clamps.
The tendon specimen was clamped at both ends in the testing machine (MTI 5K, MTI, Inc.) to apply axial load. The tissue end of the tendon was clamped using a freezeclamp cooled by liquid nitrogen (Figure 5). This was done to freeze the tissue and prevent slippage in the grip during loading. At the other end of the tendon, a portion of the patellar (bone) was kept attached to the tissue. Two screws were drilled through the bone which was then placed in a mold with polyester resin. The resin block was clamped underneath a flat metal plate fixture (Figure 6). Two cameras are shown that capture a video of the specimen during loading (bottom of Figure 6).
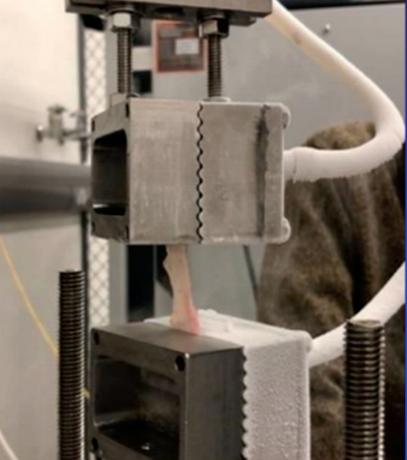
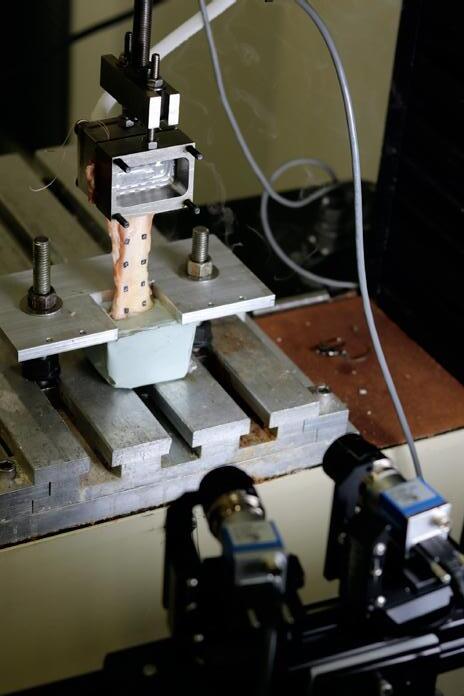
Figure 6: Testing machine fixation showing the freeze clamp attached to the upper (tissue) end of the tendon and the clamped resin block at the lower end of the tendon (bone). Tissue has markers attached and cameras record video motion of the markers.
All tendons were cycled 20 times (20 to 50 N) and then loaded to failure at a rate of 10 mm/min. The video taken during loading was analyzed using the VIC-3D (DIC, Correlated Solutions, Inc.) software to measure the initial (L0) and final (L) elongation of the specimen. Video images were taken every 250ms during the failure test for the strain calculation (ɛ = ΔL/L = δ/L).
Based on the results of the testing of the nine pairs of tendons, the intact tendons had a mean ultimate (failure) load of 5209.9 ± 999.3N, while the donor tendons had mean value of 2553.1 ± 701.4N. To compute the failure stress, the force load value, P, for each specimen was divided by its cross-sectional area, A (σ = P/A). The intact tendon had an average failure stress of 25.9 ± 8.7 MPa while donor tendons had an average peak stress of 17.1 ± 4.6 MPa. The intact QT failed at the insertion to the patella bone (Figure 7), while the donor tendons failed at the midlength (Figure 8)


Figure 7: Intact tendon post-failure. Failure occurred where tissue inserts into the patella bone.
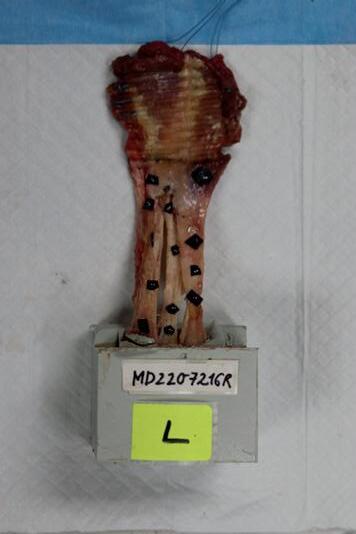
Figure 8: Donor tendon post-failure. Failure occurred at the midsection of the tissue.
The values of ultimate failure stress from the QT donor and remaining tendon fell within the range of the few currently published and accepted QT ultimate stress results. For the pre-conditioned intact QT testing, the ultimate stress averaged to be 38.0 ± 0.5 MPa [4] and another intact-only study had an average of 12.1 + 8.3 MPa [5]. A sample graph showing the stress and strain tracked by the tissue markers on the intact tendon, based on the left- and right-hand side markers, is given in Figure 9.
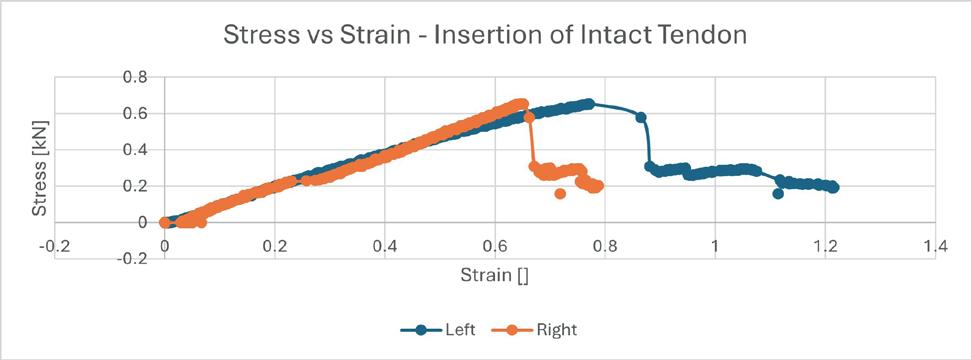
Figure 9: Typical sample stress and strain curve for an intact tendon. Curves are for strains as measured from the left-hand side markers (blue) and the right-hand side markers (orange). Maximum stress is taken as the failure stress.
From this data, both the failure load and failure stress are substantially reduced in the donor tendons. While it is readily predictable that the donor tendon would have a
reduced failure load due to the reduction in cross-sectional area from the graft harvest, the failure stress is also substantially lower in the donor tendon, and this is independent of the cross-sectional area since the failure loads are normalized by the relative cross-sectional areas. A possible reason for the reduction in failure stresses may be geometry induced stress concentrations caused by the removal of the graft.
The hypothesis of this study was that the structural (force) and material (stress) failure properties of the quadricep tendon will be significantly different pre- and post-harvest of an ACL graft with the residual tendon being much weaker than the intact tendon. To test this hypothesis, tendons were taken from paired knees with one kept intact and the other subject to graft harvest and both tested to failure under tensile loading. The hypothesis was supported with both the failure load and failure stress of the donor tendon being considerably less than that of the intact tendon.
This study is clinically relevant because it will help determine how large a graft can safely be harvested from a quadriceps tendon of a given cross-section area without the risk of later tendon rupture.
The support of the MEMS FIRE program is gratefully acknowledged, along with the guidance and support from Dr. Patrick Smolinski, William Gamble, Dr. Anja Wackerle, Dr. Volker Musahl, and the other personnel who are part of Dr. Smolinski’s lab.
Web References
1 Blood-Smyth, J. (2015, November 25). Anterior Cruciate Ligament (ACL) Injury Local Physio. https:// www.local-physio.co.uk/articles/knee-pain/anteriorcruciate-ligament-injury/
Literature
[1] Urchek R, Karas S. Biomechanical Comparison of Quadriceps and 6-Strand Hamstring Tendon Grafts in Anterior Cruciate Ligament Reconstruction. Orthop J Sports Med. 2019;7(10):2325967119879113.
[2] Hart D, Gurney-Dunlop T, Leiter J, Longstaffe R, Eid AS, McRae S, et al. Biomechanics of hamstring tendon, quadriceps tendon, and bone-patellar tendon-bone grafts for anterior cruciate ligament reconstruction: a cadaveric study. Eur J Orthop Surg Traumatol. 2023;33(4):1067-74.
[3] Adams DJ, Mazzocca AD, Fulkerson JP. Residual strength of the quadriceps versus patellar tendon after harvesting a central free tendon graft. Arthroscopy.
2006 Jan;22(1):76-9. doi: 10.1016/j.arthro.2005.10.015. PMID: 16399465.
[4] Stäubli HU, Schatzmann L, Brunner P, Rincón L, Nolte L-P. Mechanical Tensile Properties of the Quadriceps Tendon and Patellar Ligament in Young Adults. The American Journal of Sports Medicine. 1999;27(1):2734. doi:10.1177/03635465990270011301.
[5] Schmidt EC, Chin M, Aoyama JT, Ganley TJ, Shea KG, Hast MW. Mechanical and Microstructural Properties of Pediatric Anterior Cruciate Ligaments and Autograft Tendons Used for Reconstruction. Orthop J Sports Med. 2019 Jan 23;7(1):2325967118821667. doi: 10.1177/2325967118821667. PMID: 30719479; PMCID: PMC6348523.
[6] Strauss MJ, Miles JW, Kennedy ML, Dornan GJ, Moatshe G, Lind M, et al. Full thickness quadriceps tendon grafts with bone had similar material properties to bone-patellar tendon-bone and a fourstrand semitendinosus grafts: a biomechanical study. Knee Surgery, Sports Traumatology, Arthroscopy. 2022;30(5):1786-94.
[7] Xie X, Liu X, Chen Z, Yu Y, Peng S, Li Q. A meta-analysis of bone-patellar tendon-bone autograft versus fourstrand hamstring tendon autograft for anterior cruciate ligament reconstruction. Knee. 2015;22(2):100-10.
Aakash K. Kottakota1, Jason Lee9, Pete H. Gueldner1, Nathan L. Liang, David A. Vorp1-8 , Timothy K. Chung1,7
1Department of Bioengineering, University of Pittsburgh, Pittsburgh, PA, 2Department of Mechanical Engineering and Materials Science, University of Pittsburgh, Pittsburgh, PA, 3McGowan Institute for Regenerative Medicine, University of Pittsburgh, Pittsburgh, PA, 4Department of Surgery, University of Pittsburgh, Pittsburgh, PA, 5Department of Chemical and Petroleum Engineering, University of Pittsburgh, Pittsburgh, PA, 6Department of Cardiothoracic Surgery, University of Pittsburgh, Pittsburgh, PA, 7Clinical and Translational Sciences Institute, University of Pittsburgh, Pittsburgh, PA, 8Magee-Womens Research Institute, University of Pittsburgh, Pittsburgh, PA, 9Department of Computer Science, University of Pittsburgh, Pittsburgh, PA
AAKASH KOTTAKOTA
Aakash Kottakota is a senior Bioengineering undergraduate at the Swanson School of Engineering with a minor in Computer Science. Aakash’s research interests focus on the progression of abdominal aortic aneurysms (AAAs) and the use of computational algorithms to develop improved diagnostic tools for prognosis.
Aakash plans to continue his education and research in graduate school to further advance his expertise in this field.
PETE H. GUELDNER, BS
Pete H. Gueldner, BS is a NSF and AHA Graduate Research Fellow in the Department of Bioengineering at the Swanson School of Engineering. Pete’s research interests are primarily related to experimental vascular biomechanics. He is also interested in how artificial intelligence tools can aid with computational methods, and clinical diagnosis/ prognosis of vascular diseases.
TIMOTHY K. CHUNG, PHD
Timothy K. Chung, PhD is a Department of Bioengineering Research Assistant Professor at the Swanson School of Engineering with a secondary appointment in the Clinical and Translational Science Institute. Dr. Chung’s research focuses on the development of experimental apparatus for biomechanical testing, computational simulations of diseased vasculature, medical device design and manufacture, and artificial intelligence.


Aakash Kottakota Pete H. Gueldner

Nathan L. Liang


Timothy K. Chung

David A. Vorp
NATHAN L. LIANG, MD
Nathan L. Liang, MD, MS is a board-certified vascular surgeon and Associate Professor of Surgery and Bioengineering at the University of Pittsburgh. He completed his medical degree at Texas A&M University College of Medicine, followed by a vascular surgery residency at UPMC, where he also earned a master’s in clinical research. Dr. Liang specializes in complex aortic surgeries, including both traditional and minimally invasive endovascular techniques, and he leads the Complex Endovascular Aortic Interventions program at UPMC.
DAVID A. VORP, PHD
David A. Vorp is the John A. Swanson Professor of Bioengineering and Senior Associate Dean for Research and Facilities at the University of Pittsburgh’s Swanson School of Engineering. Dr. Vorp’s research specializes in vascular biomechanics, mechanopathobiology, and tissue engineering, with a focus on aortic aneurysms and tissue-engineered vascular grafts. He has authored over 145 peer-reviewed papers and has received numerous honors, including the Van C. Mow Medal and the Carnegie Science Award. He is also a Fellow of the American Heart Association, the American Institute for Medical and Biological Engineering, the American Society of Mechanical Engineers, and the Biomedical Engineering Society.
Current criteria for abdominal aortic aneurysm (AAA) intervention often fail to accurately predict rupture risk. This study utilizes machine learning to forecast aneurysm growth and wall stress distribution, offering patient-specific insights. These models provide a scalable framework for improving rupture risk prediction and guiding clinical decisions, enhancing AAA management outcomes.
Keywords: Abdominal Aortic Aneurysms, Machine Learning, Morphological Predictions, Wall Stress Analysis
Abdominal aortic aneurysms (AAA), the 13th leading cause of death in the United States, is a life-threatening condition typically characterized by the ballooning and potential rupture of the terminal aorta. Clinical intervention is traditionally based on the maximum diameter criterion which states that the threshold for clinical intervention is when the aneurysm diameter reaches 5.5 cm for men and 5.0 cm for women. However, this approach frequently overlooks rupture risks below these thresholds, leading to rupture in 5.6% of men and 11.5% of women. To address these limitations, this study leverages machine learning (ML) tools to develop a comprehensive forecasting model for aneurysm growth and risk of rupture based on patient-specific data, morphological changes, and wall stress analysis. A longitudinal database of segmented AAA scans was converted into 3D point clouds to extract geometric and biomechanical metrics for analysis. TensorFlow models were trained to predict aneurysm growth over time and wall stress distribution, using Von Mises stress values. Morphology models were trained on a patient-by-patient basis, while the stress model used a dataset from 274 patients. Results showed strong qualitative and statistical alignment between predicted and ground-truth wall stresses and morphologies, with no significant differences in key geometric metrics.
Abdominal aortic aneurysms (AAAs) are the 13th leading cause of death in the United States and pose a significant risk due to the progressive ballooning of the abdominal aorta, which can lead to rupture [1]. The fatality rate from rupture is approximately 40% but can escalate to nearly 80% if the rupture occurs before hospitalization [2]. The danger of this progressive disease is compounded by a lack of comprehensive assessment tools, which can often delay clinical intervention until rupture occurs. Clinicians typically intervene once the aneurysm has reached the limits outlined by the maximum diameter criterion, which states that operable limits have been reached once the aneurysm reaches a diameter of 5.5 cm in men and 5.0 cm in women [3]. However, this criterion is insufficient, as ruptures occurring below these thresholds have been documented occurring in 5.6% of men and 11.5% of women [3]. This demonstrates the limitations with the current approach and the need for more sophisticated and accurate methods of analyzing aneurysm growth and the corresponding risk of rupture.
Our research group is working on the development of machine learning (ML) tools aimed at virtual surveillance by evaluating AAA progression, driving towards improved clinical outcomes. By analyzing the morphological and biomechanical stress changes of the aneurysm wall over time, ML models enable a patient-specific approach to predicting the risk of rupture. Unlike static measurements, these dynamic models allow for the integration of data from longitudinal imaging and biomechanical
metrics. This provides a comprehensive and continuous analysis of aneurysm growth, wall stress distribution, and corresponding rupture risk. These models offer the promise of accurately mapping and predicting aneurysm growth and stress changes based on patient-specific data, guiding the timing for optimal medical intervention.
A comprehensive workflow has been developed, visualized in Figure 1, to predict both the morphological evolution and wall stress distributions of AAAs over time using machine learning models.
A custom MATLAB [4] script was written to preprocess longitudinal AAA scan data into 3D point clouds consisting of a set number of nodes. Cartesian coordinates (X, Y, Z) were extracted for each node at each time point, forming a spatiotemporal dataset of aneurysm geometry.
To enhance model predictions, the script generated intermediate point clouds using linear interpolation between corresponding sets of nodes across time points, effectively increasing the amount of available input data for training and validation. These interpolated point clouds bridged the gaps between original timepoints.
The preprocessed coordinate data was then ingested into a TensorFlow [5] model implemented in a custom Python [6] environment. The model utilized Long ShortTerm Memory (LSTM) layers, a variation of traditional recurrent neural network architecture designed to capture long-term dependencies and temporal patterns in data [7]. Each node’s displacement trajectory across timepoints was analyzed individually, with the LSTM layer learning to predict future node positions based on nodal temporal displacement history. The model was trained and validated on 80% of the temporal data for each node, utilizing a 90/10 training/validation split of the available training data, and tested against the remaining 20%, ensuring a comprehensive understanding of spatiotemporal dynamics.
The trained LSTM model was used to predict the future positions of all nodes in the aneurysm geometry. These predictions were organized into point clouds corresponding to future timepoints. A secondary MATLAB script reconstructed 3D surface meshes from these point clouds, generating detailed visualizations of anticipated aneurysm growth at each timestep. The accuracy of the morphological predictions was validated by comparing the predicted final timestep geometry with the ground truth geometry, using traditional metrics commonly used to describe aneurysm morphology. Qualitative comparisons of surface alignment between predicted and ground truth geometries were also performed. Training of the model was done on a per-case basis and necessitated retraining for each individual patient. Retraining times would average ~4 hours per every ~25000 nodes over the course of 100 training cycles resulting in the retraining sequence taking ~2.5 weeks per patient.

To evaluate wall stress distributions during aneurysm growth, a second TensorFlow model was trained on a dataset of 274 separate AAA cases. Training in the same Python environment, this model analyzed spatial, geometric, and biomechanical metrics such as nodal coordinates, curvature, and intraluminal thrombus (ILT) thickness along with corresponding Von Mises stress values computed using finite element analysis (FEA). This model implemented three dense layers, also known as fully connected layers, which connect every neuron in a layer with every neuron in the previous layer to create abstract representations of data and allow the model to learn complex relationships between input metrics and stress values [8].
Predicted wall stresses were mapped onto reconstructed 3D geometries from the morphological model, allowing for easy visualization of wall stress distributions across the aneurysm surface. Performance was qualitatively evaluated by comparing predicted and ground truth 3D stress distributions using heat maps. Further statistical analysis was done using a paired t-test and linear regression between predicted and ground truth metrics to quantify results.
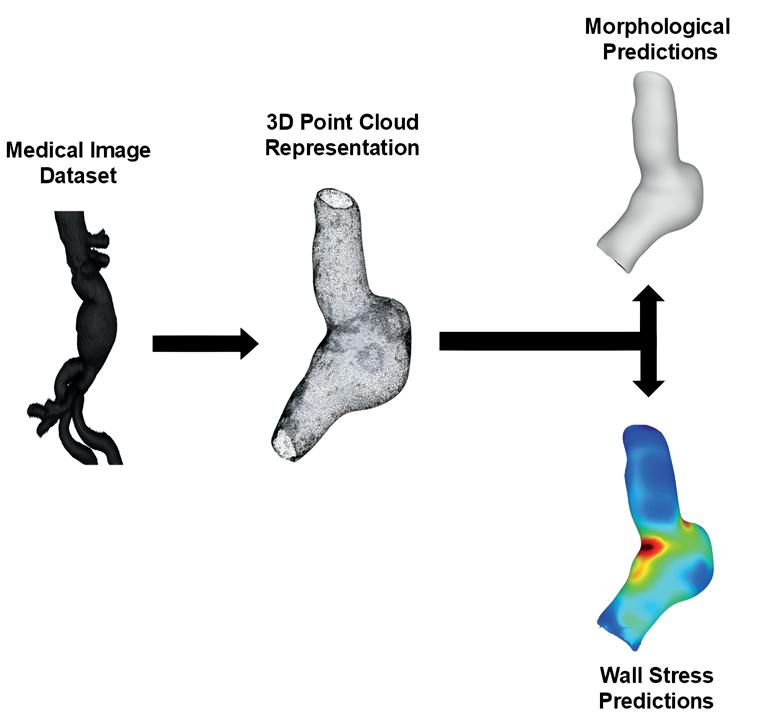
1: Pipeline for combining deep learning morphological predictions and AI stress predictions for development of comprehensive risk model.
The results demonstrate strong alignment between predicted and ground truth geometries, along with consistent stress distribution patterns across predicted and ground truth geometries. Both qualitative and quantitative analyses were performed to confirm the accuracy and reliability of the predictions.
Figure 2 displays an overlay of the predicted final and ground truth final geometries for a particular case. The two geometries are closely aligned visually with an average displacement variation of 0.16 ± 0.39 mm for each node .
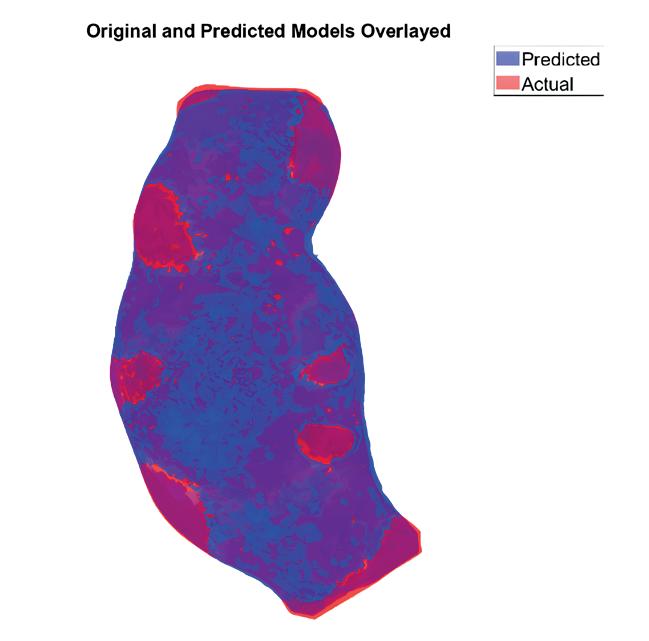
2: Ground Truth (red) and Predicted (blue) morphological models overlayed on top of one another for a qualitative analysis of the prediction accuracy of a single case.
Table 1 lists the mean and standard deviation for certain key comparative metrics for assessing the accuracy of the predicted morphologies against ground truth morphologies for four cases. The p-values for one-tail heteroscedastic t-tests between the ground truth and predicted metrics are also shown and demonstrate no statistically significant differences.
1: Comparative Geometric Metrics between Ground Truth and Predicted Aneurysm Morphologies
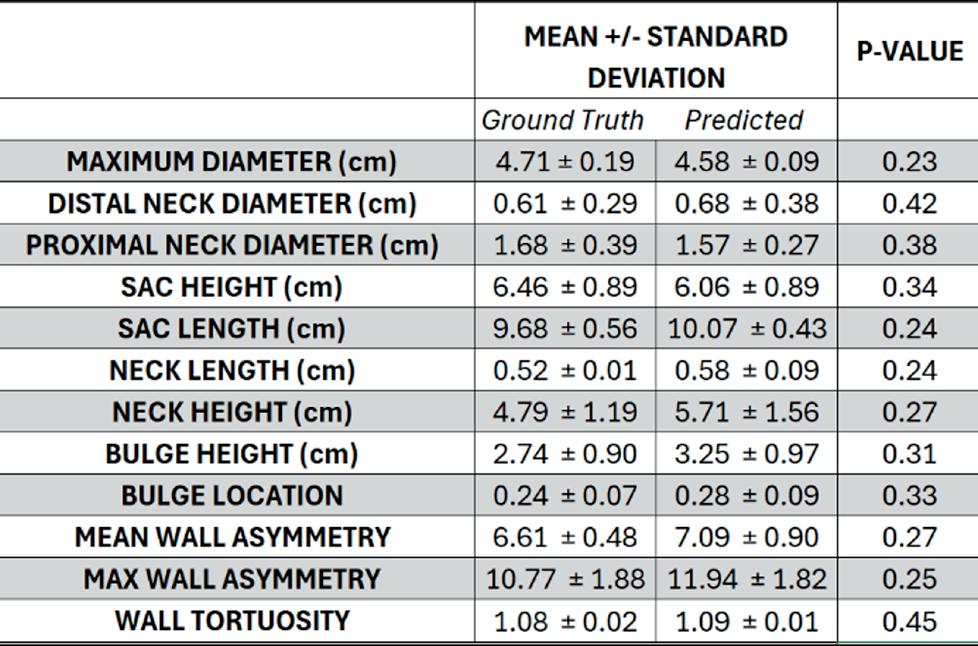
Figure 3 illustrates two geometries from the same case: the ground truth aneurysm from the original patient scan and the predicted geometry output from the morphological prediction. Both geometries have been subjected to stress predictions, and the results are represented as a colormap on the surface of each aneurysm. Qualitatively, the visualized stress distributions exhibit a similar pattern on the aneurysm surfaces with no significant differences.
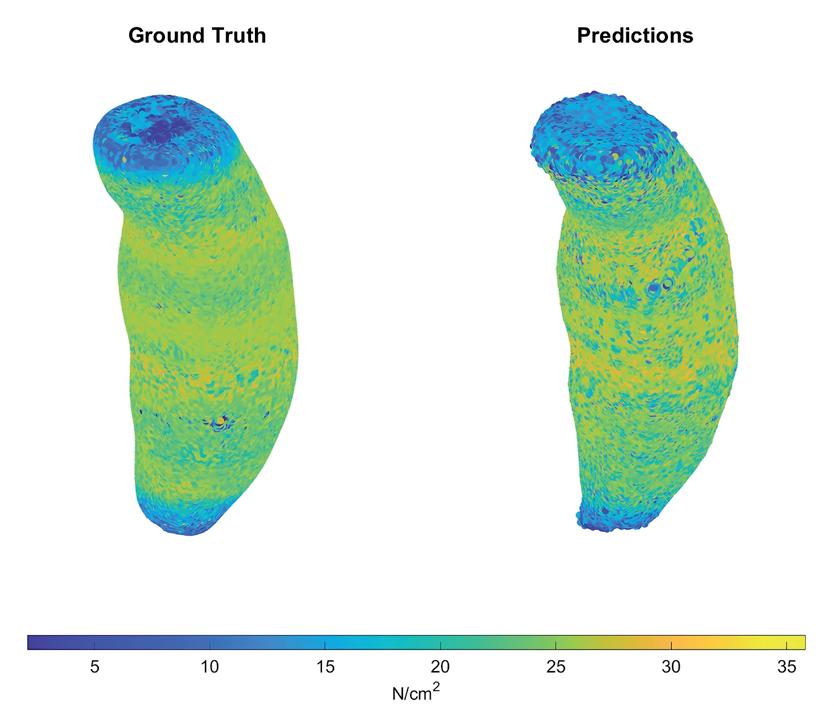
Figure 3: Ground truth (left) and predicted (right) aneurysm geometries with color mapped stress distributions overlayed on top of each geometry.
Table 2 shows quantitative metrics across three separate cases. A paired, one-tailed heteroscedastic t-test was performed for both the peak and mean wall stresses for the three cases. P-values of 0.57 and 0.28 for the peak and mean wall stresses, respectively, demonstrate no statistically significant differences between the ground truth and predicted metrics. Ground truth and predicted stress values from the three cases underwent a linear regression fit and the RMSE and R 2 values between these categories were calculated. P-values lower than 0.005 demonstrate statistical significance in the correlation between ground truth and predicted stress values.
Table 2: Quantitative metrics for peak and mean wall stresses for Ground Truth and Predicted metrics as well as RMSE and R^2 values between Ground Truth and Predicted stress values (n=3)
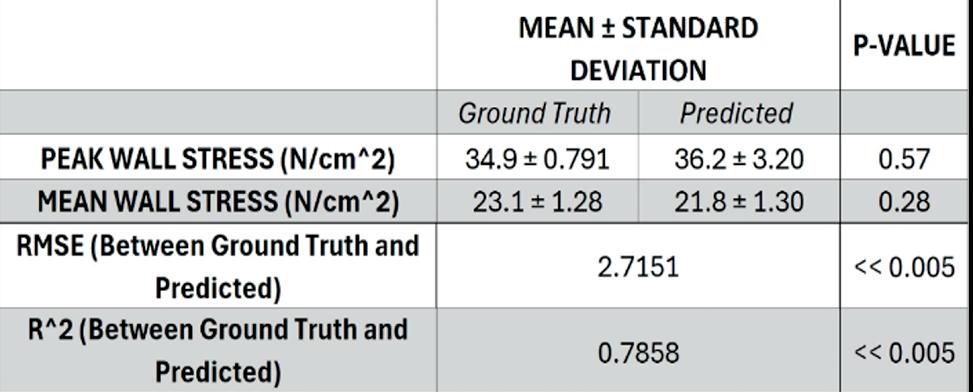
The tested morphology model cases (n=4) exhibit a similar geometric displacement pattern as the one seen in Figure 2 . The predicted geometries tend to consistently underpredict the displacement at the superior and inferior edges of the aneurysm compared to their ground truth counterparts. However, the regions of primary interest, where aneurysm growth is most prominent, near-identical displacement patterns between the predicted and ground truth geometries can be seen. The close displacement pattern in areas critical to aneurysm progression demonstrates the utility of the prediction pipeline for monitoring morphological changes.
Quantitative metrics, as summarized in Table 1, further support the accuracy of the morphological model. The lack of statistically significant differences between ground truth and predicted geometric metrics, as demonstrated by all p-values being above the alpha level set at 0.05, suggests that the current morphology prediction pipeline is capable of reliably depicting aneurysm growth prediction. These results provide reasonable confidence in the pipeline’s predictive capabilities, particularly for patient-specific monitoring and analysis.
Results from these earlier morphological predictions were tested against ground truth geometries using stress analysis. As demonstrated in Figure 3, comparisons between stress predictions performed on ground truth and predicted morphologies demonstrated a strong qualitative alignment in stress distributions. The colormap overlayed on the aneurysm surfaces highlights that the ground truth morphology stress patterns are closely replicated on predicted surfaces, especially in key areas of aneurysm growth.
Quantitative analysis of metrics, summarized in Table 2 , supports these observations. A paired, one-tailed heteroscedastic t-test yielded p-values of 0.57 and 0.28 for peak and mean wall stresses, respectively, which indicates no statistically significant differences between the ground truth and predicted peak and mean wall stress metrics as the calculated p-values are higher than the alpha level of 0.05. Furthermore, p-values significantly lower than 0.005 for the RMSE and R 2 values of the linear regression model indicate strong evidence that the relationship between ground truth and predicted stress values is statistically significant and reinforces confidence that the fit is unlikely due to random chance. These results lend confidence to the stress model pipeline’s ability to accurately capture aneurysm stress distributions and properly reproduce them on predicted geometries. Further refinement of the stress prediction model’s architecture will be done to improve model efficiency and accuracy as well as the incorporation of more patients beyond the 247 patients currently involved in training to improve generalizability. Future efforts will be directed toward determining how far into the future the morphological model can accurately predict aneurysm progression. This involves testing the

limits of the LSTM architecture to improve long-term prediction reliability as well as experimenting with other architectures such as Gated Recurrent Units (GRUs). Additionally, while the stress model is capable of being generalized across patients, the current morphological model remains patient specific and needs to be retrained for each new patient.
Presently, a prototype generalized morphological model is under work to handle a diverse, multi-patient dataset and predict aneurysm behavior across a wide range of cases. This first-generation generalized morphological TensorFlow model, currently trained on data from five patients, remains in the early stages of development. With training cycles taking approximately three minutes and an estimated 20,000 cycles needed, ~1.5 months’ worth of computational effort is required to reach a robust state. Furthermore, instability during model training is causing premature halting during the training process and hampering the collection of results. Efforts will focus on refining the architecture of the five-patient model to accelerate convergence and ensure stability during training to generalize morphological predictions across larger datasets. Utilizing more powerful computational resources, such as advanced GPU clusters available through the University of Pittsburgh’s Center for Research Computing (CRC), will also be a key step in expediting training and enhancing performance.
The current patient-specific morphology and generalized stress models demonstrate promising capabilities in predicting abdominal aortic aneurysm (AAA) growth prediction and areas of high stress across the aneurysm surface during growth to achieve virtual surveillance. The morphological model effectively captures aneurysm growth patterns over time, with predicted geometries aligning well with ground truth data in key regions of interest. Similarly, the stress model manages to accurately map wall stress distributions across aneurysm surfaces, utilizing geometric and biomechanical metrics to identify critical stress regions. The integration of these two models will provide for a foundation of a more comprehensive tool, combining morphological and stress-based predictions to assess rupture risk dynamically. These advancements aim to transition the models from research tools to clinically deployable systems, offering more precise, data-driven insights to guide intervention strategies and improve patient outcomes in AAA management.
Funding was provided by the Swanson School of Engineering at the University of Pittsburgh. This research was supported in part by the University of Pittsburgh Center for Research Computing , RRID:SCR_022735, through the resources provided. Specifically, this work used the H2P cluster, which is supported by NSF award
number OAC-2117681. We would also like to acknowledge the NTA3CT trial for providing the longitudinal medical imaging database.
[1] Umebayashi et al., Aging (Albany NY) 10(12), 36503651, 2018
[2] Laine et al., European Journal of Vascular and Endovascular Surgery 51(4), 511-516, 2016
[3] Kontopodis et al., Annals of Vascular Diseases 11(1), 78-83, 2018
[4] Moler et al., MATLAB vR2024a (Natick, MA), 2024
[5] Abadi et al., TensorFlow v2.11 (Mountain View, CA), 2016
[6] van Rossum et al., Python v3.10.2 (Wilmington, DE) 1(1), 1–1, 2009
[7] Hochreiter, Neural Computation MIT-Press, 1997
[8] Chung et al., Applications in Engineering Science 10, 100104, 202
Simran Kulkarni1, Kevin M. Bell1, Meenakshi Sundaram2 , Zakiy F. Alfikri3, Sara Piva2 , John M. Jakicic 4 , Carol M. Greco2
1Human Movement and Balance Laboratory, Department of Bioengineering, University of Pittsburgh, Pittsburgh, PA, 2School of Health and Rehabilitation Science, Department of Physical Therapy, University of Pittsburgh, Pittsburgh, PA, 3Department of Bioengineering, University of Pittsburgh, Pittsburgh, PA, 4Division of Physical Activity and Weight Management, Department of Internal Medicine, University of Kansas, Lawrence, KS
SIMRAN KULKARNI
Simran Kulkarni is a sophomore Bioengineering student from Mechanicsburg, Pennsylvania. Her primary research interests include biomechanics and cellular engineering. After graduation, she plans to continue her education by attending medical school.
KEVIN M. BELL, PHD
Dr. Bell is an Assistant Professor in the Department of Bioengineering with a Secondary Appointment in the Clinical and Translational Science Institute. Dr. Bell is a member of the Human Movement and Balance Laboratory and his research focuses on development and application of portable human movement sensors towards the assessment of joint function throughout the musculoskeletal system.


Individuals with chronic low back pain (cLBP) are generally physically inactive and low physical activity has been associated with high levels of pain and disability in cLBP. Therefore, an accurate assessment of physical activity in these individuals is needed. This study compares ActiGraph’s low- and normal-frequency extensions in the assessment of physical activity. Results of this study can inform whether the use of different types of filters impacts the assessment of physical activity in cLBP.
Keywords: Chronic Lower Back Pain (cLBP), Actigraph Accelerometers, Physical Activity Monitoring, Frequency Comparison
Chronic low back pain (cLBP) is a prevalent condition and a leading cause of disability, necessitating accurate monitoring of physical activity for improved understanding and management. Previous research has yielded mixed findings regarding the ability of accelerometers to accurately quantify physical activity, particularly in populations with reduced or less vigorous movements, such as individuals with cLBP. This study examines differences in physical activity measurements obtained using ActiGraph accelerometers processed with normalfrequency and low-frequency extension (LFE) filters. Data was collected from 47 individuals with cLBP who wore ActiGraph sensors on their waist and wrist for seven days during standard daily activities. The LFE filter consistently recorded higher values across various metrics, including kilocalories, total activity counts, minutes in moderateto-vigorous physical activity (MVPA), and average step counts per minute, compared to the normal-frequency filter. The major finding of our study is that the LFE filter consistently recorded higher values than NFE across various metrics, including kilocalories, total activity counts, minutes in moderate-to-vigorous physical activity (MVPA), and average step counts per minute, compared to the normal-frequency filter (p < 0.001). These findings suggest that the LFE filter may improve sensitivity in detecting lower amplitude movements characteristic of individuals with cLBP. The study highlights the potential of LFE processing to enhance activity monitoring and inform

personalized treatment strategies. Future work will apply this analysis to the full participant cohort of more than 1000 individuals with cLBP and 100 non-LBP controls and further explore correlations between activity counts and pain severity.
Low back pain (LBP) is one of the leading causes of disability [1]. Research has been done on the relationship between chronic low back pain (cLBP) and physical activity [1]. A recent scoping review of accelerometer use in individuals with cLBP found that study results of physical activity were often contradictory [2]. The current research project focused on analyzing data collected on physical activity from ActiGraph accelerometer sensors and determining the differences between ActiGraphs’s normal-frequency and low-frequency extension filters for assessing physical activity of cLBP participants during free-living activities. The ActiGraph sensors track acceleration, which can be used to determine how often a subject moves throughout the day. The accelerometer helps track movement by measuring acceleration in different axes and then uses this information to estimate movement which is then interpreted as physical activity. [3] Research showed that compared to normal-frequency, data collected through the low-frequency extension filter of ActiGraph estimates higher daily steps among inactive individuals in a free-living environment [4].
Because persons with cLBP may have slower and/or less vigorous steps than those without cLBP [5], it is hypothesized that low data processing algorithms will exhibit higher values, when applied to activity counts, step counts, and other physical activity metrics from individuals with cLBP. Identifying the differences between low- and normal-frequency filters is needed to help with identifying what filter may be more suited for analyzing activity of those individuals with cLBP.
2.1- Data Collection:
This project is an ancillary study to the parent Low Back Pain Research Study, LB3P, (U19AR076725). After institutional approval and informed consent, participants were included in the study if they had cLBP as defined by the National Institutes of Health (NIH) [6]. The inclusion criteria is that individuals were included in the study if they had a prior record in our affiliated electronic health record system, were not actively participating in a double-blind intervention study for low back pain (LBP) with unknown treatment assignment, or did not have any condition that could pose additional risk or result in non-compliance.
Participants wore an ActiGraph GT9X wrist sensor and waist sensors for approximately seven days as they continued their standard daily life activities. As for standard procedure, the wrist and waist sensors were worn on participants as shown in Figure 1. One device
was worn on the individual’s non-dominant wrist, and another was secured to their dominant hip using a belt. Participants were instructed to wear the wrist devices continuously, while the waist device was removed while sleeping.

Figure 1: The Actigraph sensors were to be worn with one sensor on the individual’s wrist and the other on their dominant hip. Image created with Biorender.
The sensors worked by using accelerometers to measure movements of patients throughout their wear period. [7] Although participants were informed to wear the sensors for seven days, the data showed that participants wore the sensors from six to eight days.
After the data was collected, the ActiLife program was used to import the raw ActiGraph sensor data from each participant. These data were processed using ActiLife’s low-frequency extension as well as the normal-frequency extension, which is the standard processing algorithm. The low-frequency extension is designed to detect lower amplitude movements over the normal-frequency. A sample of 47 participants were used for a preliminary data analysis.
The raw data files were converted into AGD files with a 60 second Epoch. Two copies of each converted GT3X were downloaded, one with the low-frequency extension used and the normal-frequency threshold. The AGD files were then uploaded into the Scoring section of the ActiLife software. The following algorithms were applied to the files: Freedson Adult (1998) for metabolic equivalents (METs), Freedson Adult (1998) for the activity level cut points and moderate-to-vigorous physical activity (MVPA), and Freedson Combination (1998) for the energy expenditure. Throughout these processes, both the normal- and low-frequencies were applied. Twotailed paired t-tests were used to compare the outcomes computes using the normal- and low-frequency data, with statistical significance define as p < 0.05. All values are presented as mean ± standard deviation interval unless
otherwise noted. Analysis was applied to the following categories: kilocalories, total activity count, MVPA, and average step count per minute.
The LB3P study is the parent study and included 1007 participants spanning the spectrum of mild to severe chronic low back pain (cLBP), with this project focusing on a sample of 47 participants. The major findings of our study indicate that the low-frequency extension yielded higher values compared to the normal-frequency extension for kilocalories, total activity count, minutes in MVPA, and average step count per minute. The low-frequency data consistently exhibited increased values across these variables. Statistical comparisons between the low-frequency and normal-frequency data collected from the waist and wrist sensors revealed significant differences, with P-values less than .001 for all measured variables.
Table 1: Comparison of weekly indices of physical activity using low-frequency and normal-frequency extensions from the waist and wrist-worn sensors. In the table Moderate to physical activity is represented as MVPA and standard deviation is represented as SD.
Our findings highlight the potential advantages of the low-frequency extension in capturing activity levels in individuals with cLBP. This suggests that the lowfrequency extension may enhance sensitivity in detecting movement, which is particularly relevant for individuals with limited mobility. By improving activity monitoring accuracy, the low-frequency extension could contribute to more precise phenotyping of cLBP patients and inform targeted treatment approaches.
These results align with previous studies demonstrating that the low-frequency extension can detect lower amplitude movements [2]. Furthermore, our findings reinforce the need for refined methods in activity tracking for individuals with cLBP. However, there is still uncertainty regarding which frequency extension—low or normal—produces more valid data to represent the activity patterns of patients with cLBP [CITE]. Additional research
is necessary to establish which extension provides the most accurate representation of physical activity in this population.
One limitation of this study is its relatively small sample size of 47 participants. Future research will expand the analysis by applying the low-frequency filter to all 1007 participants in the LB3P study. Further studies and comparisons with existing literature are needed to enhance our understanding of the implications of lowfrequency versus normal-frequency extensions in activity monitoring.
While the low-frequency extension shows promise in detecting lower amplitude movements and potentially providing higher activity counts, further research is necessary to validate its accuracy and explore its implications for understanding and treating cLBP. The implications of utilizing the low-frequency extension are significant, as it may enhance the sensitivity of activity monitoring in patients with cLBP. This could lead to better phenotyping and targeted treatment approaches. Continued investigation into the correlation between activity counts and pain severity will be crucial for advancing this field.
The Back Pain Consortium Research Program is administered by the National Institute of Arthritis and Musculoskeletal and Skin Diseases. This research was supported by the National Institutes of Health through the NIH HEAL Initiative under award number U19AR076725-01. The content is solely the responsibility of the authors and does not necessarily represent the official views of the National Institutes of Health or its NIH HEAL Initiative. Funding was provided by the Swanson School of Engineering and the Office of the Provost at the University of Pittsburgh. University of Pittsburgh Clinical and Translational Science Institute (CTSI) assisted with program management. University of Pittsburgh Physical Therapy-Clinical and Translational Research Center provided clinical research space.
[1] GBD 2021 Low Back Pain Collaborators. Global, regional, and national burden of low back pain, 19902020, its attributable risk factors, and projections to 2050: a systematic analysis of the Global Burden of Disease Study 2021. Lancet Rheumatol 2023: 5: e316-29.
[2] Berger M, Bertrand AM, Robert T, Chèze L. Measuring objective physical activity in people with chronic low back pain using accelerometers: a scoping review. Front Sports Act Living. 2023 Nov 1;5:1236143. doi: 10.3389/fspor.2023.1236143. PMID: 38022769; PMCID: PMC10646390.

[3] Smith MT, McCrae CS, Cheung J, et al. Use of Actigraphy for the Evaluation of Sleep Disorders and Circadian Rhythm Sleep-Wake Disorders: An American Academy of Sleep Medicine Clinical Practice Guideline (https://www.ncbi.nlm.nih.gov/pmc/ articles/PMC6040807/). J Clin Sleep Med, 2018; 14(7), 1231–1237. Accessed 8/16/2023.
[4] Hlavacka et al. Brain Res Bull 40, 431-435, 1996. Feito Y, Hornbuckle LM, Reid LA, Crouter SE. Effect of ActiGraph’s low frequency extension for estimating steps and physical activity intensity. PLoS One. 2017 Nov 20;12(11):e0188242. doi: 10.1371/ journal.pone.0188242. PMID: 29155845; PMCID: PMC5695824.
[5] Hicks GE, Sions JM, Coyle PC, Pohlig RT. Altered spatiotemporal characteristics of gait in older adults with chronic low back pain. Gait Posture. 2017 Jun;55:172-176. doi: 10.1016/j.gaitpost.2017.04.027. Epub 2017 Apr 23. PMID: 28458149; PMCID: PMC5493311.
[6] Nicol V, Verdaguer C, Daste C, Bisseriex H, Lapeyre É, Lefèvre-Colau MM, Rannou F, Rören A, Facione J, Nguyen C. Chronic Low Back Pain: A Narrative Review of Recent International Guidelines for Diagnosis and Conservative Treatment. J Clin Med. 2023 Feb 20;12(4):1685. doi: 10.3390/jcm12041685. PMID: 36836220; PMCID: PMC9964474.
[7] The Sleep Foundation. Actigraphy (https://www. sleepfoundation.org/sleep-studies/actigraphy). Last reviewed 05/10/2022. Accessed 8/16/2023.
[8] Cain KL, Conway TL, Adams MA, Husak LE, Sallis JF. Comparison of older and newer generations of ActiGraph accelerometers with the normal filter and the low frequency extension. Int J Behav Nutr Phys Act. 2013 Apr 25;10:51. doi: 10.1186/1479-5868-10-51. PMID: 23618461; PMCID: PMC3641979.
Jake Laws1, Zefan Shao1, Qihan Liu1
1Department of Mechanical Engineering and Materials Science, University of Pittsburgh, Pittsburgh, PA
JAKE LAWS
Jake Laws is an undergraduate student from West Chester, Pennsylvania studying Biomedical Engineering at Duquesne University. Through the MEMS fire program, he was able to work in Dr. Liu’s lab, researching soft materials and adhesion mechanisms. After graduation, he plans to pursue a PhD in Materials Science and Engineering.
ZEFAN SHAO
Zefan Shao is a PhD candidate in Mechanical Engineering at the University of Pittsburgh, specializing in solid mechanics, polymer formulation, and material performance optimization. His research focuses on hydrogel adhesion mechanisms, osmotic pressure characterization, and advanced structural materials. Zefan has extensive experience in mechanical testing, rheological analysis, and nanoparticle synthesis, with multiple peer-reviewed publications in materials science and engineering. He has also served as a teaching assistant for fracture mechanics and has mentored students in experimental research.
QIHAN LIU, PHD
Dr. Liu received his BS from the University of Science and Technology of China (Special Class for Gifted Young) in 2010 and his PhD from Harvard University in Materials Sciences and Mechanical Engineering in 2016. Since completing his PhD, Dr. Liu has worked at Harvard as a postdoctoral fellow in the Bioengineering Department studying the manufacturing of 3D nanofibrous scaffold for regenerative heart valves. Dr. Liu’s research engages in multiple aspects of the mechanics and the manufacturing of soft materials to explore the possibilities that soft materials can offer to various engineering applications.

Hydrogels are an integral part of soft machine technology with both biomedical and industrial applications. This study advances our understanding of adhesion in hydrogels by identifying optimal properties for reversible, strong, and stimuli responsive adhesion. Understanding the viscoelastic properties and energy dissipation mechanisms of hydrogels enables improved designs in soft machines requiring robust, reversible adhesion.
Keywords: Osmocapillary adhesion, dissipation, adhesion energy
Hydrogels demonstrate strong osmocapillary adhesion, which can contribute to many biomedical and industrial applications. This study provides insights into how polymer composition in hydrogels affects adhesion energy. Previous work has shown that free polymer chains that contribute to the viscous, dough part of the hydrogel can be combined with interlinked, networked polymer chains, which maintain the bulk strength. These two polymer chains, when combined at the right ratio, can produce high adhesion energy. Testing and optimizing adhesion energy can be used to quantitatively assess the performance and reliability of adhesion in reversible applications. Here, we find that getting as close to bulk failure without achieving structural failure allows for the highest adhesion energy. A hydrogel with a ratio of 0.2:0.8 networked to free chain polymer content best demonstrates this high adhesion energy. The results suggest that precise manipulation of polymer networks allows for robust adhesion energy during peeling and efficient detachment without bulk failure. The findings of this study contribute to the development of highperformance soft machines, including wearable devices, wound dressings, and soft robots.

Current research shows a diverse array of applications for adhesion in soft machines in biomedical science such as medical implants, wound dressings, and drug delivery [1] as well as applications in more mechanical-based devices like sensors, soft robots, and underwater adhesives [1]. Significant advances have been made towards the implementation of soft machines in the biological and mechanical engineering fields. These machines are of such great interest because they can easily be used with soft tissues. Further, they provide an adequate replacement for the friction and interlocking mechanisms required with hard machines and can allow for easier part replacement [2]. Soft machines make working with soft tissue/materials much easier as hard machines can harm tissue, restrict movement, and have far less conformability [3].
These types of machines require adhesion, which can allow for elastic functionality of the machine as well as more adaptive, agile interactions between the machine and the user [4]. Adhesion techniques have been posed as a replacement for robust, hard-material machines that are often not reversible after deformation occurs, unlike soft machines, which allow for significant deformations [2]. The goal is to find where the strongest adhesion energy occurs, which will support the reversible, strong adhesion. Based on prior work, an adhesion energy of 200 J/m2 will be considered sufficient for good adhesion behavior. To achieve this, a polymer-based hydrogel, a commonly used soft hydrophilic material with strong entropic and elastic properties [5], is utilized. Hydrogels exhibit osmocapillary adhesion, enabled by the concept of osmocapillary phase separation [2]. This osmocapillary adhesion has proven to be effective but can be further improved to achieve stronger adhesion energy. Here, we synthesized hydrogels demonstrating strong adhesion behavior. These hydrogels are synthesized based on a ratio of combined free chain (FC) and networked (NW) polymers, comprising the biphasic (liquid and solid) nature of hydrogels [6]. The elastic component of the gel stems from the crosslinked structure of the NW polymers [7], providing the backbone of the hydrogel. Sometimes referred to as the “dough” of the hydrogel, the FC polymers contribute to the viscous behavior of the hydrogel. When these two components are mixed at the right ratio, the elastic component maintains the bulk strength while the viscous component allows for deformation to occur due to bulk dissipation. The hydrogel is therefore a viscoelastic material.
To enhance the adhesion in the hydrogels, energy dissipation must be effective in the hydrogel as it undergoes deformation. Previous work has shown that tough adhesion can be achieved with the presence of strong interfacial linkages (due to the hydrogen bonding of the osmocapillary adhesion) integrated with the tough dissipative properties in hydrogels [1]. A direct relationship can be shown from dissipation to adhesion energy, a common parameter that demonstrates adhesion behavior [1].
The dissipation is related to the viscosity behavior of a hydrogel. Figure 1 demonstrates that when entangled polymer chains are stretched, they resist deformation and contributions are made towards the elastic and viscous responsiveness of the hydrogel through dissipation [7]. Measuring this response is important in determining these mechanical parameters that make for strong adhesion and can be done so using rheology.

Figure
as heat during stretching/deformation. This energy provides tough, reversible adhesion. Credit: Zhao, X., Chem. Rev. 121, 2021
To systematically study how energy dissipation affects adhesion, we characterize the viscous behavior of hydrogels and test their adhesion energy. Adhesion energy is a direct method of characterizing the adhesion behavior of a hydrogel [8]. The viscoelastic properties can be measured using rheology, which quantifies the in-phase and out-of-phase responses of a fluid under stress or deformation [6]. A rheometer allows detection of dynamic moduli and viscosity.
The ideal adhesive bonding and debonding will be demonstrated in a window with the bonding of adhesion occurring when the elastic moduli is at low frequencies [G’ (0.1 rad/s -1)] and the debonding is occurring at a ratio of the elastic moduli at high and low frequencies [G’ (100 rad/s -1)/ G’ (0.1 rad/s1)] [6]. Figure 2 demonstrates the window where the optimal ratio of bonding and debonding should occur to produce the highest adhesion energy. It is expected that the ideal dissipation and adhesion properties of a hydrogel composed of a mix of FC and NW polymers will occur within this window. Further, adhesion energy must be tested through a peeling test that measures the force required to debond the gel from a substrate. With high adhesion energy, the desired robust adhesion can be obtained.
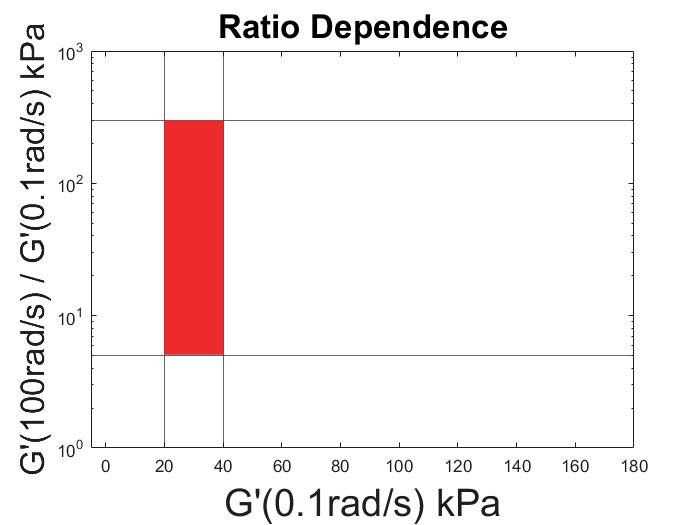
Figure 2: There is a window for ideal adhesion energy where expected ratio of FC/NW polymers that will be in this red window after a rheometer test. This is expected to be where the best adhesion energy can be found.
2.1
The synthesis of the hydrogel was done in two parts. The free chain polymer was first synthesized by dissolving an acrylamide (AAM)-water solution with a 40% water weight content at 40°C. After 8-10 minutes of dissolving, the heating was removed, and the chain transfer agent (CTA) Methyl 3-mercaptopropionate was added at a concentration of 1.5%. After 20 seconds of allowing the solution to become homogeneous, irgacure, an ultraviolet (UV) curing agent, was added at 0.01% concentration for the polymerization process and was mixed for another 20 seconds. Throughout the mixing/dissolving process, the beaker was covered with aluminum foil to prevent early polymerization of UV-sensitive chemicals. Following mixing, the solution was poured into a 1 mm thick rubber mold placed onto a glass substrate and covered to avoid exposure to oxygen. After two hours of exposure to the UV light, the solution polymerizes, and a soft dough-like gel forms.
Using the ratio of FC to NW being tested, an identical process was followed to synthesize the NW part of the hydrogel. With every gel synthesized, a 40% water content was used. This was then added back into the synthesized FC dough and mixed thoroughly to ensure that the gel was homogeneous. A crosslinker methylene bisacrylamide (MBAA) was then added to the mixed gel along with sodium DODecyl sulfate (SDS) to ensure comparable adhesion even with different substrates. After the addition of the MBAA, UV initiator was added to the solution and the gel was polymerized under the UV light for two hours. In our tests requiring a ratio 0:1 (all FC) or 1:0 (all NW), only one polymerization step was necessary.

to the area UV light could reach as well as size of glass cover slides.
To confirm the validity of the window posed to be the location with the best adhesion energy results as demonstrated in Figure 1, an MCR 302e rheometer was used to measure the G’ (storage modulus) and G’’ (loss modulus) of each sample. Rheology, the science of material deformation and flow [9], is well-suited for assessing the viscoelastic properties of our gels, enabling precise tuning of viscosity to meet specific requirements. The samples were measured at 15 incrementally decreasing frequencies and the resulting pressures (Pa) were recorded. This data was collected multiple times using numerous samples with varying ratios. Using data plots, comparisons were made to confirm consistent results across different samples. Finally, the two pressures at the lowest G’ frequency and the ratio of highest to lowest frequency were plotted to see the location in relation to the window. To investigate the effect of free chain-to-network polymer ratios on adhesion energy, hydrogels were synthesized and tested at a fixed CTA concentration of 1.5%. The FC-to-NW polymer ratios (r) were systematically varied as follows: 0:1 (r=0), 0.1:0.9 (r=0.1), 0.2:0.8 (r=0.2), 0.4:0.6 (r=0.4), 0.7:0.3 (r=0.7), and 1:0 (r=1). The peeling tests were also done with samples at each ratio listed. Each sample was held to a consistent width of 20mm and a length of ~60mm. A glass substrate was used to adhere each sample and a piece of film was adhered to the back length of the gel using superglue. Firm pressure was applied to the gel to ensure strong osmocapillary adhesion between the gel and the substrate. Once this glue dried, the test was performed using a Shimadzu EZ-LX universal tester. The specific test was a pre-programmed peeling test that measured the force required to peel the sample from the substrate with a 50 mm/min peeling rate. A successful test is seen if the force increases sharply then plateaus to a steady state for the duration of the peel. The force output is divided by the

width of the sample to provide G, the adhesion energy, in J/m2 . The peeling tests were also done with samples at each ratio listed.
Once each ratio is tested using the rheometer, the adhesion behavior is characterized by the results of the peeling tests. Figure 4 demonstrates the viscosity tests at a CTA concentration of 1.5%, which shows a logarithmic trend and plots r=0.4 within the window. The highest adhesion energy is expected to be seen at this ratio.
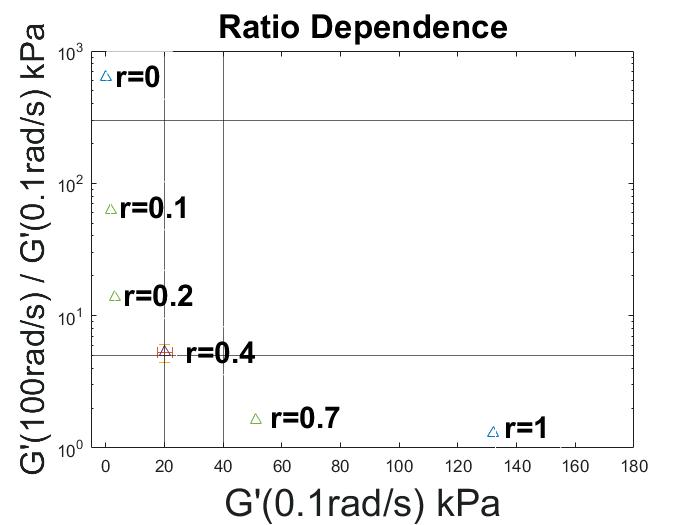
Figure 4: Characterized viscosity behavior at different ratios. The dough (r=0) shows a very low G’ at the lowest frequency with a high difference between the highest and lowest frequency. The pure gel (r=1) shows the highest G’ at low frequencies and the lowest difference between G’ at the high and low frequencies.
Peeling tests were performed on samples at the chosen ratios. A ratio of 0.1 required the most amount of force to peel from the substrate. An adhesion energy of 200 J/ m2 is considered sufficient for good adhesion behavior; r=0.1 exceeded this by ~250 J/m2 . However, complete bulk failure was observed at r=0.1 and r=0, while r =0.2 maintained high adhesion energy with its bulk strength. As the NW part increased, bulk strength was maintained but adhesion energy decreased. Adhesion energy decreased accordingly with low adhesion at r=0.4 and r=0.7 and almost no adhering at r=1, which was entirely NW polymers.
The G’ behavior is entirely dependent on the ratio of FC/ NW polymer. This behavior is expected as the changing ratios directly affect the bulk and viscous components of the gel. Peeling tests provided results that aligned with what was expected as ratios of 0 and 1 provided almost no adhesion energy (Figure 5). However, the window ratio of 0.4 did not provide the highest adhesion energy in our tests, which was unexpected.
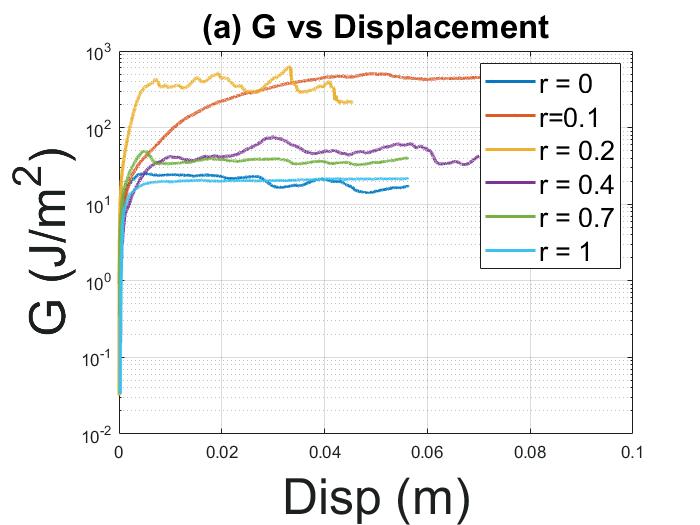
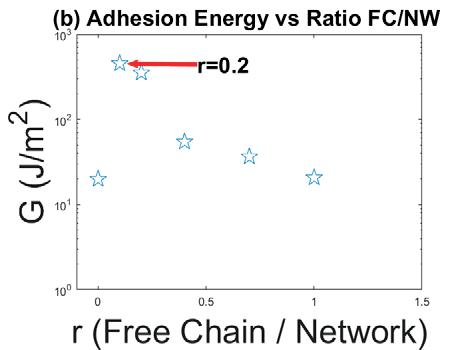
Figure 5: Characterizing adhesion energy of each ratio. (a) raw data of each peeling tests show the highest adhesion energy at G= 450 J/m2. (b) The average adhesion energy is shown for each ratio. A trend is seen with rising adhesion energy and decreasing ratio as r=0.1 is approached.
While r=0.1 did show the highest adhesion energy, complete bulk failure was seen. A ratio 0.2 showed a high, comparable adhesion energy while maintaining bulk strength. Due to r=0.2 being the lowest ratio without seeing bulk failure before observing failure at 0.1, it was unnecessary to test any ratios lower than 0.1. Low adhesion energy was seen at ratios higher than r=0.2 due to the osmocapillary adhesion becoming weaker with higher NW parts.
This study aimed to identify the optimal ratio of free chain to networked polymers in hydrogels to maximize adhesion energy. Our initial hypothesis was that a ratio of 0.4:0.6 FC-to-NW polymer content would fit into a window previously posed to be the best fit for the highest adhesion. The ideal adhesion energy was not seen at ratio that fit in the window. What we observe is that a 0.2:0.8 ratio of FC to NW produced an adhesion energy two times greater than the adhesion energy at the expected ratio. Therefore, the best energy dissipation without bulk failure occurring can be found at r=0.2. This high adhesion energy with preservation of the bulk of the gel is required for fully reversible adhesive removal. This is seen as the most favorable balance between elasticity and viscosity. These findings demonstrate the importance of manipulating the viscoelastic properties in hydrogel synthesis for strong adhesion.
It is still possible that another point in the window produces higher adhesion energy than what was found in this research. Future research should explore this viscoelastic relationship in greater detail, potentially requiring comprehensive analysis of polymer ratios in hydrogels and their corresponding behaviors. Expanding the range of ratios studied could provide additional data to further elucidate this relationship. More work should be done to determine the dependency of chain length on this adhesion behavior. Further work to find a point that does fit well into the window while maintaining high adhesion energy could also be beneficial. Additionally, this experiment only tested the adhesion behavior using glass as a substrate. Future tests could utilize different
substrates that will most likely produce different results. With further testing, exact adhesion behavior tuning is possible. The insights gained from this work will inform the design of hydrogels, contributing towards the development of soft machines as we advance towards achieving stronger reversible adhesion.
This research was funded by the NSF and facilitated thanks to the MEMS FIRE program. Thank you to Dr. John Whitefoot, Dr. Qihan Liu and all other faculty who helped make the program an enriching experience. Special thanks to Zefan Shao and others for providing their knowledge and expertise throughout this process.
[1] Zhao, X., Chen, X., Yuk, H., Lin, S., Liu, X., & Parada, G. (2021). Soft Materials by Design: Unconventional Polymer Networks Give Extreme Properties. Chemical Reviews, 121(8), 4309–4372. https://doi.org/10.1021/ acs.chemrev.0c01088
[2] Shao, Z., & Liu, Q. (2023). Osmocapillary adhesion: Reversible and strong adhesion between any hydrogel. Extreme Mechanics Letters, 61, 101996. https://doi. org/10.1016/j.eml.2023.101996
[3] Hsiao, J.-H., Chang, J.-Y. (James), & Cheng, C.-M. (2019). Soft medical robotics: clinical and biomedical applications, challenges, and future directions. Advanced Robotics, 33 (21), 1099–1111. https://doi.org/ 10.1080/01691864.2019.1679251
[4] Ding, M., Jing, L., Yang, H., Machnicki, C. E., Fu, X., Li, K., Wong, I. Y., & Chen, P.-Y. (2020). Multifunctional soft machines based on stimuli-responsive hydrogels: from freestanding hydrogels to smart integrated systems. Materials Today Advances, 8, 100088. https://doi.org/ https://doi.org/10.1016/j.mtadv.2020.100088
[5] Sudre, G., Olanier, L., Tran, Y., Hourdet, D., & Creton, C. (2012). Reversible adhesion between a hydrogel and a polymer brush. Soft Matter, 8 (31), 8184. https://doi. org/10.1039/c2sm25868d
[6] Sun, S., Li, M., & Liu, A. (2012). A review on mechanical properties of pressure sensitive adhesives. International Journal of Adhesion & Adhesiv, 98–106.
[7] Cacopardo, L., Guazzelli, N., Nossa, R., Mattei, G., & Ahluwalia, A. (2019). Engineering hydrogel viscoelasticity. Journal of the Mechanical Behavior of Biomedical Materials, 89, 162–167. https://doi.org/ https://doi.org/10.1016/j.jmbbm.2018.09.031
[8] Yuk, H., Zhang, T., Lin, S., Parada, G. A., & Zhao, X. (2016). Tough bonding of hydrogels to diverse nonporous surfaces. Nature Materials, 15(2), 190–196. https://doi.org/10.1038/nmat4463
[9] Janmey, P. A., Georges, P. C., & Hvidt, S. (2007). Basic Rheology for Biologists. In Methods in Cell Biology (Vol. 83, pp. 1–27). Academic Press. https://doi.org/ https://doi.org/10.1016/S0091-679X(07)83001-9
Joseph C.
Long1,
Matthew D. Poskus1, Ioannis Zervantonakis1,2
1Tumor Microenvironment Engineering Laboratory, Department of Bioengineering, University of Pittsburgh, Pittsburgh, PA, 2UPMC Hillman Cancer Center, Pittsburgh, PA
JOSEPH C. LONG
Joseph Long is a junior Bioengineering student on the Biomechanics track. He is interested in developing and constructing medical devices and prosthetics. After graduation, he is looking to go into industry and pursue a master’s in Mechanical Engineering. Outside of lab, he enjoys singing, cooking, and playing video games.
MATTHEW D. POSKUS
Matthew Poskus received his BS/MS degree in Mechanical Engineering from Rochester Institute of Technology (RIT) in 2019 where his research focused on the development of a numerical model of blood damage and membrane transport in microfluidic hemodialysis devices. He also worked at Ortho Clinical Diagnostics in Rochester, New York for two semesters and was a member of RIT’s Formula SAE team for five years, serving as the team’s Chief Engineer in his last year. Matthew is interested in using systems biology approaches and modeling to study drug resistance. Outside of the lab, he enjoys snowboarding, running, and working on cars.
IOANNIS ZERVANTONAKIS, PHD
Ioannis Zervantonakis was born in Athens, Greece, where he completed his BS in Mechanical Engineering, PhD in Mechanical/Biological Engineering and postdoc fellowship in Cancer Biology. His lab is interested in developing microfluidics and systems biology-based approaches to understand how cancer cells interact with their environment.




Fibroblasts within the tumor microenvironment (TME) have been shown to provide resistance to HER2+ breast cancer therapies via secreted factors. This study aims to provide a basis for studying cell proliferation/ survival factor pathways and their upstream activation mechanisms for designing combination therapies in drugresistant HER2+ tumors.
Keywords: Breast Cancer, Fibroblasts, Proliferation, Immunofluorescence
Abbreviations: Tumor microenvironment (TME), Human Epidermal Growth Factor Receptor 2 positive (HER2+), Cyclic Immunofluorescence (CyCIF), Multiple Choice Microscopy (MCMICRO)
Resistance to HER2+ targeted therapies in patients with HER2+ breast cancer has long been a factor in poor prognosis. Studying the tumor microenvironment (TME) may lead to new actionable targets for restoring drug sensitivity. Fibroblasts have been shown to contribute to a protective effect on HER2+ tumor cells, granting cell proliferation and promoting pro-survival signaling. While these fibroblast-mediated factors indicate resistance, not much is known about spatial patterns of tumor heterogeneity. In this study, we focus on characterizing the relationship between the intensity of apoptotic, prosurvival, and proliferative markers at the protein level in correspondence to spatial metrics between tumor cells and fibroblasts. These proteomic data were acquired using a cyclic immunofluorescence (CyCIF) assay in a HER2+ breast cancer xenograft. CyCIF produced single-cell data that allowed us to measure the mean intensities for 15 antibodies and perform correlation analyses. Of those 15 markers, Ki67 (correlation coefficient 0.22 with a p-value of 1.20E-26) and pS6 (correlation coefficient 0.33 with a p-value of 3.06E-58) showed a significant association with increasing number of fibroblasts located within a distance 0-50um away from tumor cells. Our findings demonstrate the critical role of fibroblast proximity to cancer cells in HER2 therapy resistance.
Breast cancer accounts for 31% of all cancer cases [1]. About 15% of these cases are classified as human epidermal growth factor receptor positive (HER2+), a subset that overexpresses the HER2 receptor. HER2targeted therapies, such as lapatinib, have been utilized to inhibit the HER2 receptor that promotes tumor progression; however, between 38%-75% of HER2+ breast cancer patients develop resistance to HER2-targeted therapies [2-4]. More recent studies have drawn attention to fibroblasts as a regulator of therapeutic resistance [5]. In our previous work, we showed that fibroblast-derived secreted factors sustain cancer cell proliferation via the PI3K/mTOR/pS6 pathway in the presence of lapatinib treatment. Resistance occurs through activation of prosurvival pathways [6].
The physical layout of the tumor microenvironment has also been of interest regarding intratumor heterogeneity and its impact on treatment responses. Previous studies have performed spatial analysis of the distance between tumor cells and fibroblasts using a limited number of proteomic markers and showed that tumor cells closer to fibroblasts exhibit increased proliferative markers, Ki67 and BrdU, in preclinical animal models treated with lapatinib [7]. Analyzing the position and spatial organization of fibroblasts within the tumor microenvironment could offer insight into designing new combination therapies to restore drug sensitivity. Here, we analyze how tumor-fibroblast distances and number of neighboring fibroblasts impact the expression of more than 10 markers for proliferation, apoptosis, and prosurvival pathways in tumor samples from a breast cancer xenograft. Our hypothesis is that in response to lapatinib treatment, tumor cells near fibroblasts exhibit higher levels of pro-survival, apoptotic, and proliferative proteins compared to tumor cells further from fibroblasts. We aim to uncover potential pathways that are contributing to tumor cell survival or proliferation in fibroblast-rich areas such that combination therapies targeting these pathways could improve therapeutic response.
2.1
We employed the tissue-based cyclic immunofluorescence (t-CyCIF) assay based on an established protocol [8]. We used formalin-fixed paraffin-embedded slides from a BT474 mouse xenograft treated with lapatinib. Tissue slides underwent a deparaffinization step that involved repeated submersion into xylene, and solutions of ethanol and deionized (DI) water. Times and concentrations are detailed in Table 1
Table 1: Slide deparaffinization solutions and respective times in each.
Antigen retrieval was performed via submerging the tissues in a citrate buffer solution and steaming in a vegetable steamer for 40 minutes. The slides were then removed and washed four times with DI water to rinse off the remaining buffer solution. Lastly, slides were treated with odyssey blocking buffer to limit nonspecific staining. The slides were incubated for 30 minutes at room temperature in a stain saver box that blocked light from reaching the tissue. The slides were then washed three times with PBS before being stored in a 4°C refrigerator.
2.2.1 Background Autofluorescence Bleaching and Imaging
Each tissue slide is treated with a bleaching solution (4.5% hydrogen peroxide and 24mM NaOH in PBS) under UV light for 75 minutes and then washed four times with PBS before being placed back into a storage container at 4°C. The first background image is obtained by staining the tissue with a 2.5ug/mL Hoechst 33342 solution in a stain saver box for 10 minutes. The slide is then washed four times with PBS before a piece of cover glass is applied using a 50/50 (v/v) ratio glycerol and PBS solution. The tissue is then imaged with a Nikon Ti2 microscope (20x magnification) on the following channels and their respective exposure settings: DAPI (50ms); GFP (1s); DsRed (1s); Texas Red (1s); Cy5 (1s). The slide was then removed from the microscope and the cover glass is detached by placing the slide in PBS. Next, the slide was washed four times with PBS before being stored at 4°C.
Each cycle of CyCIF follows the same pipeline as shown in Figure 1.

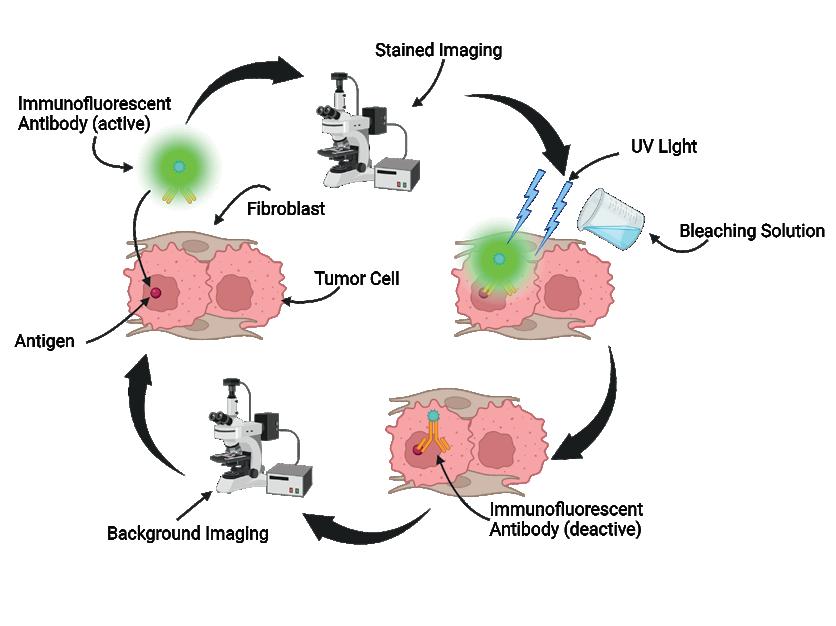
Figure 1: Generalized CyCIF cycle diagram (Made in BioRender).
In each cycle, a 250uL solution consisting of 1.0ug/mL Hoechst 33342 and the primary antibody at the manufacturer-indicated concentration in blocking buffer was used. Each antibody is conjugated to a fluorophore that is detected using one of the following imaging channels: GFP, Texas Red/DsRed, and Cy5. The following table contains cycles and their respective antibodies, excitation wavelengths, and marker type.
Table 2: Antibody cycles with brands, catalog numbers, purpose, and excitation wavelengths.
The slide is incubated with the first cycle antibody solution overnight. The following day, the slide is washed four times with PBS and cover glass is applied with a 50/50 (v/v) glycerol and PBS solution. The slide is then imaged in the Nikon Ti2 microscope with the same exposure settings as the background step. The cover slip is removed, and the slide is bleached with the bleaching solution and exposed to UV light this time for 45 minutes. The slide is then washed four times with PBS before undergoing a background imaging step, this time without prior Hoechst staining. These steps repeat until all cycles have been completed.
Raw image files from the microscope are uploaded to MCMICRO, an open-source image processing pipeline that handles all image analysis steps from preprocessing to marker quantification [9]. The images are first corrected for illumination non-uniformity. Next, individual images from each cycle are stitched into whole slide images and subsequently registered to the first cycle. Then, UNMICST generates a probability map based on the first Hoechst stain to identify the probability of detected objects being a nucleus. The probability maps are used to segment the nuclei using S3SEGMENTER. The E-cadherin antibody (Cycle 1) is used to mark the cell membrane and identify the cytoplasm for creating masks. This way we can separately analyze intensity values for both nuclear and cytoplasmic compartments. MCMICRO then runs MCQUANT to generate .csv files of mean intensities for each antibody (markers described above).
The .csv files are then placed in a MATLAB script that extracts areas of the tissue to be studied (i.e. panCK+ areas) and excludes any cells whose nuclei are not represented through all cycles studied (nuclear Hoechst intensities below 1000 intensity units). The extracted data is then separated into cell type categories: tumor (panCK+/ alpha-SMA-); fibroblast (panCK-, alpha-SMA+); other. Using each cell’s coordinates, the distance between a tumor cell and the nearest fibroblast is measured, as well as fibroblast neighborhood densities surrounding each tumor cell (0-50um, 0-100um, 0-150um, 0-200um, 0-250um, 0-300um). 300um was chosen as the end limit as we are studying paracrine signaling. Correlation coefficients are then calculated for each spatial metric and are plotted on a scatter plot.
2211 tumor cells were measured, and 989 fibroblasts were identified. We examined seven different spatial metrics to see which one demonstrated the strongest positive association with each antibody. Correlation coefficients were calculated for each spatial metric-antibody pair, as well as corresponding scatter plots with trendlines. Taking pS6 as an example, we found that the mean cytoplasmic pS6 levels in tumor cells followed the highest positive correlation for the spatial metric of fibroblasts within 0-50 microns. The correlation coefficient was 0.33 with a p-value of 3.06E-58.
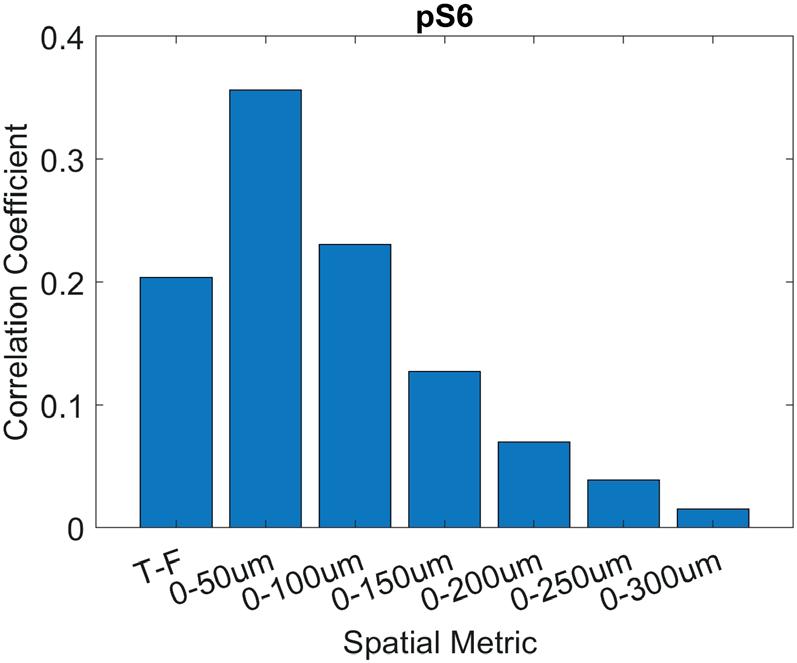
Figure 2: Correlation coefficients of pS6 tumor expression against various spatial metrics as an example. 0-50um was chosen as the optimal spatial metric since 3/7 proteins showed high correlation for that metric (data not shown).
Similarly, Ki67 intensity in tumor cells also followed a positive correlation coefficient with increasing number of fibroblasts within 0-50 microns. The correlation was 0.22 with a p-value of 1.20E-26.
An example image for each of these markers is also shown.

Figure 4: pS6 (top, magenta) and Ki67 (bottom, green) expression in HER2+ tissue slides. Nuclear stains (blue) showcase individual cells, with a-SMA (white) showcasing fibroblasts, and panCK (orange) showcasing tumor cells.
Additionally, a few proteins had lower correlation coefficients, with p-values less than 0.05. E-cadherin had a correlation coefficient of -0.0652 with a p-value of 0.00215. PCNA had a correlation coefficient of 0.182 with a p-value of 6.67E-18. pRB had a correlation coefficient of 0.0936 with a p-value of 1.05E-05. Furthermore, two proteins had correlation coefficients that had p-values above 0.05: BCL2 had a correlation coefficient of -9.64E-5 with a p-value of 0.996 and Beta-Catenin had a correlation coefficient of -0,024 with a p-value of 0.260. Lastly, BIM, pHER2, pAKT, FAP, MCL1, and BCL-XL failed to have signals above background in our samples.
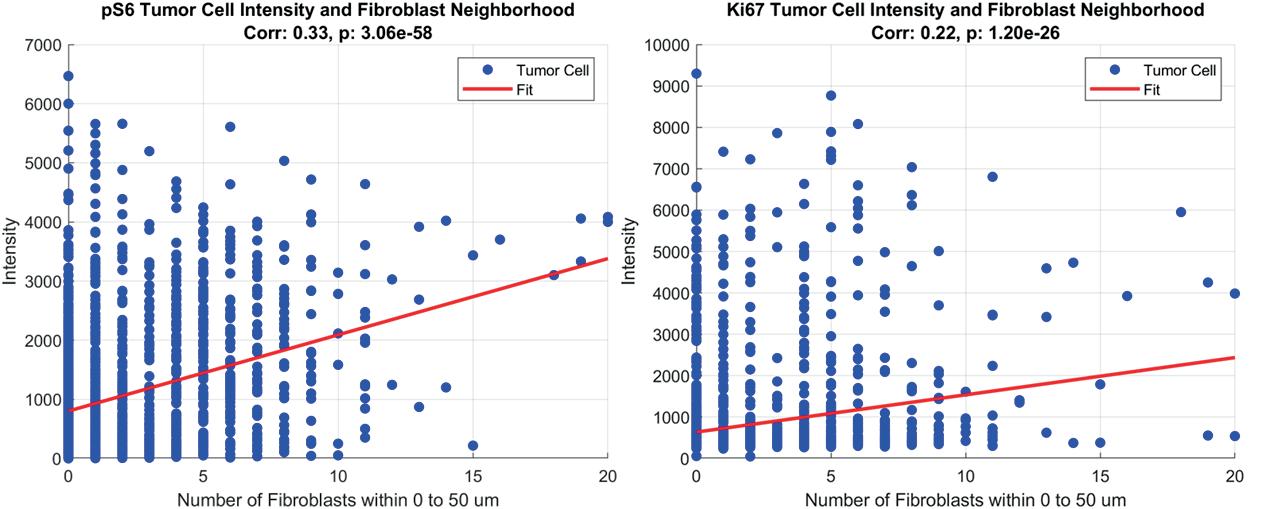
Figure 3: pS6 and Ki67 tumor expression showcased high, positive correlation coefficients with increasing fibroblast density (number of fibroblasts with 0-50um).

Proliferation indicator Ki67 increasing in intensity with increasing number of fibroblasts in the vicinity of cancer cells indicates sustained cancer cell proliferation despite treatment with the HER2-therapy lapatinib. This result suggests that another pathway is most likely being activated in the presence of fibroblasts under conditions of HER2 blockade to drive cancer cell growth. Compared to previous studies [7], our study addresses the knowledge gap of pro-survival factors activated in tumor cells located in fibroblast-rich areas. Specifically, we show that the pro-survival marker pS6 is increasing in mean intensity with increasing fibroblast numbers in the vicinity, as demonstrated by a significant positive correlation. This finding supports our hypothesis in that the presence of more fibroblasts promotes tumor cell survival under HER2 therapy. Thus, a combination therapy targeting this pro-survival pathway will be necessary to eliminate cancer cells in proximity with fibroblasts. Further staining for proteins upstream of pS6 can aid in identifying the mechanisms that are being triggered along the pathway. For example, this could lead to identification of chemokines released from the fibroblasts that bind to receptors on cancer cells to activate these upstream signaling mediators.
Observing xenografts enables in vivo measurements, which more accurately capture the complexity of the tumor microenvironment. By analyzing tumor-fibroblast neighborhoods with distinct phenotypic marker expressions, we can identify tumor cell subpopulations that may exhibit differential responses to anti-cancer treatments. Using a single sample has provided a baseline for post-treatment tissue phenotypes. To measure treatment response, we plan to stain an untreated model in the future and apply the same analysis to compare. Furthermore, analyzing multiple tissue sections will help us highlight significant differences in correlation coefficients across samples. These comparisons can inform the development of combination therapies that target specific pathways in the diverse cell populations within a tumor.
Funding was provided through the Swanson School of Engineering and the Office of the Provost. Thank you to the Tumor Microenvironment Engineering Laboratory for their endless support in this project.
[1] R. Siegel, et al., “Cancer statistics”, CA Cancer J Clin., 72, 1, 7-33, Jan 2022, doi: 10.3322/caac.21708.
[2] J. Baselga, et al., “Lapatinib with trastuzumab for HER2-positive early breast cancer (NeoALTTO): a randomised, open-label, multicentre, phase 3 trial”, The Lancet, 379, 9816, 633-640, Feb 2012, doi: 10.1016/ S0140-6736(11)61847-3.
[3] L. A. Carey, et al., “Molecular Heterogeneity and Response to Neoadjuvant Human Epidermal Growth Factor Receptor 2 Targeting in CALGB 40601, a Randomized Phase III Trial of Paclitaxel Plus Trastuzumab With or Without Lapatinib,” Journal of Clinal Oncology, 34, 6, 542-549, Nov 2015, doi: 10.1200/ JCO.2015.62.1268
[4] A. Robidoux, et al., “Lapatinib as a component of neoadjuvant therapy for HER2-positive operable breast cancer (NSABP protocol B-41): an open-label, randomised phase 3 trial,” Lancet Oncol., 14, 12, 11831192, Nov 2013, doi: 10.1016/S1470-2045(13)70411-X.
[5] A. Sonnenblick, et al., “Reactive stroma and trastuzumab resistance in HER2-positive early breast cancer,” Int J Cancer, 147, 1, 266-276, Jul 2020, doi: 10.1002/ijc.32859.
[6] I. Zervantonakis, et al. “Fibroblast–tumor cell signaling limits HER2 kinase therapy response via activation of MTOR and antiapoptotic pathways,” Proc Natl Acad Sci USA, 117, 28, 16500-16508, Jun 2020, doi: 10.1073/ pnas.2000648117.
[7] A. Marusyk, et al., “Spatial proximity to fibroblasts impacts molecular features and therapeutic sensitivity of breast cancer cells influencing clinical outcomes,” Cancer Research, 76, 22, 6495-6506, Sep 2016, doi: 10.1158/0008-5472-CAN-16-1457.
[8] J. Lin, et al., “Tissue Cyclic Immunofluorescence (t-CyCIF) version 3 V.2”, 2022. Accessed: January 3, 2025. [Online]. Available: https://www.protocols. io/view/tissue-cyclic-immunofluorescence-t-cycifversion-3-5qpvorbndv4o/v2
[9] D. Shapiro, et al., “MCMICRO: a scalable, modular image-processing pipeline for multiplexed tissue imaging,” Nature Methods, 19, 311-315, Nov 2021, 10.1038/s41592-021-01308-y.
Soham Mandal1, Matthew D. Poskus1, Ioannis Zervantonakis1,2
1Tumor Microenvironment Engineering Laboratory, Department of Bioengineering, University of Pittsburgh, Pittsburgh, PA, 2UPMC Hillman Cancer Center, Pittsburgh, PA
SOHAM MANDAL
Soham Mandal is a junior pursuing an undergraduate degree in Bioengineering at the University of Pittsburgh. He is currently on the Cellular Engineering track and aspires to pursue a medical career. In lab, he is studying the effects of paracrine and matrix mediated signaling between fibroblasts and breast cancer tumor cells in 2D and 3D microfluidics. He is also working on monocyte infiltration based on 3D collagen gels in ovarian cancer. Outside of the lab, Soham enjoys lifting, running, hiking, and traveling.
MATTHEW POSKUS
Matthew received his BS/MS degree in Mechanical Engineering from Rochester Institute of Technology (RIT) in 2019 where his research focused on the development of a numerical model of blood damage and membrane transport in microfluidic hemodialysis devices. He also worked at Ortho Clinical Diagnostics in Rochester, New York for two semesters and was a member of RIT’s Formula SAE team for five years, serving as the team’s Chief Engineer in his last year. Matthew is interested in using systems biology approaches and modeling to study drug resistance. Outside of the lab, he enjoys snowboarding, running, and working on cars.
IOANNIS ZERVANTONAKIS, PHD
Assistant Professor, Department of Bioengineering and Hillman Cancer Center. Ioannis (Yannis) grew up in Heraklion (Crete), Greece and attended the National Technical University of Athens to study mechanical engineering. He then moved to Munich, Germany and obtained a MS in Mechanical Engineering from the Technical University of Munich. Yannis received his PhD in the lab of Roger Kamm at MIT, where he engineered an array of microfluidic devices to study the tumor microenvironment. For his postdoctoral studies, Yannis joined the lab of Joan Brugge and developed systems biology approaches to study drug resistance and tumor-


Soham Mandal Matthew Poskus Ioannis Zervantonakis
fibroblast interactions. Yannis is a recipient of a 2014 Department of Defense Breast Cancer Postdoctoral Fellowship, a 2017 NCI Pathway to Independence K99/R00 award, a 2022 ACS RSG Scholar Award, a 2023 R35 NIGMS MIRA Award, a 2024 CMBE-BMES Rising Star Award and a 2024 NSF Career Award. Outside the lab, Yannis enjoys mixing music, kayaking, and playing basketball.
Understanding the signaling mechanisms in HER2+ breast cancer is critical to identifying therapeutic targets such as pathway or receptor activation. This work investigates paracrine and juxtracrine pathways influencing tumor progression and resistance, providing insights into potential targets for intervention. These findings can be used to improve medicine approaches and treatment strategies in HER2+ and other receptor-driven cancers.
Keywords: HER2+, Cancer, Signaling Mechanisms, Drug Resistance
HER2-positive (HER2+) breast cancer, characterized by the overexpression of the HER2 receptors, remains a clinical challenge due to therapy resistance and high recurrence rates. Stromal fibroblasts within the tumor microenvironment play a pivotal role in modulating therapeutic responses through paracrine and juxtracrine signaling mechanisms. This study investigates how fibroblast-mediated signaling influences drug resistance in HER2+ breast cancer cells treated with the HER2targeted chemotherapy drug, lapatinib, using both 2D and 3D culture systems. This was evaluated by using fibroblast conditioned medium (unidirectional signaling) and coculture and transwell assays (bidirectional signaling). Drug viability assays revealed that fibroblastderived juxtracrine signals promote survival of UACC812 and BT474 cancer cells when compared to monoculture conditions. Immunofluorescence staining of these cell lines showed higher levels of key survival and proliferation markers, including PCNA, pDDR1, pHER2, and pERK when cells exposed to conditioned medium. Notably, despite similar fractional viability, transwell coculture conditions exhibited lower marker expression of such markers, suggesting alternate pathways may mediate drug resistances in this setting. Using 3D collagen hydrogels,

conditioned medium conferred significant protective effects, reinforcing the role of fibroblast-derived factors in promoting tumor survival. These findings underscore the complexity of fibroblast-tumor cell communication and highlight the need to target both unidirectional and bidirectional signaling to improve therapeutic outcomes. Future studies will focus on further elucidating these signaling pathways and optimizing experimental conditions to better model the tumor microenvironment.
Breast cancer is the most diagnosed and second deadliest form of cancer in women and will account for an estimated 42,000 deaths in 2024 [1]. HER2-positive (HER2+) breast cancer is a subtype of breast cancer characterized by the overexpression of human epidermal growth factor receptor 2 (HER2) protein. Patients with advanced HER2+ breast cancer have a 30-50% chance of disease recurrence, which indicates a need to discover new therapeutic strategies [1]. The tumor microenvironment (TME), in which stromal fibroblasts are most abundant, plays a critical role in the progression, metastasis, and therapy response of breast cancer [2]. Previous studies show that fibroblasts communicate through paracrine signaling and reduce the sensitivity of HER2+ breast tumor cells to the HER2-targeted therapy lapatinib through protective signaling [3,4]. Complex and dynamic communication between tumor cells and fibroblasts primarily occurs through paracrine (signal molecule driven) or juxtacrine (contact dependent) signaling mechanisms. To further dissect these mechanisms and understand how they play a role between tumor cells and fibroblasts, we measured the drug response of tumor cells cultured with fibroblasts or fibroblast-conditioned medium in a 2D and 3D system and performed endpoint staining to probe pathways altered by these factors. We compared the effects of unidirectional (conditioned medium) and bidirectional (transwell) paracrine signaling between tumor cells and fibroblasts in a 2D system. A more comprehensive understanding of the communication between stromal fibroblasts and tumor cells in the tumor microenvironment could open new insights and strategies to overcome fibroblast-mediated therapy resistance.
Fibroblasts play a critical and protective role in the tumor microenvironment (TME), influencing cancer cell behavior through complex signaling mechanisms. To explore these interactions, an experimental approach was developed, integrating 2D and 3D drug response assays to evaluate the effects of lapatinib, a dual EGFR (epidermal growth factor receptor) and HER2 inhibitor, on HER2+ breast cancer cell lines. A 2D drug response assay was designed to distinguish between paracrine and juxtacrine signaling in the TME.
HER2+ breast cancer cell lines (UACC812 and BT474) were cultured in RPMI supplemented with 10% heat inactivated fetal bovine serum (HIFBS). AR22 mammary fibroblasts were maintained in DMEM with 10% FBS and 1% Pen/ Strep under 5% CO 2 at 37°C. To facilitate viability assays, UACC812 and BT474 cells were genetically modified to express H2B-GFP and mCherry, respectively. Conditioned medium was prepared by culturing AR22 fibroblasts in DMEM for five days, followed by a transition to RPMI for an additional four days. The conditioned RPMI medium was then harvested, filtered, and diluted (1:3) in RPMI for subsequent experiments.
For the 2D drug response assays, cancer cells were seeded at a density of 12,000 cells/well in either RPMI or conditioned medium in 24-well plates. With monoculture being the control, coculture setups included fibroblasts seeded either directly with tumor cells or in a transwell compartment (0.4 µM) at the same density. After a 48-hour incubation, lapatinib treatments (0–1.0 µM) were performed. To investigate these interactions in a 3D context, a complementary drug response assay was developed using collagen type I (2 mg/mL) as the extracellular matrix. Cancer cells were embedded in 3 µL collagen droplets (40×10⁶ cells/mL) and plated in 96-well plates containing either RPMI or conditioned medium. In coculture experiments, fibroblasts were incorporated into the collagen matrix alongside tumor cells. After 48 hours of incubation allowing for cells to attach and grow to a baseline for both assays, lapatinib treatments (0–3.0 µM) were administered to assess drug efficacy in the 3D environment.
Immunofluorescence staining:
Cells were fixed using paraformaldehyde (PFA) was prepared and dispensed into each well, followed by a 15-minute incubation at room temperature in the dark. The PFA was then removed, and wells were washed three times with phosphate-buffered saline (PBS) and blocked with blocking buffer solution to prepare the samples for imaging. Staining was conducted to visualize and quantify cellular markers— PCNA (proliferation), pDDR1 (collagen signaling), pHER2 (lapatinib target), and pERK (proliferation/survival pathway)— critical for evaluating drug efficacy, cell proliferation and survival. Primary and secondary antibodies were diluted in blocking buffer at concentrations of 1:100 or 1:250, depending on the antibody specificity and experimental requirements. Plates were incubated at 4°C overnight. Immunofluorescence images were taken using a Nikon Ti2-E Widefield Fluorescence Microscope (BMC) at 10x. Analysis was performed using CellProfiler and GraphPad Prism was used for statistical analysis. This dual-platform experimental approach enables a detailed evaluation of fibroblast-mediated protective mechanisms in the TME, offering insights into how stromal components influence therapeutic outcomes.
To evaluate the effects of fibroblast signaling on tumor cell behavior, UACC812 and BT474 tumor cells were cultured and treated under varying conditions—monoculture, conditioned media, coculture, and transwell—in 2D experiments. These cell lines were selected due to distinct morphological changes such as reduced area and atrophied protrusions observed in similar lapatinib assays previously completed in the Zervantonakis laboratory. Fractional viability, measured as the ratio of live to total cells, was used to assess differences in drug response. When treated with lapatinib, UACC812 cells exhibited greater fractional viability in transwell and coculture conditions compared to monoculture, suggesting enhanced survival ( Fig. 1A). Statistical analysis using a one-way ANOVA followed by Tukey’s post hoc test revealed significant differences, with p-values of 0.00402 and 0.00199 for cells treated with 0.1 µM and 1.0 µM lapatinib, respectively. For BT474 cells, similar drug response curves were observed in coculture and transwell conditions at 0.1 µM lapatinib, though both conditions resulted in complete cell death at 1.0 µM ( Fig. 1A). Consequent biological replicates showed expected drug response curves for both cell lines ( Fig. 1A). In the second biological replicate, both UACC812 and BT474 cells exhibited the highest viability under coculture conditions at the highest drug concentration, with conditioned medium and transwell setups also demonstrating greater viability compared to monoculture (Fig 1A).
Immunofluorescence staining for key markers—PCNA (proliferation), pDDR1 (collagen signaling), pHER2 (lapatinib target), and pERK (proliferation/survival pathway)—was conducted on UACC812 cells to further investigate the signaling effects ( Fig. 1B). Mean fluorescence intensity analysis showed a significant decrease in all markers under lapatinib treatment compared to untreated controls. However, conditioned media conditions consistently exhibited higher marker levels than transwell conditions for all targets ( Fig. 1B), suggesting that fibroblast-secreted factors play a role in maintaining proliferation and survival signaling despite lapatinib treatment. To extend these findings into a 3D context, UACC812 cells were cultured in rat tail collagen type I droplets under monoculture, conditioned media, and coculture conditions. Viable tumor cell area was measured, revealing growth inhibition in all conditions following lapatinib treatment and treated conditioned medium and coculture revealing higher total viable cell area ( Fig. 1C). These results highlight the impact of fibroblast-mediated signaling on tumor cell survival and response to therapy in both 2D and 3D environments.
T he results reveal distinct survival mechanisms of tumor cells under varying fibroblast-mediated signaling conditions. For UACC812 and BT474 cells, fractional viability was notably higher in transwell and coculture
conditions compared to monoculture when treated with lapatinib, suggesting that fibroblasts confer a protective effect through both paracrine and juxtacrine signaling. This protective influence likely stems from the secretion of growth factors or cytokines that mitigate the drug’s effects on tumor cells. Similarly, fibroblast-conditioned medium demonstrated higher fractional viability than monoculture, suggesting that fibroblast-secreted factors within the medium may confer protective effects on the cancer cells. Immunofluorescence staining further supported these observations, showing higher levels of PCNA, pDDR1, pHER2, and pERK in conditioned media compared to transwell conditions. This finding underscores the potency of paracrine signaling in conditioned media, where fibroblast-secreted factors directly influence tumor cell behavior, compared to the physical separation in transwell setups that limits contact-initiated factor diffusion. However, further staining and testing of consequent biological replicates could show different results. Further investigation of coculture conditions could reveal higher levels of these biomarkers due to juxtracrine signaling [6]. The introduction of a 3D collagen matrix provided additional insight into the tumor microenvironment’s role in modulating drug response. Unlike 2D cultures, the 3D system better mimics the structural and mechanical complexities of in vivo tumors, including extracellular matrix stiffness and spatial constraints. In 3D assays, UACC812 cells displayed marked growth inhibition when treated with lapatinib, reflecting the combined effects of drug penetration, matrix-induced signaling changes, and altered cell-cell interactions. This enhanced inhibition in 3D conditions suggests that the matrix environment might influence tumor cell sensitivity to therapy, potentially through mechanical cues that affect proliferation and survival pathways [6]. These findings highlight the physiological relevance of 3D systems in cancer research and underscore their importance in studying therapeutic responses in the context of the tumor microenvironment. Future optimization of the 3D assay could provide a more nuanced understanding of how varying drug concentrations influence tumor cell behavior within the collagen matrix. Such refinements may reveal concentration-dependent drug responses distinct from those observed in 2D assays, highlighting the interplay between drug efficacy and the structural and biochemical complexities of the 3D tumor microenvironment. This could pave the way for identifying threshold concentrations that maximize therapeutic effects while accounting for the influence of extracellular matrix interactions and fibroblast-mediated signaling.
This study underscores the significant impact of fibroblast-mediated signaling on tumor cell survival and therapeutic response in both 2D and 3D systems. The findings reveal that fibroblasts confer a protective effect against lapatinib treatment through both paracrine and juxtacrine mechanisms, as evidenced by higher
Figure 1: (A) Drug response of UACC812 and BT474 cancer cells in monoculture, conditioned media, coculture, and transwell conditions treated with lapatinib (0-1.0 um). (B) Individual cell mean intensity values separated by marker comparing untreated/ treated conditions with lapatinib (monoculture, conditioned media, coculture, transwell), stars indicate significant differences between conditions. (C) Viable UACC812 tumor cell area (live cells in 3D collagen drug response assay separated by untreated/ treated conditions with lapatinib. Mono = monoculture; CM = conditioned media; Co = coculture; Trans = transwell


fractional viability in coculture, conditioned medium, and transwell conditions compared to monoculture. Immunofluorescence staining further validated these observations, with conditioned media showing elevated levels of proliferation and survival markers compared to transwell conditions, highlighting the importance of fibroblast-secreted factors in maintaining tumor cell viability. The 3D collagen matrix experiments provided additional physiological relevance, demonstrating that the extracellular matrix environment significantly influences drug response. Marked growth inhibition in 3D systems under lapatinib treatment emphasizes the importance of incorporating matrix-induced mechanical and biochemical interactions in cancer research. These findings highlight the necessity of studying drug responses in both 2D and 3D contexts to capture the complexity of tumor microenvironment interactions. Future work should focus on refining experimental conditions, including optimizing 3D assay parameters and exploring the specific contributions of paracrine and juxtacrine signaling pathways. These efforts could lead to the identification of novel therapeutic targets that disrupt fibroblast-tumor interactions, ultimately improving the efficacy of targeted therapies in HER2+ breast cancer.
Funding was provided by the Swanson School of Engineering and the Office of the Provost at the University of Pittsburgh. I would also like to thank Matthew Poskus and Dr. Zervantonakis for the continued guidance and mentorship throughout this project.
[1] American Cancer Society. Breast Cancer HER2 Status. American Cancer Society.
[2] Hu D, Li Z, Zheng B, et al. Cancer-associated fibroblasts in breast cancer: Challenges and opportunities. Cancer Commun (Lond). 2022;42(5):401-434. doi:10.1002/cac2.12291
[3] Marusyk A, Tabassum DP, Janiszewska M, et al. Spatial Proximity to Fibroblasts Impacts Molecular Features and Therapeutic Sensitivity of Breast Cancer Cells Influencing Clinical Outcomes. Cancer Res. 2016;76(22):6495-6506. doi: 10.1158/0008-5472.CAN16-1457
[4] Zervantonakis IK, Poskus MD, Scott AL, et al. Fibroblast-tumor cell signaling limits HER2 kinase therapy response via activation of MTOR and antiapoptotic pathways. Proc Natl Acad Sci U S A. 2020;117(28):16500-16508. doi:10.1073/ pnas.2000648117
[5] Kalli M, Poskus MD, Stylianopoulos T, Zervantonakis IK. Beyond matrix stiffness: targeting forceinduced cancer drug resistance. Trends Cancer. 2023;9(11):937-954. doi:10.1016/j.trecan.2023.07.006
[6] Chimento A, D’Amico M, Pezzi V, De Amicis F. Notch Signaling in Breast Tumor Microenvironment as Mediator of Drug Resistance. Int J Mol Sci. 2022;23(11):6296. Published 2022 Jun 4. doi:10.3390/ ijms23116296
Paul McPartland1, Yonghee Kim2
1Department of Mechanical Engineering and Materials Science, University of Pittsburgh, Pittsburgh, PA, 2Department of Nuclear and Quantum Engineering, Korea Advanced Institute of Science and Technology, Daejeon, Republic of Korea
PAUL MCPARTLAND
Paul McPartland is a senior Mechanical Engineering student at the University of Pittsburgh. His primary interests are nuclear energy, specifically nuclear thermal systems.
YONGHEE KIM, PHD
Dr. Yonghee Kim is currently a professor at Korea Advanced Institute of Science and Technology (KAIST) in Korea. He received his MSc and PhD in Nuclear Engineering from KAIST in 1990 and 1995, respectively. His research interests include advanced reactor concepts and development of nuclear reactor analysis methods. He has extensive research and management experiences in the area of advanced reactors and reactor physics. From 2013 to 2018 and from 2020 to 2022, he served as a member of the advisory committee for NSSC (National Safety and Security Commission) of Korea. He is an Associate Editor of Progress in Nuclear Engineering. He is director of a research center for autonomous SMR (CASMRR) at KAIST. From 2017 to 2020, he served as the chair of the Reactor Physics Division of KNS.


The buildup of neutron poisons, such as Xenon-135, are a significant hurdle in the development of functional Nuclear Thermal Rocket. This paper explores the possibility of using a thermophoretic force to expunge the neutron poisons form the nuclear fuel, as well as modeling the buildup of neutron poisons over time.
Keywords: Nuclear Thermal Rocket, Thermophoresis, Neutron Poison, Nuclear Reactor
This study modeled the production and spread of neutron poisons, such as Xenon-135, throughout the fuel of a High Assay Low Enriched Uranium (HALEU) Nuclear Thermal Rocket (NTR). Neutron poisons are a danger to the effective use of NTRs for long term space flight, as they can reduce the reactivity of the reactor to a point where it is unable to start, until the poison decays or is removed. The study investigated the potential use of a thermophoretic force to remove the neutron poisons from the fuel. The computational approach determined that the thermophoretic force was not strong enough to make a worthwhile effect on the concentrations of the neutron poisons in the fuel, but was able to make an effective model for the buildup of poison throughout the fuel cell.
From Mount Everest to the Moon, humanity has always strived to travel further into the untouched reaches of the universe. The challenge itself is what drives us to explore, and now, as humanity turns its eyes to new challenges, to Mars and even further beyond, we must explore new ways of traveling to those locations. Currently, all space travel is done with chemical rockets, which combine hydrogen and oxygen for their fuel, which is ignited, and ejected through a nozzle to produce thrust. This works for now, but traveling to more distant locations will require more efficient rockets. One such solution is the use of Nuclear Thermal Rockets (NTRs), which use an onboard nuclear reactor to heat hydrogen propellant to significantly higher temperatures than possible using chemical rockets. This means NTRs can be multiple times more efficient than the best chemical rockets. Almost all of the research done on NTRs was done by the US and the USSR during the cold war, and these countries did their research using highly enriched, or weapons grade, uranium. This restricts the use of NTRs to nuclear weapons capable governments, and prevents non-nuclear weapons states, as well as companies, from building these rockets. This research is based off of a thesis done by Paolo Venneri [1], which studied the potentiality of a Low Enriched Uranium Nuclear Thermal Propulsion rocket, which is more accessible to countries without nuclear weapons, as well as regular companies. For sustained power generation to occur without causing a runaway reaction, the number of neutrons that are allowed to produce fissions must be moderated. This is mainly done through control rods, which can be raised or lowered in the fuel to increase or decrease the amount of neutron absorption. When a uranium atom is split during nuclear fission, many different byproducts are formed. Some of these byproducts are referred to as ‘neutron poisons’. These neutron poisons are isotopes that have extremely high neutron cross sections, meaning they will absorb a significant portion of the neutrons throughout the reactor. The most important poison in this case is Xenon-135, and its parent isotope, Iodine-135. If the concentration of these poisons is allowed to get too high, it could absorb enough of the neutrons that the reactor with every control rod removed

from the fuel would still not be able to operate. These isotopes decay over time, but this process is slow. This research studies the buildup and removal of such neutron poisons from the liquid uranium fuel of a Low Enriched Uranium Nuclear Thermal Rocket. This paper specifically investigates the use of a thermophoretic force to remove the neutron poisons from the fuel. A thermophoretic force is the phenomenon that occurs when a fluid of different sized particles is placed in a temperature gradient. The smaller particles, on average, will travel towards the area with the lowest temperature, while the largest particles will migrate towards the high temperature area. In the rocket reactor, the liquid uranium fuel is much heavier than the neutron poisons, so the poisons will drift towards the top. The top of the fuel will have a gas plenum, to allow the poison to diffuse away from the fuel, where it will not affect the neutron fission economy.
The system representing the fuel rod was modeled using MATLAB, with the Neutron Diffusion Equation being the governing equations for the system. The rate of change of the concentration of Xenon at a given time is determined by Equation 1:
Equation 1:
where the variables in the equation are shown in Table 1:
Table 1: Equation 1 Variables
Variable Definition


Diffusion Coefficient of Xenon-135
Concentration of Xenon-135
Source Production Rate of Xenon-135
Thermophoretic Velocity of Xenon-135
Effective Xenon-135 Decay Constant
Iodine-135 Decay Constant
Concentration of Iodine
The concentration of Iodine-135 (cI ) is derived from the equation for the rate of change of the concentration of Iodine over time, a similar Neutron diffusion Equation 2 :
Equation 2:

where the variables in the equation are shown in Table 2 The concentrations were solved in boundary conditions shown in Table 3 The neutron flux used to calculate the effective decay constant of the Xenon was derived from separately calculated power levels throughout the fuel rod,
as shown in Figure 1, where the maximum power level is near the top of the fuel rod.
Table 2: Equation 2 Variables
Variable Definition


Diffusion Constant of Iodine-135
Concentration of Xenon-135
Source Production Rate of Iodine-135
Thermophoretic Velocity of Iodine-135
Concentration of Iodine-135
Decay Constant of Iodine-135
Table 3: Boundary Conditions
Value
Initial Xenon Concentration
Initial Iodine Concentration
Gas Plenum Xenon Concentration
Gas Plenum Iodine Concentration
Condition


The model also used this power level input to solve for the temperature throughout the fuel, to determine the thermophoretic force.
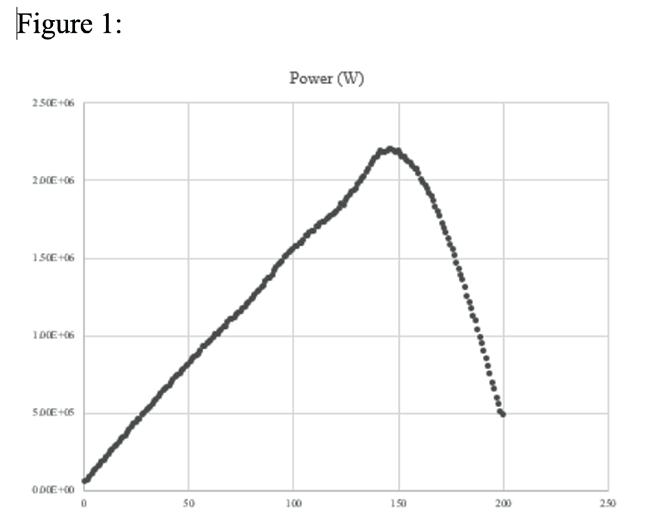
Figure 1: Power levels throughout the fuel rod.
The thermophoretic velocity was calculated using the thermophoretic force equation taken from COMSOL Multiphysics software [2], and setting it equal to the drag force on the particle (it was assumed that the particle reaches its maximum velocity instantaneously). The resulting equation is shown below Equation 3:
Equation 3:

The variables used in this equation are shown below in Table 4. The bounding temperature for the coolant was 300 K at the top of the fuel rod, and 2700 K at the bottom.

Table 4: Equation 3 Variables


Definition


Thermophoretic Velocity
Fuel Viscosity
Thermophoretic Constant
Thermal Conductivity Ratio
Temperature Gradient
Fuel Density
Temperature
The model simulated the reactor after one hour of burn and calculated the buildup of neutron poison at the end of that time. The calculated centerline temperature and resulting temperature gradients are shown in Figure 2 , with a maximum temperature in the fuel of 3755 K, located 0.27 meters from the top of the rod. The Thermophoretic velocities are shown in Figure 3, showing velocities on the order of 10 -6 m –s This is significantly lower than what would be required to significantly move the poison. The resulting concentrations of Iodine-135 and Xenon-135 down the centerline of the fuel rods are shown in Figure 4. The Xenon concentration is over 1015 for the entire fuel rod and the shape of the graph indicates that the thermophoretic force is not strong enough to affect the concentration of the neutron poisons.
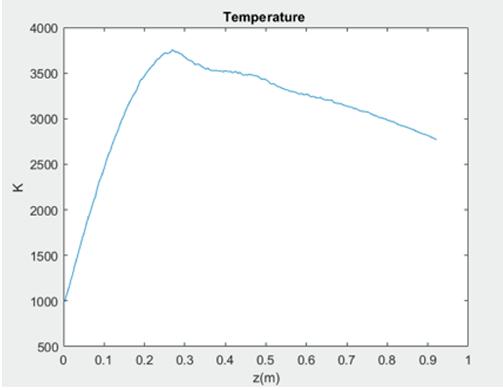
The goal of this project was to produce a model that effectively showed the concentration buildup of Xenon-135 and Iodine-135, as well as the effects of the thermophoretic force on those concentrations. This model showed that the thermophoretic force was not sufficient to remove the neutron poison from the fuel, and other methods need to be taken into account. The Thermophoretic velocities would need to be significantly higher to remove the poisons from the fuel on their own, which is not possible without boiling the fuel. Further research should be done on other methods for the removal of neutron poisons from the fuel rods. One potential solution could be like what has been studied by Chen et al. in their research on Molten Salt Reactors (MSR) . Chen et al. bubbled helium through the molten salt, and the Xenon escapes from the salt into the bubbles, which can be later removed from the fuel. This solution significantly complicates the neutronics of the system, since the void
coefficient may have a positive effect on the reactivity of the reactor [3]. If such a system is properly implemented, it would likely be able to solve the issue of neutron poison buildup in the reactor.
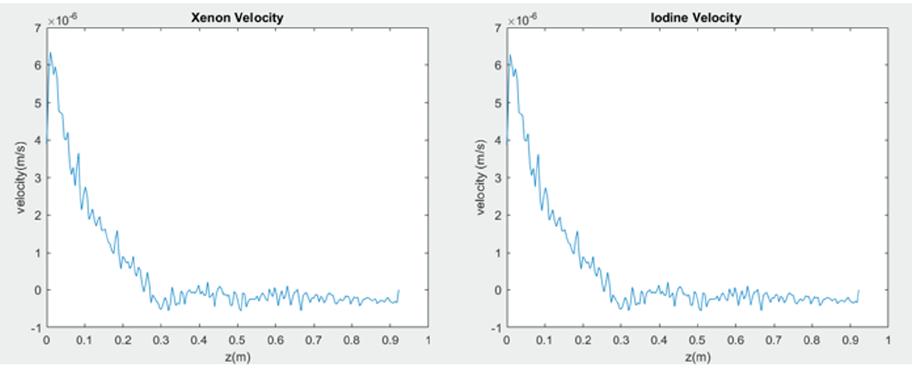
Figure 3: Thermophoretic velocities.
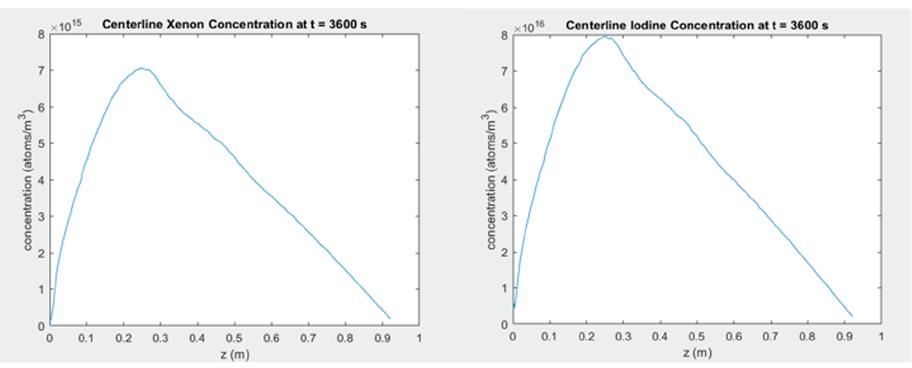
Figure 4: Concentrations of Iodine-135 and Xenon-135 down the centerline of the fuel rods.
The model found that the Thermophoretic force alone was not strong enough to remove neutron poisons such as Xenon-135 from the fuel rod of a Nuclear Thermal Rocket, but it was able to successfully measure the buildup of such poisons over a one hour burn. The implementation of helium bubbles through the fuel to remove the poisons is a potential solution to this roadblock, but that introduces problems of its own. This result, while not finding a specific solution to our problem, brings us one step closer to becoming an interplanetary civilization.
Funding was provided by the Swanson School of Engineering and the Office of the Provost, as well as the Korea Advanced Institute of Science and Technology Reactor Physics and Permutation Lab. Special thanks to Dr. Yonghee Kim for his mentorship and guidance. Thanks to Alnuaimi Reem Rashed Abdulrahman Alsharhan for her assistance throughout this project.
[1] Venneri. (2013). Implementation of LEU Fuels in NERVA Type Nuclear Thermal Rockets.
[2] https://doc.comsol.com/6.0/doc/com.comsol.help. particle/particle_ug_fluid_flow.08.49.html
[3] Chen et al. Annals of Nuclear Energy 207, 2024.
Principles of Nuclear Rocket Propulsion SECOND EDITION William J. Emrich, Jr.

Sofia Milone1, Rui Liang1,2
1Department of Bioengineering, University of Pittsburgh, Pittsburgh, PA, 2Department of Anesthesiology, Ohio State University, Columbus, OH
SOFIA MILONE
Sofia Milone is a senior Bioengineering student at the University of Pittsburgh. She plans to pursue a PhD after graduation, focusing on advancing women’s health through bioengineering research.
RUI LIANG
Rui Liang is an Assistant Professor in the Department of Anesthesiology at The Ohio State University Wexner Medical Center. Her research interest is to investigate the negative impact of diabetes on women’s health, focusing on the innate immune response to wounds and implants.

Milone Rui Liang
Polypropylene meshes have been widely used to augment repair of pelvic floor dysfunction including pelvic organ prolapse and stress urinary incontinence, but adverse event rates are unacceptably high, particularly in diabetic patients. Our findings elucidate mechanisms behind these increased risks, offering potential therapeutic targets to improve outcomes.
Keywords: Diabetes mellitus, pelvic floor dysfunction, polypropylene mesh, vessel remodeling
Abbreviations: Diabetes mellitus (DM), pelvic floor dysfunction (PFD), ovariectomy (OVX), vessel wall thickness to lumen ratio (T/Lr), subepithelium and muscularis (subE/M)
Pelvic floor dysfunction (PFD) is a common condition in aging women, with diabetes mellitus (DM) affecting ~14% of this population. Women with DM undergoing urogynecologic surgeries face ~five-fold greater complication rates and there remains a strong need to elucidate the underlying mechanisms to improve surgical outcomes. DM impacts vessel remodeling in a sitespecific manner. However, its impact on the vaginal wall, a primary organ receiving PFD repairs, is unclear. We aimed to investigate the independent and combined impacts of DM, postmenopausal status, and urogynecologic surgeries with/without polypropylene mesh implantation on vaginal vessel remodeling. Diabetic and menopausal rat models were induced using streptozotocin and bilaterial ovariectomy (OVX), respectively. Rats received no surgery (control) or underwent supra-cervical hysterectomy with or without mesh implantation. At 42 days post-surgery, vascular density, vessel wall thicknesses, and the ratio of wall thickness to lumen radius (T/Lr) were quantified. Vessel types (lymph vessel, capillary, vein, or artery) were quantified using a customized MATLAB-based random forest classification algorithm. Vaginal tissue exhibited a ~two- to three-fold increase in vascular density with diabetes alone, OVX alone, and diabetes with OVX. Despite increased vascularity, vessel quality was compromised with vessel wall thinning, smooth muscle irregularity, and potential fibrosis under diabetic and OVX conditions. We report abnormal vessel remodeling as a potential mechanism contributing to elevated risks of surgical complications in women with DM, which may inform design of therapies.
Pelvic floor dysfunction (PFD) is prevalent in aging women, with an estimated 25% lifetime risk of developing a PFD that requires medical management [1]. Two commonly reported PFDs, pelvic organ prolapse (POP) and stress urinary incontinence (SUI), significantly impact women’s quality of life. Weakening or damage to pelvic floor muscles and connective tissues contributes to both POP and SUI, leading to the descent and protrusion of female pelvic organs or urine leakage during everyday actions that increase intra-abdominal pressure [1, 2]. The prevalence of female PFDs rises significantly with age, increasing from 6% in patients aged 20-29 years to 32% in those aged 50-59 years, and reaching 53% in patients aged 80 and older [3].
Mild and moderate PFDs have been successfully managed in some cases with conservative treatments, including pelvic floor muscle training and mechanical interventions such as pessaries [4, 5]. However, about one-third of the cases undergo surgical repairs to achieve successful long-term outcomes. Native tissue repair is associated with high recurrence rates due to the inherent weakness of tissues affected by pelvic floor disorders. As a result, polypropylene meshes, which mechanically augment
tissue, have been used in surgeries to yield more durable effects [5]. However, mesh repairs are associated with high rates of postoperative adverse events (up to ~40%), including chronic abdominopelvic pain and mesh exposure through vaginal tissue [5, 6]. Patients with diabetes mellitus (DM) experience these complications at higher rates [7].
The increased risk of mesh-related complications in patients with DM is of particular importance given the demographics of PFD patients, who are often older and have comorbid conditions such as DM, the prevalence of which rises to approximately 19% in patients aged >=65-99 years [8]. DM affects tissue vascularization and vessel remodeling in a site-specific manner. In the retina and kidney, DM promotes aberrant growth of structurally abnormal vessels, while in skin and bone, it decreases angiogenesis [9, 10, 11]. There is limited data on its impact on vessel remodeling in the vaginal wall, particularly following urogynecologic surgeries, including PFD repairs. Effective remodeling of the vascular network is essential for successful implant-host tissue integration and wound healing following mesh implantation. Therefore, DM may increase risk of implant-related complications following mesh-augmented PFD repair by disrupting vessel remodeling in the vagina.
In addition, menopause, another common factor in PFD demographics, typically begins between the ages of 45 and 55. Menopause is associated with a substantial decline in estradiol, a form of estrogen known for its role in promoting endothelial proliferation, migration, and regeneration [12]. Limited data exists on the independent effects of menopause on vessel remodeling in vaginal tissues or the interplay between menopause and DM in this context. However, menopause and its interaction with DM may influence vaginal vessel remodeling, potentially impacting polypropylene mesh integration and surgical recovery.
In this study, we investigate the independent and combined impacts of DM, postmenopausal status, and urogynecologic surgeries with and without polypropylene mesh implantation on vessel remodeling in the vagina to elucidate the mechanisms underlying mesh-related complications and highlight potential therapeutic targets.
2.1
Female Wistar rats (8-9 months) were used to establish three primary experimental models: a DM model, a menopausal model, and a urogynecologic surgery model with mesh implantation via simulated sacrocolpopexy. To examine the interplay between each condition, subsets of rats were subjected to one, two, or all three conditions. Control groups without corresponding interferences were included (n ≥4 per subgroup).
DM models were induced by administering a single dose of streptozotocin followed by a two-week period to allow
stabilization of hyperglycemia. Postmenopausal status was modeled by performing bilateral ovariectomy (OVX) to decrease estrogen levels and mimic the hormonal state of menopause. Rats receiving urogynecologic surgery underwent supra-cervical hysterectomy with or without transvaginal polypropylene mesh implantation.
2.2
Vaginal tissue was collected 42 days after model induction. Masson’s Trichrome staining and immunofluorescence labeling of alpha-smooth muscle actin, which is specific to smooth muscle cells, were performed in tissue cryosections of the proximal vagina (7μm). QuPath was used to measure three key vascular parameters: vascular density, vessel wall thickness ( μm), and ratio of wall thickness to lumen radius (T/Lr). Vascular density was calculated as the ratio of total vessel area to total tissue area, representing the percentage of tissue area occupied by vessels. To obtain approximate vessel wall thickness measurements, vessels with transverse cross-sections were modeled as uniform cylinders. The inner and outer perimeters of each vessel were measured and considered as circumferences, from which inner and outer radii were calculated. The difference between these radii represented the vessel wall thickness. T/Lr was obtained by dividing each vessel’s approximate wall thickness by its calculated inner radius, which represents the lumen radius. These parameters were quantified in the subepithelium and muscularis tissue layers (subE/M). In the adventitia, vascular density was analyzed in meshimpacted regions (350μm radially from each mesh fiber) and the morphology of artery-associated smooth muscle was visually evaluated. Vascular density and T/Lr differences between experimental groups in the subE/M and mesh-impacted regions were analyzed using MannWhitney and Kruskal-Wallis tests (p<0.05).
To investigate vessel type-specific impacts, the relative quantities of lymph vessels, capillaries, veins, and arteries were analyzed using a customized MATLAB-based random forest classification algorithm. The algorithm was trained using ~50 pre-classified measurements of wall thickness, lumen radius, and T/Lr from each vessel type in control groups (including hysterectomy-only samples) and underwent multiple training and testing cycles to optimize performance. Classification accuracy on out-of-bag training data was ~90.5%. The AUC for artery classification was ~0.9-0.97, while the AUC for other vessel types was ≤0.6. While this indicates challenges in distinguishing the remaining vessel types, the model is highly sensitive to changes in artery quantity. Based on the algorithm output, the relative proportion of each vessel type in each sample was calculated as a percentage of the total vessel count. Artery proportions were compared to both the individual and pooled proportions of the other vessel types using Mann-Whitney and Kruskal-Wallis tests (p < 0.05).

Under normoglycemic conditions without OVX, supracervical hysterectomy and polypropylene mesh implantation did not significantly affect vascular density, vessel T/Lr, or vessel type quantity ratios in the subE/M compared to no-surgery controls (p=0.5475, p=0.7853, p=0.8022). Therefore, results from different surgery groups under shared diabetic/OVX conditions can be pooled to examine the independent and combined effects of OVX and DM on baseline vessel remodeling in the subE/M.
With OVX, vascular densities in the subE/M in all surgery groups were increased ~three-fold when compared to groups without OVX (p=0.0014). Vessel type quantity ratios were not significantly different between groups (p=0.5937). Yet, overall subE/M vessel T/Lr was decreased in samples with OVX (p< 0.0001, Figure 1). Similar findings were observed in mesh-impacted areas and the adventitia. The vascular density was increased (~threefold, p=0.0159) with decreased artery T/Lr (p=0.0034) in samples with vs. without OVX (Figure 2)
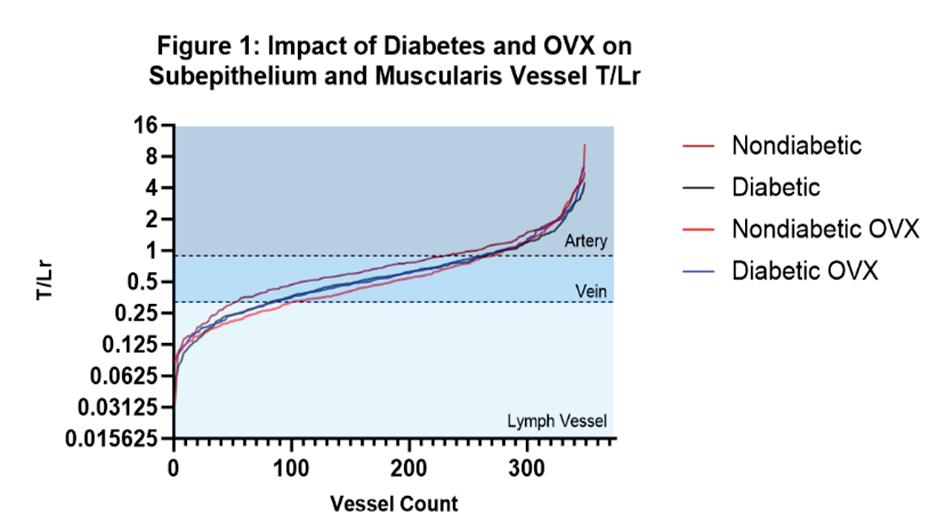

Without OVX, vascular density in the subE/M and in mesh-impacted areas was increased ~two-fold under hyperglycemic conditions compared to normoglycemic conditions (p=0.0006, p=0.0317). The random forest classification algorithm revealed no significant differences in vessel type quantity ratios (p=0.6918). However, overall subE/M vessel T/Lr was decreased in hyperglycemic vs. normoglycemic non-OVX samples (p=0.0005, Figure 1). Notably, artery T/Lr in the adventitia was particularly affected, showing a substantial decrease under hyperglycemic conditions (p=0.0002, Figure 2). Additionally, irregularities in the arterial walls were observed. The characteristic uniform circular arrangement of smooth muscle cells appeared disrupted, displaying irregular alignment and varying orientations. Regions indicative of fibrosis were also interspersed (Figure 3G).
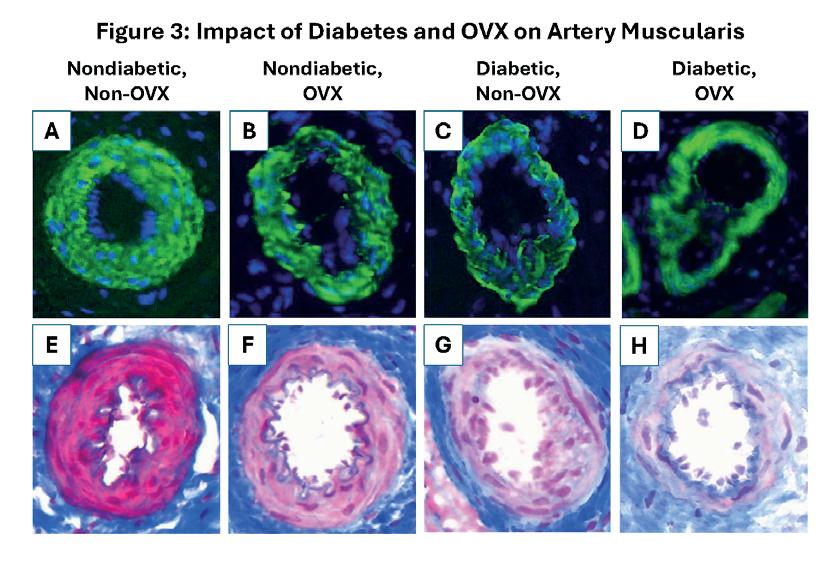
using smooth muscle actin immunofluorescence (A-D) and Masson’s Trichrome (E-H).
Under hyperglycemic conditions, OVX had no effect on subE/M vascular density, mesh-impacted area vascular density, or subE/M vessel T/Lr (p=0.4363, p=0.5476, p>0.9999, Figure 1). Interestingly, OVX otherwise demonstrated significantly decreased artery T/Lr in the adventitia (p=0.0345, Figure 2). Similarly, in OVX’ed groups, DM did not impact subE/M vascular density, mesh-impacted area vascular density, or subE/M vessel T/Lr (p=0.2110, p=0.0556, 0.8712). However, artery T/ Lr in the adventitia was lower in diabetic vs. nondiabetic samples with OVX (p=0.0001, Figure 2). Arteries in groups with both OVX and DM also displayed regions of potential fibrosis (Figure 3H)
The lack of significant differences in vascular density, vessel T/Lr, and vessel type quantity ratios among hysterectomy-only, mesh-implanted, and no-surgery groups indicates that urogynecologic surgeries, including mesh implantation, do not significantly alter baseline vessel remodeling in the subE/M. However, the increase in
vascular density in the subE/M and mesh-impacted areas with OVX, coupled with decreased artery T/Lr in the adventitia and subE/M vessel T/Lr, suggest that baseline vessel remodeling and mesh-induced neovascularization in the vagina are estrogen-dependent in an antagonistic manner, and therefore, postmenopausal status alone may impact vessel remodeling. DM alone may also compromise vessel quality despite increasing vascularity, as evidenced by vessel-associated smooth muscle irregularities and reduced vessel T/Lr, particularly in arteries, observed in diabetic groups. Under diabetic conditions with OVX, the significant decrease in artery T/Lr compared to nondiabetic conditions with OVX indicates that DM and postmenopausal status may interact synergistically in vessel remodeling.
Abnormal vessel remodeling is a potential mechanism for the elevated risks of surgical complications observed in women with DM. Changes in vessel remodeling in postmenopausal women without DM may also contribute to the high rates of mesh-related complications seen in nondiabetic patients. These findings may inform the design of therapies to improve outcomes for patients undergoing mesh-augmented pelvic floor disorder repair.
Our findings reveal that diabetes and menopause contribute to abnormal vessel remodeling, offering mechanistic insights into their role in mesh-related complications and impaired tissue integration and recovery. Future studies will focus on refining our random forest model for improved vessel classification and expanding sample size. We also aim to investigate molecular pathways underlying the vascular changes to identify potential therapeutic targets for improving postmesh implantation outcomes.
Funding was provided by NIH R01 HD108666, the Swanson School of Engineering, the Office of the Provost, and the Frederick Honors College at the University of Pittsburgh.
[1] M. M. Good et al., “Pelvic Floor Disorders,” Obstetrics and Gynecology Clinics of North America, vol. 46, no. 3, pp. 527–540, Sep. 2019, doi: 10.1016/j. ogc.2019.04.010.
[2] I. E. Nygaard et al., “Stress Urinary Incontinence,” Obstetrics & Gynecology, vol. 104, no. 3, pp. 607–620, Sep. 2004, doi: 10.1097/01. aog.0000137874.84862.94.
[3] J. M. Wu et al., “Prevalence and Trends of Symptomatic Pelvic Floor Disorders in U.S. Women,” Obstetrics & Gynecology, vol. 123, no. 1, pp. 141–148, Jan. 2014, doi: 10.1097/AOG.0000000000000057.
[4] E. Rovner et al., “Treatment options for stress urinary incontinence.” Reviews in urology vol. 6, 2004.
[5] I. Giarenis et al., “Prevention and management of pelvic organ prolapse,” F1000Prime Reports, vol. 6, Sep. 2014, doi: 10.12703/p6-77.
[6] R. E. Abhari et al., “Host–biomaterial interactions in mesh complications after pelvic floor reconstructive surgery,” Nature Reviews Urology, vol. 18, no. 12, pp. 725–738, Sep. 2021, doi: 10.1038/s41585-021-00511-y.
[7] J. P. Zambon et al., “Vaginal Mesh Exposure Presentation, Evaluation, and Management,” Current urology reports (Print), vol. 17, no. 9, Jul. 2016, doi: 10.1007/s11934-016-0617-z.
[8] A. Sinclair et al., “Diabetes and global ageing among 65-99-year-old adults: findings from the International Diabetes Federation Diabetes Atlas, 9th edition,” Diabetes Research and Clinical Practice, vol. 162, p. 108078, Feb. 2020, doi: 10.1016/j. diabres.2020.108078.
[9] A. Jawa et al., “Diabetic nephropathy and retinopathy,” The Medical Clinics of North America, vol. 88, no. 4, pp. 1001–1036, xi, Jul. 2004, doi: 10.1016/j.mcna.2004.04.012.
[10] J. C. Lim et al., “TNFα contributes to diabetes impaired angiogenesis in fracture healing,” Bone, vol. 99, pp. 26–38, Jun. 2017, doi: 10.1016/j.bone.2017.02.014.
[11] U. Okonkwo et al., “Diabetes and Wound Angiogenesis,” International Journal of Molecular Sciences, vol. 18, no. 7, p. 1419, Jul. 2017, doi: 10.3390/ ijms18071419.
[12] D. W. Losordo et al., “Estrogen and Angiogenesis,” Arteriosclerosis, Thrombosis, and Vascular Biology, vol. 21, no. 1, pp. 6–12, Jan. 2001, doi: 10.1161/01.atv.21.1.6.
Nalima Munyofu1, Ghazaleh Rostaminia2 , Steven D. Abramowitch1
1Department of Bioengineering, University of Pittsburgh, Pittsburgh, PA, 2Division of Urogynecology, NorthShore University HealthSystem, Chicago, IL
NALIMA MUNYOFU
Nalima Munyofu is a senior Bioengineering student, minoring in Mathematics. Her research interests include Women’s and LGBTQ+ health, tissue mechanics, computational modeling, and applied mathematics. After graduation, she plans to pursue her PhD in Biomedical Engineering.
STEVEN D. ABRAMOWITCH, PHD
Steven D. Abramowitch is the John A. Swanson Professor and Vice Chair of Culture and Community within the Department of Bioengineering at the University of Pittsburgh’s Swanson School of Engineering. Dr. Abramowitch is nationally and internationally recognized for his work in biomechanics related to female pelvic health.
Our research addresses the challenges with diagnosing obstructed defecation syndrome by developing a pipeline for generating synthetic ultrasound images. This approach creates sufficient data for training AI models that may guide ultrasonographers and improve diagnostic accuracy. This research aims to overcome data scarcity and annotation bottlenecks in medical imaging.
Keywords: Synthetic data, Ultrasound, Obstructed Defecation Syndrome, Anatomic phantom
Abbreviations: Obstructed defecation syndrome (ODS), Quantitative Prolapse (POPQ), Radio frequency (RF)



Obstructed defecation syndrome (ODS) without dyssynergia is a form of constipation associated with structural defects in rectal support. Diagnosing ODS remains challenging due to inter-patient anatomical variability. The overarching aim is to train deep learning models for automated diagnosis. However, clinical image acquisition and manual annotation are time-consuming and resource-intensive. This study investigates the feasibility of generating synthetic ultrasound images using a dual-stage pipeline. In the first stage, Houdini™ software was used to create geometric models representing the rectum, vagina, cul-de-sac, and levator plate using simple geometries. The 3D model was animated to mimic and simulate dynamics observed during ultrasound imaging. The second stage utilizes Field II, a MATLABbased ultrasound simulation tool, to simulate collecting radio frequency data of anatomic phantoms based on the Houdini model. The radio frequency data was then processed to create synthetic ultrasound B-mode images. One simulation using 50,000 point scatterers in the phantom required approximately 20 minutes to collect 50 lines of radio frequency data. The results demonstrated the pipeline’s ability to produce realistic ultrasound images with clear anatomical boundaries. The collection of real clinical images is limited by budget and can span several months. The pipeline is more time efficient and allows for scalability to create batches of models and images. Future work will improve the anatomic accuracy of the model, integrate patient-specific MRI-derived geometries, and refine parameters to match clinical probe specifications. This study establishes the pipeline as a viable method for synthetic ultrasound image generation.
Obstructed defecation syndrome (ODS) without dyssynergia is a form of constipation characterized by the inability to evacuate rectal contents that is not due to impaired peristalsis [1]. Our previous research has shown that in many female patients, this condition is associated with a structural defect compromising rectal support, necessitating surgical intervention via rectopexy [2]. Intravaginal ultrasound imaging of this condition reveals increased mobility of the posterior cul-de-sac (the junction between the vagina and rectum) towards the rectoanal junction during increased intra-abdominal pressure [2]. However, diagnosis is challenging due to significant inter-
patient anatomical variability, particularly in those with structural defects. The overarching aim of this research is to develop and train deep learning models to guide ultrasonographers during image acquisition, assist in automated measurements and feature extraction, and aid in the diagnosis of ODS resulting from structural rectal support defects.
Training deep learning models for medical image classification requires a large dataset of annotated images, including both positive (defect present) and negative (defect absent) cases. Traditionally, this necessitates access to an extensive database of patient ultrasounds, with clinical experts manually annotating each image frame—a time-consuming and resourceintensive process. The present study aimed to investigate the viability of developing a pipeline for generating synthetic ultrasound images with corresponding annotations, suitable for training AI models. While deep learning technology has been used in clinical settings, its potential for real-time segmentation and guidance during ultrasonography, particularly for elusive structural defects like those in ODS, remains greatly untapped. This approach could potentially address the challenges of data scarcity and annotation bottlenecks in medical AI development. The hypothesis is that this pipeline is a feasible and time efficient method of acquiring realistic ultrasound images.
This study leverages a dual-stage pipeline for generating synthetic ultrasound data with precise annotations. First, the 3D animation software Houdini™ (version 20.0, SideFX, Inc.) is employed to create and animate geometric models representing anatomical structures. These models serve as the ground truth for the synthetic data generation process. Subsequently, the radio frequency simulation program Field II is utilized to transform 2D exports from Houdini™ into synthetic ultrasound images. Field II simulates ultrasound transducer fields and imaging using linear acoustics, capable of modeling emitted and pulse-echo fields for various transducers and simulating linear imaging of human tissue. The success criteria are for the pipeline to be more time efficient in comparison to acquiring real clinical images. For reference, the previously cited research stated that 62 subjects, 30 controls and 32 cases, were recruited over the span of three months. The chosen subject underwent vaginal examination, quantitative prolapse (POPQ) assessment, and endovaginal pelvic floor static and dynamic ultrasound [2]. The pipeline should allow for scalability to create large sets of data, and the images produced should be realistic.
A key advantage of this approach lies in the deterministic nature of the geometry creation in Houdini™. Since the contours of the anatomical structures are precisely defined in the 3D environment, they can be directly mapped onto the synthetic ultrasound images, providing pixel-perfect annotations. Further, Houdini™’s procedural modeling capabilities allow for the potential to develop
this approach into one that yields high-throughput, semiautomated generation of diverse anatomical variations.
Since the goal of the current study was to develop the workflow and assess feasibility, our initial geometric models were created using simple shape primitives: a tube for the rectum and vagina, a triangular prism for the culde-sac, and a curved tube wrapping around the vagina and rectum to represent the levator plate, as seen in Figure 1
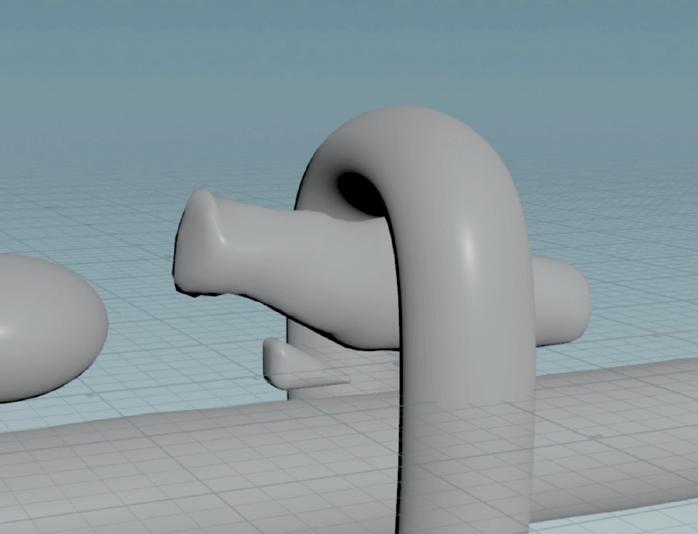
To simulate the dynamics observed in ultrasound, a vellum soft body solver was used to animate the motion of the rectum as the cul-de-sac was moved inferiorly underneath it. Each geometry was given volume (i.e. the interior of the surface mesh was filled) using a random density distribution. The latter creates non-uniformity in the exported 2D images, which aids in simulating the scattering characteristics of tissue during the second stage of the pipeline. A volume slice node was used to show the cross-section of these geometries and their densities. A camera node rendered these cross-sections for multiple simulation frames, which were then converted to bitmap images.
Field II has a menu-based interface through MATLAB. All routines for simulating the transducer, phantom, and image processing are executed directly within MATLAB through a series of menus [1]. The first routine initializes the field system. The second routine creates a file storing the scatterer positions and associated amplitudes for the phantom. This is achieved by calling a function that loads the bitmap image, storing its indexed image and associated colormap. The colormap determines the amplitude scaling of scatterers within the phantom, reflecting the density variations of the structures. The function also defines the dimensions of the phantom space. The simulation was run with 50,000 scatterers. The width, transverse width, and height of the phantom are defined as 100, 15, and 60 mm, respectively. The phantom starts 2 mm from the transducer surface.

The third routine simulates scanning the phantom with a 192-element linear array transducer with 64 active elements and a center frequency of 3.5 MHz. The wavelength, lambda, is defined as the speed of sound divided by the transducer center frequency. The width of the elements is equal to lambda. The kerf, the distance between individual elements, is .05 mm. Hanning apodization was applied to smooth the edges of the radio frequency (RF) data, thereby minimizing discontinuities. The transmission focus was positioned at 60 mm along the z-axis, with focusing adjustments spanning from 30 mm to 200 mm in 20 mm increments. A total of 50 RF data lines were collected, with a spacing of 1.2 mm between each line.
To generate a b-mode image, a two-dimensional image made of points of varying brightness, the RF data is loaded and processed by applying the Hilbert transform and taking the absolute value. In the frequency domain, the Hilbert transform imposes a phase shift of 90 degrees to all frequency components of a function. By summing the original real-value signal with the transformed signal, the result is the analytic signal. The ‘hilbert’ function in MATLAB computes the analytic signal and the absolute command computes the magnitude, providing the envelope of the RF data.
The number of datapoints in the envelope is scaled down by a factor of 10 and then normalized. The normalized envelope data is then converted to a logarithmic scale which is necessary to compress the dynamic range to improve image quality. The dynamic range is compressed to 60 dB and scaled to fit a grayscale range 0-127.
Interpolation is used to enhance the resolution of the ultrasound image by increasing the number of data points. The interpolation factor was set to 20 so each original data point generated 20 points in the output. The ‘image’ function plots the interpolated matrix data as an image, with each value being mapped to a pixel intensity, creating the visual representation of the ultrasound data.
The data processing results are shown in Figure 1, which displays three B-mode ultrasound images generated by Field II. These images are derived from bitmaps three sequential frames of the Houdini simulation. The model and thus ultrasound image is a simplified representation of ODS, however there are clear boundaries between the geometries in the image. Scatterers with higher amplitudes (i.e. higher density) produce stronger echoes when the simulated ultrasound waves interact, while those with lower amplitudes produce weaker echoes. Variation in amplitude contributes to the contrast and overall appearance of the ultrasound image, allowing different structures within the phantom to be distinguished. Despite the simplicity, the three frames capture the desired tissue behavior. The posterior cul-de-sac encroaches underneath
the length of the rectum, thus deforming it in response. The boundaries of the structures mimic the behavior seen in the real clinical images. Each simulation run for a single bitmap requires approximately 20 minutes to complete, with approximately 30 seconds for the calculation of each line of RF data.

For comparison, Figure 2 presents real ultrasound images of a patient diagnosed with ODS without dyssynergia, captured during abdominal muscle contraction. The imaging was performed using a 3D X14L4 Endocavity Transducer operating at a frequency of 12 MHz. The segmentations superimposed on the images delineate the anatomical structures of interest. The rectum, levator plate, and cul-de-sac are color-coded with green, red, and blue, respectively. The boundaries of the synthetic images match the movement and general shape of the segmentations on the clinical images.

The ultrasound image generated using Field II is currently quite basic due to the simplicity of the Houdini model. This initial simplicity is intentional, as the goal is to evaluate the feasibility of the Field II simulation framework. Field II is successful at simulating RF data and produced realistic ultrasound images based on the anatomical phantoms. The efficiency and accuracy of this simulation is significantly enhanced by Field II’s menu-driven interface and its MATLAB integration. The pipeline addressed all three of the success criteria, time efficiency, scalability, and relative realism. The approximate 20 minutes spent generating a single
synthetic ultrasound image is still significantly more time efficient compared to the lengthy process of acquiring clinical images, which involves patient recruitment, screening, assessments, image acquisition, and manual annotation. The developed pipeline shows promise for creating realistic synthetic ultrasound images. Our future research will focus on improving the Houdini model by integrating patient-specific MRI geometries and refining tissue density and stiffness parameters. We will also optimize Field II parameters to match clinical ultrasound probe specifications. Enhancing image resolution by increasing scatterer density and scan line count extends RF data calculation time, highlighting the need to balance simulation accuracy with computational efficiency.
Using Field II and Houdini™ poses a viable method to generate realistic ultrasound images. One limitation is the tradeoff between simulation accuracy and computation time. Increasing the number of scatterers and scan lines enhances image resolution but prolongs the process of RF data calculation. Future research will focus on developing the Houdini model by more accurately configuring geometry attributes, such as density and stiffness, to better reflect the physical properties of real soft tissue. Future work may employ geometries obtained from MRI. Further research will also explore changing the acoustic environment and other parameters within the Field II simulation to closer simulate endocavity or similar transducers used for pelvic imaging. The long-term goal is to create a large dataset suitable to train a deep learning model.
Funding was provided by the Swanson School of Engineering and the Office of the Provost at the University of Pittsburgh.
[1] Routzong MR, Abramowitch SD, Chang C, Goldberg RP, Ghazaleh Rostaminia. Obstructed Defecation Symptom Severity and Degree of Rectal Hypermobility and Folding Detected by Dynamic Ultrasound. Ultrasound Quarterly. 2021 Sep 1;37(3):229–36.
[2] Ghazaleh Rostaminia, Abramowitch SD, Chang C, Goldberg. Descent and hypermobility of the rectum in women with obstructed defecation symptoms. International Urogynecology Journal. 2019 Apr 23;31(2):337–49.
[3] Jensen JA. Field: A program for simulating ultrasound systems. Med Biol Eng Comput. 1996;34(Suppl 1, Part 1):351-3.
[4] Jensen JA, Munk P. Computer phantoms for simulating ultrasound B-mode and CFM images. In: Proceedings of the 23rd Acoustical Imaging Symposium; 1997 Apr 13-16; Boston, MA, USA.
[5] Jensen JA. Linear description of ultrasound imaging systems. Notes for the International Summer School on Advanced Ultrasound Imaging; 1999 Jul 5-9; Technical University of Denmark. Lyngby: Technical University of Denmark; 1999.
Trin R. Murphy1, David R. Maestas, Jr.1, William R. Wagner1,2 , Sang-Ho Ye1,2 , Jonathan P. Vande Geest1,2
1Department of Bioengineering, University of Pittsburgh, PA, 2McGowan Institute for Regenerative Medicine, Pittsburgh, PA
TRIN R. MURPHY
Trin Murphy is a sophomore Bioengineering student minoring in Chemistry at the University of Pittsburgh with an interest in tissue engineering.
DAVID R. MAESTAS, JR., PHD
Dr. David R. Maestas, Jr. is a recent doctoral graduate from Johns Hopkins University and is a postdoctoral associate working in the laboratory of Dr. Jonathan Vande Geest. His work is focused on the design of biomechanically compliance matched anti-thrombogenic vascular grafts capable of inducing neo-artery formation in pre-clinical animal models.
JONATHAN P. VANDE GEEST, PHD
Dr. Jonathan Vande Geest is a professor in the Department of Bioengineering, Mechanical Engineering and Materials Science, Department of Ophthalmology, the McGowan Institute for Regenerative Medicine, the Louis J. Fox Center for Vision Restoration, and the Vascular Institute at the University of Pittsburgh.
To improve patency in small diameter coronary artery bypass grafts, tissue engineered vascular grafts must be compliance matched to the native artery. Elastomeric biopolymer-based trilayered grafts can be tuned to produce compliance matched grafts, wherein the properties can be tuned by varying dispensed volume during manufacturing.
Keywords: Tissue Engineered Vascular Graft, Compliance, Poly(Lactide-co-caprolactone)




Heart disease remains the leading cause of mortality in the United States [1], being the cause of approximately one out of five deaths. One of the treatment options for coronary artery disease (CAD) is a coronary artery bypass graft (CABG), which unfortunately continues to have a high failure rate exceeding 40% [3]. Previous work has shown that providing a compliance matched small diameter tissue engineered vascular graft (TEVG) would result in better patient outcomes [4]. To manufacture compliance matching grafts, trilayered small diameter grafts were electrospun from biocompatible materials. Both grafts have identical middle and outer layers. Poly(lactide-cocaprolactone) (PLCL) was selected as a primary material due to its high elasticity and lack of toxic byproducts. The outer layers incorporate significant gelatin to promote cellular infiltration and remodeling. One variant includes an anti-thrombogenic inner layer of poly(ester urethane) urea elastomer containing sulfobetaine (PESBUU-50) [5], whereas the other features a thrombogenic inner layer of PLCL. These were then mechanically tested to determine the compliance values of the grafts and compared to the compliance values of native rat aortas. The native rat aorta had compliances ranging from 0.000897 mmHg -1 to 0.001779 mmHg -1, indicating the compliance-matching window. The compliance matched (CM) and hypocompliant PESBUU-50 designs had an average of 0.00118 mmHg -1 and 0.000666 mmHg -1. The CM and hypocompliant PLCL designs had an average of 0.00136 mmHg -1 and 0.000741 mmHg -1, demonstrating both PESBUU-50 and PLCL trilayers were able to be tuned to produce compliance matched and hypocompliant TEVGs. The compliance of both grafts was also affected by varying the volume dispensed during electrospinning, with more volume producing more hypocompliant results. This property is also dependent on the materials used to create the graft, as PLCL and PESBUU-50 grafts with similar wall thicknesses showed different compliance values. PESBUU-50 and PLCL polymers show promise for CABG design and production due to their ability to produce compliance matched, tunable grafts.
Heart disease remains the leading cause of mortality in the United States, with coronary artery disease (CAD) resulting in 928,741 deaths in 2020 [1]. One of the treatment options for CAD is a coronary artery bypass
graft (CABG). Approximately 400,000 patients undergo CABG each year [2], though these have a high failure rate, of 42.8% [3]. This is hypothesized to be due to a biomechanical compliance mismatch between the native blood vessel and the CABG, resulting in intimal hyperplasia and thrombosis [4]. Addressing these challenges through developing anti-thrombogenic compliant small-diameter tissue-engineered vascular grafts (TEVGs) holds promise for significantly enhancing patient outcomes. In this work, we sought to develop two small diameter compliance matched (CM) TEVG designs that varied in thrombogenicity. In order to manufacture grafts, trilayered small diameter grafts were electrospun from biocompatible materials. One variant includes an anti-thrombogenic inner layer of polyester urethane urea elastomer containing sulfobetaine (PESBUU-50) [5], whereas the other features a thrombogenic inner layer of PLCL. PLCL was selected as the primary material for the second graft due to its high elasticity and lack of toxic byproducts. Both grafts utilized a substantial proportion of gelatin in the outer layer to encourage cellular infiltration and remodeling. Cellular remodeling is vital to ensure long-term patency of TEVG designs. The goal is to create a graft with enough mechanical support to match the native vessel compliance while still being attractive to cells. When producing the grafts, the final design was achieved through an iterative parameter optimization of electrospinning volume to impact each layer’s resulting compliance. Once compliance matched grafts were created, a more hypocompliant graft was produced by varying the amount of material dispensed into the inner two layers of the grafts during the electrospinning process. The hypocompliant version of the graft was developed to demonstrate the possibility of scaling the graft to different animal models. In addition, it can act as a control to evaluate the impact of compliance matching on graft patency. Using this method, four TEVG designs were created: CM and hypocompliant PESBUU-50 inner layer TEVGs and CM and hypocompliant PLCL inner layer TEVGs.
2.1 Graft Fabrication
Our chosen TEVG polymer mixtures were composed of gelatin isolated from porcine skin (MilliporeSigma), PESBUU-50, 60:40 PLCL (MilliporeSigma). PESBUU-50 inner layer trilayered grafts were fabricated by electrospinning solutions of 8% PESBUU-50, 10% 80:20 PLCL:Gelatin, then 10% 40:60 PLCL:Gelatin. PLCL trilayered grafts were fabricated by electrospinning solutions of 10% PLCL, 10% 80:20 PLCL:Gelatin, then 10% 40:60 PLCL:Gelatin. The solutions were dissolved in 1,1,1,3,3,3-Hexafluoro-2-propanol (HFP). The PESBUU-50 solutions were electrospun at a voltage difference of +20 kV, and -4 kV, at a working distance of 10 cm. All other solutions were electrospun at a voltage difference of +15 kV and -0.5 kV. Solutions were dispensed onto a rotating target mandrel of 1.1 mm diameter ( Figure 1). Grafts were
then crosslinked for 24 hours in 0.5% genipin in 200 proof ethanol at 37°C. After crosslinking, the grafts were washed three times using 200 proof ethanol.
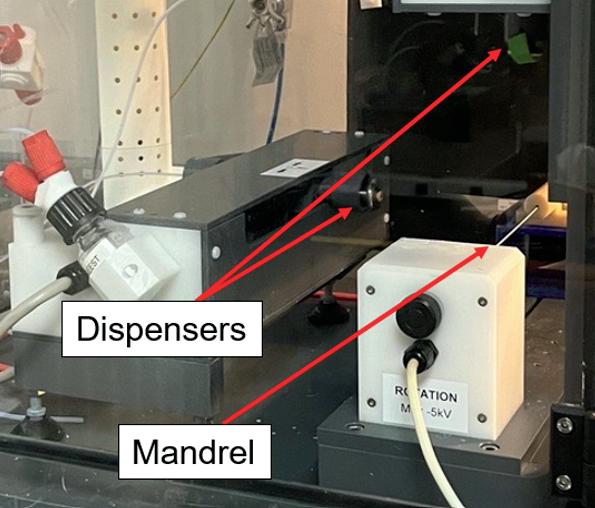
Four TEVG design groups were tested: CM and hypocompliant PESBUU-50 inner layer TEVGs, and CM and hypocompliant PLCL inner layer TEVGs. The grafts were then mechanically tested using a custom tubular biaxial mechanical testing device (CellScale) ( Figure 2) that pressurized the samples from 5 mmHg to 120 mmHg in a 37°C heated water bath across 10 cycles, imaging the TEVG outer diameters at a frequency of 5 Hz.
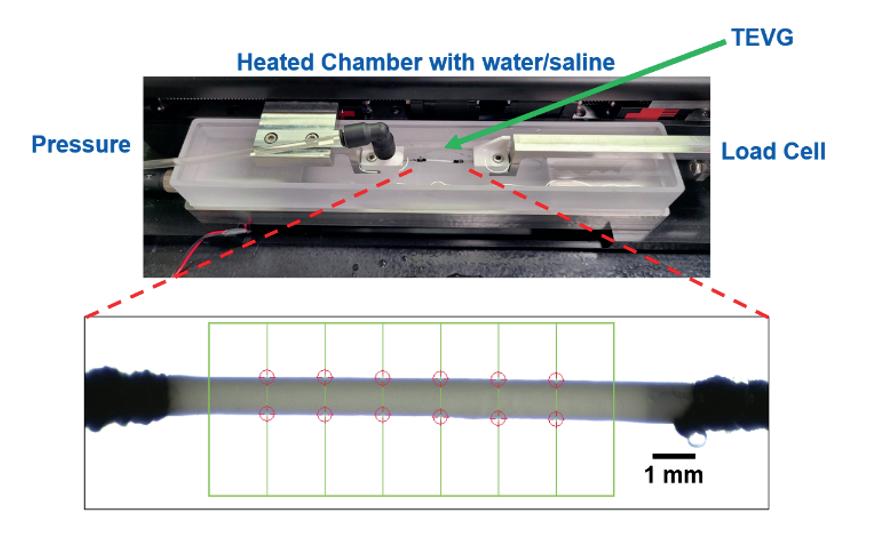
Figure 2: Custom tubular biaxial testing device with software image tracking of the TEVG outer diameter.
The images taken throughout the mechanical tests were used to track the outer diameter of the TEVG. The first nine cycles of the testing were used to pre-condition the graft, and the tenth cycle was the testing phase. Compliance was calculated using the outer diameters at 70 mmHg and 120 mmHg [4] ( Figure 3). Compliance values were evaluated in comparison with native rat aorta explants. Compliance matched values were those that fell within the range of the rat aortas. Grafts with values below this range were considered hypocompliant (stiff). Graft diameters and thicknesses were measured by cutting a cross section and measuring using an Olympus Surgical Microscope. Statistical significances were assessed using ordinary one-way ANOVA with a post-hoc Tukey test for multiple comparisons.

Figure 3: Equation used to calculate TEVG compliance with OD representing the outer diameter of the TEVG at each pressure.
The native rat aorta compliance ranged from 0.000896 mmHg -1 to 0.00178 mmHg -1 . Both the PLCL and PESBUU-50 graft designs had a CM version, falling within this same range. Each graft design hypocompliant design fell below this range ( Table 1). There is a statistical difference (p < 0.05) in the compliance of the CM PLCL trilayer compared to the hypocompliant PLCL and to the hypocompliant PESBUU-50 grafts ( Figure 4). All TEVG designs had a higher average wall thickness than native rat aortas. There was a statistical difference (p < 0.05) between the native rat aorta wall thickness and the wall thickness of all other designs ( Figure 5 ).
Table 1: Average TEVG compliance and wall thickness measurements
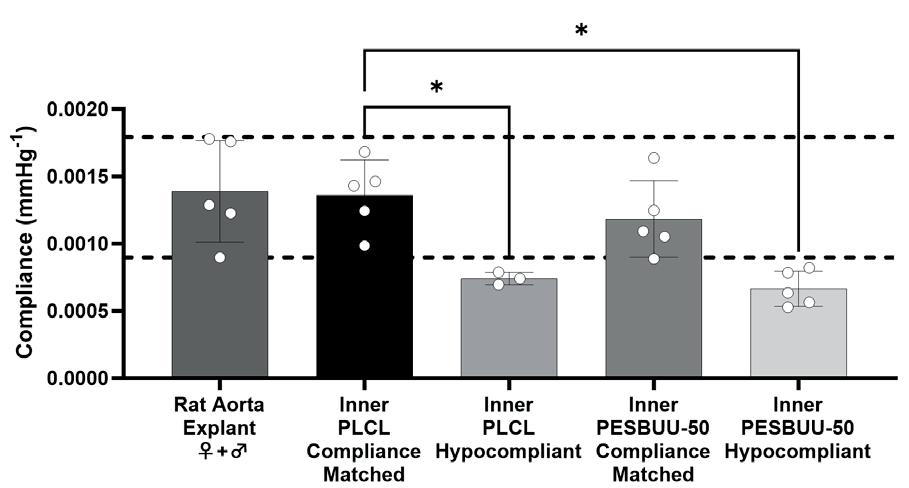
Figure 4: Compliance values of native rat aorta explants in comparison to trilayered TEVG designs n=3-5, p= 0.0393, 0.0299, respectively. Dashed lines are used to indicate the range of compliance matching values.


Figure 5: Wall thicknesses of native rat aorta explants in comparison to trilayered TEVG designs n=3-5, p= 0.0008, 0.0008, 0.0075, respectively.
In this study we sought to develop two compliance matched TEVG designs, and tune their mechanical properties. In addition to this, each of these grafts were varied by increasing the volume of material used during the electrospinning process to produce hypocompliant grafts. The difference in the average compliance values of the PESBUU-50 and PLCL trilayers demonstrates that by varying the electrospinning parameters, compliance can be modulated. All graft walls were significantly thicker than the native rat aorta wall thickness. Most of the wall thickness of the graft is comprised of the outer layer which is comprised of a high percentage of gelatin. This layer of the graft degrades quickly, so that once implanted the grafts will quickly decrease in wall thickness, becoming more similar to the native aorta. Compliance is not only impacted by the volume dispensed in manufacturing the grafts, but the materials used in the grafts as well. The CM PESBUU-50, and hypocompliant PLCL have similar wall thickness but different compliance values, demonstrating this property.
These results showed that small diameter, biocompatible, compliance matched trilayered TEVGs can be fabricated using both PESBUU-50 or PLCL inner layers. Furthermore, these grafts compliance values can be modified by changing the volume dispensed in manufacturing. More volume dispensed yields a more hypocompliant graft. The wall thickness of the grafts are all substantially greater than the native rat aorta and do not necessarily correlate to the compliance of the grafts. PLCL and PESBUU-50 grafts with similar wall thicknesses showed different compliance values. In the future, computational analysis can be utilized to quantify the relationship between volume dispensed, thickness, biomaterial mixture ratios, and compliance. Further mechanical characterization will be done to determine the burst strength, suture retention. In addition, both in vitro and in vivo studies will be performed to evaluate the impact of the PESBUU-50 inner layer on the
anti-thrombogenicity of the grafts. PESBUU-50 and PLCL polymers show promise for CABG design and production due to their ability to produce compliance matched, tunable grafts.
This research was funded by NIH award R01HL157017 to JPVG, accompanying Supplement Award R01HL15701702S1 to support DRM, and SURI program at the Swanson School of Engineering and the Office of the Provost at the University of Pittsburgh.
[1] C. W. Tsao, et al., “Heart Disease and Stroke Statistics – 2023 Update: A Report From the American Heart Association,” Circulation, vol. 147, January, 2023, doi: 10.1161/CIR.0000000000001123. [Accessed Aug. 5, 2023].
[2] B. J. Bachar and B. Manna, “Coronary Artery Bypass Graft,” StatPearls, 2023. [Online]. Available: https:// pubmed.ncbi.nlm.nih.gov/29939613/. [Accessed Aug. 5, 2023].
[3] C. N. Hess and M. P. Bonaca, “Contemporary Review of Antithrombotic Therapy in Peripheral Artery Disease,” Circulation, vol. 13, 2020, doi: 10.1161/ CIRCINTERVENTIONS.120.009584. [Accessed Aug. 6, 2023].
[4] Y. Jeong, Y. Yao, and E. K. Yim, “Current Understanding of Intimal Hyperplasia and Effect of Compliance in Synthetic Small Diameter Vascular Grafts,” Biomaterials science, vol. 8, no. 16, pp. 43834395, 2020, doi: 10.1039/d0bm00226g. [Accessed Aug. 6, 2023].
[5] SH. Ye, Y. Hong, H. Sakaguchi, V. Shankarraman, S. Luketich, A. D’Amor, and W. R. Wagner, “Non-thrombogenic, biodegradable elastomeric polyurethanes with variable sulfobetaine content,” ACS Applied Materials & Interfaces, vol. 6, no. 24, pp. 796806, 2014, doi: 10.1021/am506998s. [Accessed Aug. 7, 2023].
Charles A. Oduro Jr.1,2 , Rohit Bose1,2,4 , Lee Fisher1-3
1Department of Bioengineering, University of Pittsburgh, Pittsburgh, PA, 2Rehab Neural Engineering Labs, University of Pittsburgh, Pittsburgh, PA, 3Department of Physical Medicine and Rehabilitation, University of Pittsburgh, Pittsburgh, PA, 4Department of Bioengineering, Case Western Reserve University, Cleveland, OH
CHARLES A. ODURO JR.
Charles Oduro Jr. is a senior Bioengineering student from Toms River, New Jersey. His research interests include neural engineering in the area of neuroprosthetics and nerve stimulation, along with biomechanics and gait analysis. After graduation, he plans to work in industry with a later plan to receive a master’s degree in Prosthetics & Orthotics.
ROHIT BOSE, PHD
As a PhD student in Pittsburgh, Rohit Bose worked on restoring sensation in lower-limb amputees using spinal cord stimulation, achieving the first evidence of restoring missing sensation in individuals with peripheral neuropathy. Before his time in the United States, he was a research assistant at the Singapore Institute of Neurotechnology, where he decoded brain responses to different fragrances and used sensory feedback using targeted TENS in upperlimb amputees. His work has been recognized by publishing 21 journal articles and four book chapters. Bose is now the newest postdoc at the Human Fusions Institute of Case Western University.
LEE FISHER, PHD
Lee Fisher, PhD, is an associate professor in the Department of Physical Medicine and Rehabilitation. He completed his doctoral studies in Biomedical Engineering at Case Western Reserve University. His PhD work focused on the use of multi-contact stimulating electrodes to restore standing function after spinal cord injury.
Dr. Fisher’s research interests involve the development of neuroprostheses to restore sensory and motor function after neural damage or disease, as well as the exploration of the role of somatosensation in maintaining balance control during standing and walking.


Loss of sensory feedback after lower-limb amputation disrupts balance and gait. Recent studies proposed a cross-modal congruency effect (CCE) paradigm as a tool to identify sensory feedback strategies that effectively integrates in the sensorimotor schema and enhance lower-limb function. This study aimed to identify cortical biomarkers from the CCE paradigm that would reduce clinical testing time by optimizing the sensory feedback strategy in an individual for effective prosthetic performance. Our findings highlight the limitation of the proposed CCE paradigm as a sensory feedback integration measure that needs to be addressed with modification in the protocol and testing with other sensory modalities.
Keywords: Sensory Feedback Integration, Crossmodal Congruency Effect, EEG Biomarkers
Abbreviations: Electroencephalography (EEG), Crossmodal Congruency Effect (CCE), Light-Emitting Diodes (LEDs)
The loss of sensory feedback after lower-limb amputation impairs balance and gait, necessitating effective restoration strategies. This study explores the use of the Cross-modal Congruency Effect (CCE) recently proposed as a measure of sensory feedback integration for people with lower-limb amputation. As a proof-of-concept, twelve able-bodied participants—commonly used as surrogates in sensory research due to intact neural processing— completed the CCE task where somatosensory stimuli is delivered congruently or incongruently with a visual stimulus in the same location (knee or foot) or different location, respectively. Using electroencephalography (EEG) data, we aimed to identify cortical biomarkers that can distinguish between a pneumatic (more natural) compared to electric (less natural) stimulus. Results revealed differential neural processing in parietal electrodes in the delta and theta bands, with opposite effects for congruency in knee and foot stimuli. However, statistically significant differences between congruent and incongruent conditions were observed in only a minority of participants, suggesting limited robustness of EEG-based biomarkers for this purpose. These findings indicate that
while the CCE paradigm reveals some neural distinctions, it may not reliably measure sensory feedback integration in its current form. This work highlights the complexity of sensory integration and the need for tailored feedback strategies to enhance prosthetic functionality and user experience.
The loss of sensory feedback following lower-limb amputation often leads to significant disruptions in balance and gait, highlighting the critical importance of restoring this feedback to improve functionality. Various approaches, including both invasive and noninvasive stimulation strategies, have been developed to deliver sensory feedback effectively. Invasive approaches like peripheral nerve stimulation can provide more natural sensations yet also require surgical intervention. In contrast, noninvasive methods, including vibrotactile or electrotactile stimulation, offer practical alternatives but may not integrate seamlessly into the user’s sensorimotor neural schema[1]. Sensory integration—the brain’s process of merging information from senses—helps create a unified perception and coordinate responses, making it essential for motor function. This integration is especially critical for complex tasks requiring precise movements and real-time adjustments based on sensory feedback. Thus, finding effective strategies for providing and integrating sensory feedback is paramount.
One of the central challenges in restoring sensory feedback is ensuring that the chosen method integrates seamlessly into the user’s existing sensorimotor neural schema—essentially, the brain’s internal representation of the body and its movements. If the sensory feedback is not well-integrated, it may fail to provide meaningful benefits or could even confuse the user, potentially hindering motor performance. To evaluate sensory integration in this context, we employed the crossmodal congruency task. This task involves delivering stimuli from two different sensory modalities to distinct body locations simultaneously, requiring participants to identify the location of a target stimulus while ignoring a distractor stimulus.
The CCE arises from the brain’s natural tendency to integrate sensory information across modalities. It provides a quantitative measure of the interaction and integration between sensory systems. Recently, Bluestein et al. proposed CCE as a promising tool to evaluate sensory feedback integration in upper-limb amputees [2]. The authors suggested the use of CCE scores as a proxy for intuitiveness of sensory feedback in neuroprosthetics studies for individuals with upperlimb amputation. This idea was then validated through the application of individuals with lower-limb amputation, with the goal of using CCE scores as a measure of sensorimotor integration for lower-limb somatosensory neuroprostheses. In this study, we aim to extend this application by identifying EEG cortical biomarkers
associated with the CCE to deepen our understanding of the neural mechanisms underlying sensory integration. These biomarkers could serve as indicators of the effectiveness of restored sensory feedback mechanisms in lower-limb prosthetics, ultimately guiding the development of more intuitive and functional prosthetic devices [3].
9.1 Participants
Twelve able-bodied participants aged between 18 and 65 years, all with normal or corrected-to-normal vision, were recruited for this study. Informed consent was obtained from each participant, and the experimental procedures were approved by the University of Pittsburgh’s Institutional Review Board, ensuring compliance with ethical standards.
9.2 Experimental Apparatus and Stimuli
Participants were seated with their right legs extended on an elevated platform to facilitate clear visibility and access to the target areas. Light-emitting diodes (LEDs), electrical stimulation electrodes, and pneumatic tactors were placed on the dorsum of the foot and above the knee. An additional LED on the shin served as a visual fixation point to guide attention during trials.
The task involved delivering simultaneous somatosensory (target) and visual (distractor) stimuli. These stimuli appeared either in the same location (congruent trials) or in different locations (incongruent trials). Participants were instructed to verbally identify the location of the somatosensory stimulus (“t-knee” or “t-foot”), consciously ignoring the visual stimulus. The prefix “t-” was used to minimize response delays linked to the differing audio signatures of the words “knee” and “foot.”
9.3 Procedure
The experiment each participant completed consisted of six blocks, with 5-10 minutes of rest between each block to mitigate fatigue. Each block consisted of 96 trials total: 12 congruent trials and 12 incongruent trials for each location (knee and foot) and stimulus type (pneumatic and electric). These trials acted as a control to confirm participants’ engagement with the visual component of the task [4].
EEG data was recorded throughout the experiment and later imported to EEGLAB for down sampling to 500 Hz. The data was then filtered using standard FIR filtering with a bandwidth of [0.3 to 40] Hz to preserve relevant neural activity for sensory integration while removing slow drifts and high-frequency noise. Epochs were extracted using limits of [-2 to 2.5] seconds to isolate segments of continuous data that are linked to specific events, later used for time-locked analysis, which helps identify and analyze neural activity patterns associated with the
timing of those specific events. This approach is crucial for studying time-sensitive brain responses as it aligns the data to a common temporal reference point, enabling the acquisition of the average in neural signals across trials to reveal event-specific dynamics [3]. Independent component analysis was used to remove artifacts through EEGLAB. Extracted epochs were normalized using the baseline correction technique, reducing variability across trials and subjects that might be due to differences in signal amplitude, baseline levels, or other factors not related to the experimental conditions. The data was analyzed in a stimulus-locked window to allow for targeted analysis of distinct neural processes associated with sensory stimuli. Separating the data into stimulus-locked epochs enables the analysis of brain activity related to the perception and processing of sensory inputs linked to onset of the stimulus. This approach helps us understand how the brain reacts to sensory inputs. Stimulus-locked data was defined as [0 to 200] milliseconds with respect to the stimulation onset. The data was then averaged and segregated by condition and location and later analyzed using a Wilcoxon rank-sum test.
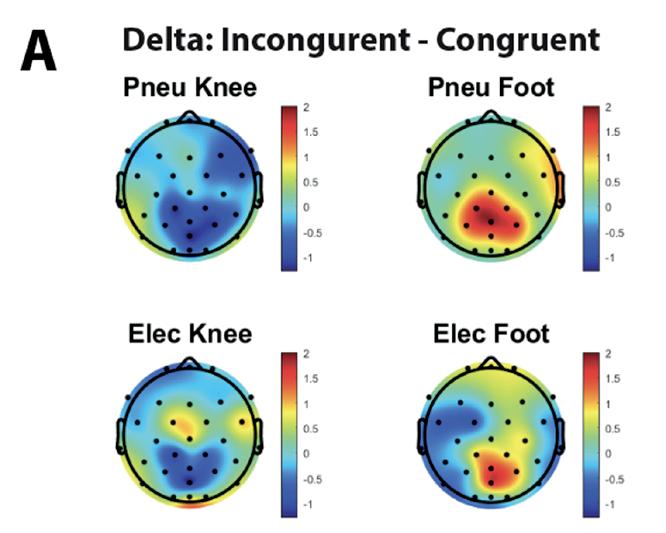

Figure 1. EEG topographic maps of stimulus-locked normalized EEG data of the difference between the incongruent and congruent trials. Greater magnitudes of difference of the incongruent and congruent data are observed in the parietal electrodes of the foot trials compared to the knee trials in the delta band (A). A similar effect is shown in the theta band (B).

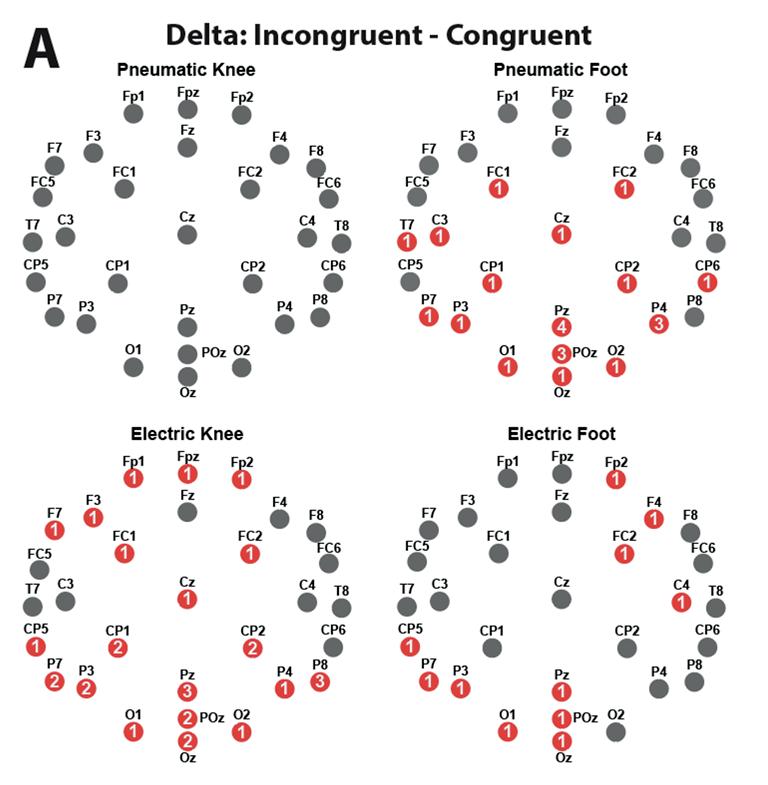
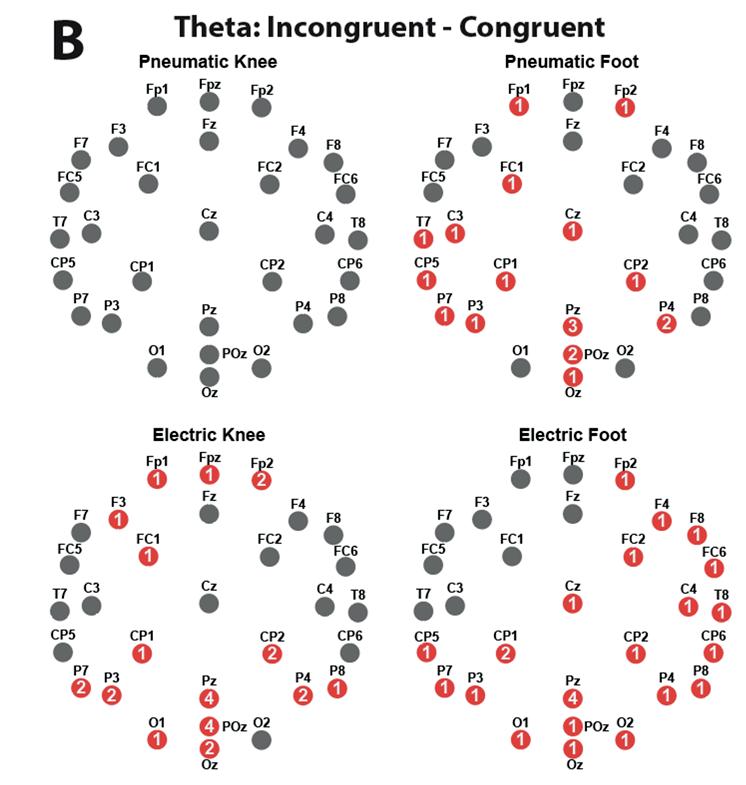
Figure 2. Wilcoxon rank-sum test results of stimulus-locked normalized EEG data of the difference between the incongruent and congruent trials. Red circles indicate electrodes where at least one subject showed statistical significance, while grey circles represent electrodes with no statistical significance. The number below the circle represents the number of subjects eliciting statistical significance of the designated electrode. Minimal statistical significance is shown in the delta band (A) and theta band (B).
Figure 1 shows EEG topographic maps of stimulus-locked data, depicting the difference between incongruent and congruent trials. The data are averaged across all participants, with each trial normalized to its baseline. At the foot, incongruent trials showed higher parietal power in the delta and theta bands compared to the congruent trials. At the knee, we observed an opposite effect with higher parietal power in the delta and theta bands for congruent trials compared to incongruent trials. Figure 2 presents the Wilcoxon rank-sum test results for the averaged, normalized stimulus-locked EEG data, comparing the differences between incongruent and congruent trials across 12 subjects. The number enclosed in the circle represents the number of subjects eliciting statistical significance of the designated electrode. Minimal statistical significance is shown in the delta band and theta band. The Wilcoxon rank-sum test identified significance in at most four out of 12 subjects, primarily in the parietal electrodes.
We observed opposing effects between knee and foot trials under pneumatic and electric conditions. Topographic maps highlight differential neural processing in parietal electrodes, with knee trials showing higher
amplitudes for congruent conditions, therefore, indicating stronger neural activity when sensory inputs align with expectations. In contrast, foot trials exhibit higher amplitudes for incongruent conditions, suggesting heightened neural activity for unexpected inputs. These findings suggest parietal processing varies by stimulus location, with greater engagement for congruent stimuli in knee trials and incongruent stimuli in foot trials. This aligns with prior research on enhanced neural synchronization for congruent stimuli, such as the study by Schall et al., which links visual EEG responses to auditory temporal congruency [5]. The increased engagement during congruent knee trials may reflect more efficient multisensory integration.
In contrast, for foot stimuli, the higher amplitude in incongruent conditions, points to a different neural mechanism. This result could reflect a compensatory increase in neural processing when unexpected sensory inputs are presented, linking incongruent stimuli to distinct oscillatory dynamics in theta, alpha, and beta frequency bands [6]. The differential responses between knee and foot stimuli may stem from variations in sensory representation or task relevance, with the foot potentially requiring greater neural resources to resolve incongruencies.
These observations partially diverge from findings in previous studies. While prior work has demonstrated behavioral benefits and enhanced neural responses for congruent stimuli across various sensory modalities [7], our results suggest a more nuanced interaction where the type and location of the stimulus significantly influence the neural response. This discrepancy could arise from methodological differences, such as using pneumatic and electric conditions in our study, which may uniquely affect sensory integration processes.
The Wilcoxon rank-sum analysis revealed that only three to four participants exhibited statistically significant differences between the incongruent and congruent conditions. This limited number of participants showing significance indicates that the effect of cross-modal congruency on the EEG signals was not consistently observed across the sample. These findings are consistent with the challenges identified in the literature regarding the variability of EEG markers for crossmodal congruency effects [5]-[7]. Our sample’s lack of widespread significance could be attributed to individual differences in neural processing, task engagement, or the specific experimental design used in our study. Further research with greater and more diverse samples is needed to clarify these effects and establish more reliable EEGbased biomarkers for cross-modal congruency.
In this study, we tried to quantify cortical biomarkers for the CCE paradigm as a measure of sensory integration in able-bodied participants as a proof-of-concept. Across participants we observed inconsistent results in the EEG band power results in both knee and foot location.
With few subjects exhibiting statistical significance, we determined that EEG-based analysis of the CCE task is not an effective measure for determining sensory integration in the lower-limb. Further research can be done to build on these findings, such as including lower-limb amputees as participants to understand how amputees perceive and integrate sensory feedback. Additionally, the exploration of different modalities and/or stimuli to understand the robustness and specificity of the CCE across different sensory modalities can be studied to help tailor sensory feedback in prosthetics.
We would like to acknowledge Dr. Bailey Petersen for helping in data collection, and Dr. Roberta Klatzky and Dr. Sliman Bensmaia for providing guidance in experimental design.
[1] B. Stephens-Fripp, G. Alici and R. Mutlu, “A Review of Non-Invasive Sensory Feedback Methods for Transradial Prosthetic Hands,” in IEEE Access, vol. 6, pp. 6878-6899, 2018, doi: 10.1109/ ACCESS.2018.2791583.
[2] Blustein, D., Wilson, A. & Sensinger, J. Assessing the quality of supplementary sensory feedback using the crossmodal congruency task. Sci Rep 8, 6203 (2018).
[3] Kanayama N, Sato A, Ohira H. The role of gamma band oscillations and synchrony on rubber hand illusion and crossmodal integration. Brain Cogn. 2009 Feb;69(1):19-29. doi: 10.1016/j.bandc.2008.05.001. Epub 2008 Jun 13. PMID: 18555572.
[4] R. Bose, B. Petersen, R. Klatzky and L. E. Fisher, “Can the crossmodal congruency task be a proxy for intuitiveness of sensory feedback in lowerlimb amputees?,” 2023 11th International IEEE/ EMBS Conference on Neural Engineering (NER), Baltimore, MD, USA, 2023, pp. 1-4, doi: 10.1109/ NER52421.2023.10123872.
[5] Schall S, Quigley C, Onat S, König P. Visual stimulus locking of EEG is modulated by temporal congruency of auditory stimuli. Exp Brain Res. 2009 Sep;198(23):137-51. doi: 10.1007/s00221-009-1867-5. Epub 2009 Jun 14. PMID: 19526359.
[6] Göschl F, Friese U, Daume J, König P, Engel AK. Oscillatory signatures of crossmodal congruence effects: An EEG investigation employing a visuotactile pattern matching paradigm. Neuroimage. 2015 Aug 1;116:177-86. doi: 10.1016/j.neuroimage.2015.03.067. Epub 2015 Apr 3. PMID: 25846580.
[7] Ostrowski J, Rose M. Increases in pre-stimulus theta and alpha oscillations precede successful encoding of crossmodal associations. Sci Rep. 2024 Apr 3;14(1):7895. doi: 10.1038/s41598-024-58227-z. PMID: 38570599; PMCID: PMC10991485.
Yugma Patel1, Delin Shi1,3, Elaine M Robbins1,2 , Adrian Michael2 , Xinyan Tracy Cui1,2,3,4
1Department of Bioengineering, University of Pittsburgh, Pittsburgh, PA, 2Department of Chemistry, University of Pittsburgh, Pittsburgh, PA, 3Center for the Neural Basis of Cognition, Pittsburgh, PA, 4McGowan Institute for Regenerative Medicine, Pittsburgh, PA
YUGMA PATEL
Yugma Patel is a senior Bioengineering student from Hillsborough, New Jersey. Her research interests include neuroengineering, drug delivery, and therapeutic discovery. After graduation, she plans to pursue a PhD in Biomedical Engineering.
DELIN SHI
Delin Shi’s research interest in Brain-Computer Interface developed during the clinical rotation as an intern doctor. Pioneer BCI studies have demonstrated its potential in neural rehabilitation. Foreign Body Response at the TissueElectrode Interface remains one of the most challenging obstacles before a chronically stable solution can be applied in clinical neural rehab. His long-term goal is to facilitate the translation of neural interface research to clinical application.
XINYAN TRACY CUI, PHD
Dr. Tracy Cui is William Kepler Whiteford Professor of Bioengineering at the University of Pittsburgh. Dr. Cui is the Director of the Neural Tissue/Electrode Interface and Neural Tissue Engineering Lab. She is also the Neural Engineering Track Coordinator for the Department of Bioengineering Graduate Committee. Prior to this, she was a Research Scientist at Unilever Research US in Edgewater, New Jersey.
ELAINE M. ROBBINS, PHD
Elaine Robbins received her bachelor’s degree in Biochemistry from American University in 2012 and her PhD in Analytical Chemistry in 2019 at the University of Pittsburgh under the study of Dr. Adrian Michael. Her previous work involved studying the dynamics of dopamine release and uptake in the brain using fast scan cyclic voltammetry and studying cortical spreading depolarization in traumatic brain injury model animals and in patients with microdialysis.




Implantable neural devices support medical research and treatment, but the implantation triggers an inflammatory foreign body response (FBR) that impairs their function. A biomimetic L1 protein coating, derived from brain tissue, can mitigate FBR, promoting healthier tissue integration and improving long-term device performance.
Keywords: Neural implant, Foreign body response, Biomimetic, Surface chemistry, Immunohistology
Abbreviations: Foreign body response (FBR); L1 Cell adhesion molecule (L1CAM or L1); Parylene-C (PC); 1-ethyl-3-(3-dimethylaminopropyl) carbodiimide (EDC); N-hydroxysuccinimide (NHS); Ethanolamine (ETH); Phosphate-buffered saline (PBS); Region of interests (ROI)
Implantable neural devices hold great potential for advancing neuroscience and treating neurological disorders, but their longevity is limited by the brain’s foreign body response (FBR), which triggers inflammation, glial scarring, and neuronal loss. Biomimetic coatings, such as L1CAM (L1), a neural adhesion molecule, have been shown to help mitigate these effects. This study examines EDC-NHS covalent chemistry to immobilize L1 on parylene-C (PC) insulated neural implants using a rat model. We analyzed brain tissue responses to four surface conditions: PC with EDC/NHS activation, PC with EDC/ NHS and L1, PC with EDC/NHS and ethanolamine, and PC with EDC/NHS, L1, and ethanolamine capping.
Results showed that while L1 containing groups did not significantly reduce inflammatory microglial and astrocyte activation, they significantly increased neuronal and neurofilament density, suggesting improved neuronal health. Notably, ethanolamine-capped surfaces heightened microglial response, indicating potential glial encapsulation exacerbation. Astrocyte activation showed no significant differences but varied locally, necessitating further study at later time points.
Our findings underscore the surface chemistry approach and tissue response, demonstrating L1’s positive effect on neuronal health while highlighting the need for optimized biomimetic strategies. This work enhances our understanding of biomaterial-tissue interactions and
contributes to improving the chronic performance of neural implants.
Neural devices are essential for understanding brain function and treating neurological disorders. Implanted in vivo, they enable precise electrophysiological and biochemical monitoring, advancing both research and clinical applications [1]. These devices help uncover mechanisms of memory, cognition, and motor control while also providing insights into conditions like epilepsy, Parkinson’s disease, and traumatic brain injury [2]. By detecting aberrant electrical activity or pathological changes in biochemical markers, they aid in disease characterization and progression monitoring. Clinically, neural implants have transformed treatment through deep brain stimulation (DBS) for Parkinson’s and braincomputer interfaces (BCIs) for prosthetic control [3]. However, implantation disrupts the blood-brain barrier, damages resident cells, and triggers an inflammatory cascade known as the foreign body response (FBR) [1]. This response is initiated by microglia and astrocytes, which release pro-inflammatory cytokines and form a glial scar that isolates the implant and impairs function [4,5]. Chronic inflammation exacerbates neuronal loss and degrades the device-tissue interface, limiting long-term performance in both research and clinical settings [1].
Surface modifications, such as anti-inflammatory coatings and bioactive molecule immobilization, offer potential strategies to mitigate FBR [6,7]. L1CAM (L1), a neuronal adhesion molecule, plays a key role in neural development, facilitating neurite outgrowth, regeneration, and neuroprotection while reducing gliosis [8,9]. Its properties make L1 an attractive candidate for biomimetic coatings to improve the biocompatibility of neural implants. L1 has previously demonstrated efficacy in mitigating the inflammatory response and promoting neuronal survival and adhesion as a coating on silicon-based neural recording electrodes and parylene-C insulated Utah array by promoting neural adhesion and reducing glial activation [7,10]. While we have previously attached L1 on parylene C coated implants, the protein attachment to an oxygen plasma activated surface is a combination of covalent bonding and physical adsorption [10]. To explore this further, we tested EDC/NHS linking chemistry known for facilitating amine-to-carboxyl binding to activate the surface of the parylene-C coated substrate for further covalent L1 binding [11]. In this work, we aim to investigate the effect of this EDC/NHS covalently linked L1 biomimetic coating on the FBR and neuronal health around parylene-C neural implants.
2.1 L1CAM extraction
L1 was extracted from homogenized rat pup brain tissue using affinity chromatography. Rat brains were
homogenized in Tris buffer with protease inhibitors, then centrifuged. The supernatant was passed through an affinity column with a specific NCAM-L1 antibody (745H7). The bound L1 was eluted, purified, and stored at -80°C.
Stainless steel wires (diameter 200 µm) were coated with Parylene-C (PC) to a thickness of around 8μm through chemical vapor deposition (CVD) process using SCS Labcoter 2 (PDS 2010) and then cut into 1cm segments.
PC-coated stainless-steel wires were functionalized to immobilize L1 using EDC/NHS crosslinking. Oxygen plasma treatment (10 min at 29.6 W) introduced carboxyl groups on the wire surface. For EDC/NHS L1 ETH group, wires were incubated in EDC/NHS solution (500/600 mM in PBS) for one hour, followed by PBS washing. Next, they were incubated in L1 solution (60µg/mL) for one hour, allowing covalent bonding between the NH2 groups of L1 with the NHS ester. Afterward, unreacted NHS esters were capped with 1M ETH leaving -OH groups on the surface. The wire samples for the other three groups were prepared by omitting selected treatment steps according to the desired chemical condition and washed with PBS three times before implantation.
2.4 In-Vivo
All animal work followed the University of Pittsburgh IACUC guidelines. PC-coated stainless-steel wires were implanted into a rat brain (n=1) to examine the effects of surface chemistry. Four chemical treatments were applied: EDC/NHS only, EDC/NHS L1, EDC/NHS ETH, and EDC/NHS L1 ETH (Figure 1). The four segments were implanted 3mm apart. During aseptic surgery, the rat was anesthetized with 2% isoflurane, and the skull was exposed and cleaned. A 2x10 mm cranial window was created, and the dura was carefully opened. The treated wires were implanted using a stereotaxic manipulator at ~0.5mm/s. Afterward, the window was sealed with Kwiksil and covered with UV-curable dental cement.

Figure 1. The four experimental groups and surface chemistry explored in this study to elucidate the effects of each reagent involved. EDC/NHS is used to functionalize the Parylene-C coating, L1 is the biomimetic coating, and ethanolamine is a blocking reagent used to cap the reactive NHS ester groups that did not covalently bind L1.

One-week post-implantation, rats were anesthetized and perfused with 4% paraformaldehyde. Brains were removed, sucrose-protected, frozen, and cryo-sectioned into 25 μm slices. Slices were rehydrated, treated with 10% normal goat serum and 0.1% Triton-X, and immunostained with primary antibodies: Hoechst (1:1000), NeuN (1:500), NF200 (1:500), Iba-1 (1:500), and GFAP (1:500). Stains were visualized using Alexa Fluor secondary antibodies (Figure 2 B,C,E,F)
Fluorescent images were captured at 20X magnification using confocal microscopy (Olympus Fluoview FV3000) to assess cellular responses around the implants. Identical laser power, exposure time, and detector settings were used for consistency across all images. Multi-channel images centered on the implant site were acquired simultaneously. Image analysis was performed using custom INTENSITY MATLAB scripts to measure pixel-based fluorescence intensity in the brain tissue surrounding the implants. A radial profile based on tissue morphology was used, creating thirty 15 μm wide concentric rings (0–450 μm from the center). For intensity-based analysis of Iba-1, NF200, and GFAP, the MATLAB script calculated and normalized the average gray scale intensity for each ring, above the background noise threshold. For cell counting analysis of NeuN, neurons were identified as regions of interest (ROIs) using Cellpose, and their center coordinates were calculated with ImageJ. These coordinates were binned by concentric rings to generate neuron density (Figure 2D)

2. Representative images of histology taken with confocal microscopy for each of the four experimental conditions (b), (c), (e), and (f). Representative binning of the images for analysis using 30 concentric rings for intensity-based analysis of Iba-1 in (a) and for cell-counting based analysis of NeuN in (d).
Two-way ANOVA and Tukey’s post hoc tests in GraphPad Prism were used to compare histology results across chemical conditions. Post hoc tests assessed both groupwise and individual bin-wise significance, with P<0.05 considered statistically significant.
This study investigates the effects of L1 biomimetic coatings on parylene-C insulated neural implants, focusing on inflammatory responses (microglia and astrocytes) and neuronal health (neurofilament and neuron density). Four treatment conditions were tested: EDC/NHS only, EDC/NHS L1, EDC/NHS ETH, and EDC/NHS L1 ETH. Four images were collected for each chemical condition. To analyze the resulting tissue response, we took the output from the MATLAB intensity-based analysis depicted in Figure 2 and plotted the intensity profiles for each group. The line plots (Figure 3) represent the average intensity of each bin at different distances to the implant center and indicate the relative spatial distribution of a certain cellular marker. Significantly increased intensity of Iba-1 and GFAP would suggest stronger inflammatory microglia and astrocyte activation respectively.
3.1
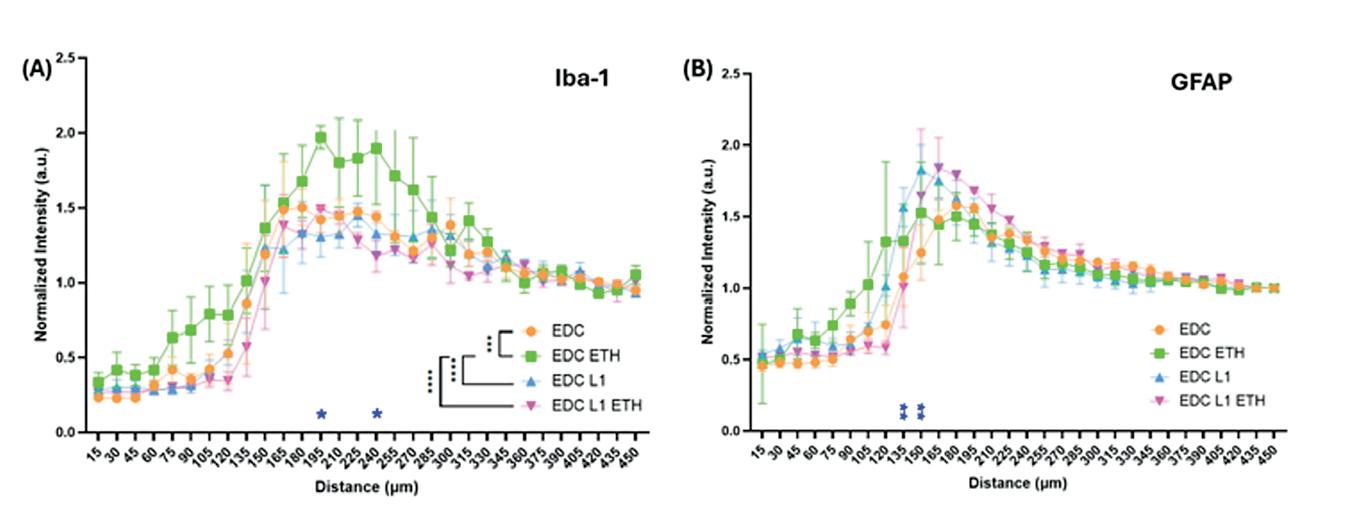
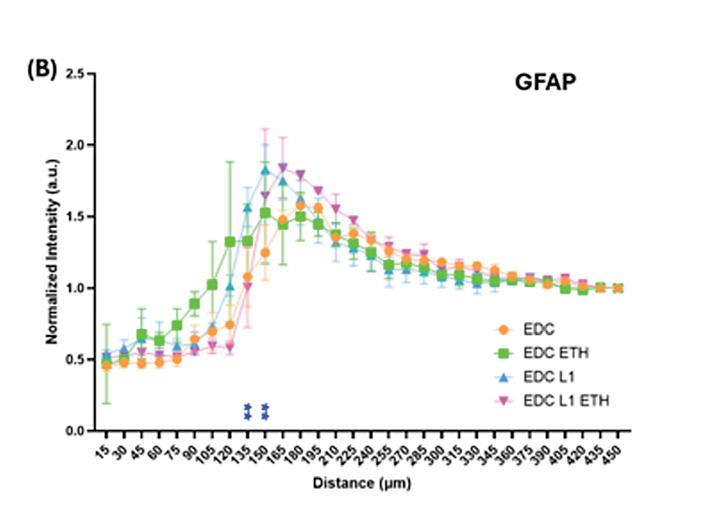
Figure 3. Quantitative histology results for Iba-1 and GFAP are reported as a function of distance from the implant site (mean intensity ± standard error). The black asterisk near the legend indicates group-wise significance from Two-way ANOVA with Tukey’s multiple comparison. (A) Normalized Iba-1 intensity shows that the EDC/NHS ETH group had significantly higher microglia activation than all other groups. The blue asterisk near the x-axis marks bin-wise significance between EDC/NHS ETH and EDC/ NHS L1. (B) Normalized GFAP intensity shows similar astrocyte presence across all groups. The blue asterisk near the x-axis marks bin-wise significance between EDC/NHS only and EDC/NHS L1. * p<0.05, ** p<0.01, *** p<0.005, **** p<0.0001.
Iba-1 marked microglia intensity (Figure 3A), L1-coated groups (n=4 images per group) (EDC/NHS L1 and EDC/ NHS L1 ETH) did not show a significant difference from the EDC/NHS only group (n=4 images). Surprisingly, the EDC/NHS ETH group (n=4 images) displayed significantly higher intensity than all other groups (EDC/NHS ETH vs EDC/NHS only, p=0.002; EDC/NHS ETH vs EDC/NHS L1,
p<0.0001; EDC/NHS ETH vs EDC/NHS L1 ETH, p<0.0001), suggesting that high-density -OH group on the surface promotes microglia activation. In individual bin comparisons, EDC/NHS ETH had significantly higher intensity than EDC/NHS L1 at bins 180-195 μm (p=0.0118) and 225-240 μm (p=0.0429). The results suggest that the EDC/NHS L1 ETH condition, where NHS esters predominantly bind to L1, leaves only a small percentage of unreacted groups capped by ETH. In contrast, in the EDC/NHS ETH condition, most NHS esters bind to ETH, creating a high-density ETH surface that significantly increases microglial activation. These findings indicate ETH capping can exacerbate the FBR, contributing to the formation of glial scars, a major component of the innate foreign body response to neural probes.
For GFAP-marked astrocytes (Figure 3B), there was no overall significant difference among the groups, although bin-wise comparisons revealed some significant differences. For example, the EDC/NHS L1 group was significantly higher than the EDC/NHS only group at bins 120-135 μm (p=0.0096) and 135-150 μm (p=0.0013). However, this trend was not consistent across all bins. The inconsistency may be since histology was performed one week after implantation, which could be too early for astrocytes to fully stabilize and exhibit their typical response. Future experiments with longer implantation times may provide more information on the astrocyte reaction and its role in long-term tissue healing.
Increased activation of microglia and astrocytes, along with more glial encapsulation, could lead to the degradation of the chronic functionality of implanted probes. As high-density ETH on the material surface is shown to increase immune response, future work should investigate the mechanism and consider the risk/benefit of having this capping step.
Neuronal elements health
For NF200 marked neurofilament (Figure 4A), the EDC/ NHS L1 group (n=4 images) showed significantly higher neurofilament growth than both the EDC/NHS only (n=4 images, p=0.0033) and EDC/NHS ETH groups (n=4 images, p=0.0192), indicating that L1 coating promotes neurofilament growth. Bin comparisons revealed significantly higher intensity for the EDC/NHS L1 group at bins 90-105 μm (p=0.0025), 105-120 μm (p<0.0001), 120-135 μm (p<0.0001), and 135-150 μm (p<0.0001), particularly at the implant-tissue interface. This suggests that L1 enhances neuronal adhesion and supports healthy neurofilament growth.
For NeuN marked neurons (Figure 4B), the EDC/NHS L1 group was significantly higher than the EDC/NHS only group (p<0.0001), and the EDC/NHS L1 ETH group (n=4 images) was significantly higher than both uncoated conditions (EDC/NHS only, p<0.0001; EDC/NHS ETH, p=0.0017). The EDC/NHS only group showed the lowest neuronal density, while the L1-containing groups exhibited higher neuronal density, indicating better neuronal health around the implant.
These findings suggest that L1 coatings could help address key limitations in neural implant design, such as chronic inflammation, glial scarring, and neuronal health, improving long-term functionality and reliability. L1’s versatility also holds promise for broad applications in neural device engineering. However, further investigation is needed to explore additional factors such as neuronal apoptosis, blood-brain barrier leakage, and microglial phenotypes.
This study evaluates an EDC-NHS coupling approach for immobilizing a biomimetic L1 protein on parylene-C insulated neural implants to improve biocompatibility. While the EDC-NHS-L1 group did not reduce the inflammatory response (microglia and astrocyte the EDC-NHS, it improved indicated by increased neurofilament and neuron density. High hydroxyl density on the surface, however, increased microglia activation and negatively
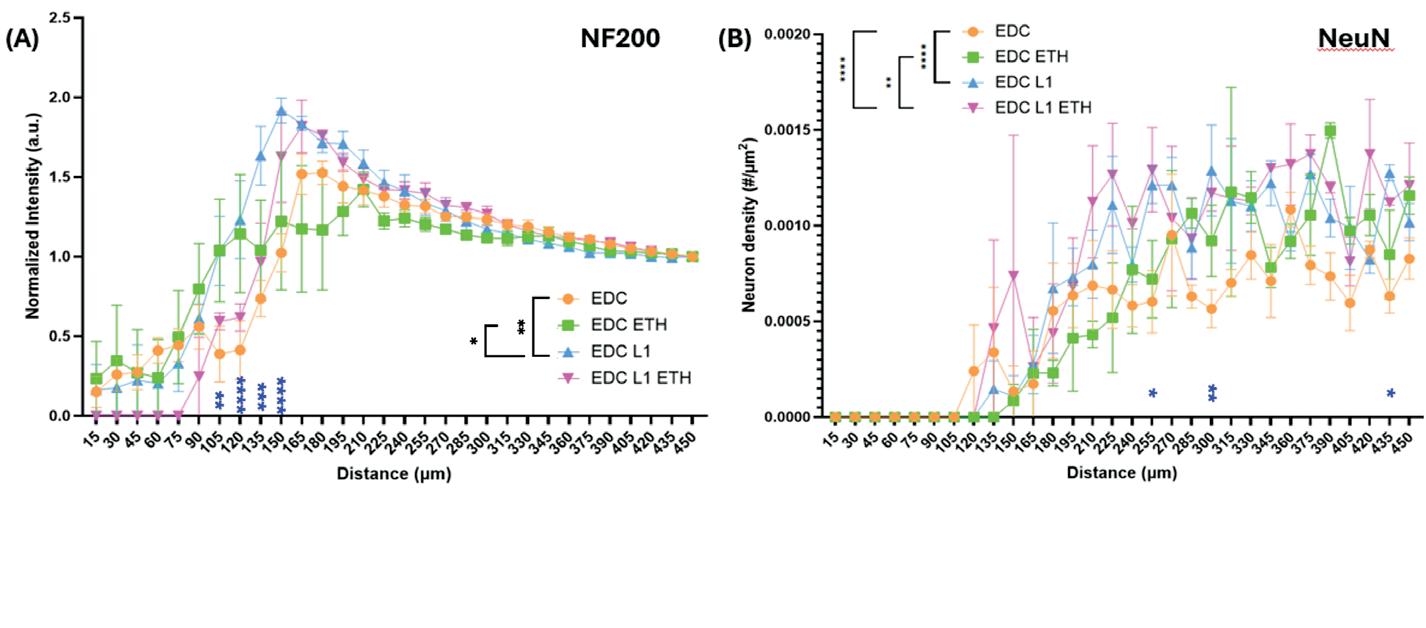
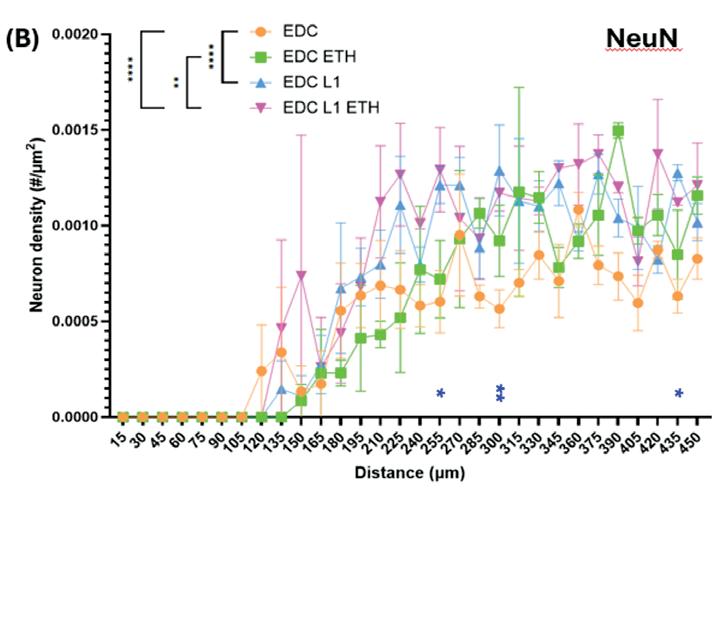
Figure 4. Quantitative histology results for NF200 and NeuN are reported as a function of distance from the implant site (mean intensity ± standard error). The black asterisk near the legend indicates group-wise significance from Two-way ANOVA with Tukey’s multiple comparison. (A) Normalized NF200 intensity shows the EDC/NHS L1 group has more neurofilament near the implant than other groups. The blue asterisk near the x-axis marks bin-wise significance between EDC/NHS only and EDC/NHS L1. (B) Normalized NeuN cell count shows higher neuronal density in L1-containing groups compared to non-L1 groups. The blue asterisk near the x-axis marks bin-wise significance between EDC/NHS only and EDC/NHS L1. * p<0.05, ** p<0.01, *** p<0.005, **** p<0.0001.

impacted tissue health. Limitations of the study include a small sample size (N=1 animal), lack of chronic time points and uncoated controls. Further histological analysis will help validate L1 coatings for enhancing the long-term biocompatibility of parylene-based neural implants.
This work was supported by funding (NIH T32 NS086749U01NS113279, R01NS102725), resources of the Neural Tissue/Electrode Interface and Neural Tissue Engineering Laboratory and the Department of Bioengineering at the Swanson School of Engineering.
[1] Adrien B Rapeaux, Timothy G Constandinou. Implantable brain machine interfaces: first-in-human studies, technology challenges and trends. Current Opinion in Biotechnology, Volume 72, 2021, Pages 102-111, ISSN 0958-1669, https://doi.org/10.1016/j. copbio.2021.10.001.
[2] Kozai TD, Jaquins-Gerstl AS, Vazquez AL, Michael AC, Cui XT. Brain tissue responses to neural implants impact signal sensitivity and intervention strategies. ACS Chem Neurosci. 2015 Jan 21;6(1):48-67. doi: 10.1021/cn500256e. Epub 2015 Jan 12. PMID: 25546652; PMCID: PMC4304489.
[3] Shepherd RK, Villalobos J, Burns O, Nayagam DAX. The development of neural stimulators: a review of preclinical safety and efficacy studies. J Neural Eng. 2018 Aug;15(4):041004. doi: 10.1088/1741-2552/ aac43c. Epub 2018 May 14. PMID: 29756600; PMCID: PMC6049833.
[4] Gao Z, Zhu Q, Zhang Y, Zhao Y, Cai L, Shields CB, Cai J. Reciprocal modulation between microglia and astrocyte in reactive gliosis following the CNS injury. Mol Neurobiol. 2013 Dec;48(3):690-701. doi: 10.1007/s12035-013-8460-4. Epub 2013 Apr 24. PMID: 23613214; PMCID: PMC4079114.
[5] Stice P, Muthuswamy J. Assessment of gliosis around moveable implants in the brain. J Neural Eng. 2009 Aug;6(4):046004. doi: 10.1088/1741-2560/6/4/046004. Epub 2009 Jun 25. PMID: 19556680; PMCID: PMC2813571.
[6] Delin Shi, Vaishnavi Dhawan, Xinyan Tracy Cui. Bio-integrative design of the neural tissue-device interface. Current Opinion in Biotechnology, Volume 72, 2021, Pages 54-61, ISSN 0958-1669, https://doi. org/10.1016/j.copbio.2021.10.003
[7] Asiyeh Golabchi, Kevin M. Woeppel, Xia Li, Carl F. Lagenaur, X. Tracy Cui. Neuroadhesive protein coating improves the chronic performance of neuroelectronics in mouse brain. Biosensors and Bioelectronics, Volume 155, 2020, 112096, ISSN 0956-5663, https:// doi.org/10.1016/j.bios.2020.112096
[8] Vance Lemmon, Kathryn L. Farr, Carl Lagenaur. L1mediated axon outgrowth occurs via a homophilic binding mechanism. Neuron, Volume 2, Issue 6, 1989, Pages 1597-1603, ISSN 0896-6273, https://doi. org/10.1016/0896-6273(89)90048-2
[9] Erdrin Azemi, William R. Stauffer, Mark S. Gostock, Carl F. Lagenaur, Xinyan Tracy Cui. Surface immobilization of neural adhesion molecule L1 for improving the biocompatibility of chronic neural probes: In vitro characterization. Acta Biomaterialia, Volume 4, Issue 5, 2008, Pages 1208-1217, ISSN 17427061, https://doi.org/10.1016/j.actbio.2008.02.028.
[10] Cody PA, Eles JR, Lagenaur CF, Kozai TDY, Cui XT. Unique electrophysiological and impedance signatures between encapsulation types: An analysis of biological Utah array failure and benefit of a biomimetic coating in a rat model. Biomaterials. 2018 Apr;161:117-128. doi: 10.1016/j.biomaterials.2018.01.025. Epub 2018 Feb 1. PMID: 29421549; PMCID: PMC5817007.
[11] Staros JV, Wright RW, Swingle DM. Enhancement by N-hydroxysulfosuccinimide of water-soluble carbodiimide-mediated coupling reactions. Anal Biochem. 1986 Jul;156(1):220-2. doi: 10.1016/00032697(86)90176-4. PMID: 3740412.
[12] Kozai, Takashi. (2015). INTENSITY Analyzer MATLAB .m Script Package with Sample Dataset v2.1.
[13] Stringer, C., Wang, T., Michaelos, M. et al. Cellpose: a generalist algorithm for cellular segmentation. Nat Methods 18, 100–106 (2021). https://doi.org/10.1038/ s41592-020-01018-x
[14] Alnasser, Y., Kambhampati, S. P., Nance, E., Rajbhandari, L., Shrestha, S., Venkatesan, A., Kannan, R. M., & Kannan, S. (2018). Preferential and Increased Uptake of Hydroxyl-Terminated PAMAM Dendrimers by Activated Microglia in Rabbit Brain Mixed Glial Culture. Molecules, 23(5), 1025. https://doi.org/10.3390/ molecules23051025
[15] Yu G, Zhang Y, Ning B. Reactive Astrocytes in Central Nervous System Injury: Subgroup and Potential Therapy. Front Cell Neurosci. 2021 Dec 23;15:792764. doi: 10.3389/fncel.2021.792764. PMID: 35002629; PMCID: PMC8733560.
Arushi Singh1, Yucheng Shen1, Noah Schweitzer1, Bistra Iordanova1
1Department of Bioengineering, University of Pittsburgh, PA
ARUSHI SINGH
Arushi Singh is a junior bioengineering student with a focus on imaging and signal processing. She is particularly interested in neural engineering and is passionate about researching neurodegenerative diseases, including Alzheimer’s, with the goal of advancing, understanding, and developing potential treatments.
YUCHENG SHEN
Yucheng Shen is a third-year PhD student in Dr. Iordanova’s Lab. She obtained her MA in Bioengineering from John Hopkins University. Her interests include advanced image analysis, wide-filed multispectral imaging and computational modeling of optical time-series data.
NOAH SCHWEITZER
Noah Schweitzer is a fifth-year PhD student in Dr. Iordanova’s Lab. He obtained his BA in Nuclear Physics from University of Wisconsin. His interests include preclinical multimodal brain imaging in both mice and humans, cross-species modeling and computational approaches for combining imaging and omics data.
BISTRA IORDANOVA
Bistra Iordanova is an Assistant Professor at the Department of Bioengineering. She received her PhD from Carnegie Mellon University. Her lab develops multimodal neuroimaging platforms to explore systemslevel neurovascular and metabolic events in the brain. The objective is to uncover and probe the mechanistic pathways behind the vascular and metabolic contributions to neurological disorders.




Alzheimer’s disease etiology is complex, and multiple factors affect its progression. Analyzing the function of brain capillaries in aged models of dementia can provide cellular level insight into the origins of dementia and deliver targets for early detection and treatment.
Keywords: Cerebral blood flow, in vivo two-photon imaging, Alzheimer’s disease, image analysis
Neurodegeneration associated with Alzheimer’s disease (AD) leads to disruption of neural function, cognitive decline, and dementia. The AD continuum spans decades beginning with prodromal brain changes that are unnoticeable by the affected person to obvious problems with memory and eventually physical disability. Which specific vulnerabilities drive the conversion from mild cognitive impairment to severe dementia are still unclear, however the consensus is that those are a combination of aging, decline in vascular and immune health, genetic susceptibilities and socioeconomic factors. Changes in cerebral blood flow (CBF) play a central role in the pathology of AD. These changes are accompanied by decreases in oxygen and glucose delivery to the tissues and this further impairs the neural circuits and slows down the clearance of noxious cellular waste. Analyzing subtle blood flow changes in the small blood vessels of the brain can provide cellular insight into vascular dysfunctions associated with AD. Because this cellular level data cannot be obtained in humans, we focused on mouse models of AD. We used longitudinal in vivo two-photon imaging through chronic brain optical windows to evaluate changes

in red blood cell velocity in the brain capillaries. We applied image processing algorithms to quantify the red blood cell velocity and probed the relationship between age and volumetric flow rate. The linear regression model of the normalized volumetric flow rate showed larger decrease across age in AD mice (p=3.24e-05) compared to wild-type mice (p=0.033). Our results indicate that early decrease in blood flow is evident in small blood vessels in the prodromal stages of AD prior to accumulation of hallmark proteinopathies. Our work suggests that improving cerebrovascular health during midlife can slow down the progression of dementia.
The pathology of Alzheimer’s disease (AD) involves multifactorial brain changes that drive neurodegenerative processes. Classic AD hallmarks are the buildup of beta amyloid and tau proteins with toxic effects to neurons and glia [1]. Tau neurofibrillary tangles advance AD by blocking synaptic communication and negatively affecting axonal transport [2]. Beta amyloid comes from the breakdown of the amyloid precursor protein (APP) making up fibrils which aggregate extracellularly. Concentrations of beta amyloid fibrils are referred to as plaques [3]. Amyloid plaques also accumulate in the arterial vessel walls and those are termed cerebral amyloid angiopathy known to impair perivascular drainage of brain waste [4]. In addition to these classic AD markers, other vulnerability factors such as age, sex, risk genes, immune and vascular health have been established in recent years, and their mechanistic contribution to neurodegenerative disease is still a topic of active research. Old age is a main risk factor that has been studied in relation to the disease as one in 10 humans over the age of 65 develops AD, and about seven million Americans 65 and older are living with AD in 2024. Total payments for all individuals with dementia sum up to $360 billion, not including the value of informal caregiving and the burden on the families [1].
Cerebral blood flow (CBF) decrease is an early pathological mechanism of AD, and this decrease has profound consequences on the brain metabolism as well as interrupting the amyloid plaque clearance from the extracellular tissue [5]. CBF delivers oxygen and glucose to active cells and plays a central role in brain function. The interactions between neurons, glia, and brain vessels to assure a proper blood supply to activated brain areas, is an important phenomenon commonly referred to “neurovascular coupling”. The underlying cellular and biophysical mechanisms are not fully understood. This is important because the dysfunction of specific populations of cells could have dramatic repercussions on the local blood flow and the energy supply to the brain. CBF in humans is commonly measured non-invasively with MRI and this approach delivers information primarily about the larger blood vessels due to the resolution constraints of the imaging modality. As a direct result, very little is known about what happens with CBF during aging in the
smallest blood vessels, the brain capillaries where oxygen and glucose exchange occur. Cerebral capillaries create a fine three-dimensional vascular network that supports the metabolic demand of active neurons and glial cells. Capillary density is greater in the cortical regions of the brain in which synaptic density is high, and neuronal populations congregate to form brain processing circuits [5]. One theory is that CBF decreases are first evident on this microscopic capillary level, in vessels with diameter around 10 microns where red blood cells move in single file [6]. Previously, we demonstrated that red blood cell velocity in the capillaries of AD mice is associated with the cerebral amyloid angiopathy load [7].
In this project, we used advanced image analysis of timeseries data collected from in vivo two-photon microscopy to analyze the association between capillary flow and age. We hypothesized that CBF in small blood vessels will decrease across age in AD mice at a greater rate than wild type mice. Previous studies of capillary flow decreases used primarily young AD animals and focused on neutrophil adhesion, VEGF signaling, and cerebral amyloid angiopathy [8,9,10]. Our study aims to specifically understand the relationship of CBF decrease with age, because aging is the largest risk factor for dementia. Information about capillary function across aging can provide novel insight into pathological AD drivers and identify therapeutic targets for vascular therapies.
All animal procedures were conducted in accordance with the National Institute of Health guidelines and with the approval of the University of Pittsburgh Institutional Animal Care and Use Committee. The mice were purchased from Jackson laboratory and housed with food and water ad libitum The AD transgenic mice (N=8, male and female) expressed human amyloid precursor protein and presenilin (APP/PS1) genes cloned from humans with familiar AD [11]. The transgenes were expressed on a B6C3 background. We used age and sex-matched B6C3 mice for control (N=10). Installation of chronic optical windows was done under ketamine/xylazine anesthesia (70/10 mg / kg). Once recovered, the mice were trained to spend time on head-fixed drum treadmills daily for two weeks. Mice were then imaged awake under a 16x objective lens using a multiphoton Ultima 2Pplus Laser Scanner ( Fig. 1a). We acquired longitudinal data from each mouse by scanning monthly between ages five to 18 months. An intraperitoneal injection of 2 mg/mL Sulforhodamine (SR101) (Thermo Fisher Scientific, 0.2 μL g−1) was used to label the brain vasculature and imaged with femtosecond pulsed laser tuned in at 920 nm ( Fig. 1b).

Figure 1. (a) APP/PS1 mice imaged with two-photon microscopy awake and head-fixed under the 16x magnification lense. (b) Maximum intensity projection of in vivo brain vasculature labeled with SR101.
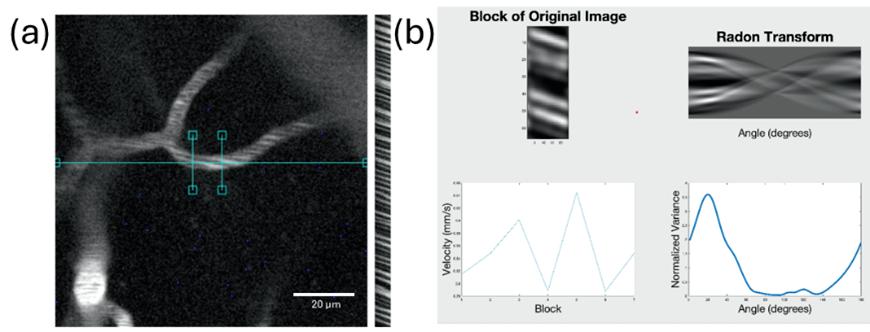
Figure 2. (a) An example of the field of view and line scan data. (b) The blood flow quantification approach analysis of the two-photon time series uses Radon transform that yields the angle of maximum variance used to compute the red blood cell velocity.
Repetitive scanning on the centerline of capillaries in the brain window produced line scan data used to measure red blood cell (RBC) velocity. Each imaging session acquired four to 10 line-scans (acquisition speed 833.34 Hz; pixel size 0.37 μm) of small vessels in the mouse brain with a maximum field of view of 1130 x 1130 µm. Layers 1 through 4 in the cortex were imaged up to 400 µm in depth. As the red blood cells flow through the capillaries during the imaging, streaks are produced in which the angle is a function of velocity ( Fig. 2a). The raw line scan strips of data were limited to blocks with lengths of 250ms. Any systematic errors in the images were removed by gaussian smoothing and background subtraction. To obtain the velocity for the imaged blocks, we applied Radon transform to get the angle of maximum variance ( Fig. 2b) [12]. The singular value decomposition method can also be used to estimate the velocity by shear and rotation of the images, but the Radon transform algorithm allows for a faster measurement of the streaming particles and is able to better differentiate the signal from noise [12]. The signal-to-noise ratio then further identified the angle producing a finalized velocity for each set of line scans. A region of interest (ROI) orthogonal to the vessel was manually drawn over the location where the line scan was collected as shown on Figure 3a . The vessel diameter was computed by using the full width at half maxima (FWHM) of the intensity profile summed over the ROI ( Fig.
3b). Using the capillary diameters and red blood cell velocity, we calculated the volumetric flow rate (Q, ml/sec) which incorporates the blood velocity (v) accounting for the diameter of the capillary. It is defined as the volume of blood per unit time traveling through an area (A), in our case the capillary cross section of a circle such that Q = Av.
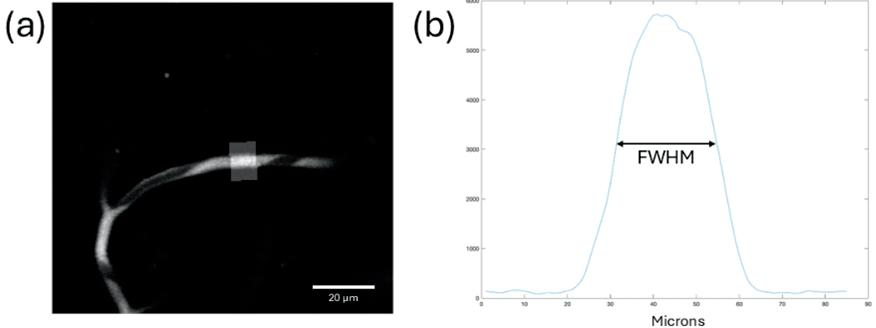
Figure 3. (a) An example of a two-photon image in the mouse brain with a rectangular vessel region of interest (ROI) used to compute the vessel diameter. (b) The corresponding vessel profile extracted from the ROI. The FWHM of this profile was used to compute the vessel diameter.
The linear regression model showed a significant negative relationship between age and volumetric flow rate (Q) ( Fig. 4). We normalized the volumetric flow rate distribution by taking log10 of the calculated Q values. In our AD mice analysis, the linear regression model produced an equation of Y= -0.050692x + 5.1918 with a significant p-value of 3.24e-05<<0.001. The negative slope of -0.050692 indicates that as AD mice age, the red blood cell velocity within the small vessels of the brain decreases. In our wild type mice analysis, we also saw a negative relationship of blood flow across age, however, with a less steep slope, lower intercept and smaller p-value than the AD mice. Our linear regression model in the control mice produced an equation of Y= -0.005324x+4.5785 with a p value of 0.0333. Our results demonstrate a significant negative correlation between CBF in capillaries and aging. Furthermore, we establish that as AD mice age, their CBF decline is greater than wild type mice which confirms our initial hypothesis of the comparison between AD and controls. Additionally, we observed an early compensatory rise in CBF in very young AD mice that steeply dropped below the CBF levels of the control mice by middle age. This drop of RBC velocity was observable in the brain capillaries before the appearance of cerebral amyloid angiopathy and amyloid plagues, and without any presence of neurodegeneration.

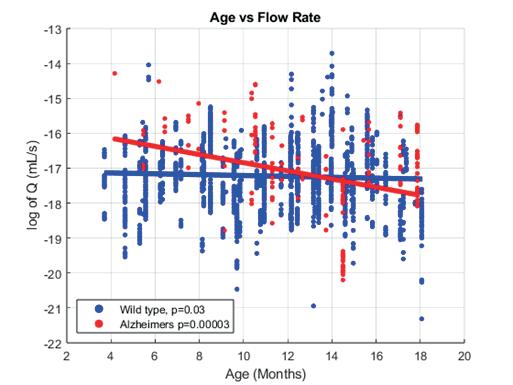
4. Cerebral blood flow in the brain capillaries decreases with aging with steeper drops observed in AD mice than age matched controls.
The brain has no significant energy storage and cellular activity evokes adaptive changes in the cerebral blood flow to deliver oxygen and glucose. For a long time, this phenomenon of tight neurovascular coupling was viewed as a top-down control by neuronal energy consumption [5]. As a result, vascular deficits during the progression of dementia were considered a mere byproduct of neurodegeneration. In contrast, emerging data from translational and clinical studies, as well as our own data indicates that cerebrovascular dysfunction in neurodegenerative disease cannot be simply attributed to neuronal degeneration and amyloid plaques. Instead, factors such as altered vascular signaling in the presence of aging and soluble amyloid, reduced waste clearance as well as metabolic shifts that generate free oxidative radicals may drive the early subtle declines of CBF that start the vicious cycle of plaque accumulation, neuronal damage and even more vascular dysfunction [13].
Through our findings, we can further explore the effects of blood flow on AD in various stages of aging. Sex is another important risk factor that has large implications on the development of AD. Women account for approximately two-thirds of the population diagnosed with Alzheimer’s [1]. Although women live longer than men accounting for life expectancy still leaves unexplained sex differences. In addition, AD manifests differently across the sexes with different rates of decline [14]. In our study we found no differences between males and females, likely due to the small sample size and we plan to address this question in a larger study. Other animal models such as marmoset monkeys have also been studied in relation to cerebral blood flow and therapies focused on the blood brain barrier (BBB) [15]. Cerebral blood flow is a significant factor in the functionality of the brain and affects all cells within the brain, not only neurons but also astrocytes and microglia. In future work, we will also analyze the microglial response to capillary obstructions throughout AD’s progression to establish how vascular dysfunction interacts with immune responses. Microglial
energy metabolism and motility are affected by cerebral blood flow and in ischemic conditions where blood flow is limited and RBC velocity decreases, microglia reduce their homeostatic functions [12]. The association of the APOE4 allele and sex increases the risk for AD. APOE is the gene most expressed in neurodegenerative microglia and when associated with sex can have an amplified impact on immunity as well as cerebrovascular function [16,17]. These cooperating factors can be linked to neurovascular dysfunction and decline of cognition of those at risk of developing AD.
Through quantitative image analysis, we evaluated the cerebral blood flow in the small brain vessels of mice across age and found that the volumetric flow rate of red blood cells decreases more rapidly in mice with Alzheimer’s compared to wild type mice. In this work we used animal models, however, this data can be translated to humans as well. The youngest mice’s data which was used in this analysis was four months and the oldest was 18 months. The approximate life span of mice ranges between 15-20 months in which the stages of the development of the disease occur more rapidly than humans, but the major milestones of aging are wellrecapitulated [18]. With similar neural structures and quick maturity, mice models are commonly used in biological research, specifically Alzheimer’s [19]. We were able to analyze changes in the capillary flow across the lifespan. Here we focused primarily on the somatosensory cortex, however capillary flow may be heterogenous across the brain and further studies can explore these regional differences. Additionally, due to light penetrance in the cortex, we have limited information on the subcortical areas of the brain. Our findings can serve as a basis for further analysis of other vulnerability factors such as sex and immune response. Efficient blood flow in capillaries is essential for nutrient exchange and neural functionality [20]. A significant decrease in CBF can further harm the brain networks and limit the immune response. Our study is essential for understanding the cellular drivers of vascular dysregulation leading to dementia in both men and women. The use of this knowledge can help earlier diagnosis, point at targets for personalized therapy and provide more accurate biomarkers for treatment monitoring in all humans.
Funding was provided by NIH RF1NS116450, the Swanson School of Engineering Summer Research Internship (SURI), and the Office of the Provost at the University of Pittsburgh.
[1] Alzheimer’s disease facts and figures. AAIC. (2024)
[2] National Institute on Aging. What Happens to the Brain in Alzheimer’s Disease? (2024)
[3] Seeman, P., Seeman, N. Alzheimer’s disease: β-amyloid plaque formation in human brain. Synapse, 65(12), 1289–1297. (2011)
[4] Greenberg, SM, et al. Cerebral amyloid angiopathy and Alzheimer disease — one peptide, two pathways. (2020) Nat Rev Neurol, 16, 30–42 (2020)
[5] Korte N, et al. Cerebral blood flow decrease as an early pathological mechanism in Alzheimer’s disease. Acta Neuropathol (2020)
[6] Ostergaard L, et al. The capillary dysfunction hypothesis of Alzheimer’s. Neuro Aging (2013)
[7] Shen Y, et al Red blood cell velocity in brain capillaries is associated with cerebral amyloid angiopathy load. Biomedical Optics (2024)
[8] Cruz Hernandez, et al. Neutrophil adhesion in brain capillaries reduces cortical blood flow and impairs memory function in Alzheimer’s disease mouse models. Nature Neuroscience (2019)
[9] Muhammad Ali, et al. VEGF signaling causes stalls in brain capillaries and reduces cerebral blood flow in Alzheimer’s mice. Brain, Volume 145, Issue 4 (2022)
[10] Bracko O, et al. Causes and consequences of baseline cerebral blood flow reductions in Alzheimer’s disease. Journal of Cerebral Blood Flow & Metabolism (2021)
[11] Jankowsky JL , et al. APP processing and amyloid deposition in mice haplo-insufficient for presenilin 1. Neurobiol Aging (2004)
[12] Drew P, et al. Rapid determination of particle velocity from space-time images using the Radon transform. Journal of Comp Neuro (2010)
[13] Santisteban MM, Iadecola C. The pathobiology of neurovascular aging. Neuron (2025)
[14] Arenaza-Urquijo EM, et al. Sex and gender differences in cognitive resilience to aging and Alzheimer’s disease. Alzheimers Dement. (2024)
[15] Parks, T.V. et al. Noninvasive disruption of the bloodbrain barrier in the marmoset monkey. Commun Biol 6, 806 (2023)
[16] Lane, R. et al, Functional Glial Activation Mediates Phenotypic Effects of APOEɛ4 and Sex in Alzheimer’s Disease. Neuroglia, 5(3), 323-343. (2024)
[17] Wierenga, CE, et al. Interaction of Age and APOE Genotype on Cerebral Blood Flow at Rest. Journal of Alzheimer’s Disease, 34 (4), 921-935. (2013)
[18] Zhong, M. Z., et al. Updates on mouse models of Alzheimer’s disease. Molecular neurodegeneration, 19 (1), 23. (2024)
[19] Webster, S. J., et al. Using mice to model Alzheimer’s dementia: an overview of the clinical disease and the preclinical behavioral changes in 10 mouse models. Front in genetics, 5, 88. (2014)
[20] Murrant, CL et al. Capillary communication: the role of capillaries in sensing the tissue environment, coordinating the microvascular, and controlling blood flow. American Journal of Physiology. Heart and Circulatory Physiology, 323 (5), (2022)
[21] Masuda T, et al. Capillary blood flow around microglial somata determines dynamics of microglial processes in ischemic conditions. Glia (2011)
Norah Stivala1, Goeran Fiedler 2
1Department of Bioengineering, University of Pittsburgh, Pittsburgh, PA, 2Department of Rehabilitation Science and Technology, University of Pittsburgh, Pittsburgh, PA
NORAH STIVALA
Norah Stivala is a junior majoring in Bioengineering with a Biomechanics focus. She is planning on participating in Pitt’s EAGR program in order to obtain a master’s in Mechanical Engineering. Following graduation, she hopes to obtain a job in industry where she will be able to design and develop new prosthetic devices.
GOERAN FIEDLER
Goeran Fiedler, Associate Professor at the Pitt School of Health and Rehabilitation Sciences, is also a credentialed Prosthetist and Orthotist. His research has the overall goal to find ways of raising the quality and quantity of prosthetic and orthotic device utilization, in order to realize outcome gains that are inexpensive to achieve and applicable to a large patient population. He enjoys working with talented and motivated students who are excited about entering the profession and inspiring the next generation of practitioners to employ scientific thinking and evidence-based practice to advance the field. Fiedler is also the faculty advisor to the Prosthetics and Orthotics Rehabilitation Technology Student Organization and Accessible Prosthetics Initiative.
Individuals with limb loss often suffer from PLP without a successful treatment method to combat the sensations. Vibrational stimulation within a prosthetic liner will be discussed as a potential therapy for PLP. A successful prototype may lead to a manufactured product to provide a convenient PLP remedy for amputees.
Keywords: Phantom Limb Pain (PLP), vibration pain therapy, artificial limbs, conductive connection


Phantom Limb Pain (PLP) is perceived in a limb that has been removed through amputation. The painful sensations can be described as burning, pounding, or stabbing pains in the absent part of the limb. Currently, many treatment methods for PLP are ineffective or involve substantial adverse side effects. As an alternative approach, our lab has constructed a vibrational liner prototype to conveniently, effectively, and safely combat PLP. Vibrational stimulation is thought to reduce PLP by mechanically stimulating the nerves in the residual limb. Stimulation distracts the nerves and prevents them from conveying painful signals to the brain. With vibrational motors integrated into an amputee’s daily liner, the vibrational therapy can relieve PLP quickly and conveniently. The prototype was constructed by hand with small vibrational motors integrated into a commercial liner. The study’s purpose was to test the effectiveness of this prototype and make improvements. The results regarding the prototype’s effectiveness were inconclusive due to technical difficulties, but future work should allow for more conclusive results.
With vascular disease, trauma, infection, and cancer comes an increased risk for amputation [1]. An estimated 2.1 million people in the United States alone experience limb loss [2]. In addition, there are already about 185,000 amputations occurring each year, but with the rising incidence of diabetes, limb amputation rates are expected to increase in the future as more people develop vascular conditions [2][3].
Even after a painful amputation and long recovery period, individuals with limb loss may still experience pain in their amputated limb [4]. This phenomenon is known as phantom limb pain (PLP). According to some studies, about “60-80 percent of amputees experience phantom limb sensations” [1]. Unfortunately, many cases of PLP cannot be effectively treated. Current treatment options include harsh opioid drugs, Transcutaneous Nerve Stimulation (TENS), and mirror therapy [1]. However, these methods have proven to be inconsistently successful or be associated with severe side effects, causing additional health problems [4].
To develop a more effective and non-addictive therapy, our research investigates the utility of mechanical stimulation
through vibration to decrease or eliminate PLP. In a previous study by T. Lundeberg in Sweden, 24 participants were given vibratory stimulation on their residual limb and 75% of the participants reported pain reduction [5]. The promise of these results provided motivation for the construction of our vibrational liner design. Leveraging the circumstance that many prosthesis users already use suspension liners, our approach entailed embedding vibration hardware into such a liner to provide convenient and effective relief from their PLP sensations without any harmful side effects.
Early prototypes created by our lab serve as proofof-concept but revealed several technical challenges including fixating the motors within the liner, avoiding damage to the power and control wires, and determining the best liner material to work with [6][7]. First attempts to keep the motors within a liner included hand-sewing them in, but this proved to be tedious and unsuccessful. Using Sil-Poxy to hold the vibrational motors within the silicone liner wall proved to be the best technique [7]. Powering these motors was difficult as wires embedded in the liner wall were frequently failing from the repeated bending inherent to typical use of the liner. To create a wire-free electrical connection, sliding contacts on the outside of the liner and the inside of the container socket were devised (Figure 1) [7]. Much of the wiring was moved to the rigid outer socket with only very short wires tunneled through the thin silicon layer between the vibration motor and the conductive fabric patch that represents the contact on the liner side (Figure 1). A connection was established simply by donning the liner in the usual fashion and sliding it into the socket in the proper orientation and depth, something helped by the congruency between socket and limb shape (Figure 1) [7]. The most effective liner material for integrating these motors was silicone since the gel liners were more difficult to place the motors in [7].
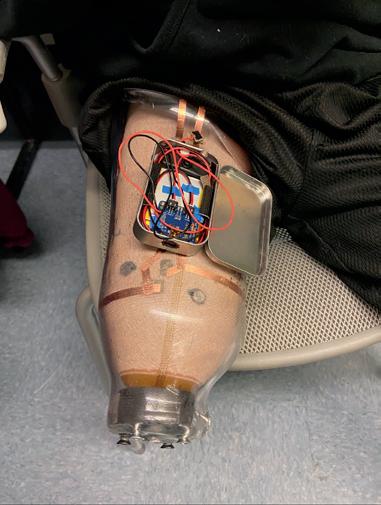
the
Iterative prototype improvement resulted in a functioning device that allowed for initial user testing but required further refinements discussed here. Specifically, we aimed to (1) Reduce vibration damping caused by the plastic
socket, (2) Optimize the number of motors and their locations, (3) Create a more consistent connection between power source and liner, and (4) Test and improve the effectiveness of the device.
2.1
A modified socket was designed with small pockets embedded in the plastic where stronger versions of the earlier prototypes’ motors may sit and vibrate the plastic itself (Figure 2)
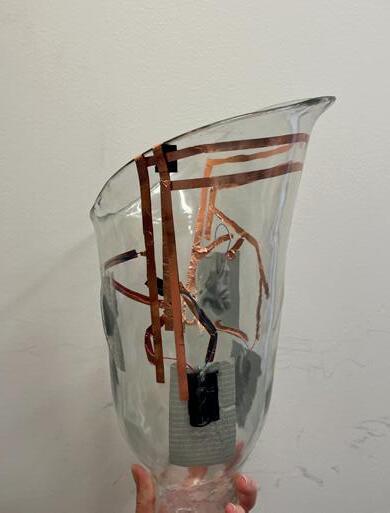
Figure 2: Showcases the prosthetic socket where the motors are integrated within the plastic socket itself. The cylindrical motors are the black rectangles seen on the inside of the plastic and the copper tape showcases how the electrical connection was made to the batteries.
Ideally, vibrating the entire socket would enable the user to feel the strength of the vibrational motors. To create this socket, 3D printed dummy models of cylindrical toothbrush motors were created to be placed into the plaster model the plastic socket would be thermoformed over (Figure 3). This was done as a separate experiment from the liner in order to see if there were positive results, but no extensive testing was done.

Figure 3: Shows a progress picture taken while creating the socket with motor pockets. The 3-D printed motor replicas are the rectangles embedded into the plaster and the hard, outer shell was created by thermoforming.

Participants were recruited from the local prosthesis users’ population and custom liner protypes were created for each participant in the study. The participants were required to be above 18 years old, free from any heart conditions or nerve disease in their limbs, had amputation at least six months ago, have no open wounds or sores on the non-amputated leg, not be allergic to gel or silicone, and had to have a history of PLP. The study protocol was approved by the University of Pittsburgh IRB, and all participants provided informed written consent.
To optimize the number of motors and their locations, a singular, cylindrical motor was repeatedly placed at various lateral, medial, posterior, and anterior positions on each participant’s residual limb. The participants provided feedback regarding the preferred locations by rating the sensitivity on a scale from 1 (least) to 5 (most). Placement locations were standardized across participants as much as possible and the most sensitive locations were documented based on similar areas that were sensitive between the participants.
The prototypes used five DC coreless motors with built-in vibration that were 7 mm in diameter and 25 mm in length with a voltage range of 1.5-3 volts and a frequency range from 8000-16000 RPM. These motors are known for their typical use in an electric toothbrush. These motors were embedded at the optimized locations determined from the motor placement testing.
To embed the motors, small scissors were utilized to cut into the outer layer of the commercial standard liner (Seal-in, Ossur, Reykjavik, IS, and Smarttemp, WillowWood, Sterling, OH). It was important to cut only as deep as necessary to insert the motors and avoid cutting through the silicone layer of the liner. Once a rectangular-shaped cavity about the size of the motors was created, Sil-Poxy (Smooth-On, East Texas, PA) was placed into the cavity along with the motor and then a black felt covering was placed on top (Figure 4). This ensured the silicone layer would hold the motor in place since Sil-Poxy is one of the few materials that bonds with silicones.
In order to power each motor, two patches of conductive hook and loop material (Adafruit, Brooklyn, NY) were placed into the liner in the same fashion the motors were (Figure 4). The positive and negative wire tips were covered in conductive quarter inch thick copper foil tape (Meideal brand, Amazon.com) and placed underneath the conductive patches. A battery pack was attached to a conductive wrap consisting of two strips of copper tape to activate the motors when in contact with the conductive hook and loop patches (Figure 4). In this prototype, unlike the earlier ones, the wires remained on the outside of the liner to account for the scattered location of the embedded motors.
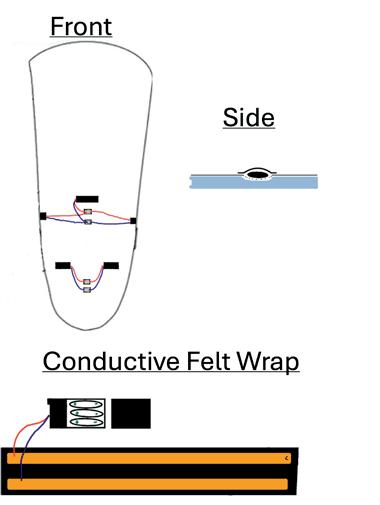
Figure 4: Describes a schematic of the constructed prototype. The black rectangles are the larger motors integrated into the liner with the red and blue lines showcasing the electrical connections to the conductive hook and loop seen above as small grey rectangles. The side profile image shows how the motors were placed into the silicone lining. The conductive felt wrap shows the battery pack and its attached conductive wrap that would go around the liner to power it.
To ensure there were no detrimental effects associated with the prototypes, participants were asked to complete four in-lab testing sessions. During these sessions, the participants activated the vibration for two 10-minute durations with a break in between (Figure 5). After it was determined, by self-report, that no discomfort was felt by the participants, the next stage of testing began.

After the in-lab testing, the participants were asked to take their prototypes home with them. The at-home trial lasted between 10 and 30 days depending on logistics limitations. While at home, the participants were asked to wear the prototype whenever they experienced PLP and were able to utilize their vibrational liner while sitting. During any of these PLP episodes, the participants filled out a data collection sheet to describe the level of their pain before and after using the prototype on a scale from 0-10 as well as the duration they utilized the prototype for. The data was analyzed using descriptive statistics to compare outcomes with and without the vibration liner.
All participants were males between 50 and 65 years old, with a K-level of 3, and at least eight years of experience using a prosthesis.
3.1 Vibration Damping Caused by the Plastic Socket
While we were able to test the socket, the pockets created were not effective since they were not deep enough to hold the motors in place as intended. In addition, when briefly tested with a participant it was determined the vibration damping was similar to the damping that occurred with the liner.
3.2 Optimized Number and Locations of Motors
Participant feedback during the motor placement testing indicated there was a consistent area on the residual limb described as “most sensitive”. The hamstrings, no matter the amputation level, appeared to be the most sensitive to vibration (Figure 6). Therefore, when utilizing vibration therapy for PLP it may be beneficial to direct vibration toward these locations for optimized treatment.

3.3 Connection Between Power Source and Liner
The electrical connection between the power source and the liner was determined to be insufficient, only inconsistently powering the liner. The original prototype’s electrical connection continued to be utilized, with wires on the outside of the liner. This sustained the known problem of wires breaking. These incidental findings became apparent during in-lab testing when, infrequently, some motors would stop working and connections needed to be repaired.
The at-home trial portion of the study did not produce conclusive data to determine whether the prototype was effective with the improvements. Two of the participants were unable to use their prototypes since those broke down quickly. Participant 3 claimed the vibrational liner was soothing, but did not necessarily resolve his PLP. The same participant also mentioned his PLP sensations are very short in duration, and he did not often don the liner before the pain had already subsided. Participant 4
did not experience any pain relief, though he speculated the prototype may have lessened the length of time he experienced PLP (Figure 7).
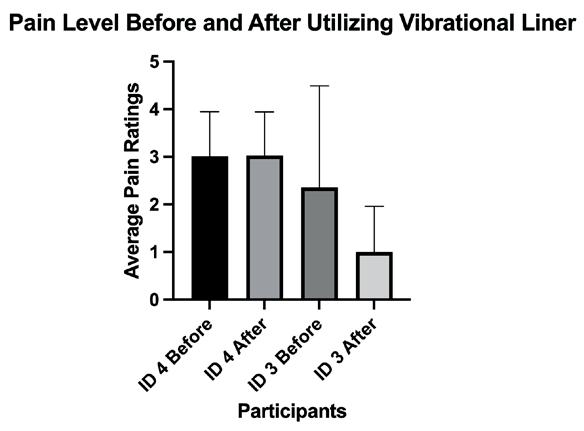
Figure 7: PLP level before and after using the vibrational liner for each participant. The pain level was averaged for each participant over the time they had the prototype at home. Standard deviations shown. No statistical significance was found.
The here described iteration of prototype development for a vibration liner yielded notable progress in some areas and eliminated unsuccessful detail solutions in others. The lack of success with embedding vibration motors into the socket wall informed timely abandonment of this approach and subsequent focus of the development on improving the liner.
The motor placement testing protocol was successful and may allow for a clinically viable method in optimizing individual liner configurations. Future vibrational liner prototypes may only include vibration in the most sensitive location to help avoid technical complexity without limiting effectiveness. Furthermore, the stronger motors utilized in these prototypes produced a more effective vibration therapy when no connection issues were present.
Unreliable electrical connections prevented some participants from properly testing the prototype. Overall, the decreased vibration participants were experiencing when using the prototypes may have prevented successful vibrational therapy from being delivered. Even so, feedback was largely positive, and participants seemed to be optimistic about the prototype. To improve reliability of the device, future work may include industrial-grade manufacturing methods to make it more durable.
It can be concluded the location on the residual limb most sensitive to vibration therapy lies near the hamstrings. In addition, while large vibration amplitudes are preferrable for PLP mitigation, even attenuated vibration is providing some beneficial effects in the assessment of users. Other definitive conclusions concerning the effectiveness of the vibrational liner were preempted by technical difficulties and the unpredictable nature of PLP occurrences.

Funding was provided by the Swanson School of Engineering, the Office of the Provost at the University of Pittsburgh, and the Department of Bioengineering. The authors thank Bob Maguire and Kacey Roehrich for their invaluable support.
[1] A. Kaur and Y. Guan, “Phantom limb pain: A literature review,” Chinese Journal of Traumatology, vol. 21, no. 6, p. 366, Dec. 2018, doi: 10.1016/J.CJTEE.2018.04.006.
[2] Amputee Coalition, “Limb Loss in the U.S.”, Feb. 22 2024, https://www.amputee-coalition.org/amputeecoalition-research-article-published-in-notableorthopedics-journal/
[3] “National Diabetes Statistics Report”, July 21 2024, https://www.cdc.gov/diabetes/php/data-research/ index.html
[4] H. Flor, “Phantom-limb pain: Characteristics, causes, and treatment,” Lancet Neurology, vol. 1, no. 3, pp. 182–189, Mar. 2002, doi: 10.1016/S1474-4422(02)00074-1.
[5] T. Lundeberg, “Relief of pain from a phantom limb by peripheral stimulation,” J Neurol, vol. 232, pp. 79–82, 1985.
[6] B. Perry, G. Fiedler, and K. C. Quinn, “Vibratory Devices for Phantom Limb Pain,” US 11 577 045 B2, Feb. 14, 2023
[7] Roehrich K, Goldberg M, Fiedler G. “Robotic-Enhanced Prosthetic Liners for Vibration Therapy: Reducing Phantom Limb Pain in Transfemoral Amputees,” Sensors, vol. 24, no. 15, p. 5026, Aug. 2024, https://doi. org/10.3390/s24155026
Ryan Vidal1, Yiquan Wang1, Yue Zhang1, Xiayun Zhao1
1Department of Mechanical Engineering and Materials Science, University of Pittsburgh, Pittsburgh, PA
RYAN VIDAL
Ryan Vidal is a first-generation senior Mechanical Engineering student at the University of Pittsburgh. His research interests include aerospace design, additive manufacturing technology, and simulation testing. Post undergrad, he intends on pursuing a graduate degree in Aerospace Engineering.
YIQUAN WANG
Yiquan Wang is a Mechanical Engineering PhD student at the University of Pittsburgh and a graduate student researcher for the ZXY Intelligent Precision Additive Manufacturing (ZIP-AM) Laboratory. She received her BS in Mechanical Engineering at Xi’an Jiaotong University followed by an MS in Computer Control & Automation at Nanyang Technological University. Her areas of research focus on photopolymerization additive manufacturing and material science.
YUE ZHANG
Yue Zhang is a Mechanical Engineering PhD student at the University of Pittsburgh and a graduate student researcher for the ZXY Intelligent Precision Additive Manufacturing (ZIP-AM) Laboratory. She received her BS at the Sichuan University-Pittsburgh Institute (SCUPI). Her areas of interest focus on photopolymerization additive manufacturing, ceramic 3D printing, and materials science.
XIAYUN ZHAO, PHD
Dr. Xiayun Zhao is the director of the ZXY Intelligent Precision Additive Manufacturing (ZIP-AM) Laboratory at the University of Pittsburgh and an assistant professor for the Department of Mechanical Engineering and Materials Science. She received her BS in Precision Engineering - Measurement Science and Control Technology from Tsinghua University and completed her PhD in Mechanical Engineering at the Georgia Institute of Technology. Her research areas focus on additive manufacturing, measurement science, process control, cyber-physical systems, and precision engineering.




Photoinhibition in Vat Photopolymerization Additive Manufacturing (VPP-AM) inhibits polymerization curing to improve printing quality and provide better control to the user. However, current information on how this phenomenon impacts the thickness and quality of each print layer remains limited. Greater understanding would assist in optimization and application of VPP technology.
Keywords: Photoinhibition, Photopolymerization, Curing, Inhibition
Abbreviations: Vat Photopolymerization (VPP), Additive Manufacturing (AM), Stereolithography (SLA), Ultraviolet (UV), Degree of Cure (DoC), Time of Flight (ToF), Dual Light Projector (DLP), In-Situ Ultrasonic Monitoring (IUM)
Vat Photopolymerization (VPP) is an Additive Manufacturing (AM) process that applies light to cure a photopolymer resin in sequential layers. Common VPP methods utilize a singular light source, but in our approach a dual light projector (DLP) merges a blue and Ultraviolet (UV) light for printing. Blue light initiates the photopolymerization curing reaction, while UV light acts as an inhibitor. This phenomenon is known as photoinhibition, where the ratio of blue light to UV light intensity is the inhibition ratio. Photoinhibition enables better control during the printing process. Past studies have explored photoinhibition’s overall effects but lack focus on its effects on layer thickness and quality. To discover the effects photoinhibition has on layer thickness we conducted three experiments printing samples with different inhibition ratios. We used In-situ ultrasonic

monitoring (IUM) to collect data during printing and analyzed the data by looking at the time of flight (ToF) of each sample. The data from the ToF graphs and quality of the three printed samples pointed towards a correlation between photoinhibition levels and material thickness.
In 1987, 3D Systems pioneered additive manufacturing (AM) with stereolithography (SLA), an AM process that utilizes an ultraviolet (UV) light laser to solidify thin layers of light-sensitive liquid polymer resin [1]. Since SLA’s introduction to the world, its usage has expanded rapidly, leading to the development of additional forms of AM [1]. VPP is an advanced AM process that utilizes light to cure a photopolymer resin in a vat to build the desired product in successive layers [2]. When exposed to light, photopolymerization reactions are initiated, causing small monomers in the resin to crosslink and form chain-like polymers [2]. This process is known as polymerization, and the extent of curing is measured in the degree of cure (DoC) [2, 3].

Compared to alternative AM methods, VPP offers rapid, highly accurate and smooth-surface-finish prints, making it ideal for prototype manufacturing, tooling, and production of high-precision components [4]. Consequentially, many industries use this technology to produce complex items such as artificial organs in the biomedical field [5].
Our VPP printer uses a moving print head to cure the resin. After each layer is cured, the platform moves upwards to make room for the next layer. The printer utilizes a dual light projector (DLP), which implements two different light sources for curing: an ultraviolet (UV) light and a blue light. Figure 2 below displays a simplified diagram of how the printer works.
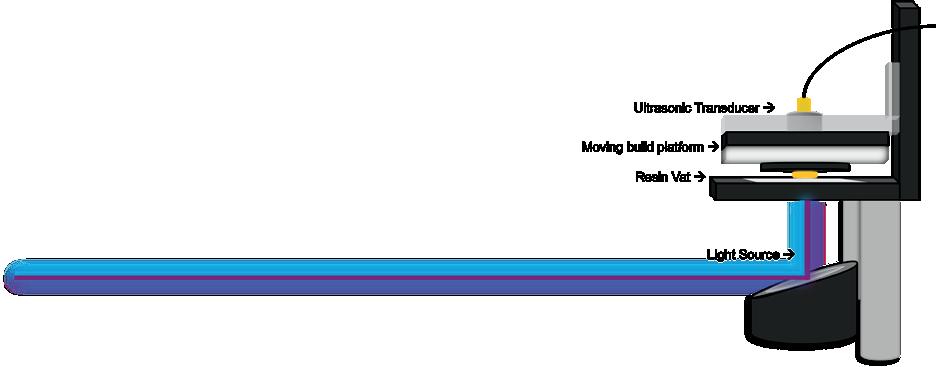
The two different lights serve different functions. The blue light initiates the photopolymerization reaction while the UV light inhibits the reaction [6]. Together they form the inhibition ratio:

where IUV is the UV light intensity and IBlue is the blue light intensity. This phenomenon of using a light to inhibit photopolymerization is known as photoinhibition. [6]
Interfering with curing in a curing-based printing process may seem counterintuitive but it offers significant benefits. Photoinhibition enables greater control over the curing process by slowing down the polymerization reaction using UV light, ensuring a more uniform reaction throughout the print [6]. This, in turn, enhances the final material properties and reduces the risk of over-curing. Ultimately, with photoinhibition, the DoC and material properties of the final print depend on the inhibition ratio.
Numerous studies have monitored how different ratios of photoinhibition alter print quality, but very few have investigated its effects on layer thickness. A better understanding of photoinhibition’s effects on layer thickness and sample properties would help optimize VPP printing in all fields of engineering.
Non-invasive monitoring techniques, such as in-situ ultrasonic monitoring (IUM), provide insight into photoinhibition’s effects on layer thickness. IUM functions similarly to echolocation in bats as shown below, emitting ultrasonic waves from a transducer and receiving the waves after they reflect off the end of the printed object [2].
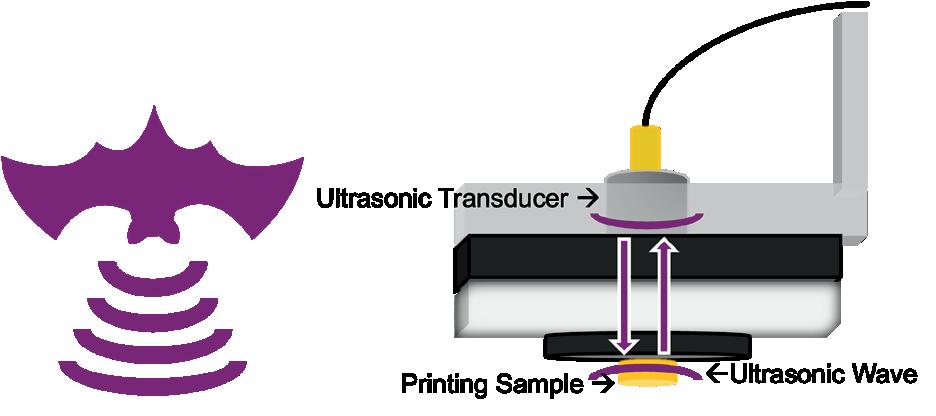
The time it takes for the wave to travel from the transducer to the sample and back is referred to as the time of flight (ToF) [2]. For each layer, multiple pulses are sent out to give accurate, real-time data [2]. As the sample thickens, the ToF steadily increases. Once the final ToF is measured, overall sample thickness can be calculated using: (2)

Where t is overall thickness and C l is longitudinal wave velocity [2]. Layer thickness can be calculated following a similar model: (3)

Where tlayer is current layer thickness, ToFlayer n is ToF of the current layer, and ToFlayer n-1 is ToF of the previous layer. Note that the ToF represents the time for the ultrasonic wave to travel through the entire sample.
2.1
Three different inhibition ratios were selected, with one blue light intensity as the control variable and three varying UV intensities as the independent variables. An optical power meter (PM400, Thorlabs, NJ, USA) was used to measure the curing lights power. Light intensities were selected by modulating the gray-scale values of an 8-bit projection image mask [2]. These greyscale values range from 0 (black) to 255 (white) [2]. For this experiment, the blue light mask was set to 140 and the three UV greyscale values were 150, 250, and 0, respectively.

4: (From left to right) Blue 140 Grayscale, UV 150 Greyscale, UV 250 Greyscale, UV 0 Greyscale
The diameter of projected mask, measured by a caliper, was found to be 0.8220 cm, translating to a light area of 0.5306 cm2 . The measured curing light powers were divided by this area to calculate the curing light intensities (mW/cm2). Using equation 1, the three inhibition ratios were determined.
Table 1: Curing Light Intensities and Inhibition Ratios
The inhibition ratios for the three experiments are 0.9882, 1.1363, and 0 respectively. The inhibition ratios for the three experiments are 0.9882, 1.1363, and 0, respectively.
Resin production started with mixing 10 g of Triethylene glycol dimethacrylate (TEGDMA; Esstech Inc., Essington, PA) with 10 g of bisphenol A glycidyl methacrylate (bisGMA, Esstech) to produce a mixture with 50 % weight (wt %) TEGDMA and 50 wt % bisGMA [6]. In a separate container 0.04163 g of Camphorquinone CQ (Esstech), a blue-light active photo-initiator [6]; 0.10384 g of ethyl 4-(diethylamino)benzoate (EDAB; Esstech), a co-initiator [6]; 0.62305 g of 2,2’-Bis(2-chlorophenyl)4,4’,5,5’-tetraphenyl-1,2’-biimidazole (o -Cl-HABI, TCI America, Portland, OR), a photoinhibitor [6]; and 1.45378 g of tetrahydrofuran (THF; containing 0.025% butylated hydroxytoluene as preservative; Fisher Scientific, Hampton, NH) [6] were combined to form a monomer mixture consisting of 0.2 wt % CQ, 0.5 wt % EDAB, and 3.0 wt % o -Cl-HABI. Due to o -Cl-HABI poor solubility it was dissolved in THF to form a 30 % wt solution prior to mixing in the CQ and EDAB.
The monomer mixture was then poured into the bisGMA/ TEGDMA solution and stirred together until it reached a homogeneous state. Finally, a vacuum seal was used to remove any unwanted air bubbles and a stir bar finalized stirring.
Figure 5 shows the in-situ resin printing setup. The UV and Blue light converge in a reflective box to form the DLP beam, which is directed towards a slanted mirror to reflect onto the resin vat. A total of 2.5 mL of resin was poured into the vat, and the moving print platform was lowered until it contacted the resin. A small mirror placed below the vat was used to check for potential air bubbles forming from the print head touched the resin. The Ultrasonic Transducer is connected to the oscilloscope to gather real time data, which is then uploaded to a computer. The data is then processed and analyzed using MATLAB.
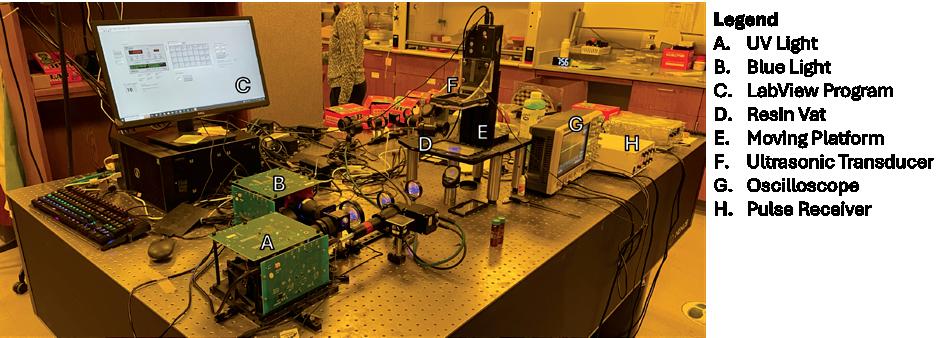
Figure 5: Experiment Setup
A LabView program controls both the DLP and the printing platform. Specifically, it controls: Layer on Time (ms), Layer off Time (ms), Layer Thickness (mm), Layer Max Velocity (mm/s), Layer Acceleration (mm/s2), Blue Light Mask, and UV Light Mask. For each sample all settings remain constant except for the UV layer image. The layer on time is longer for the first layer to give the print a sturdy

foundation to build on, ensuring structural integrity. While layer thickness is predefined in the system, alternating layer thicknesses are expected between the samples.
Table 2: Print Settings for Sample 1
After printing, the three samples exhibited significantly different appearances. As shown in Figure 6A , sample 1 retained a consistent round shape but failed to cure in the middle forming an almost donut-like appearance. Sample 2 (Figure 6B) cured poorly, leading to unstable integrity and an inconsistent shape. Sample 3 (Figure 6C) demonstrated the performance, printing a very strong and sturdy round shape. A Keyence machine measured the thicknesses in a noninvasive manner to prevent sample damaging and give precise imaging of the deformities. Sample 1 printed a final thickness of 2.578 mm, sample 2 printed 0.986 mm, and sample 3 printed 3.597mm.

In-situ data from each print was analyzed in MATLAB to track ToF changes across 20 layers. The first two amplitude spikes in all three plots remained constant due to interference from the print head. The third spike, caused by the sample, shifted further away as ToF increased with increasing thickness. Initial ToF values differed per sample, with smaller ones indicating thinner layers and vice versa.
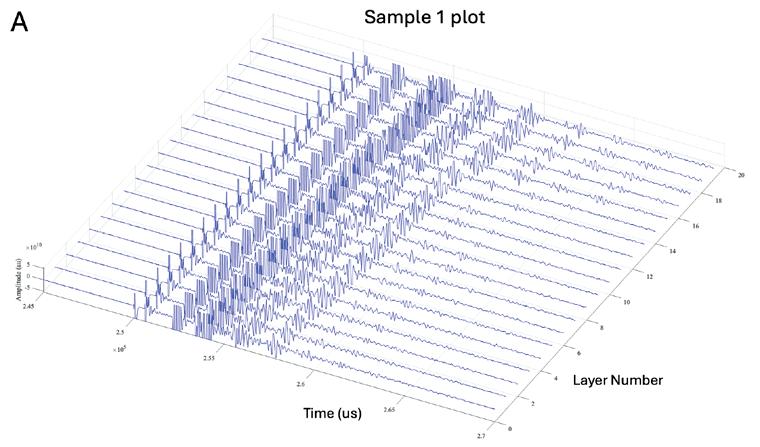
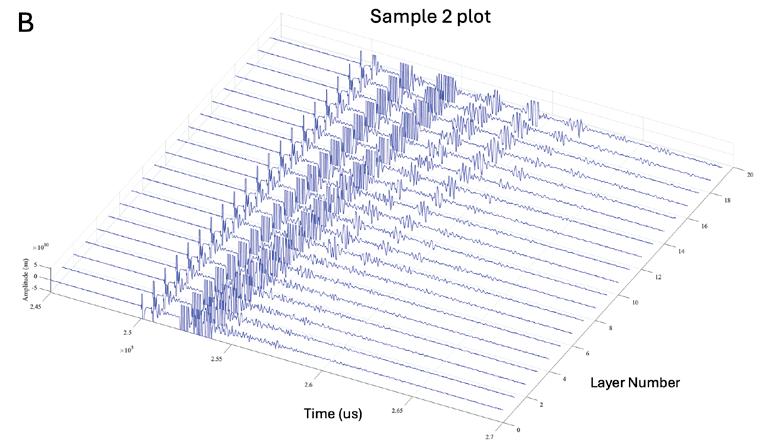


The variation in thickness and quality across all three samples indicated a strong correlation between thickness and inhibition ratio. As shown in Figures 6C and 6F, Sample 3, with the lowest inhibition ratio (0), delivered the best results, maintaining a uniform circular shape and the greatest thickness. Figure 7C reinforces this, with the large ToF indicating thick layers with this low ratio.
In contrast, Sample 2, with the highest inhibition ratio (1.1362) created very poor print integrity and small thickness. Figure 7B shows narrowly spaced ToF amplitudes, indicating thin layers with this ratio. Material quality resembled that of Jello contrasting Sample’s 3 sturdy rubber consistency. While not sounding ideal, this could be useful for applications requiring soft prints, such as artificial organs.
Sample 1, with the intermediate inhibition ratio (0.9882), represented both extremes. As seen in Figure 6A , its largely maintained the desired circular shape but still showed signs of under curing in the center leading to its donut-like appearance. Gradual increase of ToF in Figure 7B remained constant until layers 16-20, where its rapid increase possibly explains the under curing.
This study aimed to discover whether a correlation exists between photoinhibition and layer thickness. After printing out three successful samples with different inhibition ratios, an inverse correlation between ratio and layer thickness was found. Lower inhibition ratios, caused by higher blue light presence, resulted in greater layer thickness and superior print integrity. Conversely, a high inhibition ratio, caused by greater UV light presence, resulted in smaller layer thickness and decreased print quality. This knowledge could lead to better understanding on how to optimize the VPP process. For future work similar methods to understanding layer thickness could be used to understand the properties of individual layers.
Funding was provided by the Swanson School of Engineering, the Office of the Provost, and the Department of Mechanical Engineering and Materials Science. Special thanks to Dr. Xiayun Zhao, Yiquan Wang, Yue Zhang, and the ZIP-AM laboratory for their support through the MEMS FIRE program. This material is based upon the work supported by the National Science Foundation Faculty Early Career Development program (CAREER Award: CMMI-2238557). Any opinions, findings, and conclusions or recommendations expressed in this publication are those of the authors and do not necessarily reflect the views of the National Science Foundation.
[1] T. G. Terry Wohlers, “History of additive manufacturing,” Wohlers Report 2015, p. 1, 2015.
[2] Y. Z. Chaitanya Krishna Prasad Vallabh, Xiayun Zhao, “In-situ ultrasonic monitoring for Vat Photopolymerization,” Additive Manufacturing 55, pp. 1-14, 2022.
[3] CKN Knowledge In Practice Center. “Degree of cureA104.” https://compositeskn.org/KPC/A104 (accessed August 5, 2024.)
[4] O. Wright, “Why Choose Vat Photopolymerization 3D Printing for Your Business,” 3D Printing, 2023. [Online]. Available: https://3dprint.com/305603/whychoose-vat-photopolymerization-3d-printing-for-yourbusiness/
[5] T. Z. Haoyuan Quan, Hang Xu, Shen Luo, Jun Nie, Xiaoqun Zhu, “Photo-curing 3D printing technique and its challenges,” Bioactive Materials, vol. Volume 5, Issue 1, pp. 110-115, 2020.
[6] H. L. v. d. L. Martin P. de Beer, Megan A. Cole, Riley J. Whelan, Mark A. Burns, Timothy F. Scott, “Rapid, continuous additive manufacturing by volumetric polymerization inhibition patterning,” Science Advances, Engineering, pp. 1-7, 2019.

Jihao Zhang1, Lei Fang1,2,3
1Department of Mechanical Engineering and Materials Science, University of Pittsburgh, Pittsburgh, PA, 2Department of Civil and Environmental Engineering, University of Pittsburgh, Pittsburgh, PA, 3Department of Bioengineering, University of Pittsburgh, Pittsburgh, PA
JIHAO ZHANG
Jihao Zhang is a senior Mechanical Engineering student at the University of Pittsburgh. He is mainly interested in fluid mechanics. Following graduation, Zhang hopes to continue this interest by pursuing a master’s degree.
LEI FANG
Lei Fang is an Assistant Professor in Civil and Environmental Engineering at the University of Pittsburgh. His research focuses on turbulence dynamics, and transport and mixing problems with particular emphasis on topics relevant to biology, environment, and health. Current interests include the transport of active non-spherical swimmers, biologically generated mixing, disease transition, and the development of new experimental methods.

Traditional Lagrangian Particle Tracking (LPT) methods are limited by fixed interrogation domains, restricting studies of small-scale turbulence and long trajectories. This project develops a novel rotating mirror system, adaptable to various experimental setups, enabling the measurement of previously inaccessible Lagrangian statistic data and advancing turbulence research.
Keywords: Lagrangian particle tracking, High-speed object, Rotating Mirror System, Interrogation domain
This research develops a new Lagrangian Particle Tracking (LPT) system that uses programmable rotating mirrors to address the limitations of traditional LPT methods in tracking hypersonic flows. Traditional techniques are limited to a fixed interrogation domain, resulting in a tradeoff between long trajectory length and high resolution. By using programmable rotating mirrors, our approach enables a high-speed camera to dynamically track the interrogation domain, resulting in high-resolution particle trajectory extension. Experimental results validated the system’s ability to maintain clear focus and a high translation distance/image size ratio when tracking objects at 150 m/s. This approach allowed us to obtain the Lagrangian statistics data that was not attainable before.
Lagrangian particle tracking (LPT) is a flow measurement technique that allows the tracking of many tracer particles over a long period so that their Lagrangian trajectories can be observed [1]. The traditional LPT has a fixed interrogation domain, which limits the tracking length of the trajectory. The goal of this project is to develop new LPT so that their interrogation domain can be moved while a longer trajectory of hypersonic flow particles can be observed with high resolution.
LPT has been widely used in experimental fluid dynamics over the past two decades. Traditional LPT directly uses a high-speed camera to photograph particles moving at high speeds. However, since the measured trajectory length is limited by the size of the camera’s interrogation domain, the experimental results often face a trade-off between resolution and trajectory length. Ayyalasomayajula et al. measured two-dimensional particle trajectories by attaching a high-speed camera to a pneumatic linear motion skid and accelerating it to the mean flow velocity [2]. However, although such a method makes it possible to increase the length of the track, the high-speed movement of the camera causes the stability of the camera to be affected, and the clarity of the captured image is reduced as a result. Therefore, it is critical to find a way to fix the camera and track high-speed moving particles over long distances with high resolution. The hypothesis of this study is that using a programmable rotating mirror system can effectively maintain image clarity at high speeds while ensuring long, high-resolution Lagrangian trajectory tracking.
2.1 Programmable Rotating Mirror and Camera Setup
This section outlines the theoretical concept of a new Lagrangian Particle Tracking (LPT) method. It introduces how a programmable rotating mirror is used to direct the camera’s line of sight across the interrogation
domain, enabling the capture of long trajectories of high-speed particles. The theoretical basis, including depth-of-field considerations and optical configuration, is presented here.
In this project, a programmable rotating mirror is placed in front of the high-speed camera to reflect the view of the high-speed camera through the rotation of the mirror, to achieve tracking of the trajectory of the high-speed movement of the particles.
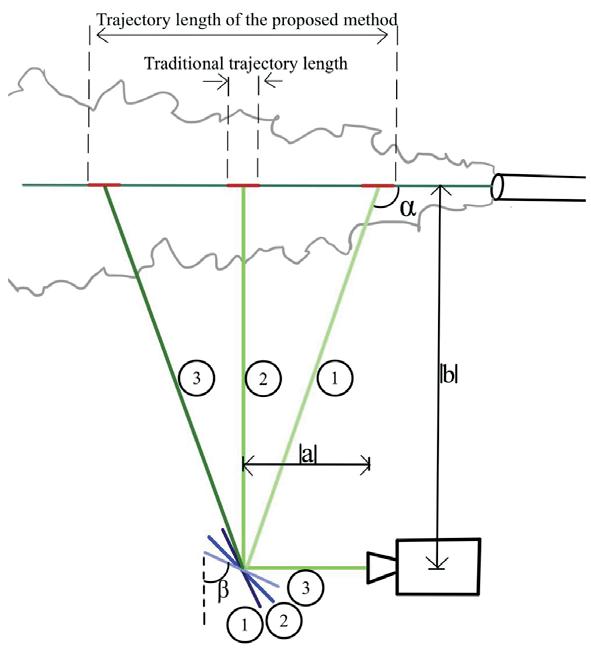
Figure 1: Top-view schematic of the proposed method. The rotating mirror system is placed before the high-speed camera to dynamically track the interrogation domain.
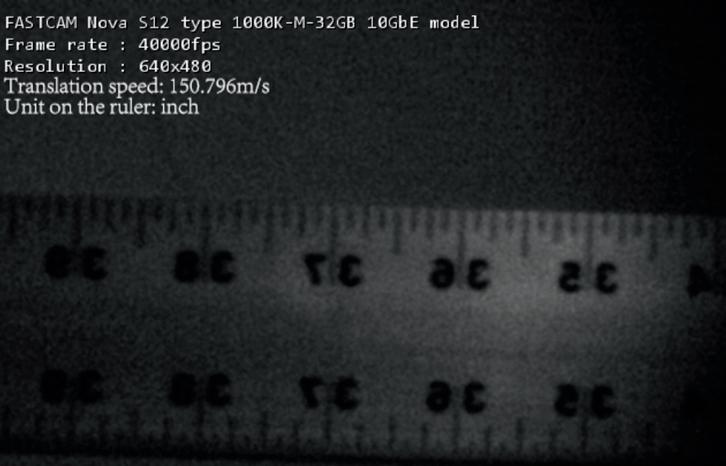
2: High-speed scanning demonstration. The interrogation domain translates at about 150.796 m/s, with concentrated illumination ensuring sufficiently clear images.
In Figure 1, as the rotating mirror is at position 1, the line of sight 1 maps the camera sensor to the interrogation region that is closest to the round jet where the particles are illuminated by the laser sheet. To follow the mean flow and measure long trajectories, the programmable rotating mirror rotates to position 2 and then, 3. The line of sight changes from 1 to 2 and then from 2 to 3 correspondingly. Thus, long trajectories of hypersonic flow are obtained. However, as the mirror rotates, the object distance imaged
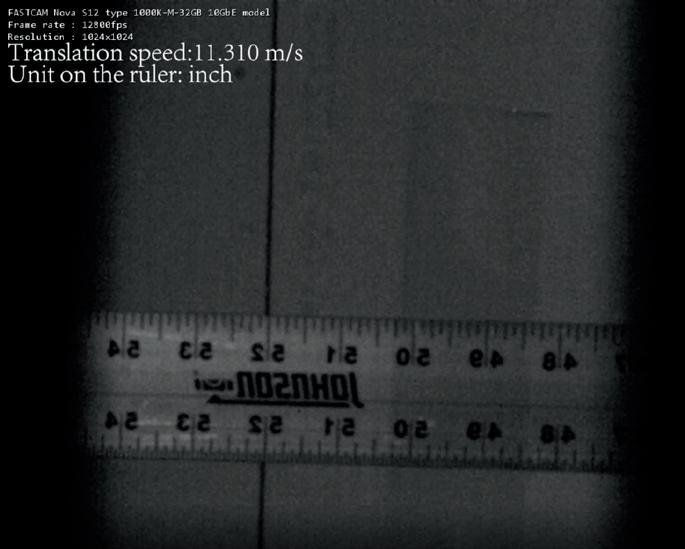
Figure 3: Long trajectory demonstration. The interrogation domain covers approximately 50 inches, allowing long Lagrangian trajectories to be observed.
by the camera changes, which presents the challenge of maintaining sharp focus across the entire ±10° sweep of the line of sight. There is also the problem that as the mirror rotates, the object distance imaged by the camera varies, so it is a matter of ensuring that the image is always clear.
Prior to the experimental runs, we employed Excel spreadsheets to systematically record and examine the key parameters and constraints of our high-speed camera system. Based on these recorded values, we iteratively adjusted the object distance, camera placement, and lens focal length according to optical imaging principles. Through these calculations, we derived a suitable depth of field (DoF) that maximized the translation distance/ image size ratio, a critical factor representing the ability to capture longer particle trajectories within the interrogation domain.
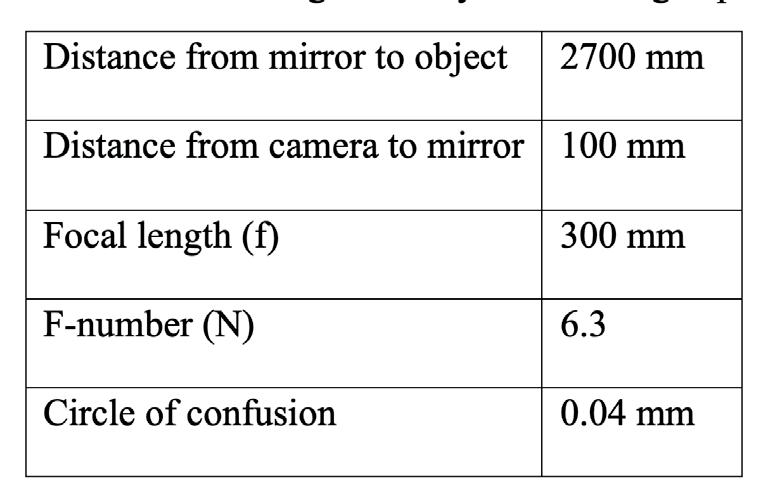
Table 1: Optical parameters for the rotating mirror system and highspeed camera setup.
As shown in Table 1, these theoretical calculations yielded a set of optimal parameters for our camera setup and equipment positioning. By ensuring an appropriate DoF and an optimal translation distance/image size ratio, the final configuration allowed the camera to maintain clear focus while capturing long particle paths as the line of sight swept across the measurement region.

After establishing the theoretical depth-of-field parameters, we proceeded to implement the experimental procedure. Guided by the optimal distances determined from our earlier analysis, we securely mounted the programmable rotating mirror, the high-speed camera, and the target object—a 1.5 m calibrated ruler—according to the prescribed configuration. Once these components were fixed in place, we activated the high-speed camera and initiated the mirror’s rotation. As the mirror swept its line of sight across the interrogation region, we captured a series of images under carefully controlled lighting conditions, rotational speeds, and camera frame rates. Due to limitations in laboratory illumination, it proved challenging to simultaneously achieve both high interrogation region speeds and perfectly clear images. The large focal length and small aperture required to maintain a deep focus range significantly reduced the amount of light reaching the camera sensor, thus restricting the achievable image brightness and clarity at very high scanning velocities. Consequently, we divided the experimental procedure into two parts:
The primary goal of the first demonstration was to confirm that the interrogation domain could be moved across the field of view at a very high speed. By focusing the light from multiple sources on a single spot on the ruler, we ensured that sufficient illumination reached the sensor, allowing the high-speed camera to capture a series of images. Under these conditions, the interrogation domain achieved a translation speed of approximately 150.796 m/s. This demonstration established the system’s ability to rapidly reposition the interrogation region without sacrificing essential image clarity, thereby validating the feasibility of tracking rapidly moving domains.
2.2.2
In the second demonstration, our objective was to confirm that the interrogation domain could travel a significantly greater distance, thereby allowing the capture of longer Lagrangian trajectories. To achieve this, we arranged the lighting to illuminate most of the 1.5 m ruler’s surface. Using the rotating mirror system operating at 6 Hz, the high-speed camera recorded images at 12,800 frames per second. Under these conditions, we obtained a sequence of images. In this setup, the interrogation domain translated approximately 50 inches, demonstrating the capability of the system to track over a substantially extended range.
2.3
After conducting the two demonstrations, we examined the resulting images, which documented the camera’s line of sight as the mirror swept across the ruler at high speed. The photographs confirmed that the camera remained in sharp focus throughout the scanning process, even as the object distance changed. This clarity was evident
in images similar to those shown in Figures 2 and 3, where parameters such as units, movement speed, and shooting frequency were annotated to provide context. Following image optimization in MATLAB to reduce noise, we compiled all processed images into a cohesive video at 24 frames per second, clearly visualizing the system’s ability to capture long and highly dynamic trajectories with maintained image quality.
In the end, we obtained a video in which the view of the high-speed camera is moving at 150.796 m/s, which is a very fast speed for tracking fluid particles that exceed the speed of sound. At the same time, as the mirror rotates, the high-speed camera also captures a longer distance at a higher resolution. This confirms that it is feasible to track the Lagrangian trajectories of high-speed flow particles using a programmable rotating mirror, and such a new approach breaks the original conflict between long trajectories and high resolution. It is possible to capture a longer trajectory while making each frame sufficiently sharp, allowing each pixel point to correspond to a smaller physical size for detailed observation. Ayyalasomayajula et al [2] achieved moderate success using a moving camera system to increase the length of the trajectory but suffered from stability issues that reduced image clarity. In contrast, our system uses a fixed camera and utilizes mirror rotation to achieve a similar effect with almost no impact on image clarity, indicating that high-speed particle tracking technology has come a significant way in capturing longer trajectories while providing excellent image stability.
This project validates the feasibility of using programmable rotating mirrors to enable the capture of high-speed flowing particles at high resolution and long distances. This approach greatly improves the original measurement techniques and makes it possible to measure many physical quantities that would otherwise be impossible to measure, such as particle dispersion for a long time, inertial/non-spherical/active particle dynamics in strong turbulence/waves, and particle velocity at long distances, turbulence/waves and droplet size change along a trajectory in an expiration plume. Due to time constraints, this project is only a preliminary validation of the method, and in follow-up, it is recommended that the hardware part of the new LPT system be programmed so that the rotation speed of the mirrors can be precisely and artificially controlled. After tracing the fluid with a tracer, the method can be applied to the observation of highvelocity fluid particles to obtain a series of Lagrangian statistics of interest. Eventually, the software component of the new LPT system will need to be developed so that Lagrangian trajectories in physical space can be reconstructed.
This study demonstrates that the newly developed LPT method can smoothly shift the interrogation domain, overcoming the traditional trade-off between high resolution and long trajectories. By integrating a programmable rotating mirror system, the high-speed camera’s line of sight dynamically follows objects in hypersonic flow, achieving scanning speeds up to 150.796 m/s and covering distances as long as 50 inches. This advancement paves the way for measuring long-term particle dispersion and capturing the behavior of inertial, non-spherical, or active particles in highly turbulent or wave-dominated environments, unlocking new possibilities in fluid mechanics’ research. At present, this work is only a preliminary validation of the method, and future work will focus on further improvements to the hardware, in particular the accurate programming of mirror rotation speeds, and the development of software to reconstruct Lagrangian trajectories in physical space. Combined with tracer-based experiments, these improvements will eventually enable detailed analysis of high-speed flow phenomena for a wider range of applications.
Funding was provided by the Swanson School of Engineering and the Office of the Provost at the University of Pittsburgh. Meanwhile, I express my deepest gratitude to Professor Lei Fang for his invaluable guidance and support during my summer research. His patience, expertise, and encouragement have greatly contributed to my academic growth and the successful completion of this work.
[1] A. Schröder and D. Schanz, “3D Lagrangian Particle Tracking in Fluid Mechanics,” Annual Review of Fluid Mechanics, vol. 55, no. 1, pp. 511–540, Jan. 2023, doi: https://doi.org/10.1146/annurev–fluid–031822–041721.
[2] S. Ayyalasomayajula, A. Gylfason, L. R. Collins, E. Bodenschatz, and Z. Warhaft, “Lagrangian Measurements of Inertial Particle Accelerations in Grid Generated Wind Tunnel Turbulence,” Physical Review Letters, vol. 97, no. 14, Oct. 2006, doi: https:// doi.org/10.1103/physrevlett.97.144507

CATEGORY: COMPUTATIONAL RESEARCH
u Development and analysis of volume-based solvers for partially occluded surfaces in the context of radiation heat transfer ................................. 33
Eliana Crew, Matthew Barry
u AI-Enabled virtual surveillance: Forecasting morphological and wall stress changes in abdominal aortic aneurysms ........................................ 57
Aakash K. Kottakota, Jason Lee, Pete H. Gueldner, Nathan L. Liang, David A. Vorp-, Timothy K. Chung
u Thermophoretic effects on the removal of neutron poisons in nuclear thermal rocket fuel rods .................. 81
Paul McPartland, Yonghee Kim
u Towards the development of synthetic ultrasound data for image classification of Obstructed Defecation Syndrome .................................. 86
Nalima Munyofu, Ghazaleh Rostaminia, Steven Abramowitch
CATEGORY: DEVICE DESIGN
A novel virtual reality-based platform for kinetic visual field testing ........ 18
Brian Bartley, Galen Holland, William Smith, Rakie Cham, Alessandro Fascetti
DeltaCuff: A novel device to measure venous compliance from acoustic signals .................................. 23
John A. S. Buttles, Jason Y. Lee, Cyrus J. Darvish, Pete Gueldner, Rabih Chaer, David A. Vorp, Timothy K. Chung
Combating phantom limb pain (PLP): enhancing vibration therapy through feedback and prototype development ............................. 109
Norah Stivala, Goeran Fiedler
Category Definitions
CATEGORY: EXPERIMENTAL RESEARCH
Generation of adipose-like tissue from human induced pluripotent stem cells for studying contribution of obese fat to osteoarthritis .... 12
Olivia Bartholomew, Meagan Makarczyk, Sophie Hines, Hang Lin
Space utilization increases user interaction and satisfaction within academic settings ....................................... 28
Natalie Ceccarelli, William W. Clark
Effects of heat accumulation on melt pool size in laser powder bed fusion .............................. 39
Jared Espiritu, Seth Strayer, Albert To
Identifying myofibroblast origin in mesh-vagina explants following surgical mesh complications from pelvic organ prolapse repair ........................ 44
Malini Harinath, Marrisa Therriault, Pamela Moalli-, Katrina Knight
Assessing the change in strength of the quadricep tendon after graft harvest ........................... 52
Samiya Henry, Patrick Smolinski, Anja Wackerle, William Gamble and Volker Musahl
Reversible, strong, stimuliresponsive hydrogel adhesion ..................... 66
Jake Laws, Zefan Shao, Qihan Liu
Spatial analysis of pro-survival signaling as a function of tumor cell-fibroblast distance in HER+ breast cancer xenografts............................. 71
Joseph C. Long, Matthew D. Poskus, Ioannis Zervantonakis
Comparing fibroblast-mediated signaling mechanisms to separate effects influencing drug resistance in HER+ breast cancer ................................. 76
Soham Mandal, Matthew D. Poskus, Ioannis Zervantonakis
u Computational Research—using computational techniques to address a scientific question
Device Design—focusing on the development of a product or device
Experimental Research—using laboratory methods to achieve a novel overarching experimental aim
Methods—developing new techniques and tools for research and design
Other
CATEGORY: EXPERIMENTAL RESEARCH
Diabetes induces abnormal vessel remodeling in the vagina: implications in urogynecologic surgeries ..... 83
Sofia Milone, Rui Liang
Tuning the compliance of small diameter vascular grafts using two biocompatible elastomers ........................... 90
Trin R. Murphy, David R. Maestas, Jr., William R. Wagner, Sang-Ho Ye, Jonathan P. Vande Geest
Cross-modal congruency effect as a measure for sensory feedback in lower limb amputees ................................... 94
Charles A. Oduro Jr., Rohit Bose, Lee Fisher
Tissue reaction in response to biomimetic coating on parylene-C neural implants ........................................... 98
Yugma Patel, Delin Shi, Elaine M Robbins, Adrian Michael, Xinyan Tracy Cui
In vivo two-photon imaging of cerebral blood flow in small vessels of Alzheimer’s mice show decreases with age ................................... 104
Arushi Singh, Yucheng Shen, Noah Schweitzer, Bistra Iordanova
Tracking in a hypersonic flow through a rotating mirror system ................ 119
Jihao Zhang, Lei Fang
CATEGORY: METHODS
A comparison of Normaland Low-frequency extension accelerometry data in persons with chronic low back pain ........................... 62
Simran Kulkarni, Kevin M. Bell, Meenakshi Sundaram, Zakiy F. Alfikri, Sara Piva, John M. Jakicic, Carol M. Greco
Effects of photoinhibition on material thickness using in-situ ultrasonic monitoring ................................. 115
Ryan Vidal, Yiquan Wang, Yue Zhang, Xiayun Zhao
CATEGORY: OTHER
The impact of probe pressure on ultrasound imaging for monitoring rat bladder morphology and volume ............... 9
Lily A rmstrong, Mehdi Ramezanpour, Anne Robertson
Category Definitions
u Computational Research—using computational techniques to address a scientific question
Device Design—focusing on the development of a product or device
Experimental Research—using laboratory methods to achieve a novel overarching experimental aim
Methods—developing new techniques and tools for research and design
Other
151 Benedum Hall 3700 O’Hara Street Pittsburgh, PA 15261
412-624-9800
engineering.pitt.edu