

pitcher.com.au Economic and Market Outlook July 2023 Current as of 1 July 2023

Inflation remains the topic du jour across the global economy. In both the US and Eurozone, interest rates are at their highest point since the global financial crisis. Economic growth continues to decelerate globally prompting more calls for interest rate cuts. In China, the opposite problem of deflation is emerging as its economy struggles with anaemic consumer demand and a weaker labour market.
United States
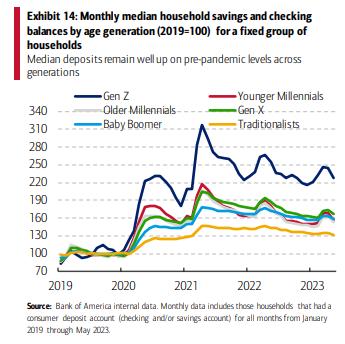
Household excess savings from the pandemic era (Exhibit 14 below) are helping sustain consumer spending
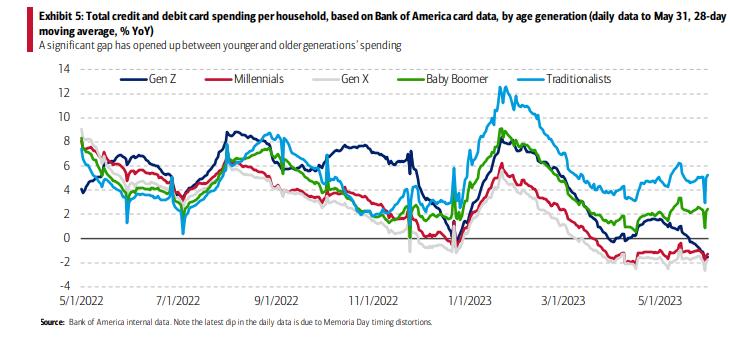
This is particularly the case for services with the Markit Composite PMI for June remaining in expansionary territory offsetting ongoing manufacturing weakness1 Older generations (Baby Boomer and Traditionalists highlighted below) are the key driver supporting spending as shown in Exhibit 5 following pent-up demand from the end of COVID-19 restrictions.
US household savings and spending to May-23, split by generation
Source: Bank of America2
Whilst services demand may be holding up, Exhibit 5 above shows that younger generations (Millennials, Gen Z and Gen X) are already seeing an outright decline in spending. Indeed, the volume of goods produced has declined by 4.5% for the year to April. We expect this to drag on the overall economy as household consumption accounts for a material portion of US GDP at 68% in the March quarter3
Leading indicators, such as the latest release of the Conference Board Leading Economic Index4 , suggest further weakness in economic activity ahead. In addition, other timely series, such as the Federal Reserve’s Weekly Economic Index5 , are pointing towards annualised growth of only 1.1% for the June quarter, an anaemic result that is below long-term averages
The US central bank (“the Fed”) remains concerned with the pace of services inflation particularly to the extent that wage inflation is becoming entrenched. The Atlanta Fed wage growth tracker, a measure of median wage growth, is still elevated at 6% for the year to May, its highest level in the past 25 years. To that end it has forecast a further two rate hikes by the end of the year, which would take the Fed Funds rate to a range of 5.5% to 5.75%, its highest level since the early 2000s. As the labour market remains tight, with reportedly 1.5 job vacancies per unemployed person, wage price inflation may stay elevated for some time
1 S&P Global Flash US Composite PMI, S&P Global, June 2023, https://www.pmi.spglobal.com/Public/Home/PressRelease/6e8efbfbddde43f29eb12c5193939625
2 Economic Insights: Consumer Checkpoint, Bank of America Institute, June 2023, https://business.bofa.com/en-us/content/bank-ofamerica-institute/economic-insights/consumer-checkpoint-june-2023.html
3 Shares of gross domestic product: Personal consumption expenditures, FRED, March 2023, https://fred.stlouisfed.org/series/DPCERE1Q156NBEA
4 US Leading Indicators, Conference Board, 22 June 2023, https://www.conference-board.org/topics/us-leading-indicators
5 Weekly Economic Index (Lewis-Mertens-Stock), FRED, 17 June 2023, https://fred.stlouisfed.org/series/WEI
US job vacancies per unemployed person (Apr-03 to Apr-23)
Source: Bloomberg
Until we see a clear shift in the labour market, it is likely that the Fed will retain a hawkish bias in the near term. This is despite the understanding that monetary policy works with a lagged effect, which means its full impact of slowing the economy has still not yet been felt.
At the same time, the latest deal to suspend the country’s debt ceiling (its maximum borrowing capacity) caps non-defence government spending to be flat in 2024 and rise by only 1% in 20256 The combination of restrictive fiscal and monetary policies is likely to lead to a meaningful slowdown in growth.
In summary, leading indicators suggest US growth should continue to be subdued in the near term. While inflation is currently elevated, it is decelerating, however the presence of elevated wage growth means the Fed is likely to keep monetary policy tight in the near term, maintaining another headwind to the broader economy. Until there are clear signs of additional slack in the labour market (higher unemployment) the prospect of further interest rate hikes remains high, leading to lower growth.
The inflation backdrop is also a clear challenge in Europe, with both wage and core inflation (which strips out more volatile prices such as energy) remaining at elevated levels. The European Central Bank (ECB) has been hiking in earnest to take its policy rate to its highest since prior to the global financial crisis. We anticipate that the ECB will also retain its hawkish approach (favouring more rate hikes or retaining current levels) until the core inflation backdrop materially decelerates. Some indicators, such as the producer price index (PPI), are suggestive of weaker input costs particularly for goods, only rising 1% for the year to April The ECB, however, is likely to wait until it sees clearer signs of a deceleration in wage growth before shifting its policy stance.
Source: Bloomberg
The fight against inflation has not been without cost. Europe’s largest economy, Germany, entered a technical recession (defined as two consecutive quarters of negative GDP growth) during the March quarter. Falling consumer demand was one of the key culprits with a 1.2% decline in the March quarter that was broad in its weakness. The broader Eurozone also experienced a technical recession over the same period.
6 What’s in US debt ceiling deal and who won? BBC, 2 June 2023, https://www.bbc.com/news/world-us-canada-65744615
Leading indicators point to further weakness. The Conference Board Leading Index for Europe worsened to be down 8%, year-on-year, suggesting additional challenges ahead
Conference Board Leading Indices for Europe and UK (May-03 to May-23)
Source: Bloomberg
In summary, Europe is in technical recession with a narrow path to recovery. Leading indicators suggest little improvement ahead. Inflation data is painting a mixed picture. Some areas, such as goods inflation, are rapidly easing whilst others, notably wage growth, remain above-trend. There is still the downside risk of tighter monetary policy weighing on the economic outlook. The ECB is determined to tame inflation and that could see the Eurozone experience a “double-dip” recession echoing the aftermath of the global financial crisis a decade ago.
In China, the pace of underlying growth has slowed with industrial production, fixed asset investment and retail sales for the year to May all disappointing expectations. Manufacturing, the heart of the Chinese economy, has been weaker of late with the May PMI print expanding for the first time since February but business confidence fell to a 12-month low with employment also slipping7
In addition, inflation poses a different problem relative to the developed world with headline inflation of only 0.2% for the year to May. The producer price index, a measure of primarily goods inflation, remained in deflationary territory with a 4.6% drop over the same period8 This has been attributed to weakness in global demand and commodity prices by the Chinese National Bureau of Statistics and has led several market economists to downgrade their growth targets for 2023.
This slowdown has triggered policy intervention to support the economy, albeit minor, with cuts of only 0.1% to key lending rates9 by the People’s Bank of China (the Chinese equivalent of the RBA). The challenge faced by authorities in China is weighing up the risks of providing additional support to the economy without also encouraging further leverage and unproductive investment spending. Premier Li Qiang in a recent speech noted the need to roll out additional “practical, effective measures to expand domestic demand”10 but without more clarity it is difficult to be overly optimistic on this front.
In summary, we are seeing an economic slowdown persisting in China with limited stimulus in place to counteract
7 Caixin China General Manufaturing PMI Press Released, S&P Global, May 2023, https://www.pmi.spglobal.com/Public/Home/PressRelease/f01e3d3c8c8d4ff4a751cea5b2f56630
8 China’s producer prices plunge the most in seven years as deflation hangs over economy, CNBC, 8 June 2023, https://www.cnbc.com/2023/06/09/chinas-inflation-rises/falls.html
9 China cuts lending benchmarks to revive slowing demand, Reuters, 20 June 2023, https://www.reuters.com/world/china/china-cutslending-benchmarks-first-time-10-months-support-economy-2023-06-20/
10 China will take steps to boost demand, accelerate green transition, premier says, Reuters, 27 June 2023, https://www.reuters.com/world/asia-pacific/chinas-growth-be-higher-q2-projected-hit-annual-5-target-premier-li-2023-06-27/
For the global economy, services sectors are holding up well, but manufacturing is seeing a broad slowdown Some regions have already entered technical recession, notably Germany and, closer to home, New Zealand11 . Policymakers remain committed to fight inflation with the collateral damage of weakening the broader economy. There are limited positive offsets present in our view with China taking a conservative stance towards economic stimulus We expect to see further weakness in the quarters ahead as a result.
9228 2415
cameron.curko@pitcher.com.au11 New Zealand enters technical recession after economy shrank 0.1% in the first quarter, CNBC, 14 June 2023, https://www.cnbc.com/2023/06/15/new-zealand-enters-recession.html
In March 2021, RBA Governor Philip Lowe made his now infamous speech where he forecast the cash rate, which was a record low of 0.10% at the time, “is very likely to remain at its current level until at least 2024” Since then, the cash rate has risen 12 out of the last 13 months to 4.10%.
Governor Lowe justified the latest increase on several grounds, noting12 that services inflation remained high and with unemployment near 50-year lows in June, the labour market remained too tight, increasing the risk of further wage price inflation. In hindsight, this non-consensus rate rise should not have come as such a great surprise. Documents released in early May13, under freedom of information laws, showed that the RBA’s own internal modelling (conducted in February 2023) forecasted that the cash rate needed to rise to 4.8% to reduce inflation back to within the 2%-3% target range by 2025.
Despite the RBA’s hawkish sentiment, we remain firmly of the view that the RBA has already done enough to suppress inflation. Indeed, we have a high conviction that the Australian economy remains on the cusp of a more concerted slowdown over the next 12 months, which should ease inflationary pressures, for numerous reasons.
First, although the May labour force survey14 was surprisingly resilient and showed a fall in unemployment to 3.6% in seasonally adjusted terms, there were some statistical anomalies given that April is a month where hiring is interrupted by school holidays, Easter and Anzac Day. Some signs of weakness were buried in the detail, including a pick-up in the underemployment rate and a 1.8%15 decline in monthly hours worked. This could suggest that employers experiencing a slowdown in activity are cutting back hours but holding onto staff longer rather than retrenching, perhaps scarred by the well documented difficulties in re-hiring staff after the pandemic lockdowns. The modest rise in the participation rate also suggests that cost of living pressures are becoming more pervasive, with more people returning to the workforce by necessity.
ABS Labour Force report, key statistics as at May 2023
Source: Australian Bureau of Statistics16
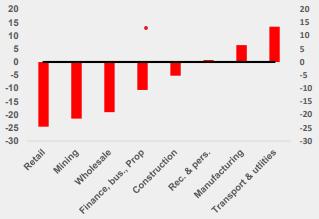
Second, the May NAB Monthly Business Survey released on 13 June showed a decline in business confidence to levels well below the long run average. A broad-based slump in forward orders, with the exception of manufacturing and transport & utilities, foretell a looming contraction in activity.
12 Monetary Policy Statement, Reserve Bank of Australia (RBA), 2 May 2023, https://www.rba.gov.au/media-releases/2023/mr-23-10.html
13 RBA modelling reveals huge cost of lifting rates more aggressively, Sydney Morning Herald, 11 May 2023, https://www.smh.com.au/politics/federal/rba-modelling-reveals-huge-cost-of-lifting-rates-more-aggressively-20230511-p5d7pu.html
14 Labour Force, Australia - May 2023, Australian Bureau of Statistics, 15 June 2023, https://www.abs.gov.au/statistics/labour/employment-and-unemployment/labour-force-australia/latest-release
15 Labour Force, Australia - May 2023, Australian Bureau of Statistics, 15 June 2023, https://www.abs.gov.au/statistics/labour/employment-and-unemployment/labour-force-australia/latest-release
16 Labour Force, Australia - May 2023, Australian Bureau of Statistics, 15 June 2023, https://www.abs.gov.au/statistics/labour/employment-and-unemployment/labour-force-australia/latest-release
Source: NAB Monthly Business Survey17
Third, retailers are already bearing the brunt of the cost-of-living crisis, with a raft of earnings downgrades18 over the recent quarter coming from the likes of Baby Bunting, Adairs, Best & Less and Super Retail Group. Fourth, the latest Westpac Melbourne Institute Consumer Sentiment survey19 released on 13 June remains deeply negative at levels that would normally only be expected during a recession. Inflation was noted as more of a concern among survey participants than interest rates. Similarly, the Institute’s Leading Index survey conducted in May, which indicates the likely pace of economic activity relative to trend three to nine months into the future, remains in negative territory.
Consumer Sentiment Index (Jun-93 to May-23)
Source: Westpac - MI Consumer Sentiment
Fifth, the tidal wave of mortgages rolling off fixed rates over the next 12 months has only just begun. According to the Australian Bankers Association, over 222,000 fixed rate mortgages rolled off ultra-low rates (2-3%) in the June quarter alone to reset on much higher rates (6%+) A further 590,000 more are due to reset over the next 12 months. Although only one third of households have a mortgage, the impact on disposable incomes for this cohort will be significant, likely contributing to a sharp reduction in discretionary spending.
17 NAB Monthly Business Survey, National Australia Bank, May 2023, https://business.nab.com.au/wp-content/uploads/2023/06/NABMonthly-Business-Survey-May-2023.pdf
18 Best & Less reveals Australia’s spending pain, and there’s more to come, Australian Financial Review, 20 June 2023, https://www.afr.com/chanticleer/best-and-less-reveals-australia-s-spending-pain-and-there-s-more-to-come-20230620-p5dhvd
19 Consumer Sentiment steadies near recession lows, Westpac-Melbourne Institute, 13 June 2023, https://www.westpac.com.au/content/dam/public/wbc/documents/pdf/aw/economics-research/er20230613BullConsumerSentiment.pdf
Source: MacroBusiness20
Sixth, growth in Australia’s largest trading partner, China, has weakened after the initial rebound in activity following the end of the COVID-19 lockdowns. Although Authorities have eased financing restrictions in the ailing property sector, following the clampdown on debt that triggered a wave of high-profile defaults by property developers, the sector remains challenged by high levels of debt and a large stock of unfinished apartments. As the property sector contributes about a quarter of China’s GDP, these challenges have spilled over into weaker consumer sentiment and economic growth more generally. This, combined with emerging weakness in the United States and the global economy does not augur well for Australian export demand over coming quarters.
The impact of rising interest rates on economic activity typically acts with a lag of 6-12 months on economic activity. The impacts are now obvious. Global inflation has been in retreat and inflation in Australia is also well past its peak and should continue to gradually subside over coming quarters as growth continues to slow. Services inflation has remained more persistent, as labour input costs remain stubbornly high. This too however should start to recede as wage price pressures gradually moderate. There is a fine line between reducing inflation and avoiding a recession. In our view, the risk of a hard landing has increased considerably following the RBA’s latest hike. This means there is now considerable downside risks to the RBA’s own forecasts where economic growth (GDP) in Australia is expected to slow to 1.5% and 2%21 respectively for the years ending 30 June 2024 and 2025.
20 The fixed rate mortgage cliff is here, Macrobusiness, 8 April 2023, https://www.macrobusiness.com.au/2023/04/the-fixed-ratemortgage-cliff-is-here/
21 Statement on Monetary Policy – Economic Outlook, RBA, May 2023, https://www.rba.gov.au/publications/smp/2023/may/economicoutlook.html
The S&P/ASX 200 Total Return Index returned 1% over the three months and 14.8% over the year to 30 June 2023
S&P/ASX 200 Accumulation Index cumulative return (Jun-22 to Jun-23)
Recommendation: Maintain underweight
Source: S&P, Bloomberg
Australian equities performed well over the last year but increasing signs are emerging of a more challenging period ahead. This was evident over the last quarter as numerous companies downgraded guidance, resulting in heavy share price declines with previous market darling, Domino’s Pizza, one of the more notable examples A slowdown in the global manufacturing sector has persisted and together with limited demand from China is likely to reduce demand for resources. Bank margins face challenges from heightened competition (reducing profitability) and rising arrears as interest rate hikes bite. Consumer sentiment remains near record lows, which bodes poorly for stocks exposed to discretionary spending
This backdrop increases the probability of further earnings downgrades and share price corrections. In conclusion, we continue to recommend investors retain an underweight exposure to Australian equities.
Our outlook for some of the major sectors of the S&P/ASX 200 is as follows:
Recommendation: Maintain underweight
We retain an underweight position on the banking sector. With credit growth in decline (new mortgage loans (excluding refinancing) down over 26% for the year to April), banks have been forced to compete by lowering rates or providing other incentives, such as cash back The resultant pressure on net interest margins is less supportive of profitability going forward. Some lenders, such as NAB, have deliberately reduced growth targets so as not to sacrifice margins.
Credit quality still appears strong based on the latest bank reporting. However, as S&P figures show (see below chart) we are beginning to see the uptick in mortgage stress for residential mortgage-backed securities (RMBS, a pool of mortgages turned into an investable security) that they cover. In our view, bad debts are likely to increase over the next 12 months as heavily indebted households and corporates struggle to meet repayments. This may accelerate further if the labour market begins to weaken materially. An offsetting factor will be the value of existing property assets, which have held up better than expected (down only 2.2%
nationally from their peak in March 2022 according to the ABS22) for the scale of rate rises thanks to a backlog of construction activity (reducing new supply) and stronger-than-expected net migration over the past year (boosting demand). That backdrop has seen residential vacancy rates nationally fall to 1.2% as of May, a level not seen for over 15 years23 Taken together, these are factors that will continue to support property values and should provide a limit on how far loan losses might escalate helping avoid a potential “hard landing” scenario for major banks
SPIN RMBS arrears rate (Apr-03 to Jun-23)
Sources: S&P Global as of April 2023, Bloomberg
Lastly, on valuation, the picture becomes less clear. On the one hand if we look at the major banks, only one, Commonwealth Bank (CBA) is still trading at a material ~20% premium to its long-term median valuation. The others are trading at various discounts, reflecting weaker performance relative to peers in recent years
Major bank premium/discount to long-term Forward P/E ratio (Mar-15 to Jun-23)
Sources: Bloomberg
The question is whether enough weakness has been priced into their valuation given the outlook The market consensus currently anticipates little to no growth in earnings per share for the period from FY23 to FY26.
Source: Bloomberg as at 26 June
22 Total Value of Dwellings, ABS, March quarter 2023, https://www.abs.gov.au/statistics/economy/price-indexes-and-inflation/total-valuedwellings/mar-quarter-2023
23 National Residential Vacancy Rate, SQM Research, May 2023, https://sqmresearch.com.au/graph_vacancy.php?national=1&t=1 https://sqmresearch.com.au/graph_vacancy.php?national=1&t=1
Historically this has proven to be an opportune time to gain exposure to the banks. However, risk remains skewed to the downside. We believe it is still too early to form a constructive view, given recession risks are rising. One upside risk is the potential change to the RBA Governorship, which could see a more dovish monetary policy stance supporting the banking sector.
Recommendation: Maintain underweight
Iron ore prices declined almost 21.8% from the end of March to late May. However, they have since rallied almost 14.7% from their lows to only be down 10.4% for the quarter to date (as of 21 June). Chinese industrial data disappointed with industrial production up 5.6% for the year to April (consensus: 10.9%)24 , while credit growth has similarly been below expectations with aggregate financing, a broad measure of credit, at 1.6 trillion yuan for May (consensus: 1.9 trillion yuan)25 contributing to a negative outlook for iron ore prices. While there is speculation for further stimulus from Chinese authorities, actual official announcements have been muted to date
In addition, we are still yet to see a material credit bounce out of China. The Chinese credit impulse (blue line below), a measure of new lending being generated within the Chinese economy has tended to be a leading indicator for the likely trajectory of industrial metal prices. This is because the new lending activity has tended to see large scale investment projects in property and infrastructure within China that require substantial metal imports to build. As we can see below, the credit response has been relatively muted in recent months suggesting limited impetus for prices to climb further from current levels.
Industrial metal prices versus China Credit Impulse (May-13 to Nov-23)
Source: Bloomberg
Forecasts for the broader global economy remain anaemic in 2023, a decidedly negative prospect for resource demand with some countries, such as Germany, entering technical recession already in the March quarter Limited relief on the interest rate front will continue to challenge demand and make it more difficult for investment projects to proceed due to higher borrowing costs. The outlook for manufacturing also appears muted, which should weigh on commodity demand.
Taken together, we believe the significant headwinds to global growth amidst still hawkish central bank policy continue to subdue demand for key commodities such as iron ore, copper, oil and gas. Accordingly, we maintain our resource sector underweight.
24 Disappointing activity data in China suggests more fiscal support is needed, ING, 16 May 2023, https://think.ing.com/snaps/chinadisappointing-activity-data-means-suggests-more-fiscal-support-needed/
25 China Credit Demand Weakens In Fresh Sign of Waning Recovery, Bloomberg, 13 June 2023, https://www.bloomberg.com/news/articles/2023-06-13/china-credit-demand-weakens-in-fresh-sign-of-waning-recovery#xj4y7vzkg
Consumer spending has remained soft with retail sales volumes barely positive, rising only 0.2% for the year to March 2023. Commonwealth Bank’s proprietary Household Spending Intentions Index, a timely retail spending indicator, has also weakened into the June quarter.
In addition, a long-standing measure of consumer demand, the Westpac-MI Consumer Sentiment Index continues to track at depressed levels with the latest RBA rate hike and inflation weighing on households. One area that had been consistently positive, jobs prospects, is now weakening as well with the Unemployment Expectations Index rising 6.6% in June and 32% since the RBA began hiking in May last year Westpac-MI Consumer Sentiment Index, 6-month average (Jun-93 to Jun-23)
Source: Bloomberg
Lastly, the share price index for listed consumer discretionary stocks fell by 3.9% over the quarter on the back of several high-profile downgrades including names such as Baby Bunting, Adairs and Super Retail Group26
The risk of further downgrades remains high because earnings, boosted by record stimulus and household savings from the pandemic period, remain elevated relative to the historical trend
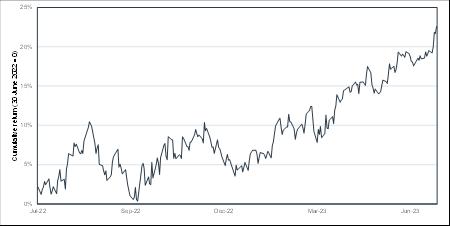
This can be demonstrated in the chart below, which shows cumulative EPS growth of over 40% on average since December 2019 for select retailers. As savings buffers unwind, we expect retail earnings to normalise towards pre-pandemic levels since wages have only risen 8.2% over the same period27
Cumulative growth in Forward EPS for select retailers (Dec-19 to Jun-23)
Source: Bloomberg
26 Best & Less reveals Australia’s spending pain, and there’s more to come, Australian Financial Review, 20 June 2023, https://www.afr.com/chanticleer/best-and-less-reveals-australia-s-spending-pain-and-there-s-more-to-come-20230620-p5dhvd 27 Wage Price Index, seasonally adjusted excluding bonuses, private and public sector, ABS, Dec-19 to Mar-23, https://www.abs.gov.au/statistics/economy/price-indexes-and-inflation/wage-price-index-australia/mar-2023
Overall, we believe meaningful drags on consumer spending are in place This backdrop warrants maintaining our sector underweight positioning until the outlook materially improves.
Recommendation: Maintain underweight
The AREIT universe underperformed the broader market in the June quarter One driver was the concern of rising interest rates slowing consumer spending going forward In addition, REITs face refinancing risk as their borrowings mature and must pay at higher rates, which reduce earnings.
In some segments, the demand outlook has softened further with retail REITs the worst performers in the quarter, led by the likes of Vicinity (VCX, down over 13%) and Westfield landlord Scentre Group (SCG, down over 10%) Rising rates drove weaker investor sentiment as concerns over consumer spending mount in the face of harsher financial conditions
Numerous office property trusts have been trading at significant discounts to their stated book values. This disconnect has started to narrow as recent transaction activity has seen property valuations fall. As an example, Dexus (DXS) sold 44 Market St, a Sydney A-grade office property, for $393.1m, a 17.2% discount to its Dec-22 independent valuation. This is materially less than the current 30%+ discount that Dexus shares trade at. It does suggest however that unlisted property trust prices are inevitably revised lower as their assets reflect current market pricing.
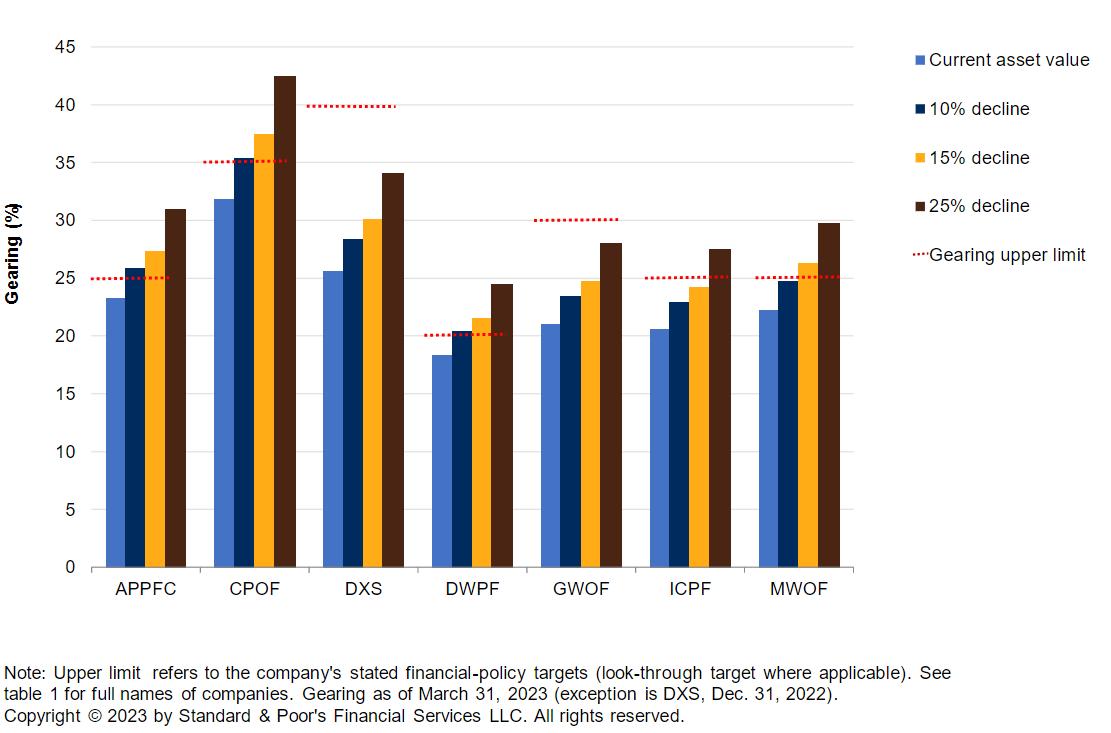
There is a growing concern that falling asset prices could see property trusts breach lending covenants. Dexus (DXS) is one of the best placed to weather this potential risk as highlighted below, able to easily absorb a 25% decline in asset value. By contrast, a range of other property trusts could breach with as little as a 10% decline, such as Charter Hall’s Prime Office Fund (CPOF)
Office real estate Funds - Debt sensitivity to falling asset prices as at 31 March 2023
Source: S&P Global28
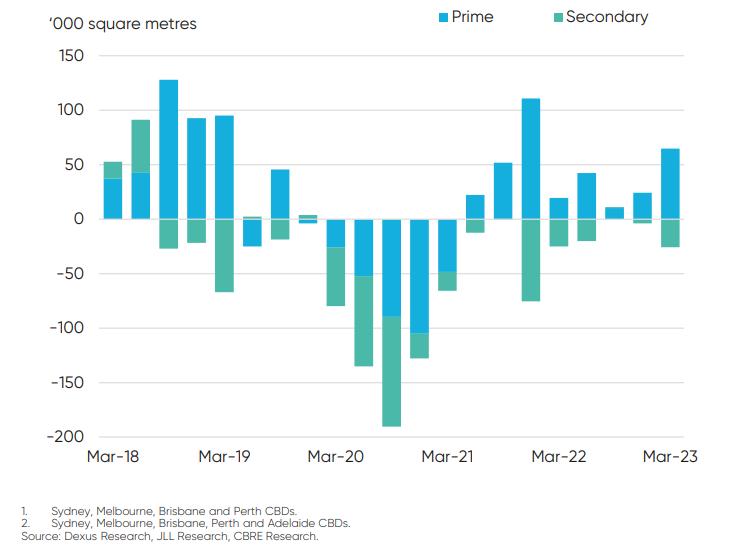
Another issue for the office sector is the challenge for lower grade buildings which are facing both high vacancy rates and increasing supply. The below chart neatly illustrates this with higher quality prime office properties continuing to see positive net absorption (i.e. increased take up by tenants). Meanwhile lower quality, secondary sites continue to see supply growing, an unfavourable dynamic that places downward pressure on rents.
28 Prime Assets Will Help Shield Australia’s Office REITs From Rising Stress, S&P Global, 29 May 2023, https://www.spglobal.com/ratings/en/research/articles/230529-prime-assets-will-help-shield-australia-s-office-reits-from-rising-stress12741579
Source: Dexus, Macquarie Australia Conference presentation29
In conclusion, the sector remains challenged given the above factors. We would need to see interest rate pressures easing or a stabilisation in asset values to improve our view Accordingly, we maintain our underweight outlook.
By Cameron Curko, Head of Macroeconomics & Strategy | Pitcher Partners SydneyWealth Management
+61 2 9228 2415
cameron.curko@pitcher.com.au
29 Macquarie Australia Conference presentation, Dexus, 2 May 2023, https://newswire.iguana2.com/af5f4d73c1a54a33/dxs.asx/2A1446960/DXS_Macquarie_Australia_Conference
The MSCI World (excluding Australia) Net Total Return Index (AUD) returned 7.6% over the past three months and 22.6% over the year to 30 June 2023. Much of this return was driven by the decline in the Australian dollar with the MSCI World (excluding Australia) Net Total Return Index (hedged to AUD) returning 16.6% for the year to June, a differential of 6%.
MSCI World excluding Australia Net Total Return Index (Jun-22 to Jun-23)
Source: MSCI, Bloomberg
The outlook for international equities remains challenging as numerous headwinds remain apparent.
First, central banks have not yet declared victory over the fight against inflation, with the US Fed for example expected to lift rates by at least another 50 basis points before the peak is reached All other things being equal, higher rates increase the cost of capital, reduce profitability and decrease the present value of future cashflows, reducing valuations. This environment is unlikely to change until we see more persistent economic weakness, such as significant job losses. The chart below highlights the short-term risk reward with the S&P 500 forward earnings yield i.e. next year’s expected earnings divided by its current price sitting barely above the cash rate. It raises the question of how wise it remains to take on equity risk when safer options are available.
Spread between S&P 500 Earnings Yield and Fed Funds Rate (Sep-96 to Jun-23)
S&P500EarningsYieldLESSFedFundsRatemidpoint(Sep-96toJun-23)
USrecession Spread(S&P500EarningsYieldLESSFedFundsRatemidpoint)
Source: Bloomberg
Second, in our view, consensus earnings expectations remain too high. The US is still forecast to grow profits approximately 7% per annum over the next three years to 2025. This remains difficult to reconcile given the expected deceleration in global growth Sharemarkets are likely to fall should earnings disappoint as we now expect.
Lastly, the geopolitical environment continues to be unstable. A thwarted coup attempt in Russia by a private military force, the Wagner Group30, highlights the ongoing challenges in Europe with the Ukrainian conflict still raging, as well as the risk of further disruptions for commodity prices if regional instability escalates.
On the positive side, valuations in some regions and countries continue to be favourable, particularly outside the US, with markets such as Europe and China trading at discounts to their long-term average price-earnings multiples. However, valuations in the US, which comprise just over 70% of the benchmark index31 remain unattractive, particular after a surge in technology stocks in the June quarter as interest in artificial intelligence (AI) applications soared
Over the June quarter we saw continued share price growth even as earnings expectations declined Two factors have been key. First, the rise of heightened speculation particularly amongst retail investors for artificial intelligence stocks, such as Nvidia, surged.
Second, speculation over a potential pause by the Fed and rate cuts subsequently has supported the relative attractiveness of stocks in the US and benefitted those with particularly long-term cashflows (dominated by technology names) This has resulted in the US market trading well above its long-term average valuation (as measured by its P/E ratio), an outcome which appears unsustainable given the economic headwinds
12-month Forward Price-Earnings Ratios for major markets (Jun-06 to Jun-23)
Source: Bloomberg; Data as at 27 June 2023
In the United States, operating earnings for S&P 500 companies are currently expected to decline by 1.2% in 2023, and then rise by 9.5% in 2024 and 2025, respectively. Assuming conventional long-term multiples, we estimate that the United States sharemarket (as measured by the S&P 500 Index) is overvalued by 19% in the near-term and by almost 3% in the medium-term.
30 As it happened: Putin survives rebellion, Wagner Group boss exiled to Belarus, Sydney Morning Herald, 24 June 2023, https://www.smh.com.au/world/europe/live-updates-putin-vows-to-defend-russia-against-wagner-rebellion-20230624-p5dj6x.html
31 MSCI World ex Australia Index (USD), MSCI, May 2023, https://www.msci.com/documents/10199/49479550-e805-4895-ba732893b1f3d60b
Source: Bloomberg consensus estimates for 2023, 2024 and 2025 as of 27 June 2023
In contrast, forward Price-to-Earnings (P/E) multiples for markets around the world are below longer-term averages as follows:
Source: Bloomberg. Data as at 27 June 2023.
Recommendation: Maintain underweight.
We expect earnings expectations to be downgraded further in coming months as global growth slows materially given challenges posed by rising interest rates and weaker demand. For these reasons we remain underweight.
By Cameron Curko, Head of Macroeconomics & Strategy | Pitcher Partners Sydney Wealth Management +61