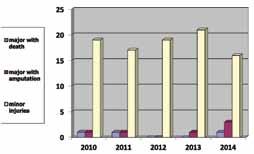
Figure 1. Total injuries in petroleum companies of west Alexandria sector from 2010 to 2014.
Figure 2. Classification of minor injuries according to body part affected.
Figure 3. Frequency of accident-related causes in the target industrial sector.
Table 1. Total occupational injuries in petroleum companies of west Alexandria sector from 2010 to 2014. Year Major accident with death Major accident with amputation Minor injuries Total injuries
2010 1 (5%) 1 (5%) 19 (90%) 21 (100%)
2011 1 (5%) 1 (5%) 17 (90%) 19 (100%)
2012 19 (100%) 19 (100%)
2013 1 (5%) 21 (95%) 22 (100%)
2014 1 (5%) 3 (15%) 16 (80%) 20 (100%)
Total 3 (3%) 6 (6%) 92 (91%) 101 (100%)
Table 2. Classification of minor injuries according to body part affected. Year
2010
2011
2012
2013
2014
Total
2 (10%) 6 (32%) 11 (58%) 19 (100%)
5 (29.4%) 5 (29.4%) 7 (41.2%) 17 (100%)
5 (26%) 7 (37%) 7 (37%) 19 (100%)
8 (38%) 3 (14%) 10 (48%) 21 (100%)
2 (12.5%) 9 (56.25%) 5 (31.25%) 16 (100%)
22 (24%) 30 (33%) 40 (43%) 92 (100%)
Injured organ
Head Upper limbs Lower limbs Total injuries
Table 3. Accidents’ crude rate, frequency and severity rates in west Alexandria petroleum sector from 2010 to 2014. 2010 25.62 2.98 277.72
2011 2012 2013 2014 20.81 8.67 32.43 21.01 2.01 1.19 3.24 2.12 1448.88 51.07 65.46 228.08 C.R = Crude Ratio ( injured Workers/10000 workers ) F.R= Frequency Rate ( Injury/million hours) S.R=Severity Rate (Days lost/million hours) C.R. F.R. S.R.
38 Petroleum Today
- November 2018